Attached files
| file | filename |
|---|---|
| 8-K - 8-K - VALMONT INDUSTRIES INC | a18-2429_18k.htm |
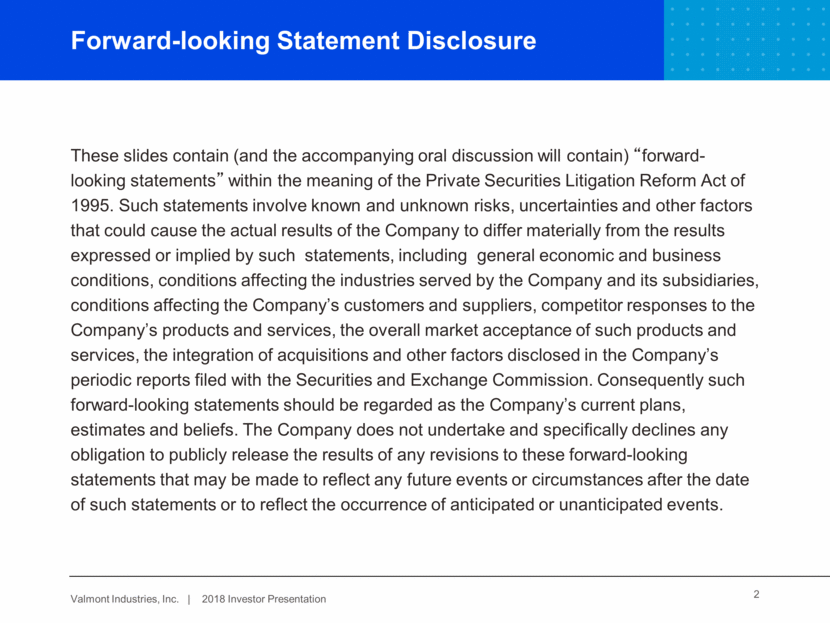
2 These slides contain (and the accompanying oral discussion will contain) “forward-looking statements” within the meaning of the Private Securities Litigation Reform Act of 1995. Such statements involve known and unknown risks, uncertainties and other factors that could cause the actual results of the Company to differ materially from the results expressed or implied by such statements, including general economic and business conditions, conditions affecting the industries served by the Company and its subsidiaries, conditions affecting the Company’s customers and suppliers, competitor responses to the Company’s products and services, the overall market acceptance of such products and services, the integration of acquisitions and other factors disclosed in the Company’s periodic reports filed with the Securities and Exchange Commission. Consequently such forward-looking statements should be regarded as the Company’s current plans, estimates and beliefs. The Company does not undertake and specifically declines any obligation to publicly release the results of any revisions to these forward-looking statements that may be made to reflect any future events or circumstances after the date of such statements or to reflect the occurrence of anticipated or unanticipated events. Forward-looking Statement Disclosure
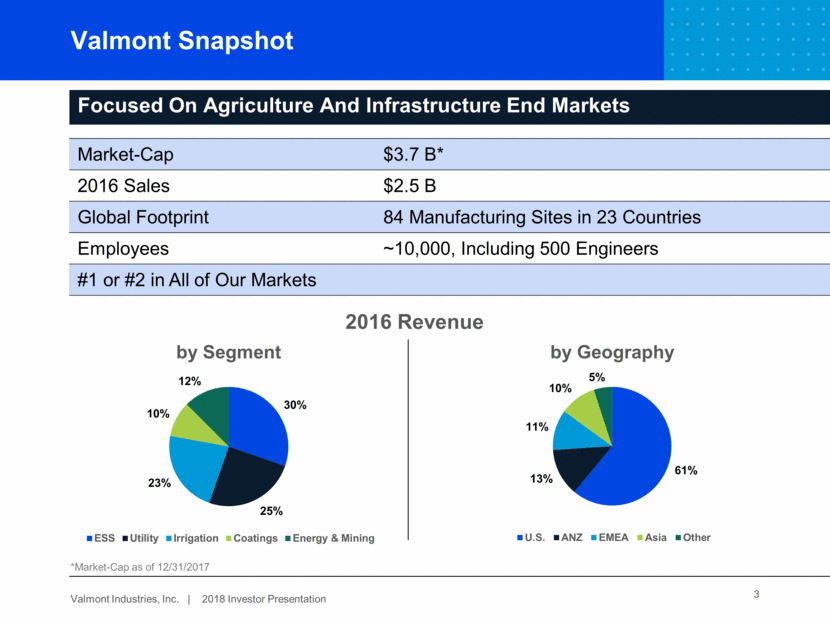
Valmont Snapshot Focused On Agriculture And Infrastructure End Markets Market-Cap $3.7 B* 2016 Sales $2.5 B Global Footprint 84 Manufacturing Sites in 23 Countries Employees ~10,000, Including 500 Engineers #1 or #2 in All of Our Markets 2016 Revenue 3 *Market-Cap as of 12/31/2017 61% 13% 11% 10% 5% by Geography U.S. ANZ EMEA Asia Other 30% 25% 23% 10% 12% by Segment ESS Utility Irrigation Coatings Energy & Mining
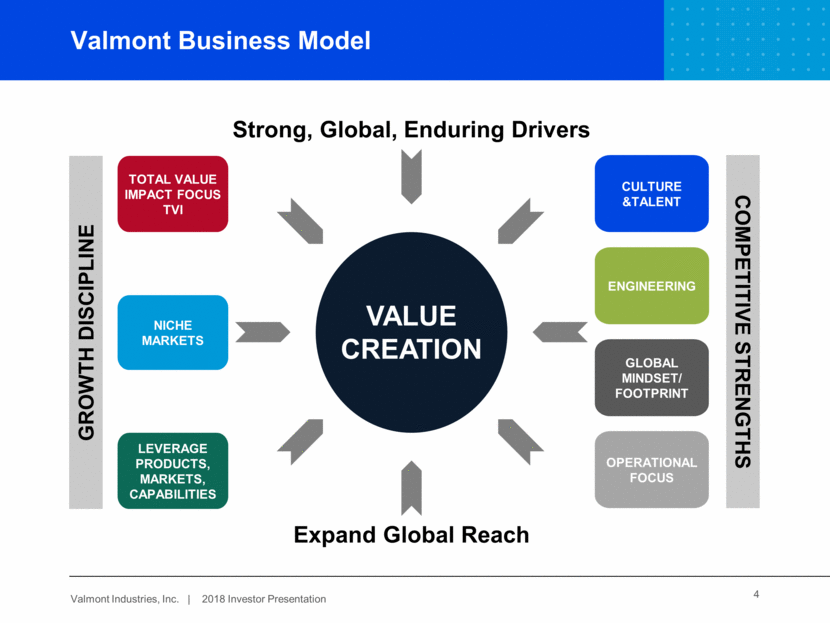
Valmont Business Model TOTAL VALUE IMPACT FOCUS TVI NICHE MARKETS LEVERAGE PRODUCTS, MARKETS, CAPABILITIES GLOBAL MINDSET/ FOOTPRINT ENGINEERING OPERATIONAL FOCUS CULTURE &TALENT GROWTH DISCIPLINE COMPETITIVE STRENGTHS Strong, Global, Enduring Drivers Expand Global Reach VALUE CREATION 4
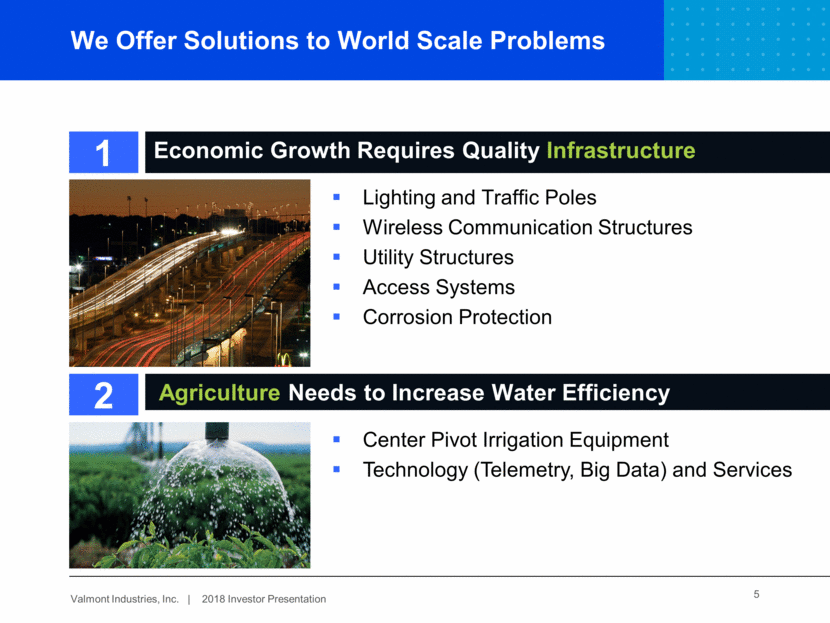
We Offer Solutions to World Scale Problems Economic Growth Requires Quality Infrastructure Center Pivot Irrigation Equipment Technology (Telemetry, Big Data) and Services Lighting and Traffic Poles Wireless Communication Structures Utility Structures Access Systems Corrosion Protection Agriculture Needs to Increase Water Efficiency 1 2 5
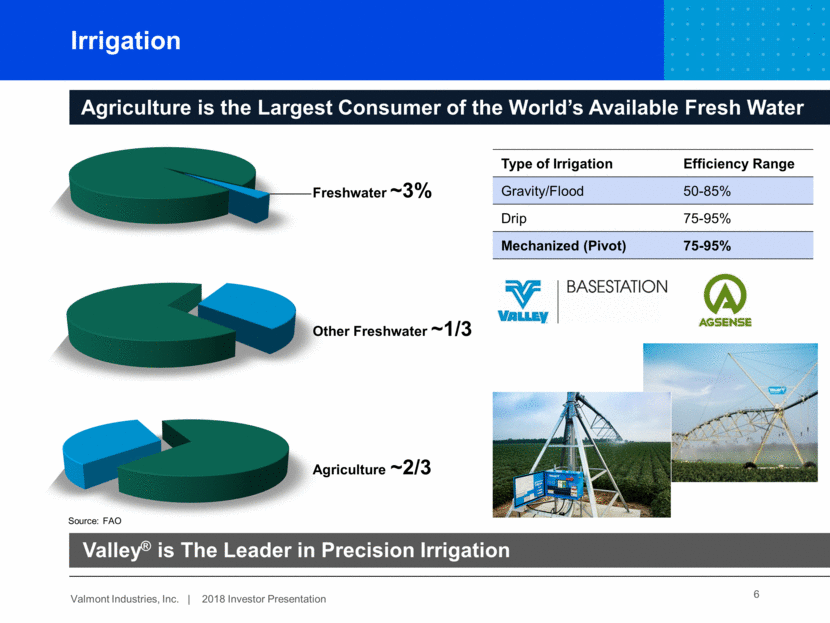
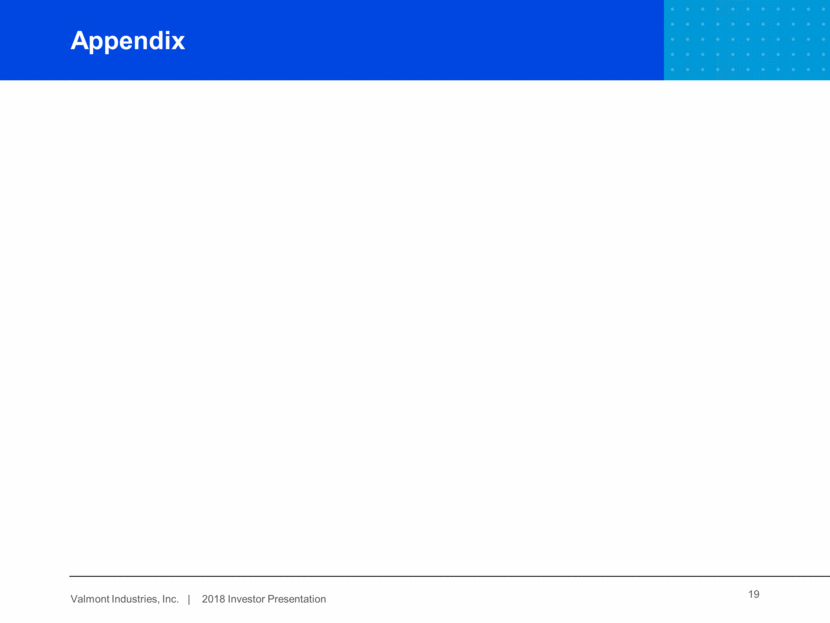
Irrigation 6 Agriculture is the Largest Consumer of the World’s Available Fresh Water Type of Irrigation Efficiency Range Gravity/Flood 50-85% Drip 75-95% Mechanized (Pivot) 75-95% Valley® is The Leader in Precision Irrigation Agriculture ~2/3 Other Freshwater ~1/3 Freshwater ~3% Source: FAO
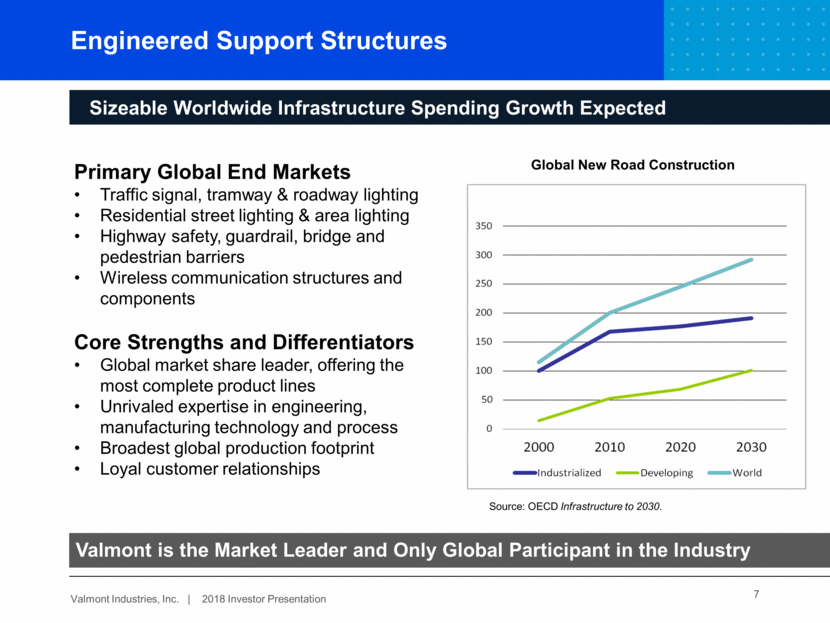
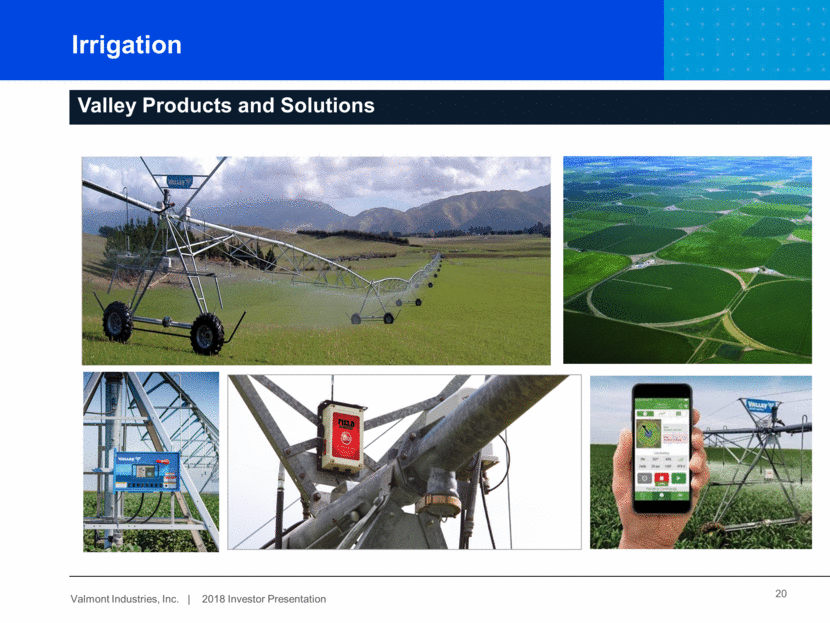
Engineered Support Structures 7 Sizeable Worldwide Infrastructure Spending Growth Expected Primary Global End Markets Traffic signal, tramway & roadway lighting Residential street lighting & area lighting Highway safety, guardrail, bridge and pedestrian barriers Wireless communication structures and components Core Strengths and Differentiators Global market share leader, offering the most complete product lines Unrivaled expertise in engineering, manufacturing technology and process Broadest global production footprint Loyal customer relationships Global New Road Construction Source: OECD Infrastructure to 2030. Valmont is the Market Leader and Only Global Participant in the Industry
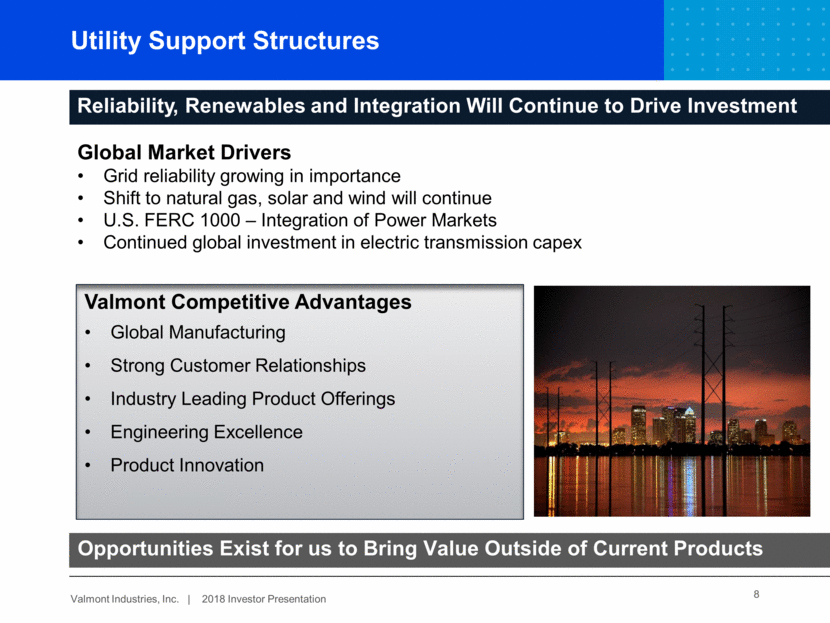
Utility Support Structures 8 Reliability, Renewables and Integration Will Continue to Drive Transmission Investment Global Market Drivers Grid reliability growing in importance Shift to natural gas, solar and wind will continue U.S. FERC 1000 – Integration of Power Markets Continued global investment in electric transmission capex Valmont Competitive Advantages Global Manufacturing Strong Customer Relationships Industry Leading Product Offerings Engineering Excellence Product Innovation Reliability, Renewables and Integration Will Continue to Drive Investment Opportunities Exist for us to Bring Value Outside of Current Products
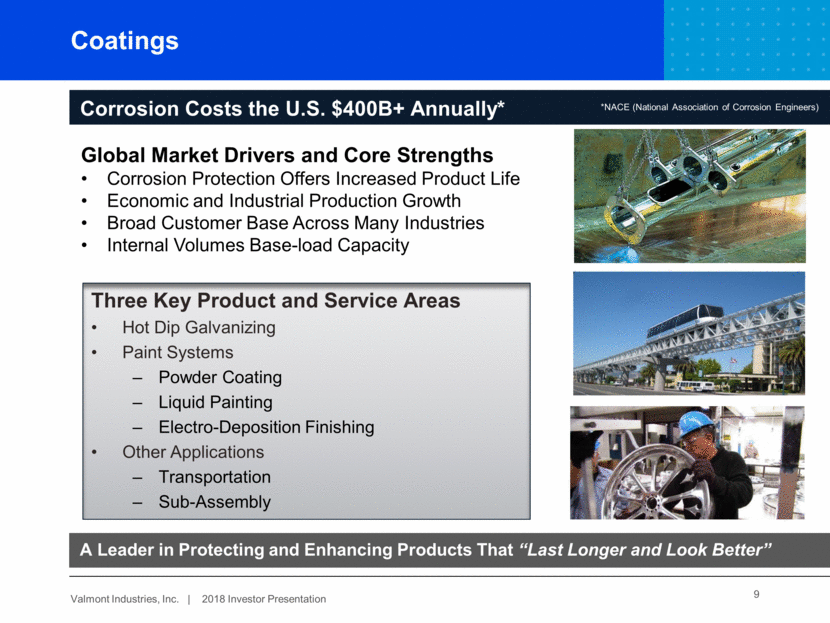
Coatings 9 Corrosion Costs the U.S. $400B+ Annually* Three Key Product and Service Areas Hot Dip Galvanizing Paint Systems Powder Coating Liquid Painting Electro-Deposition Finishing Other Applications Transportation Sub-Assembly *NACE (National Association of Corrosion Engineers) Global Market Drivers and Core Strengths Corrosion Protection Offers Increased Product Life Economic and Industrial Production Growth Broad Customer Base Across Many Industries Internal Volumes Base-load Capacity A Leader in Protecting and Enhancing Products That “Last Longer and Look Better”
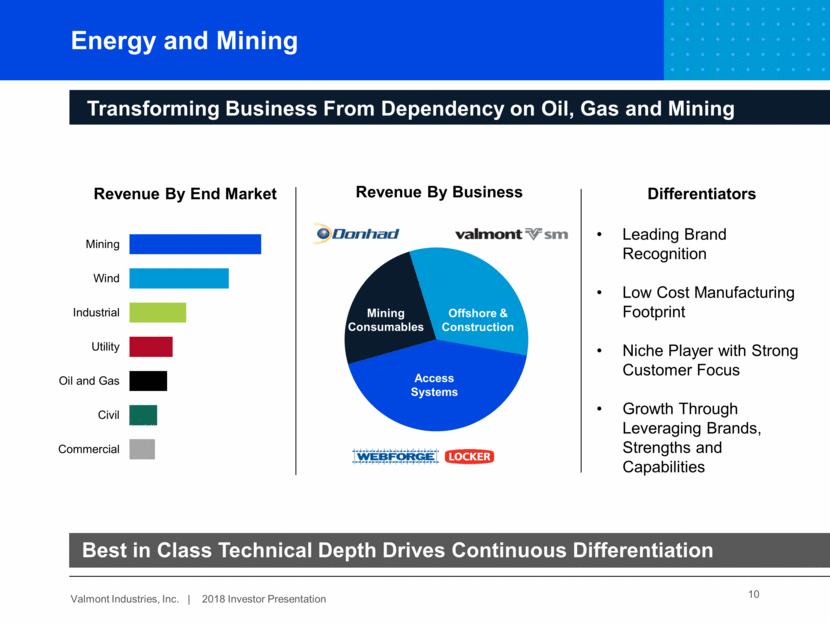
Energy and Mining 10 Revenue By End Market Transforming Business From Dependency on Oil, Gas and Mining Offshore & Construction Access Systems Mining Consumables Revenue By Business Best in Class Technical Depth Drives Continuous Differentiation Leading Brand Recognition Low Cost Manufacturing Footprint Niche Player with Strong Customer Focus Growth Through Leveraging Brands, Strengths and Capabilities Differentiators Commercial Civil Oil and Gas Utility Industrial Wind Mining
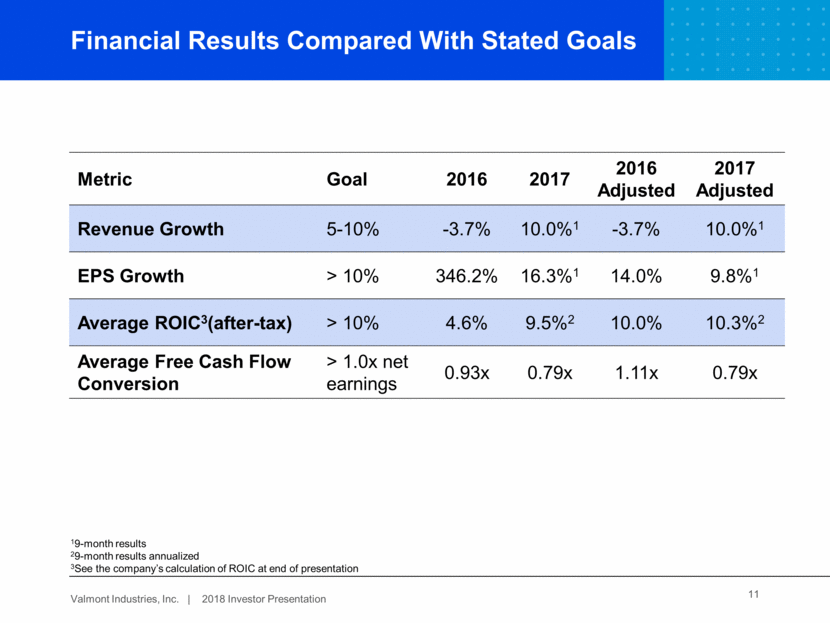
11 Financial Results Compared With Stated Goals Metric Goal 2016 2017 2016 Adjusted 2017 Adjusted Revenue Growth 5-10% -3.7% 10.0%1 -3.7% 10.0%1 EPS Growth > 10% 346.2% 16.3%1 14.0% 9.8%1 Average ROIC3(after-tax) > 10% 4.6% 9.5%2 10.0% 10.3%2 Average Free Cash Flow Conversion > 1.0x net earnings 0.93x 0.79x 1.11x 0.79x 19-month results 29-month results annualized 3See the company’s calculation of ROIC at end of presentation
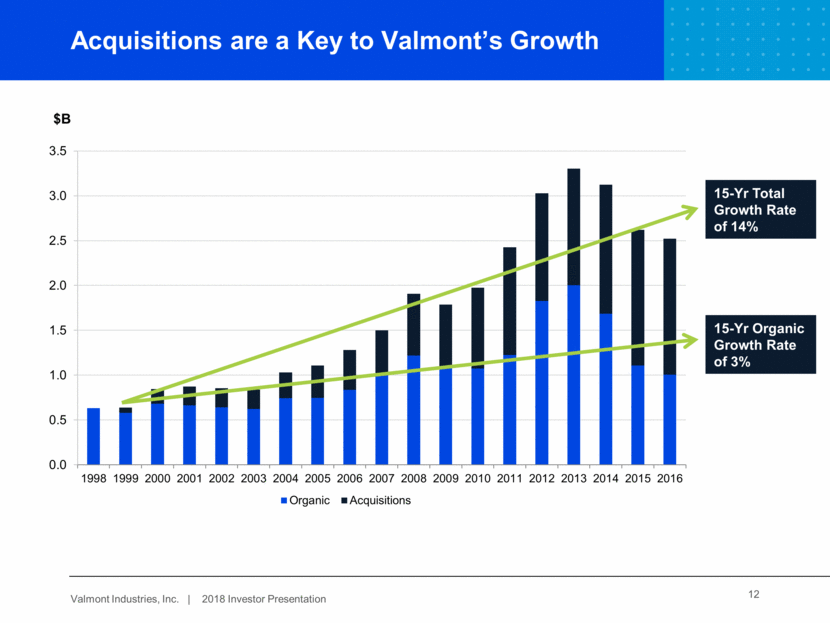
Acquisitions are a Key to Valmont’s Growth $B 15-Yr Total Growth Rate of 14% 15-Yr Organic Growth Rate of 3% 12
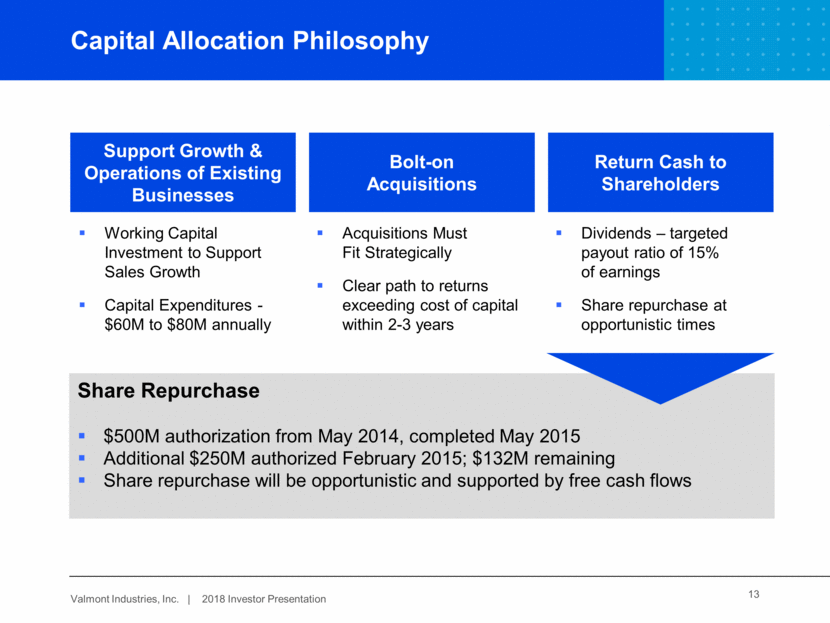
Capital Allocation Philosophy Support Growth & Operations of Existing Businesses Bolt-on Acquisitions Return Cash to Shareholders Working Capital Investment to Support Sales Growth Capital Expenditures - $60M to $80M annually Acquisitions Must Fit Strategically Clear path to returns exceeding cost of capital within 2-3 years Dividends – targeted payout ratio of 15% of earnings Share repurchase at opportunistic times Share Repurchase $500M authorization from May 2014, completed May 2015 Additional $250M authorized February 2015; $132M remaining Share repurchase will be opportunistic and supported by free cash flows 13
Liquidity Credit Rating Cash and Debt Highlights – 3Q 2017 14 Free Cash Flow $95M YTD Cash At 9/30/2017 $493M (75% Offshore) Total Debt $755M Debt/Adjusted EBITDA* 2.19 Adjusted S&P BBB+ Stable Moody’s Baa3 Stable * See the Company’s Reg G reconciliation at end of presentation. Debt Maturities – in Millions Liquidity > $1 B More Than Ample Liquidity; Debt is Mostly Long-Dated Maturities
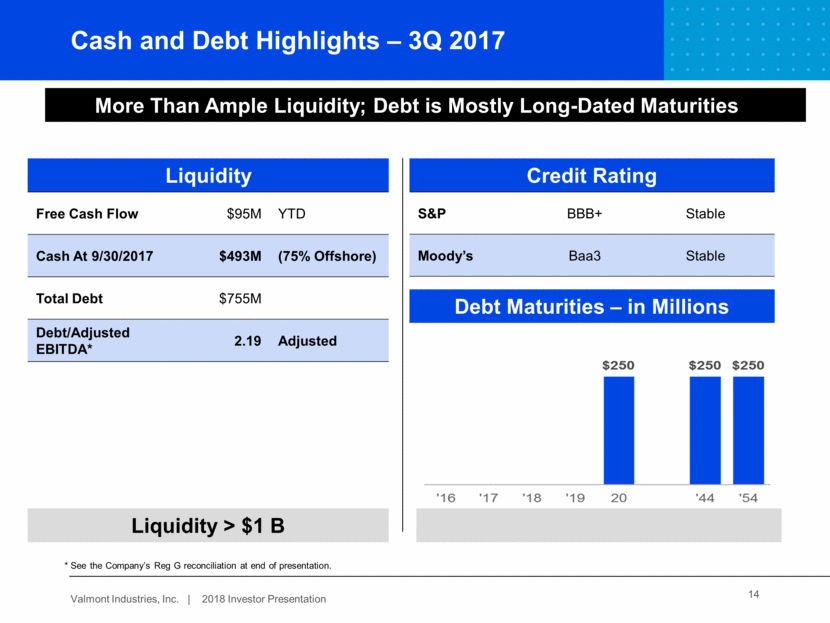
Estimated Impact of Tax Cuts and Jobs Act 15 Estimated one-time tax expense of $35-$40MM*; approximately $25MM non-cash* Remeasurement of deferred tax balances and deemed repatriation of foreign earnings Not expected to have a significant impact on 2018 cash flows Effective tax rate for 2018 and beyond expected to be approximately 25%* *Final impact of tax legislation may differ from these estimates based upon forthcoming IRS regulations and FASB guidance, potential additional SEC guidance, Valmont’s mix of U.S. and foreign earnings, and evolving interpretation of the final tax regulations. Estimates are subject to change as year-end financial statements are completed. Valmont plans to announce its financial results for the fourth quarter and year ended December 30, 2017 on February 21, 2018.
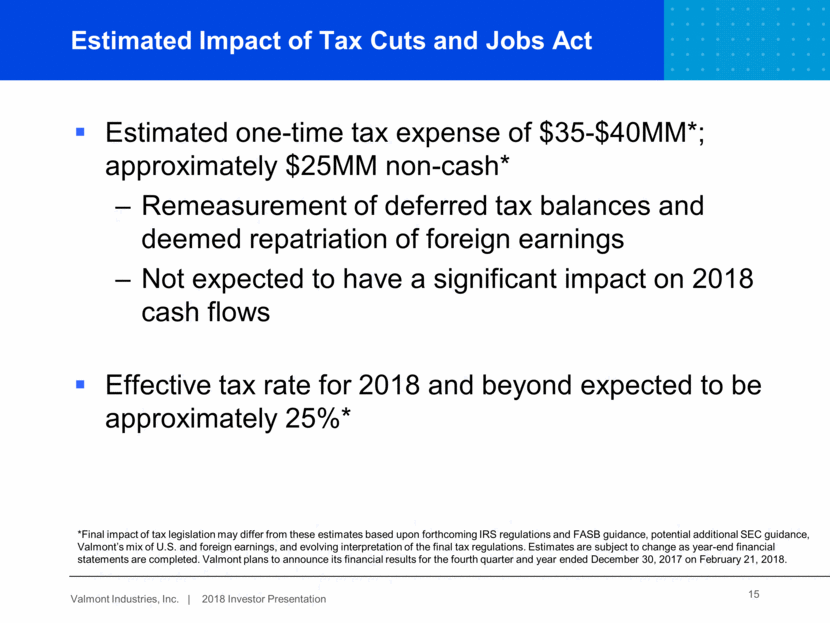
16 Opportunity Risk 2018 Opportunities and Risks Engineered Support Structures U.S. infrastructure spending plan Wireless communication product demand Steel price volatility Political debates on infrastructure spending Utility Support Structures Product & market expansion initiatives Increased emphasis on grid reliability Policy change away from renewables or regulation Coatings U.S. infrastructure spending plan Enhancing customer experience Zinc price volatility Irrational expansion by competitors Energy and Mining Product & market expansion initiatives Further contraction in oil and gas capital expenditure Stalled economic recovery in EMEA & APAC Irrigation Technology leadership and new product introductions International expansion Decline in farm income and crop prices Geopolitical events in international markets
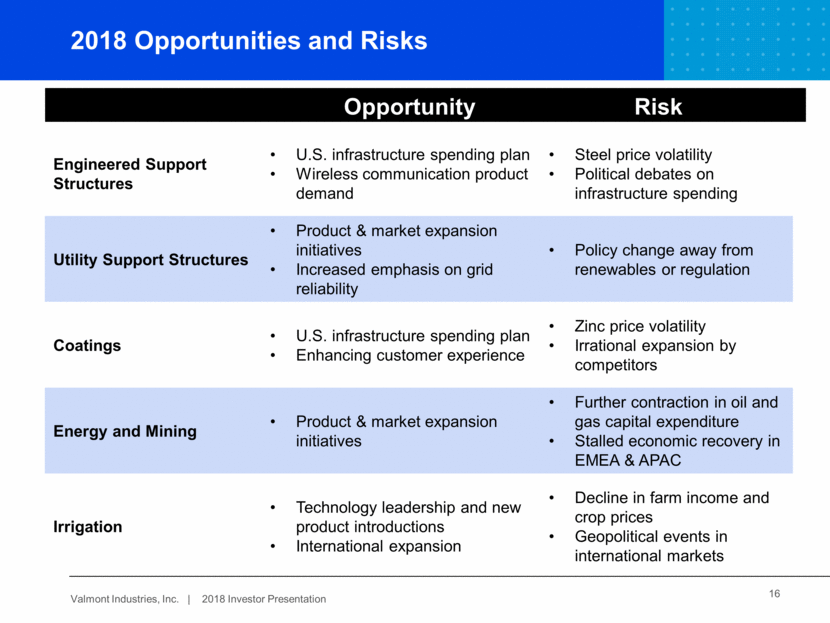
Management Aligned with Shareholders Management Ownership Officers and Directors own 3.3%* Incentive Compensation Long-term based on Return on Invested Capital and Operating Income Growth Short-term for Corporate Executives based on Net Earnings Short-term for Business Unit Management based on EBIT and Working Capital Management 17 *Reference Page 3 of Proxy Statement for April 25, 2017 Annual Shareholders’ Meeting
Summary 18 Portfolio of businesses with attractive long-term secular growth characteristics Disciplined growth strategy leveraging our products, market reach and core competencies Balance sheet strong generating good cash flow; plenty of liquidity to pursue growth and M&A
Appendix 19
Irrigation 20 Valley Products and Solutions
Engineered Support Structures Product Overview Roadway & Residential; High Mast & Sports Lighting Traffic & Mass Transit; Telecommunications Towers 21
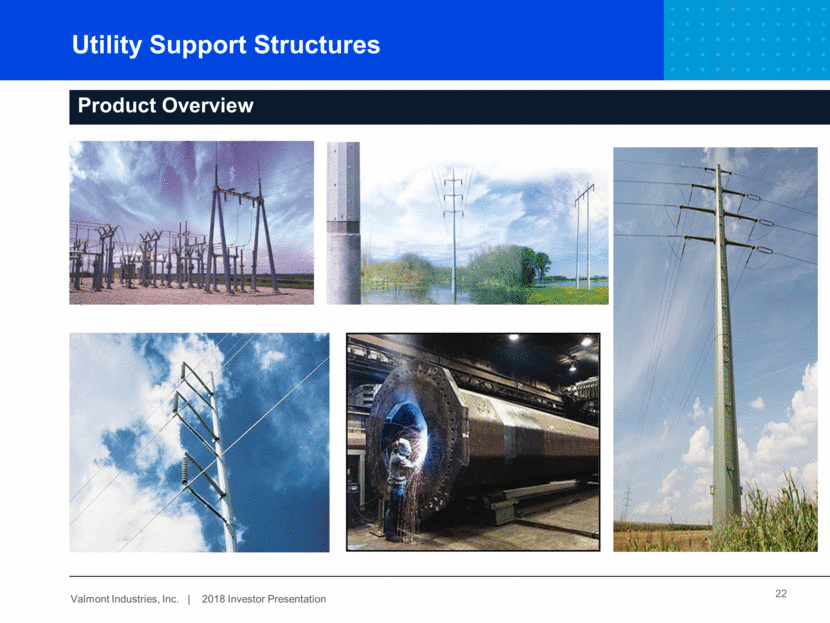
Utility Support Structures 22 Product Overview
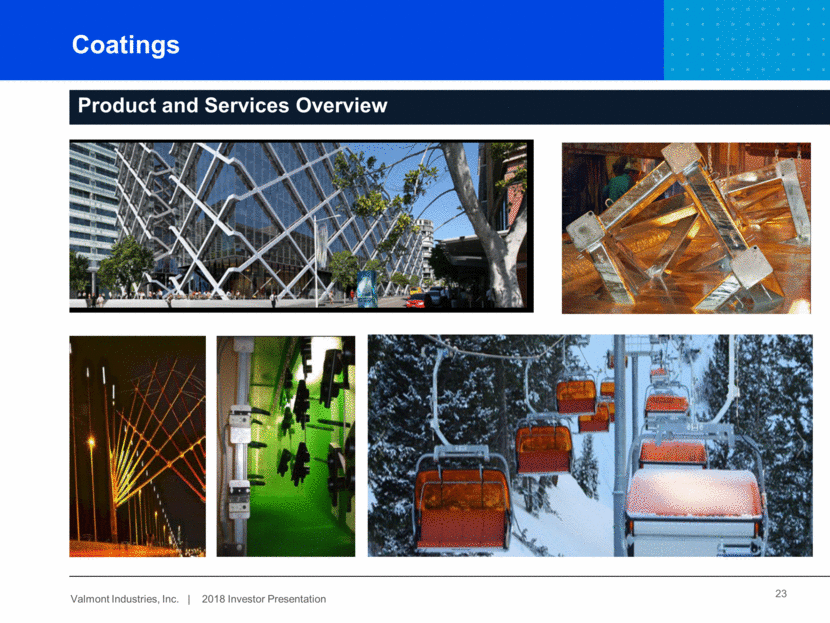
Coatings 23 Product and Services Overview
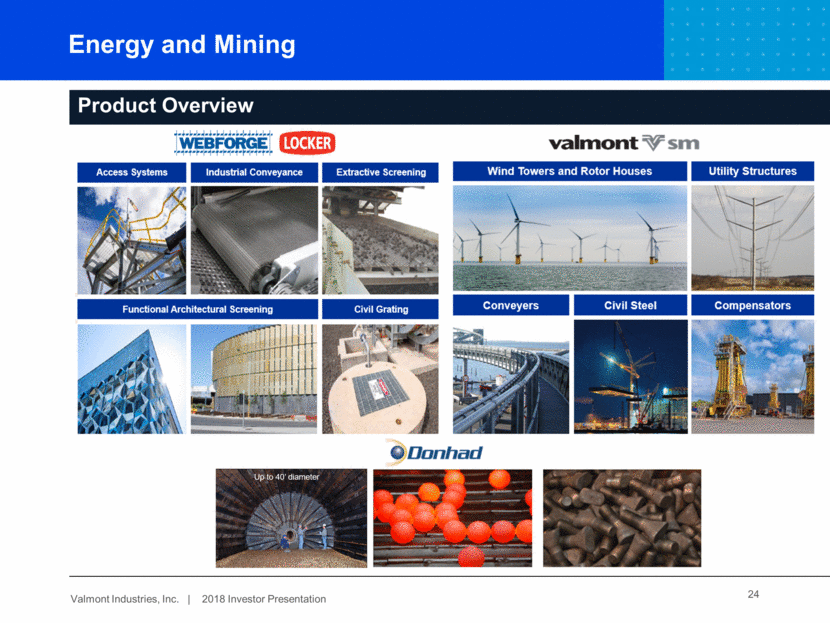
Energy and Mining Product Overview Up to 40’ diameter 24
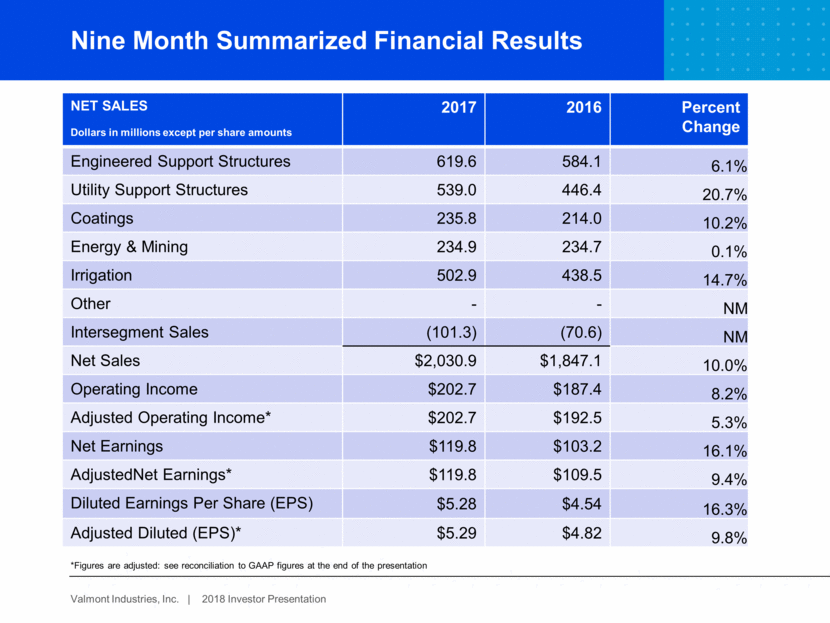
Nine Month Summarized Financial Results NET SALES Dollars in millions except per share amounts 2017 2016 Percent Change Engineered Support Structures 619.6 584.1 6.1% Utility Support Structures 539.0 446.4 20.7% Coatings 235.8 214.0 10.2% Energy & Mining 234.9 234.7 0.1% Irrigation 502.9 438.5 14.7% Other - - NM Intersegment Sales (101.3) (70.6) NM Net Sales $2,030.9 $1,847.1 10.0% Operating Income $202.7 $187.4 8.2% Adjusted Operating Income* $202.7 $192.5 5.3% Net Earnings $119.8 $103.2 16.1% AdjustedNet Earnings* $119.8 $109.5 9.4% Diluted Earnings Per Share (EPS) $5.28 $4.54 16.3% Adjusted Diluted (EPS)* $5.29 $4.82 9.8% *Figures are adjusted: see reconciliation to GAAP figures at the end of the presentation
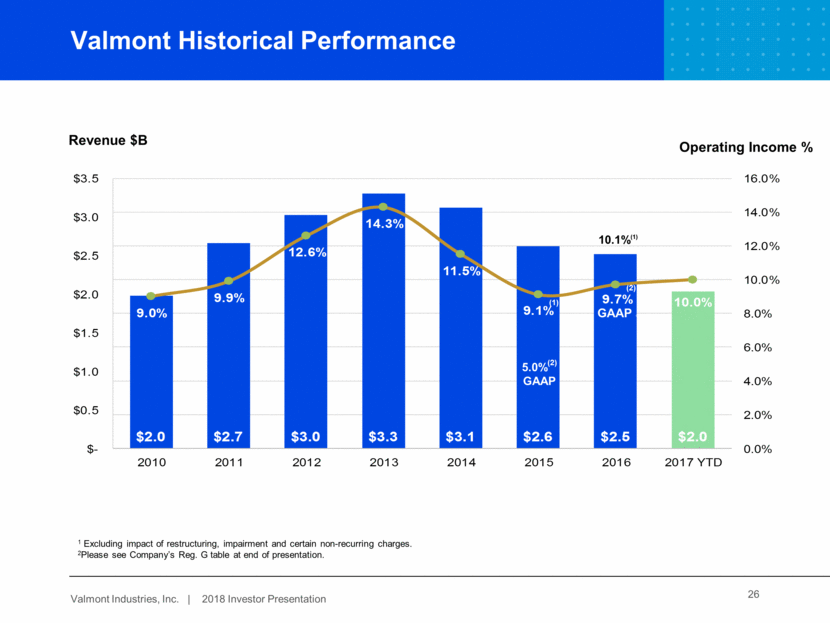
Valmont Historical Performance 26 Revenue $B 1 Excluding impact of restructuring, impairment and certain non-recurring charges. 2Please see Company’s Reg. G table at end of presentation. 5.0%(2) GAAP Operating Income % 10.1%(1) GAAP (2) (1) (2) $2.0 $2.7 $3.0 $3.3 $3.1 $2.6 $2.5 $2.0 9.0% 9.9% 12.6% 14.3% 11.5% 9.1% 9.7% 10.0% 0.0% 2.0% 4.0% 6.0% 8.0% 10.0% 12.0% 14.0% 16.0% $- $0.5 $1.0 $1.5 $2.0 $2.5 $3.0 $3.5 2010 2011 2012 2013 2014 2015 2016 2017 YTD
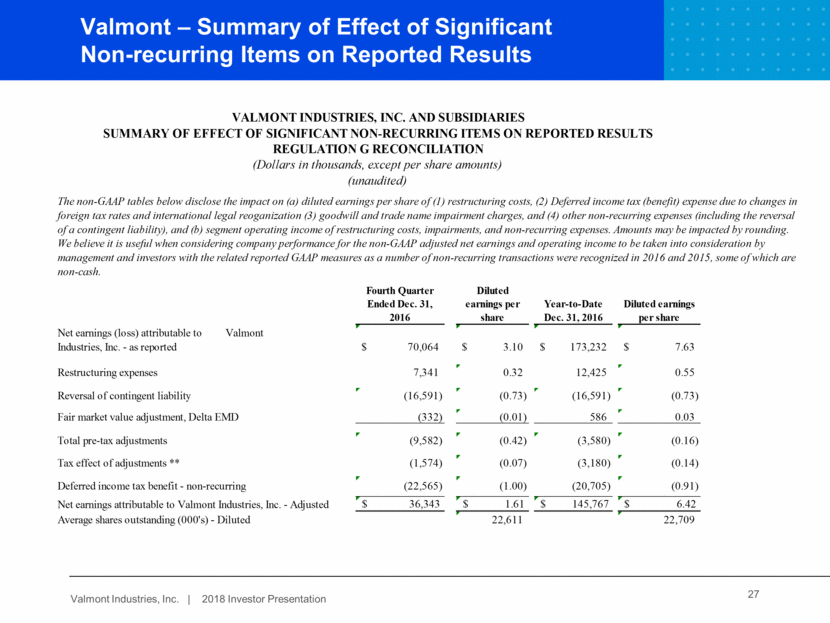
27 Valmont – Recast 2015 Segment Figures Valmont – Summary of Effect of Significant Non-recurring Items on Reported Results VALMONT INDUSTRIES, INC. AND SUBSIDIARIES SUMMARY OF EFFECT OF SIGNIFICANT NON-RECURRING ITEMS ON REPORTED RESULTS REGULATION G RECONCILIATION (Dollars in thousands, except per share amounts) (unaudited) The non-GAAP tables below disclose the impact on (a) diluted earnings per share of (1) restructuring costs, (2) Deferred income tax (benefit) expense due to changes in foreign tax rates and international legal reoganization (3) goodwill and trade name impairment charges, and (4) other non-recurring expenses (including the reversal of a contingent liability), and (b) segment operating income of restructuring costs, impairments, and non-recurring expenses. Amounts may be impacted by rounding. We believe it is useful when considering company performance for the non-GAAP adjusted net earnings and operating income to be taken into consideration by management and investors with the related reported GAAP measures as a number of non-recurring transactions were recognized in 2016 and 2015, some of which are non-cash. Fourth Quarter Ended Dec. 31, 2016 Diluted earnings per share Year-to-Date Dec. 31, 2016 Diluted earnings per share Net earnings (loss) attributable to Valmont Industries, Inc. - as reported $ 70,064 $ 3.10 $ 173,232 $ 7.63 Restructuring expenses 7,341 0.32 12,425 0.55 Reversal of contingent liability (16,591) (0.73) (16,591) (0.73) Fair market value adjustment, Delta EMD (332) (0.01) 586 0.03 Total pre-tax adjustments (9,582) (0.42) (3,580) (0.16) Tax effect of adjustments ** (1,574) (0.07) (3,180) (0.14) Deferred income tax benefit - non-recurring (22,565) (1.00) (20,705) (0.91) Net earnings attributable to Valmont Industries, Inc. - Adjusted $ 36,343 $ 1.61 $ 145,767 $ 6.42 Average shares outstanding (000's) - Diluted 22,611 22,709
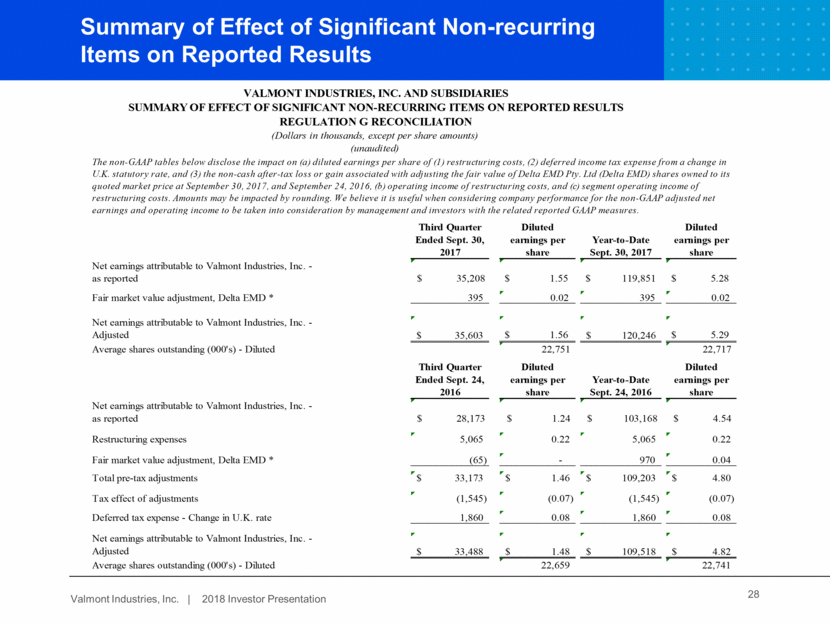
28 Summary of Effect of Significant Non-recurring Items on Reported Results VALMONT INDUSTRIES, INC. AND SUBSIDIARIES SUMMARY OF EFFECT OF SIGNIFICANT NON-RECURRING ITEMS ON REPORTED RESULTS REGULATION G RECONCILIATION (Dollars in thousands, except per share amounts) (unaudited) The non-GAAP tables below disclose the impact on (a) diluted earnings per share of (1) restructuring costs, (2) deferred income tax expense from a change in U.K. statutory rate, and (3) the non-cash after-tax loss or gain associated with adjusting the fair value of Delta EMD Pty. Ltd (Delta EMD) shares owned to its quoted market price at September 30, 2017, and September 24, 2016, (b) operating income of restructuring costs, and (c) segment operating income of restructuring costs. Amounts may be impacted by rounding. We believe it is useful when considering company performance for the non-GAAP adjusted net earnings and operating income to be taken into consideration by management and investors with the related reported GAAP measures. Third Quarter Ended Sept. 30, 2017 Diluted earnings per share Year-to-Date Sept. 30, 2017 Diluted earnings per share Net earnings attributable to Valmont Industries, Inc. - as reported $ 35,208 $ 1.55 $ 119,851 $ 5.28 Fair market value adjustment, Delta EMD * 395 0.02 395 0.02 Net earnings attributable to Valmont Industries, Inc. - Adjusted $ 35,603 $ 1.56 $ 120,246 $ 5.29 Average shares outstanding (000's) - Diluted 22,751 22,717 Third Quarter Ended Sept. 24, 2016 Diluted earnings per share Year-to-Date Sept. 24, 2016 Diluted earnings per share Net earnings attributable to Valmont Industries, Inc. - as reported $ 28,173 $ 1.24 $ 103,168 $ 4.54 Restructuring expenses 5,065 0.22 5,065 0.22 Fair market value adjustment, Delta EMD * (65) - 970 0.04 Total pre-tax adjustments $ 33,173 $ 1.46 $ 109,203 $ 4.80 Tax effect of adjustments (1,545) (0.07) (1,545) (0.07) Deferred tax expense - Change in U.K. rate 1,860 0.08 1,860 0.08 Net earnings attributable to Valmont Industries, Inc. - Adjusted $ 33,488 $ 1.48 $ 109,518 $ 4.82 Average shares outstanding (000's) - Diluted 22,659 22,741
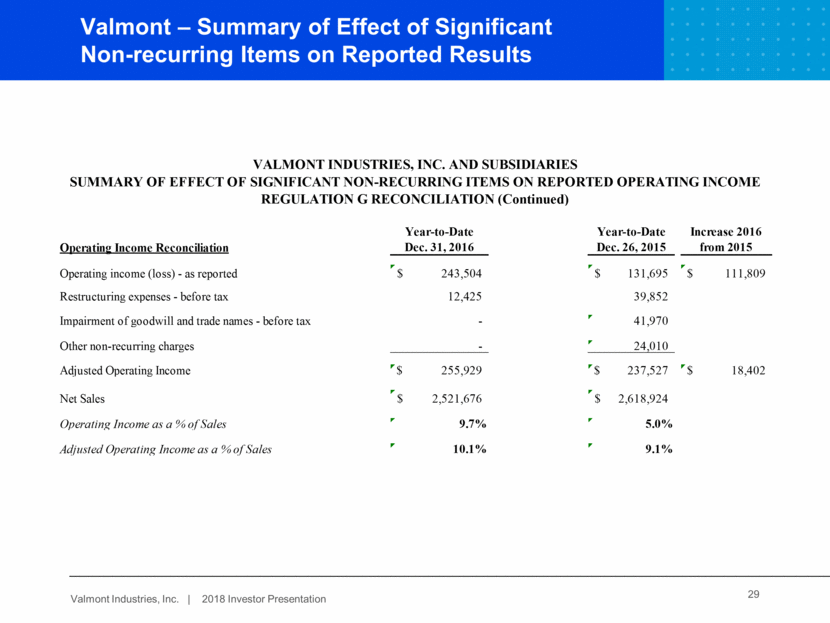
29 Valmont – Summary of Effect of Significant Non-recurring Items on Reported Results VALMONT INDUSTRIES, INC. AND SUBSIDIARIES SUMMARY OF EFFECT OF SIGNIFICANT NON-RECURRING ITEMS ON REPORTED OPERATING INCOME REGULATION G RECONCILIATION (Continued) Operating Income Reconciliation Year-to-Date Dec. 31, 2016 Year-to-Date Dec. 26, 2015 Increase 2016 from 2015 Operating income (loss) - as reported $ 243,504 $ 131,695 $ 111,809 Restructuring expenses - before tax 12,425 39,852 Impairment of goodwill and trade names - before tax - 41,970 Other non-recurring charges - 24,010 Adjusted Operating Income $ 255,929 $ 237,527 $ 18,402 Net Sales $ 2,521,676 $ 2,618,924 Operating Income as a % of Sales 9.7% 5.0% Adjusted Operating Income as a % of Sales 10.1% 9.1%
30 Summary of Effect of Significant Non-recurring Items on Reported Results VALMONT INDUSTRIES, INC. AND SUBSIDIARIES CONDENSED CONSOLIDATED STATEMENTS OF EARNINGS (Dollars in thousands, except per share amounts) (unaudited) Third Quarter Year-to-Date 13 Weeks Ended 39 Weeks Ended 30-Sep-17 24-Sep-16 30-Sep-17 24-Sep-16 Net sales $ 680,779 $ 610,247 $ 2,030,989 $ 1,847,101 Cost of sales 517,185 455,224 1,519,510 1,355,992 Gross profit 163,594 155,023 511,479 491,109 Selling, general and administrative expenses 103,671 101,783 308,764 303,698 Operating income 59,923 53,240 202,715 187,411 Other income (expense) Interest expense (11,190) (11,100) (33,312) (33,276) Interest income 1,311 771 3,205 2,290 Investment gain (loss) 544 1,455 2,935 591 Other (27) (577) (1,251) (140) (9,362) (9,451) (28,423) (30,535) Earnings before income taxes 50,561 43,789 174,292 156,876 Income tax expense 13,895 14,268 50,343 49,742 Net earnings 36,666 29,521 123,949 107,134 Less: Earnings attributable to non-controlling interests (1,458) (1,348) (4,098) (3,966) Net earnings attributable to Valmont Industries, Inc. $ 35,208 $ 28,173 $ 119,851 $ 103,168 Average shares outstanding (000's) - Basic 22,527 22,505 22,505 22,602 Earnings per share - Basic $ 1.56 $ 1.25 $ 5.33 $ 4.56 Average shares outstanding (000's) - Diluted 22,751 22,659 22,717 22,741 Earnings per share - Diluted $ 1.55 $ 1.24 $ 5.28 $ 4.54 Cash dividends per share $ 0.375 $ 0.375 $ 1.125 $ 1.125 -more- VALMONT INDUSTRIES, INC. AND SUBSIDIARIES SUMMARY OPERATING RESULTS (Dollars in thousands) (unaudited) Third Quarter Year-to-Date 13 Weeks Ended 39 Weeks Ended 30-Sep-17 24-Sep-16 30-Sep-17 24-Sep-16 Net sales Engineered Support Structures $ 221,508 $ 203,184 $ 619,647 $ 584,071 Utility Support Structures 179,760 150,667 538,994 446,432 Energy and Mining 79,755 81,552 234,934 234,693 Coatings 82,593 70,082 235,842 213,961 Infrastructure products 563,616 # 505,485 1,629,417 1,479,157 Irrigation 147,428 127,809 502,939 438,575 Less: Intersegment sales (30,265) (23,047) (101,367) (70,631) Total $ 680,779 $ 610,247 $ 2,030,989 $ 1,847,101 Operating Income Engineered Support Structures $ 16,226 $ 20,323 $ 45,683 $ 53,615 Utility Support Structures 22,108 16,195 65,005 48,201 Energy & Mining 1,417 3,941 9,195 9,096 Coatings 14,577 11,696 36,091 37,220 Infrastructure products 54,328 # 52,155 155,974 148,132 Irrigation 18,235 15,308 83,196 75,216 Adjustment to LIFO method of inventory valuation (1,626) (2,066) (2,839) (3,192) Corporate (11,014) (12,157) (33,616) (32,745) Total $ 59,923 $ 53,240 $ 202,715 $ 187,411 Valmont has aggregated its business segments into five reportable segments as follows. Engineered Support Structures: This segment consists of the manufacture of engineered metal structures and components for global lighting and traffic, wireless communication, and roadway safety. Utility Support Structures: This segment consists of the manufacture of engineered steel and concrete structures for the global utility industry. Energy and Mining: This segment includes the manufacture of access systems applications, forged steel grinding media, and offshore oil and gas and wind energy structures; Coatings: This segment consists of global galvanizing, painting and anodizing services. Irrigation: This segment consists of the manufacture of agricultural irrigation equipment and related parts and services worldwide. -more- VALMONT INDUSTRIES, INC. AND SUBSIDIARIES CONDENSED CONSOLIDATED BALANCE SHEETS (Dollars in thousands) (unaudited) 30-Sep-17 24-Sep-16 ASSETS Current assets: Cash and cash equivalents $ 493,490 $ 349,375 Accounts receivable, net 492,842 455,692 Inventories 403,234 379,625 Prepaid expenses 50,064 69,231 Refundable and deferred income taxes 8,493 20,342 Total current assets 1,448,123 1,274,265 Property, plant and equipment, net 522,424 525,640 Goodwill and other assets 639,624 584,138 $ 2,610,171 $ 2,384,043 LIABILITIES AND SHAREHOLDERS' EQUITY Current liabilities: Current installments of long-term debt $ 949 $ 895 Notes payable to banks 197 853 Accounts payable 216,104 170,888 + Accrued expenses 187,732 178,834 Dividend payable 8,478 8,455 Total current liabilities 413,460 359,925 Long-term debt, excluding current installments 754,202 755,584 Other long-term liabilities 289,914 266,233 Shareholders' equity 1,152,595 1,002,301 $ 2,610,171 $ 2,384,043 CONDENSED CONSOLIDATED STATEMENT OF CASH FLOWS (unaudited) and dollars in thousands Year to Date Year to Date 30-Sep-17 24-Sep-16 Cash flows from operating activities Net Earnings $ 123,949 $ 107,134 Depreciation and Amortization 63,500 61,242 Change in working capital (47,072) (31,596) Other (5,973) (9,526) Net cash flows from operating activities 134,404 127,254 Cash flows from investing activities Purchase of property, plant, and equipment (39,898) (42,233) Acquisitions, net of cash acquired (5,362) - Other 3,236 1,114 Net cash flows from investing activities (42,024) (41,119) Cash flows from financing activities Principal payments on long-term borrowings (658) (1,563) Purchase of treasury shares - (46,581) Dividends paid (25,385) (25,604) Other 4,072 (8,608) Net cash flows from financing activities (21,971) (82,356) Effect of exchange rates on cash and cash equivalents 23,133 (3,478) Net change in cash and cash equivalents 93,542 301 Cash and cash equivalents - beginning of year 399,948 349,074 Cash and cash equivalents - end of period $ 493,490 $ 349,375 -more- VALMONT INDUSTRIES, INC. AND SUBSIDIARIES SUMMARY OF EFFECT OF SIGNIFICANT NON-RECURRING ITEMS ON REPORTED RESULTS REGULATION G RECONCILIATION (Dollars in thousands, except per share amounts) (unaudited) The non-GAAP tables below disclose the impact on (a) diluted earnings per share of (1) restructuring costs, (2) deferred income tax expense from a change in U.K. statutory rate, and (3) the non-cash after-tax loss or gain associated with adjusting the fair value of Delta EMD Pty. Ltd (Delta EMD) shares owned to its quoted market price at September 30, 2017, and September 24, 2016, (b) operating income of restructuring costs, and (c) segment operating income of restructuring costs. Amounts may be impacted by rounding. We believe it is useful when considering company performance for the non-GAAP adjusted net earnings and operating income to be taken into consideration by management and investors with the related reported GAAP measures. Third Quarter Ended Sept. 30, 2017 Diluted earnings per share Year-to-Date Sept. 30, 2017 Diluted earnings per share Net earnings attributable to Valmont Industries, Inc. - as reported $ 35,208 $ 1.55 $ 119,851 $ 5.28 Fair market value adjustment, Delta EMD * 395 0.02 395 0.02 Net earnings attributable to Valmont Industries, Inc. - Adjusted $ 35,603 $ 1.56 $ 120,246 $ 5.29 Average shares outstanding (000's) - Diluted 22,751 22,717 Third Quarter Ended Sept. 24, 2016 Diluted earnings per share Year-to-Date Sept. 24, 2016 Diluted earnings per share Net earnings attributable to Valmont Industries, Inc. - as reported $ 28,173 $ 1.24 $ 103,168 $ 4.54 Restructuring expenses 5,065 0.22 5,065 0.22 Fair market value adjustment, Delta EMD * (65) - 970 0.04 Total pre-tax adjustments $ 33,173 $ 1.46 $ 109,203 $ 4.80 Tax effect of adjustments (1,545) (0.07) (1,545) (0.07) Deferred tax expense - Change in U.K. rate 1,860 0.08 1,860 0.08 Net earnings attributable to Valmont Industries, Inc. - Adjusted $ 33,488 $ 1.48 $ 109,518 $ 4.82 Average shares outstanding (000's) - Diluted 22,659 22,741 * The mark-to-market adjustement for Delta EMD shares is not tax deductible. Operating Income Reconciliation Third Quarter Ended Sept. 24, 2016 Year-to-Date Sept. 24, 2016 Operating income - as reported $ 53,240 $ 187,411 Restructuring expenses 5,065 5,065 Adjusted Operating Income 58,305 192,476 Net Sales 610,247 1,847,101 Operating Income as a % of Sales 8.7% 10.1% Adjusted Operating Income as a % of Sales 9.6% 10.4% END
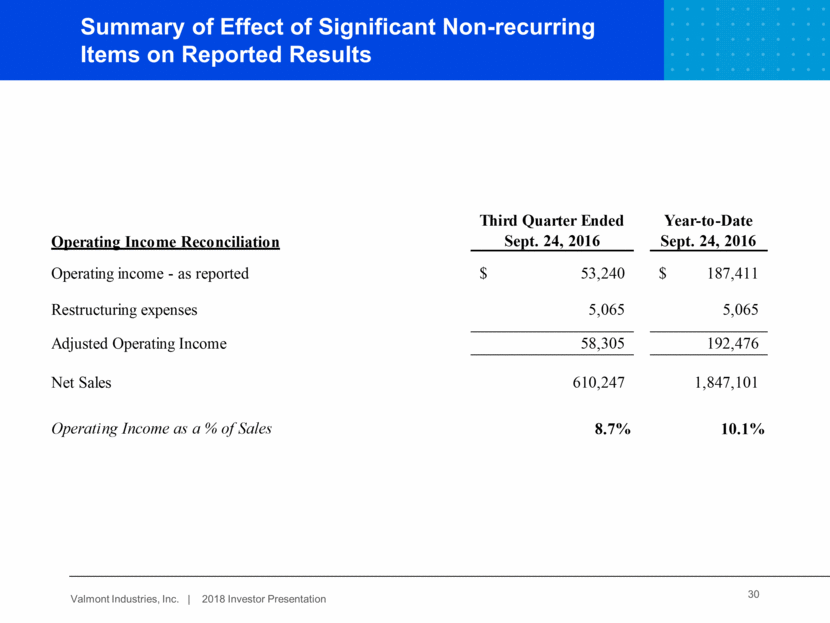
Calculation of Adjusted EBITDA & Leverage Ratio 31 Last 4 fiscal quarters (September 25, 2016 to September 30, 2017) Certain of our debt agreements contain covenants that require us to maintain certain coverage ratios. Our Debt/Adjusted EBITDA may not exceed 3.5X Adjusted EBITDA of the prior four quarters. See “Leverage Ratio “ below. TTM 1 9/30/2017 Net earnings attributable to Valmont Industries, Inc. $189,915 Interest expense 44,445 Income tax expense 42,666 Depreciation and amortization expense 84,674 EBITDA 361,700 Reversal of contingent liability (16,591) Impairment of property, plant, and equipment 481 Adjusted EBITDA $345,590 Interest Bearing Debt $ 755,348 Leverage Ratio 2.19
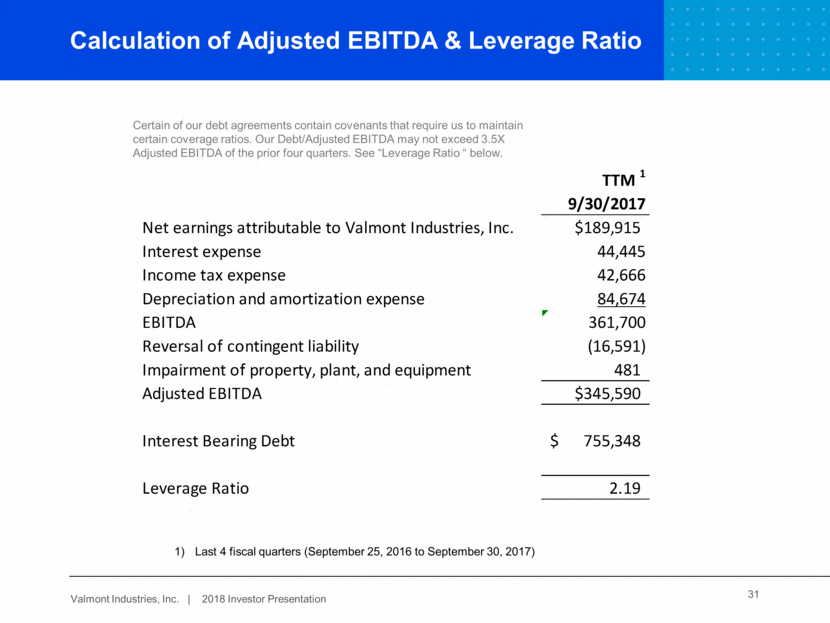
32 Calculation of Return on Invested Capital Return on Invested Capital (“ROIC”) is calculated as Operating Income (after-tax) divided by the average of beginning and ending Invested Capital. Invested Capital represents total assets minus total liabilities (excluding interest-bearing debt). Return on Invested Capital is one of our key operating ratios, as it allows investors to analyze our operating performance in light of the amount of investment required to generate our operating profit. Return on Invested Capital is also a measurement used to determine management incentives. Return on Invested Capital is a non-GAAP measure. Accordingly, Invested Capital and Return on Invested Capital should not be considered in isolation or as a substitute for net earnings, cash flows from operations or other income or cash flow data prepared in accordance with GAAP or as a measure of our operating performance or liquidity. The table below shows how Invested Capital and Return on Invested Capital are calculated from our income statement and balance sheet. Return on Invested Capital, as presented, may not be comparable to similarly titled measures of other companies.” 1. The adjusted effective tax rate in 2016 excludes deferred income tax benefit of $30,590 resulting primarily from the re-measurement of the deferred tax asset for the Company's U.K. defined benefit pension plan. In addition, fiscal 2016 excludes $9,888 recorded as a valuation allowance against a tax credit asset. Finally, it excludes the reversal of a contingent liability that was recognized as part of the Delta purchase accounting of $16,591, which is not taxable. The effective tax rate in 2016 including these items is 19.1%. 9 mo 2017 Annualized 9-mo 2017 2016 2015 Operating income $ 270,287 $ 202,715 $ 243,504 $ 131,695 Operating income (adjusted) $ 270,287 $ 202,715 $ 255,929 Adjusted effective tax rate 29.3% 28.9% 30.8% 32.0% Tax effect on operating income 79,194 58,585 74,999 42,142 After-tax operating income 191,093 144,130 168,505 89,553 After-tax operating income (adjusted) 191,093 144,130 177,103 Average invested capital 1,855,454 1,855,454 1,767,316 1,928,064 Return on invested capital 10.3% 7.8% 9.5% 4.6% Return on invested capital (adjusted) 10.3% 7.8% 10.0% Total assets $ 2,610,171 $ 2,610,171 $ 2,391,731 $ 2,392,382 Less: Accounts and income taxes payable (216,104) (216,104) (177,488) (179,983) Less: Accrued expenses (187,732) (187,732) (162,318) (175,947) Less: Defined benefit pension liability (199,562) (199,562) (209,470) (179,323) Less: Deferred compensation (48,612) (48,612) (44,319) (48,417) Less: Other noncurrent liabilities (13,557) (13,557) (14,910) (40,290) Less: Dividends payable (8,478) (8,478) (8,445) (8,571) Total Invested capital $ 1,936,126 $ 1,936,126 $ 1,774,781 $ 1,759,851 Beginning of year invested capital $ 1,774,781 $ 1,774,781 $ 1,759,851 $ 2,096,276 Average invested capital $ 1,855,454 $ 1,855,454 $ 1,767,316 $ 1,928,064 Operating cash flow $ 134,404 $ 134,404 $ 219,168 $ 272,267 Capital expenditures $ 39,898 $ 39,898 $ 57,920 $ 45,468 Free cash flow $ 94,506 $ 94,506 $ 161,248 $ 226,799 Net earnings $ 119,851 $ 119,851 $ 173,232 $ 40,117 Adjusted Net earnings $ 119,851 $ 119,851 $ 145,700 $ 131,900 Free cash flow conversion 0.79 0.79 0.93 1.72 Free cash flow conversion (adjusted) 0.79 0.79 1.11 0.30 Return on invested capital, as presented, may not be comparable to similarly titled measures of other companies
CJS INVESTOR CONFERENCE “NEW IDEAS FOR THE NEW YEAR” January 10, 2018
