Attached files
| file | filename |
|---|---|
| EX-99.2 - EXHIBIT 99.2 - UNITED COMMUNITY BANKS INC | tv482858_ex99-2.htm |
| 8-K - FORM 8-K - UNITED COMMUNITY BANKS INC | tv482858_8k.htm |
| EX-99.1 - EXHIBIT 99.1 - UNITED COMMUNITY BANKS INC | tv482858_ex99-1.htm |
| EX-2.1 - EXHIBIT 2.1 - UNITED COMMUNITY BANKS INC | tv482858_ex2-1.htm |
Exhibit 99.3

January 9, 2018 Subordinated Notes Offering

2 ucbi.com Forward Looking Statements This presentation has been prepared by United Community Banks, Inc. (“United”) solely for informational purposes based on inf orm ation regarding its operations, as well as information from public sources. This presentation has been prepared to assist interested parties in making their own evaluation of Unite d a nd does not purport to contain all of the information that may be relevant or material to an interested party’s investment decision. In all cases, interested parties should conduct their o wn investigation and analysis of United, the information set forth in this presentation, included in or incorporated by reference into the prospectus supplement, and other information provided by or on behalf of United. This presentation does not constitute an offer to sell, or a solicitation of an offer to buy, any securities of United by any pe rson in any jurisdiction in which it is unlawful for such person to make such an offering or solicitation. Neither the Securities and Exchange Commission (“SEC”) nor any other regulatory body has approved or disapproved of the securities of United or passed on the accuracy or adequacy of this presentation. Any representation to the contrary is a criminal offense. Securities of United are not deposits or insured by the Federal Deposit Insurance Corporation or any other agency. Certain Statements in this report may constitute “forward - looking statements” within the meaning of the Private Securities Litig ation Reform Act of 1995. Forward - looking statements are statements that include projections, predictions, expectations, or beliefs about future events or results or otherwise and ar e n ot statements of historical fact. Such statements are often characterized by the use of qualified words (and their derivatives) such as “may,” “believe,” “expect,” “anticipate,” “intend ,” “will,” “should,” “plan,” “estimate,” “predict,” “continue” and “potential” or the negative of these terms or words of similar meaning or other statements concerning opinions or judgments o f U nited and its management about future events. Although United believes that its expectations with respect to forward - looking statements are based upon reasonable assumptions within th e bounds of its existing knowledge of its business and operations, there can be no assurance that actual results, performance, or achievements of United will not differ materially fro m any future results, performance, or achievements expressed or implied by such forward - looking statements; such statements are not guarantees of future performance. Forward - looking stateme nts are subject to numerous assumptions, risks and uncertainties that change over time and could cause actual results or financial condition to differ materially from those exp res sed in or implied by such statements. Actual future results and trends may differ materially from historical results and or those anticipated depending on a variety of factors, including, b ut not limited to the factors and risk influences contained in the cautionary language included under the headings “Management’s Discussion and Analysis of Financial Condition and Results of O per ations” and “Risk Factors” in United’s Form 10 - K for the year ended December 31, 2016 and other periodic reports subsequently filed by United with the SEC, available on the SEC w ebs ite, www.sec.gov. In addition, we may ( i ) be unable to successfully integrate Navitas’ operations and retain its key employees, (ii) not complete the acquisition of Navitas, and (i ii) be unable to realize the expected financial impact from the acquisition of Navitas. United does not intend to or assume any obligation to update or revise any forward - looking statements th at may be made from time to time by or on behalf of United. For any forward - looking statements made in this presentation, United claims the protection of the safe harbor for forward - lookin g statements contained in the Private Securities Litigation Reform Act of 1995. This presentation also includes financial information determined by methods other than in accordance with generally accepted acc ounting principles (“GAAP”). This financial information includes certain operating performance measures, which exclude merger - related and other charges that are not considered part of recurring operations. Such measures include: “Tangible book value per share,” “ ROAA – Operating,” “ ROTCE – Operating,” and “Operating Efficiency Ratio.” Management has included these non - GAAP measures because it believes they may provide useful supplemental information for evaluating underlying performance trends. Further, management uses these measures in managing and evaluating the business and intends to refer to them in discussions about United’s operations and performance. Operating performance measures should be viewed in a ddi tion to, and not as an alternative to or substitute for, measures determined in accordance with GAAP, and are not necessarily comparable to non - GAAP measures that may be presented by ot her companies. United has filed a registration statement (including a prospectus) and a preliminary prospectus supplement with the SEC. Any off ering of securities in the future will be made only by means of the prospectus in that registration statement and a related prospectus supplement, which will be filed with the SEC. Befor e y ou invest in any potential offering, you should read the prospectus, the related prospectus supplement and other documents United has filed with the SEC for more complete information ab out United and the potential offering. When available, you may get these documents for free by visiting EDGAR on the SEC website, www.sec.gov. Alternatively, United will arrange to se nd you the prospectus and the related prospectus supplement after filing if you request it.

3 ucbi.com Issuer United Community Banks, Inc. (NASDAQ: UCBI) Security [ ]% Fixed - to - Floating Rate Subordinated Notes Terms of Proposed Offering Principal Amount $85 million Rating BBB by Kroll Bond Rating Agency Term 10 years, non - call 5 years Covenants Consistent with regulatory requirements for Tier 2 Capital Use of Proceeds Fund cash portion of merger consideration in connection with proposed acquisition of NLFC Holdings Corp. and its wholly - owned subsidiary Navitas Credit Corp. (“Navitas”) and general corporate purposes Joint Bookrunning Managers Morgan Stanley, Sandler O’Neill + Partners, L.P.

4 ucbi.com Snapshot of United Community Banks, Inc. 3Q’17 Overview Ticker UCBI (NASDAQ) Market Cap $2.1Bn P/E (2018E) 14.4x P/TBV 198% Assets $11.1Bn Loans $7.2Bn Deposits $9.1Bn CET1 12.2% NPAs (Excluding TDRs) /Assets 0.23% ROAA – Operating 1.09% ROTCE – Operating 11.35% • Established in 1950 and headquartered in Blairsville, GA with an executive office in Greenville, SC • One of the largest regional banks in the U.S. by assets with 147 branch locations in four states: GA, NC, SC and TN x Top 10 market share in GA and SC x High quality, low cost deposit base – 20 bps • Metro - focused branch network with locations in fast growing areas x Over 80% of branches located in metro areas x Top 10 market share in more than 3/4 of its MSAs • One of the top regional banks in the Atlanta MSA and 11 th largest by deposits x #1 metro area for lowest cost of doing business with 15 Fortune 500 companies headquartered there • Proven ability to integrate bank transactions – 13 transactions over the past 15 years Premier Southeast Regional Bank Market Data as of January 2, 2018 10 75 185 16 95 20 77 85 81 40 85 26 United Community Bank 147 locations 7 Loan Production Offices 4 Mortgage Loan Offices FLORIDA GEORGIA NORTH CAROLINA Knoxville Greenville SOUTH CAROLINA Charlotte Raleigh Asheville Myrtle Beach Charleston Savannah Blairsville Macon Columbia Gainesville Atlanta

5 ucbi.com Introduction to UCBI Leadership Team • Over 40 years in banking • Led company from $42 million in assets in 1989 to $10.8 billion today • Trustee of Young Harris College • Georgia Power Company Board Member • GA Economic Developers Association Spirit of Georgia Award recipient J immy C . T a ll en t Chair m a n & C EO Join ed 1984 • Over 30 years in banking • Former EVP Commercial Banking, TD Bank; CEO of The South Financial Group; and various executive positions at Regions, Union Planters, and BB&T • Numerous financial boards and committees including current Chairman of the Peace Center for the Performing A rts H . L y n n Ha rt o n Board member, President of Holding Company, CEO of the Bank Joined 2012 • Over 35 years in banking • Responsible for 30 community banks with 134 banking offices • Formerly of Riegel Textile Credit Union; President of Farmers and Merchants Bank • Former Georgia Board of Natural Resources Board Chairman Bil l M . Gil be rt P r es id e n t , C omm un i ty Ban k in g Join ed 2000 • Over 20 years experience in consumer and banking law • Responsible for legal, enterprise risk management, and compliance • Chairman of the Georgia Bankers Association Bank Counsel Section • Member of the American Bankers Association Regional General Counsels Br a d l e y J . M ill e r E V P , C RO & G e n e ra l C o un sel Join ed 2007 • Over 25 years in banking • Responsible for credit risk including credit underwriting, policy and special assets • Former EVP & Executive Credit Officer for TD Bank, NA and Chief Credit Officer of The South Financial Group R o be rt A. E d w a r ds E V P & CC O Join ed 2015 • Over 25 years in lending • Responsible commercial banking solutions • Former SBA head: TD Bank and Carolina First’s SBA programs; President of UPS Capital Business Credit • Highly decorated Commander in the U.S. Naval Reserve Intelligence Program (retired ) Ri c ha rd W . B r ad s ha w P r es id e n t, C o mm ’l B ank i ng Sol ut i ons Joined 2014 • Over 25 years in financial services • Responsible for finance and reporting, accounting, M&A and investor relations • Former Associate Director of Research for Keefe, Bruyette and Woods • Georgia State’s J. Mack Robinson College of Business Advisory Board J effe rs o n L. Ha rr a ls o n EVP & CFO Joined 2017

6 ucbi.com UCBI: Who We Are Full - Service Regional Bank with a Strong Culture Rooted in Sound Credit Underwriting and Growth Cultural Pillars Customer Service Is at Our Foundation VALUABLE FRANCHISE MIDDLE MARKET BANKING SENIOR CARE SBA LENDING ASSET BASED LENDING INCOME PROPERTY LENDING RENEWABLE ENERGY BUILDER FINANCE TREASURY MANAGEMENT MORTGAGE SERVICES BROKERAGE GROWING METRO MARKETS CLASS LEADING CORE FUNDING CONSERVATIVE CREDIT AND RISK CULTURE LOCAL CEOS 30 COMMUNITY BANKS TALENTED BANKERS The Bank That SERVICE Built. ® Quality Ź Underwriting conservatism and portfolio diversification Ź Top quartile credit quality performance Ź Prudent capital, liquidity and interest - rate risk management Ź Focused on improving return to shareholders with increasing ROTCE and dividend growth Profitability Ź Managing a steady margin with minimal accretion income Ź Fee revenue expansion through focused growth initiatives Ź Continued operating expense discipline while investing in growth opportunities Ź Executing on M&A cost savings Ź High - quality , low - cost core deposit base Growth Ź Addition of Commercial Banking Solutions platforms (income - property, asset - based, middle - market, SBA, senior care, builder finance) and actively pursuing additional lending platforms Ź Entered into and continue to target new markets with team lift - outs (Charleston, Greenville, Atlanta, Raleigh) Ź Continuous emphasis on and enhancement of Mortgage product offerings to drive loan and revenue growth Ź Acquisitions that fit our footprint and culture and deliver desired financial returns

7 ucbi.com Regional Bank with Community Bank – Level Service Recognized for Ranked #1 in Retail Banking Customer Satisfaction in the Southeast by J.D. Power Who We Are The Bank That Service Built Regional Bank 1 United Community Bank Regional Bank 2 Regional Bank 3 Regional Bank 4 Regional Bank 5 International Bank 1 Universal Bank 1 Regional Bank 6 Regional Average Regional Bank 7 Universal Bank 2 Universal Bank 3 Regional Bank 8 … Being a great place to work … H igh levels of financial performance

8 ucbi.com Closing of Four Oaks Acquisition Closed November 1, 2017 S trong community banking franchise with 14 offices located in the attractive Raleigh MSA , North Carolina’s fastest growing market Adds more than $500MM of loans and approximately $600MM of deposits Acquisition of Navitas Announced January 8, 2018 Acquisition of high - performing, scalable equipment finance platform with national reach and exceptional origination capabilities Strategically and financially compelling combination Recent Developments Deferred Tax Asset Revaluation New corporate tax rate estimated to reduce DTA by $37 - $41MM Revaluation expected to impact 4Q’17 financials Expected to reduce tangible book value per share by 47 - 52 cents One - time reduction in EPS by 48 - 53 cents UCBI effective tax rate expected to be reduced from 37%, improving go - forward earnings

Navitas Transaction Overview

10 ucbi.com Overview of Navitas Net Loans and Leases Notes 1. As of September 30, 2017 2. Originations for the last twelve months ended September 30, 2017 Key Industries Portfolio Statistics (1) Net Investment Loans & Leases ($MM) $349 Total Managed Portfolio ($MM) $415 Average Equipment Cost $36,410 Weighted Average Term (Months) 49 Weighted Average FICO 734 No. of Contracts 17,000+ No. of Customers ~14,500 Founded in September 2008, Navitas is a nationwide equipment finance lender based in Ponte Vedra , FL — 124 employees as of September 30, 2017 Offers customized debt financing products for small and medium businesses (“SMBs”) Scalable platform designed to efficiently originate, underwrite and manage large volumes of low balance accounts for SMBs Strong origination channels (direct and indirect) diversified across geographies, industries and equipment types Led by senior management team with average experience of 25+ years in the financial services industry Business Overview $18 $55 $110 $157 $221 $284 $349 2011 2012 2013 2014 2015 2016 9/30/2017 ($MM) 2011 – 9/30/2017 CAGR: 67% $1Bn Loans & Leases Funded (1) Annual Originations : $310 Million (2) Net Loans & Leases: $349 Million (1) Nationwide Presence

11 ucbi.com Aggregate Transaction Value Approximately $130 million Consideration 35% stock / 65% cash Stock exchange ratio based on the average 10 - day trading price of UCBI stock at close Expected Closing Targeting First Quarter 2018 Ownership Issuance of approximately 1.6 million shares (~2% pro forma ownership ) based on UCBI stock price of $28.22 (for illustrative purposes) (1) Navitas Transaction Overview Expected Financial Impact (2) Accretive to EPS by approximately $0.20 in the first full year of operations Internal rate of return >30% Expected to lever UCBI’s Common Equity Tier 1 Ratio by approximately 110 bps Improves ROTCE by ~200 bps Structure Separate subsidiary of the bank operating as a stand - alone brand Notes 1. Reflects UCBI’s 10 - day average stock price as of January 5, 2018 2. "Expected Financial Impact" discloses forward - looking statements that are subject to numerous assumptions, risks and uncertainties that change over time and could cause actual results or financial condition to differ materially from those expressed in or implied by such statements

12 ucbi.com Navitas Will Be an Important Piece of Our Growth Story Significantly Enhances Commercial Lending Platform Acquisition of high - performing, scalable equipment finance platform with national reach and exceptional origination capabilities Long tenured management team with proven track record of delivering growth and outsized performance x Senior management averages over 25 years of equipment finance experience Enhances position in attractive specialty lending business – increases specialty commercial finance portfolio to approximately $1.7Bn (1) Complementary suite of both specialty commercial and equipment finance loans Strong Strategic Fit Growing the commercial and specialty lending business has been a key component of our strategic plan Opportunity to replace Navitas’ current funding with UCBI’s low - cost funding base; represents significant cost savings Consistent with strategy to diversify into commercial lending – C&I loans (incl. owner - occupied CRE ) will be 43% of pro forma loans (1) compared to 23% pre crisis Complements current SBA business by adding new product offerings tailored to small to medium sized businesses Opportunity to market Navitas within our extensive existing commercial relationships developed across our Community Bank Strong presence in Georgia and South Carolina complimentary to UCBI’s existing branch footprint Experienced Acquirer With Successful Track Record Extensive due diligence process Excellent credit culture and asset quality metrics Proven ability to integrate bank transactions – 13 transactions over the past 15 years, five since 2014 Will retain Navitas management team, led by Gary Shivers, to continue to drive growth Notes 1. Based on loan balances as of September 30, 2017 Accretive to Earnings and Leverages Excess Liquidity

Financial Highlights

14 ucbi.com Focused on Increasing Profitability 18 15 20 20 20 22 22 22 20 24 25 24 21 22 19 Fee Income / Revenue 2 3.21 3.21 3.32 3.31 3.31 3.30 3.26 3.34 3.41 3.35 3.34 3.34 3.45 3.47 3.54 Net Interest Margin 1 59 59 58 57 59 58 58 59 59 58 58 57 57 56 56 Operating Efficiency Ratio 3 0.85 0.88 0.95 0.96 0.94 1.00 1.00 0.99 1.00 1.07 1.08 1.10 1.07 1.10 1.09 Operating ROAA (%) (%) (%) (%) Source Company Materials

15 ucbi.com Measured, Organic Balance Sheet Growth Supplemented by Acquisitions Loans Over Time 3Q’17 Loan Composition by Product Deposits Over Time 3 Q’17 Deposit Composition 4.6 4.7 4.8 5.2 6.0 6.0 6.1 6.3 6.7 6.9 7.0 7.0 7.2 6.2 6.3 6.4 6.8 7.9 7.9 8.0 7.9 8.4 8.6 8.8 8.7 9.1 15% 19% 25% 3% 8% 23% 7% Commercial Banking Solutions: 20% of Total Loans Yield on Loans: 4.46% C&I Residential Construction CRE Income Producing Residential Mortgage CRE Owner - Occupied Commercial Construction Installment 32% 42% 15% 11% Cost of Deposits: 0.20% Interest Bearing Time Non - Interest Bearing Public ($ Bn ) ($ Bn ) Source Company Materials

16 ucbi.com 18 21 19 19 14 13 12 12 11 12 12 14 14 17 20 24 25 25 25 23 24 24 24 26 26 26 26 27 31 35 0 10 20 30 40 Deposits …Supported by Large Non - Interest Bearing Deposit Base Low - Cost Deposit Base (1) … 32% 29% Cost of Total Deposits (bps) Non - Interest Bearing Deposits / Deposits (3) 3Q15 - 2Q16 deposit beta equal to 6%, less than half the 15% industry average (2) KRX Peer KRX Peer Notes 1. Peer comparison banks comprise the KBW Regional Bank Index ( ticker:KRX ) 2. Raymond James report September 28, 2017 3. As of September 30, 2017 Source SNL Financial

17 ucbi.com Disciplined Credit Processes Structure • Centralized underwriting and approval process for consumer credit • Distributed Regional Credit Officers (reporting to Credit) for commercial • Dedicated Special Assets team • Eight of the top twelve credit leaders recruited post - crisis • Weekly Senior Credit Committee • Continuous external loan review • Monthly commercial asset quality review • Monthly retail asset quality review meetings Process • Continuous review and enhancements to credit policy • Quarterly reviews of portfolio limits and concentrations Policy x Granular Portfolio – Exposure and Industry Limits House Lending Limit Project Lending Limit Legal Lending Limit Top 25 Relationships $ 274M 28M 17M 575M Concentration limits set for all segments of the portfolio Source Company Materials
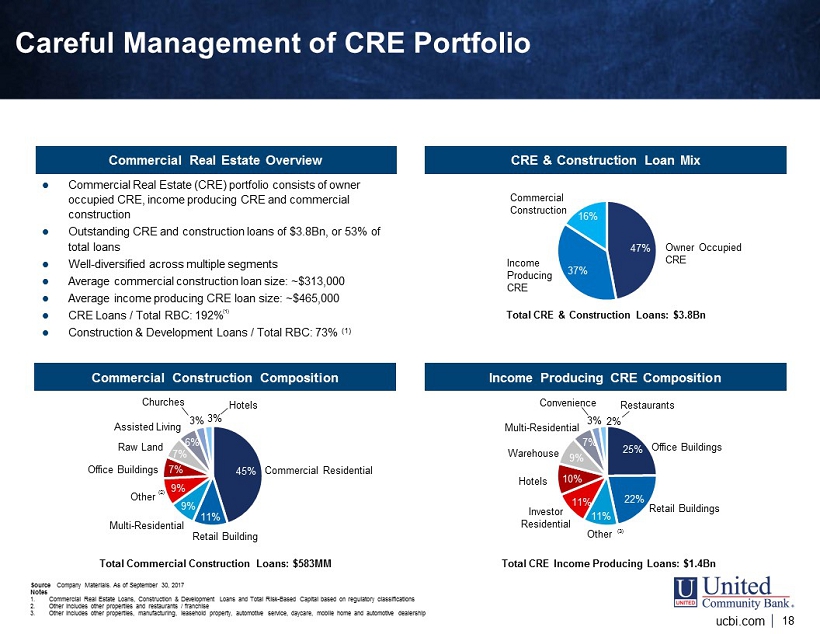
18 ucbi.com Careful Management of CRE Portfolio CRE & Construction Loan Mix 47% 37% 16% Commercial Construction Owner Occupied CRE Income Producing CRE 45% 11% 9% 9% 7% 7% 6% 3% 3% Total Commercial Construction Loans: $583MM Commercial Residential 25% 22% 11% 11% 10% 9% 7% 3% 2% Total CRE Income Producing Loans: $1.4Bn Income Producing CRE Composition Commercial Construction Composition Total CRE & Construction Loans: $3.8Bn Commercial Real Estate Overview Commercial Real Estate ( CRE ) portfolio consists of owner occupied CRE , income producing CRE and commercial construction Outstanding CRE and construction loans of $3.8Bn, or 53% of total loans Well - diversified across multiple segments Average commercial construction loan size: ~$313,000 Average income producing CRE loan size: ~$465,000 CRE Loans / Total RBC: 192% Construction & Development Loans / Total RBC: 73% (1) Notes 1. Commercial Real Estate Loans, Construction & Development Loans and Total Risk - Based Capital based on regulatory classifications 2. Other includes other properties and restaurants / franchise 3. Other includes other properties, manufacturing, leasehold property, automotive service, daycare, mobile home and automotive d eal ership Retail Building Multi - Residential Other Office Buildings Raw Land Assisted Living Hotels Churches (2) Office Buildings Retail Buildings Investor Residential Warehouse Multi - Residential Restaurants Convenience Hotels Other (3) Source Company Materials. As of September 30, 2017 (1)

19 ucbi.com Strong Credit Quality 0.42 0.32 0.29 0.26 0.26 0.26 0.29 0.29 0.28 0.28 0.30 0.28 0.23 0.24 0.23 NPAs (Excluding TDRs) / Assets (%) 14.0 13.6 12.9 12.5 12.3 12.4 12.1 11.9 10.5 10.3 10.2 9.9 8.9 8.7 7.8 NPAs & Loans 90 Days+ / TCE & LLR (%) 0.37 0.38 0.28 0.22 0.22 0.08 0.10 0.09 0.14 0.11 0.08 0.09 0.10 0.09 0.09 NCOs / Avg. Loans (%) 2.6 2.3 2.2 1.9 1.8 1.6 1.4 1.3 1.2 1.2 1.1 1.1 1.0 0.9 0.9 Classified Loans / Total Assets (%) Source SNL Financial

20 ucbi.com NPA Levels Well Below Peer Median 0.23 0.0% 0.5% 1.0% 1.5% 2.0% CBSH BOH WABC BPFH PB CVBF OZRK CBU VLY UCBI UMBF UMPQ FFIN MBFI EWBC PNFP WAL WTFC BXS STBA PFS SNV COLB WAFD FNB FHN CFR STL TCBI ISBC FMBI CATY FCF WBS IBKC BRKL GBCI BKU TCF FULT ASB PACW BOKF TRMK ONB SBNY UBSI HBHC BPOP » Eight of the top twelve credit leaders recruited post - crisis » Centralization of special assets » Centralization of consumer loan underwriting and approval » Changed commercial approval process, including a Senior Credit Committee for visibility and culture building » Instituted highly - disciplined concentration management process » Dedicated credit officers for all specialty businesses and community markets Median: 0.47% 3 Q17 NPAs / Assets (1) Notes 1. Peer comparison banks comprise the KBW Regional Bank Index ( ticker:KRX ) Source SNL Financial
Capital and Liquidity

22 ucbi.com Holding Company (1) 3Q16 2Q17 3Q17 Common Equity Tier 1 Ratio 11.0 11.9 12.2 Leverage Ratio 8.4 9.0 9.3 Tier 1 Capital Ratio 11.0 11.9 12.3 Total Capital Ratio 11.9 12.7 13.0 Bank Subsidiary (1) 3Q16 2Q17 3Q17 Common Equity Tier 1 Ratio 12.4 12.8 12.7 Leverage Ratio 9.4 9.7 9.6 Tier 1 Capital Ratio 12.4 12.8 12.7 Total Capital Ratio 13.3 13.6 13.4 Capital Ratios Notes 1. The table above sets forth the Company’s capital ratios as of September 30, 2017 and does not give effect to the ( i ) consideration paid in cash and shares of common stock, and subordinated debt and trust preferred securities assumed in connection with the Company’s acquisition of Four Oaks on November 1, 2017, (ii) maturity and repayment of our 9.00% Senior Notes due 2017 on October 15, 2017, (iii) issuance of common stock in connection with the proposed merger, and (iv) sale of the subordinated notes to which this presentation relates. Additionally, the table does not contemplate the revaluation of the Company’s net deferred tax asset. Source SNL Financial
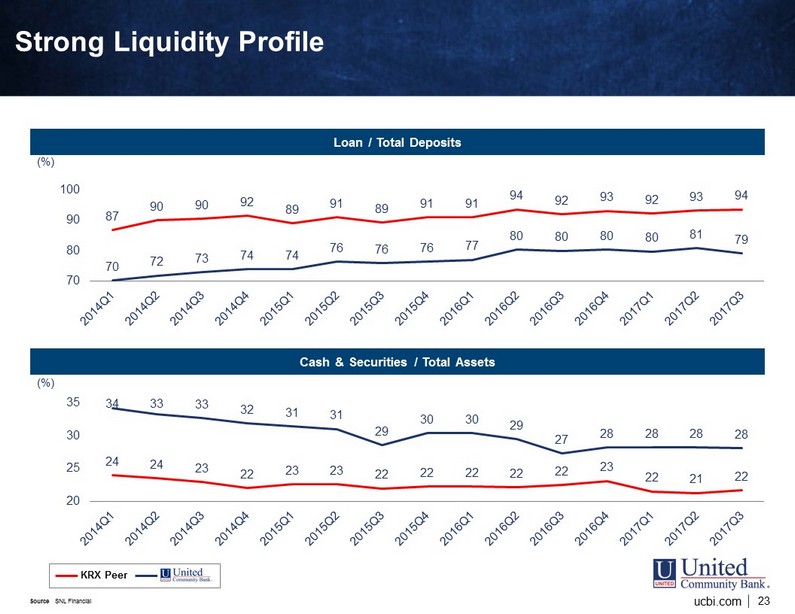
23 ucbi.com 70 72 73 74 74 76 76 76 77 80 80 80 80 81 79 87 90 90 92 89 91 89 91 91 94 92 93 92 93 94 70 80 90 100 Strong Liquidity Profile (%) Loan / Total Deposits 34 33 33 32 31 31 29 30 30 29 27 28 28 28 28 24 24 23 22 23 23 22 22 22 22 22 23 22 21 22 20 25 30 35 (%) Cash & Securities / Total Assets KRX Peer Source SNL Financial

24 ucbi.com Investment Portfolio Overview (1) ($000) Book Value Gain / Loss Fair Value AFS Portfolio Composition U.S. Treasuries $74,434 $330 $74,764 U.S. Government Agencies 27,276 452 27,728 Municipals 171,372 1,017 172,389 Corporate Bonds 305,559 2,812 308,371 MBS (Agencies) 1,644,741 3,955 1,648,696 Asset - Backed 306,127 2,338 308,465 Other 57 0 57 Total AFS $2,529,566 $10,904 $2,540,470 Total HTM $306,741 $3,705 $310,446 Total Securities $2,836,307 $14,609 $2,850,916 65% 12% 12% 7% 3% 1% 0% MBS (Agencies) Asset - Backed Other U.S. Treasuries Securities Portfolio Detail Weighted average duration 3.14 Years Current yield (Tax Equivalent) 2.64% No obligations of any issuer in excess of 10% of equity at year - end 2016 (excluding U.S. Government Sponsored Entities) Securities portfolio as a percentage of total assets as of September 30, 2017 ~26% Municipals Corporate Bonds U.S. Government Notes 1. As of September 30, 2017 AFS Securities Portfolio Composition
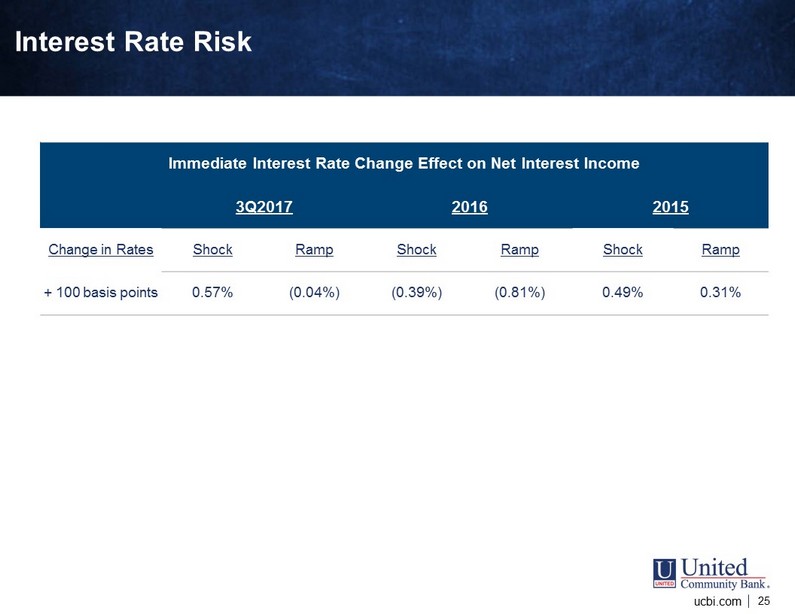
25 ucbi.com Interest Rate Risk Immediate Interest Rate Change Effect on Net Interest Income 3Q2017 2016 2015 Change in Rates Shock Ramp Shock Ramp Shock Ramp + 100 basis points 0.57% (0.04%) (0.39%) (0.81%) 0.49% 0.31%

26 ucbi.com Double Leverage and Interest Coverage For the 3 Months Ended 2Q2016 3Q2016 4Q2016 1Q2017 2Q2017 3Q2017 Equity Investment in Subsidiaries $1,145,627 $1,199,584 $1,201,868 $1,181,867 $1,219,683 $1,266,180 Consolidated Equity 1,059,737 1,079,293 1,075,736 1,101,544 1,132,642 1,220,642 Double Leverage Ratio 108.1% 111.1% 111.7% 107.3% 107.7% 103.7% Proposed Downstream of Subordinated Debt Offering 0 Pro Forma Bank - Level Equity (1) $1,266,180 Pro Forma Double Leverage Ratio (1) 103.7% Interest Coverage For the 3 Months Ended 2Q2016 3Q2016 4Q2016 1Q2017 2Q2017 3Q2017 Total Deposit Interest $2,423 $2,509 $2,960 $3,058 $3,601 $4,557 Other Borrowing Interest 3,741 3,941 3,893 4,346 4,417 4,507 Total Interest Expense 6,164 6,450 6,853 7,404 8,018 9,064 Pre - Tax Income 40,655 41,627 44,837 42,002 44,804 43,674 Interest Coverage (including deposit expense) 6.60x 6.45x 6.54x 5.67x 5.59x 4.82x Interest Coverage (excluding deposit expense) 10.87x 10.56x 11.52x 9.66x 10.14x 9.69x Interest Coverage (including deposit expense; including subordinated debt offering) (2) 4.31x Interest Coverage (excluding deposit expense; including subordinated debt offering) (2) 7.84x ($000) Notes 1. Pro forma double leverage assumes $85MM subordinated debt raise and no funds downstreamed to bank subsidiary; for illustrative purposes only (excludes the Navitas purchase) 2. Assumes $85MM subordinated debt raise at 5%, pro forma interest expense for a quarter

27 ucbi.com Conclusion x One of the Southeast's largest full - service banks, operating 147 offices in Georgia, North Carolina, South Carolina and Tennessee x Culture rooted in excellent customer service, sound credit underwriting and prudent growth x Navitas represents a strategically and financially compelling transaction that enhances UCBI’s position within attractive specialty lending business x Strong track record of growing earnings and improving profitability x High - quality balance sheet and strong capital base x Experienced management team