Attached files
| file | filename |
|---|---|
| 8-K - 8-K - DEXCOM INC | d521214d8k.htm |
Dexcom Transforming Diabetes Care January 2018 JP Morgan Healthcare Conference Exhibit 99.01
This presentation contains forward-looking statements that are not purely historical regarding DexCom’s or its management’s intentions, beliefs, expectations and strategies for the future. All forward-looking statements and reasons why results might differ included in this presentation are made as of the date of this presentation, based on information currently available to DexCom, deal with future events, are subject to various risks and uncertainties, and actual results could differ materially from those anticipated in those forward-looking statements. The risks and uncertainties that may cause actual results to differ materially from DexCom’s current expectations are more fully described in DexCom’s annual report on Form 10-K for the period ended December 31, 2016, as filed with the Securities and Exchange Commission on February 28, 2017, its most recent quarterly report on Form 10-Q for the period ended September 30, 2017, as filed with the Securities and Exchange Commission on November 1, 2017, and its other reports, each as filed with the Securities and Exchange Commission. DexCom assumes no obligation to update any such forward-looking statement after the date of this report or to conform these forward-looking statements to actual results. Safe Harbor Statement
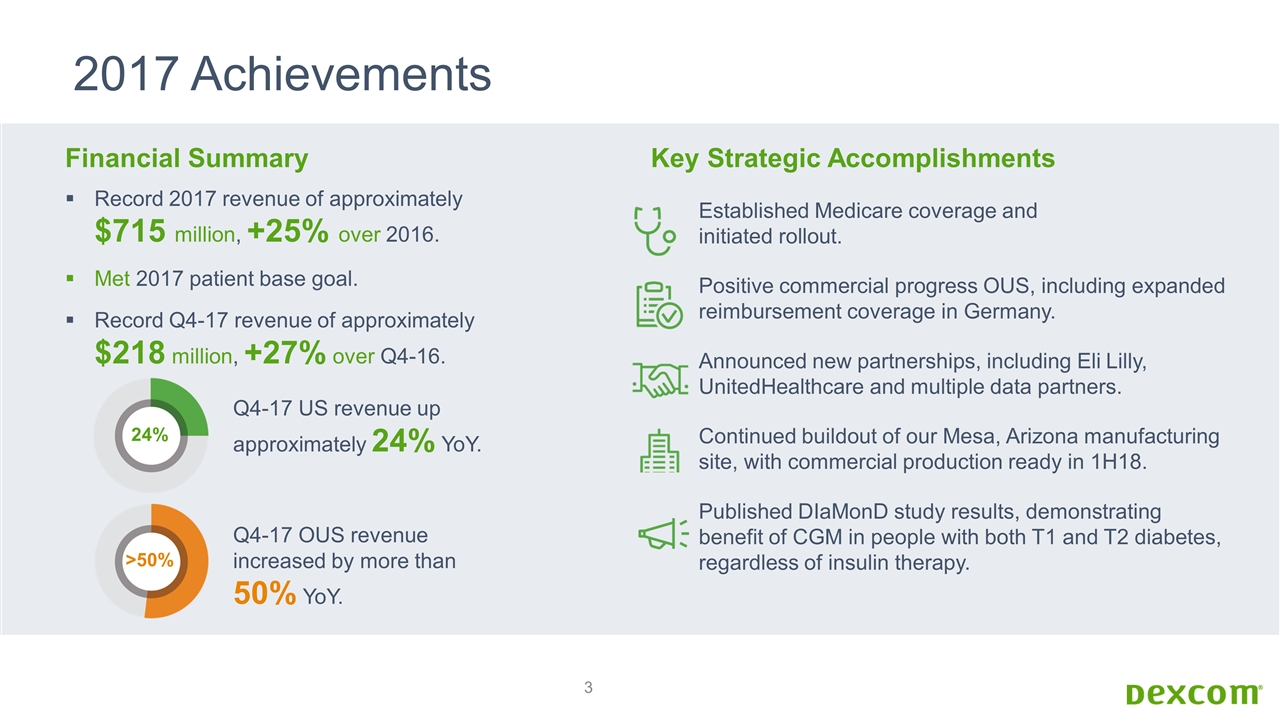
2017 Achievements Financial Summary Record 2017 revenue of approximately $715 million, +25% over 2016. Met 2017 patient base goal. Record Q4-17 revenue of approximately $218 million, +27% over Q4-16. Q4-17 US revenue up approximately 24% YoY. Q4-17 OUS revenue increased by more than 50% YoY. 24% >50% Key Strategic Accomplishments Established Medicare coverage and initiated rollout. Positive commercial progress OUS, including expanded reimbursement coverage in Germany. Announced new partnerships, including Eli Lilly, UnitedHealthcare and multiple data partners. Continued buildout of our Mesa, Arizona manufacturing site, with commercial production ready in 1H18. Published DIaMonD study results, demonstrating benefit of CGM in people with both T1 and T2 diabetes, regardless of insulin therapy.
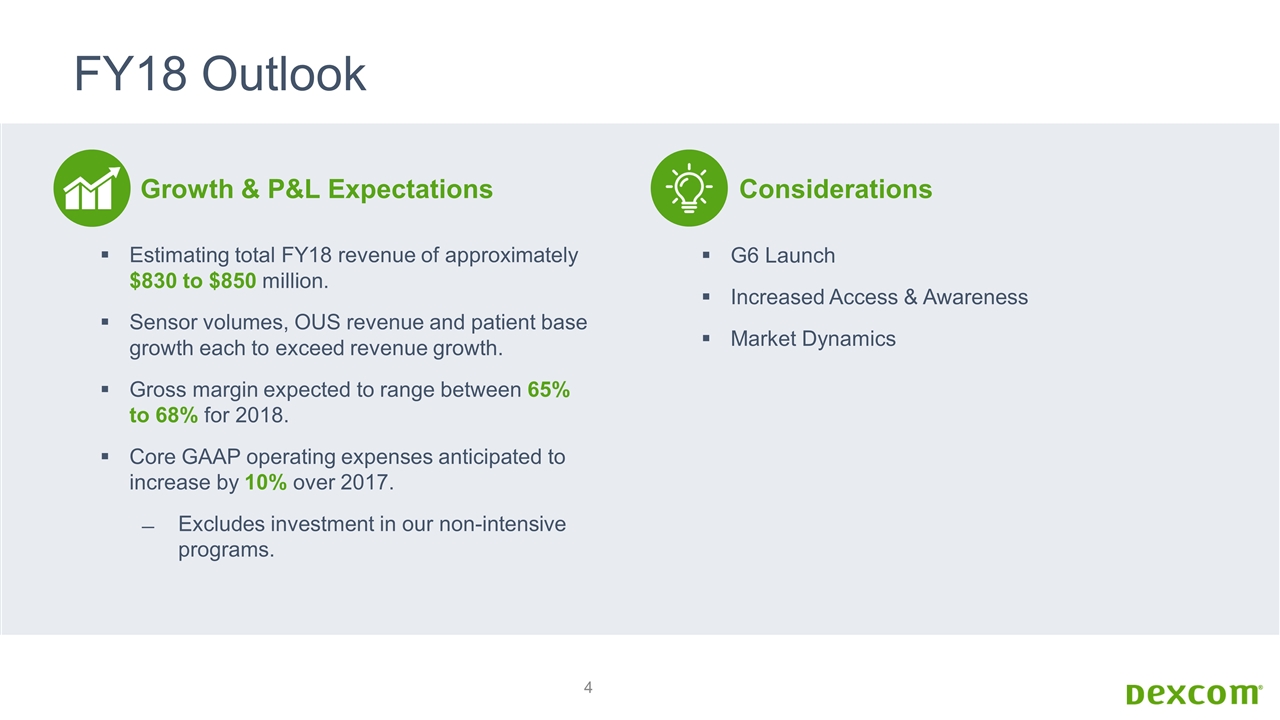
FY18 Outlook Estimating total FY18 revenue of approximately $830 to $850 million. Sensor volumes, OUS revenue and patient base growth each to exceed revenue growth. Gross margin expected to range between 65% to 68% for 2018. Core GAAP operating expenses anticipated to increase by 10% over 2017. Excludes investment in our non-intensive programs. Growth & P&L Expectations G6 Launch Increased Access & Awareness Market Dynamics Considerations
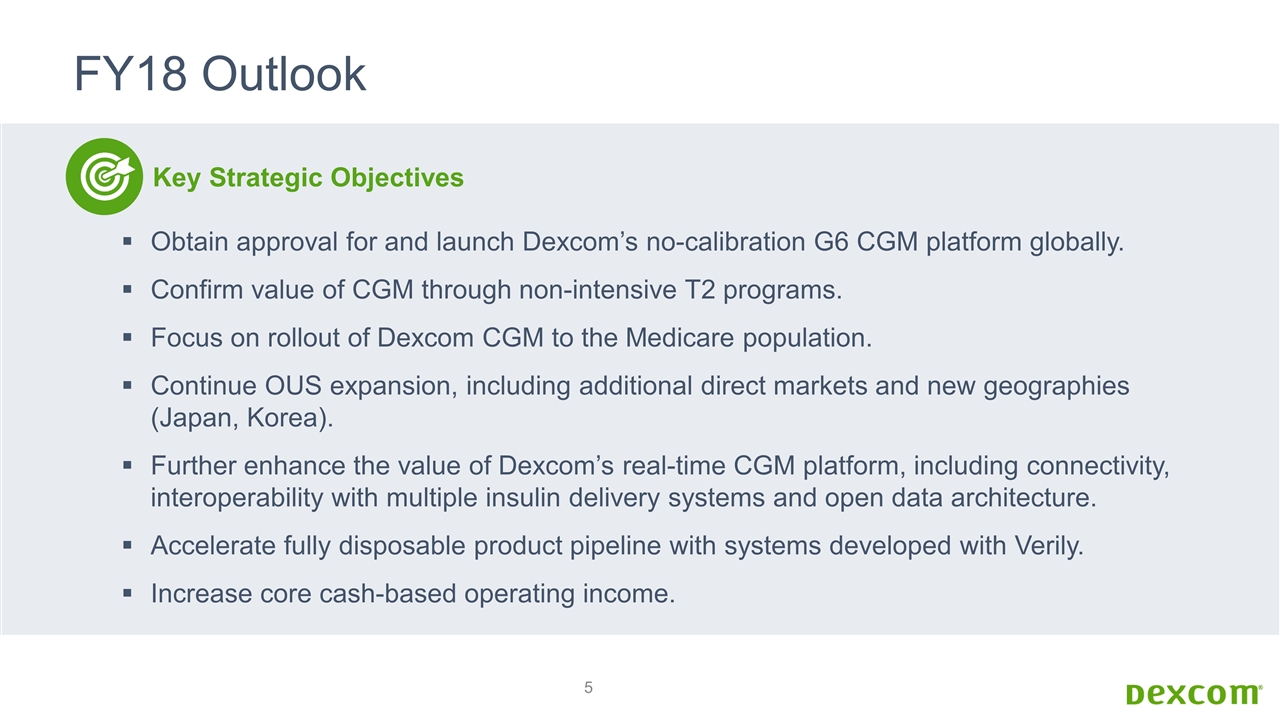
FY18 Outlook Obtain approval for and launch Dexcom’s no-calibration G6 CGM platform globally. Confirm value of CGM through non-intensive T2 programs. Focus on rollout of Dexcom CGM to the Medicare population. Continue OUS expansion, including additional direct markets and new geographies (Japan, Korea). Further enhance the value of Dexcom’s real-time CGM platform, including connectivity, interoperability with multiple insulin delivery systems and open data architecture. Accelerate fully disposable product pipeline with systems developed with Verily. Increase core cash-based operating income. Key Strategic Objectives

CGM & Diabetes Management
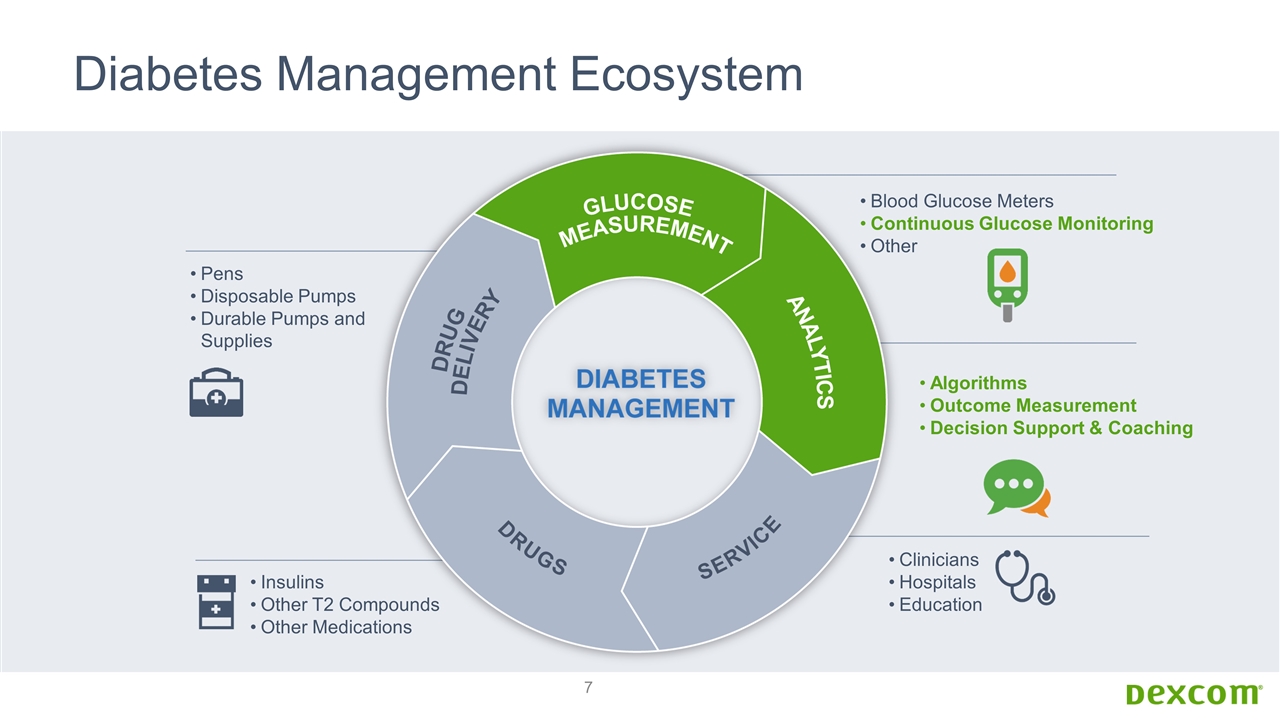
Diabetes Management Ecosystem Pens Disposable Pumps Durable Pumps and Supplies Insulins Other T2 Compounds Other Medications Blood Glucose Meters Continuous Glucose Monitoring Other Algorithms Outcome Measurement Decision Support & Coaching Clinicians Hospitals Education
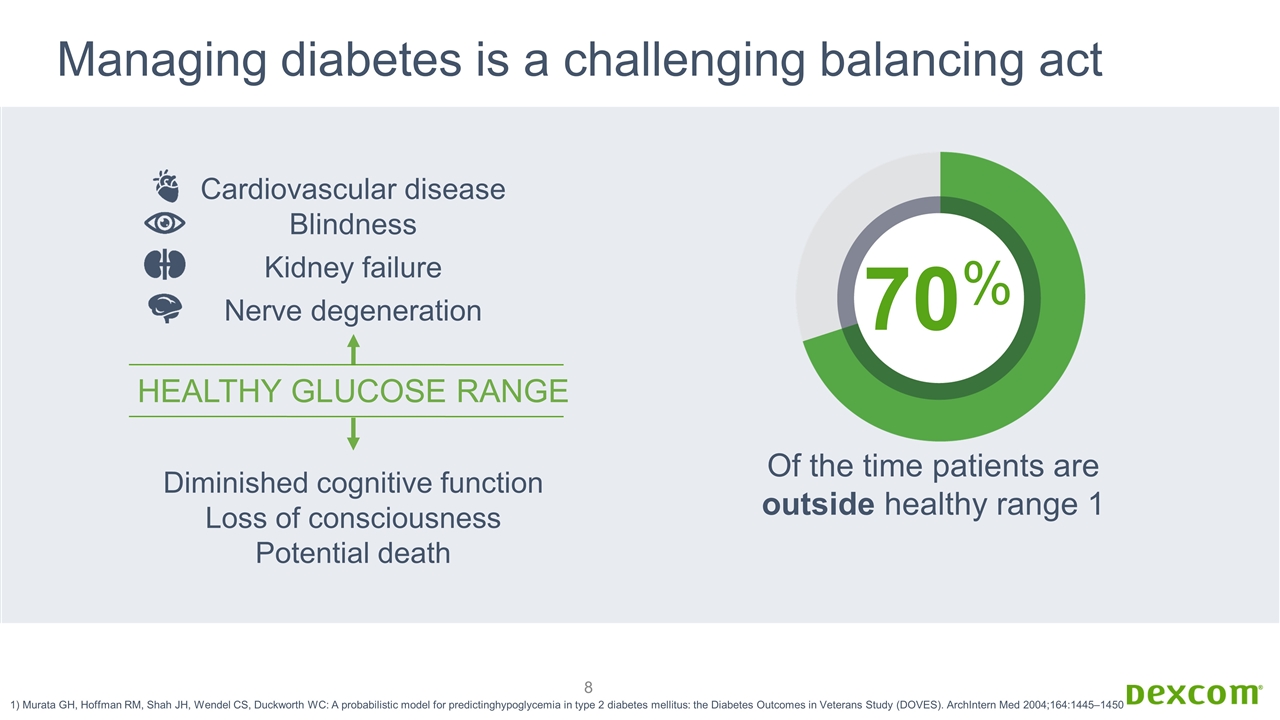
Cardiovascular disease Blindness Kidney failure Nerve degeneration Diminished cognitive function Loss of consciousness Potential death HEALTHY GLUCOSE RANGE Of the time patients are outside healthy range 1 1) Murata GH, Hoffman RM, Shah JH, Wendel CS, Duckworth WC: A probabilistic model for predictinghypoglycemia in type 2 diabetes mellitus: the Diabetes Outcomes in Veterans Study (DOVES). ArchIntern Med 2004;164:1445–1450 70% Managing diabetes is a challenging balancing act
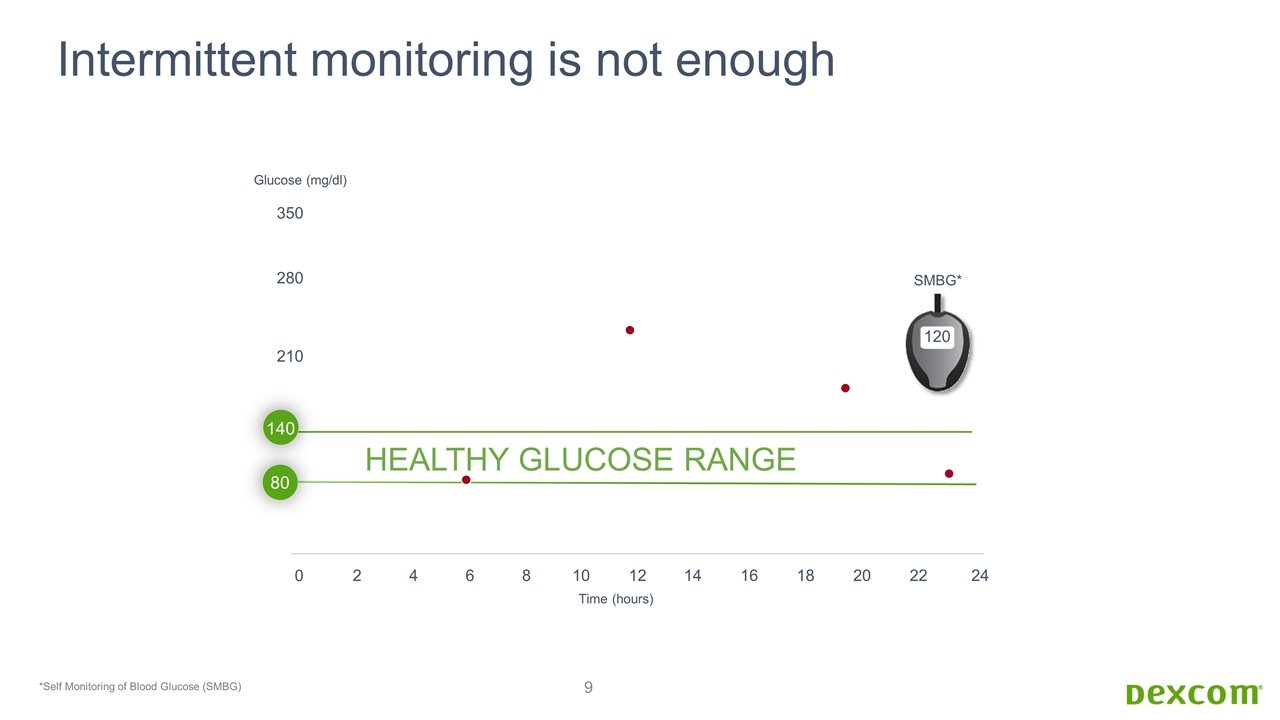
210 280 350 2 4 6 8 10 12 14 16 18 20 22 Glucose (mg/dl) 0 Time (hours) 24 120 SMBG* HEALTHY GLUCOSE RANGE 140 80 *Self Monitoring of Blood Glucose (SMBG) Intermittent monitoring is not enough
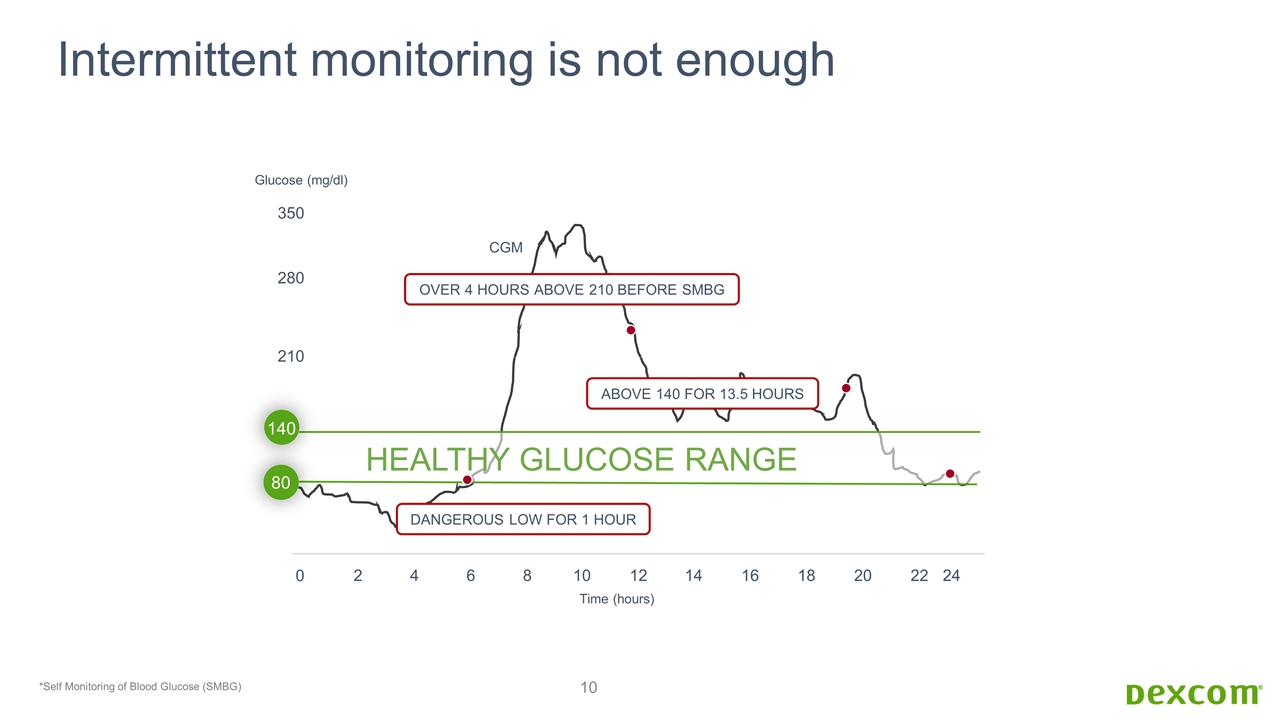
210 280 350 2 4 6 8 10 12 14 16 18 20 22 Glucose (mg/dl) 0 HEALTHY GLUCOSE RANGE Time (hours) 140 80 24 DANGEROUS LOW FOR 1 HOUR OVER 4 HOURS ABOVE 210 BEFORE SMBG ABOVE 140 FOR 13.5 HOURS CGM *Self Monitoring of Blood Glucose (SMBG) Intermittent monitoring is not enough
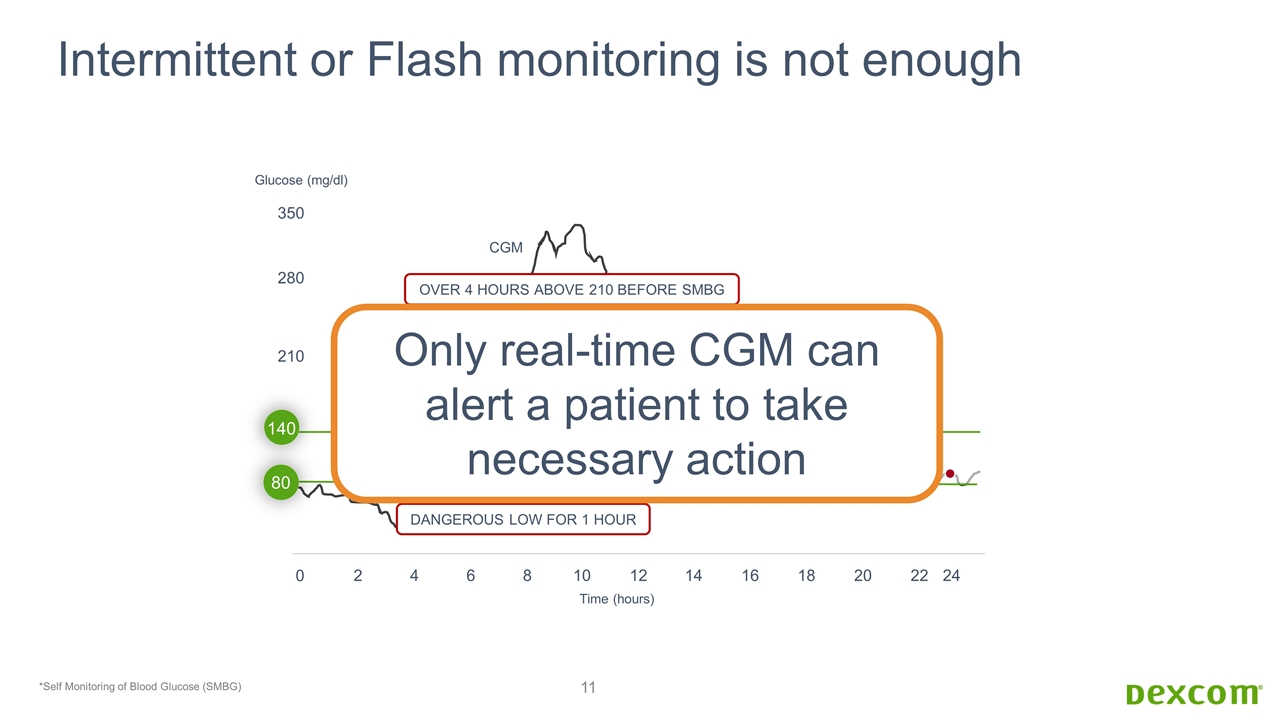
210 280 350 2 4 6 8 10 12 14 16 18 20 22 Glucose (mg/dl) 0 HEALTHY GLUCOSE RANGE Time (hours) 140 80 24 DANGEROUS LOW FOR 1 HOUR OVER 4 HOURS ABOVE 210 BEFORE SMBG ABOVE 140 FOR 13.5 HOURS CGM *Self Monitoring of Blood Glucose (SMBG) Intermittent or Flash monitoring is not enough Only real-time CGM can alert a patient to take necessary action
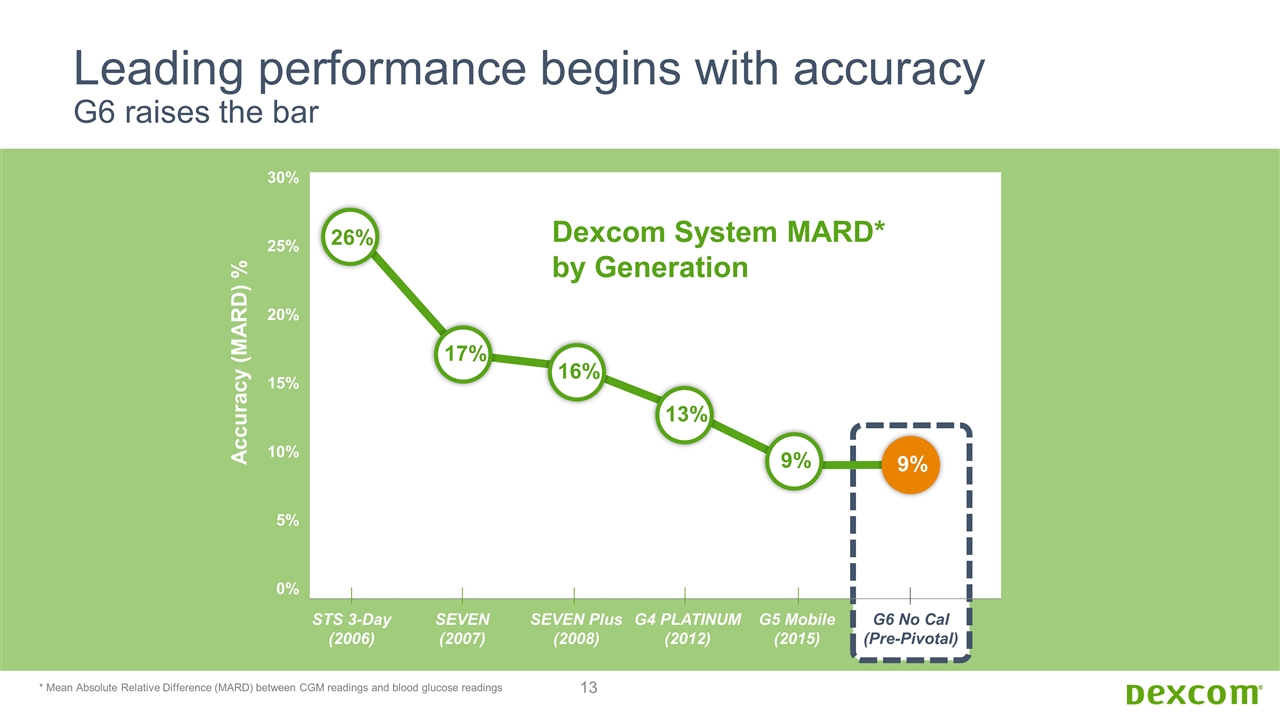
G5 Mobile (2015) Leading performance begins with accuracy G6 raises the bar 17% STS 3-Day (2006) SEVEN (2007) SEVEN Plus (2008) G4 PLATINUM (2012) G6 No Cal (Pre-Pivotal) 30% 25% 20% 15% 10% 5% 0% Accuracy (MARD) % Dexcom System MARD* by Generation 16% 13% 9% 26% * Mean Absolute Relative Difference (MARD) between CGM readings and blood glucose readings 9%
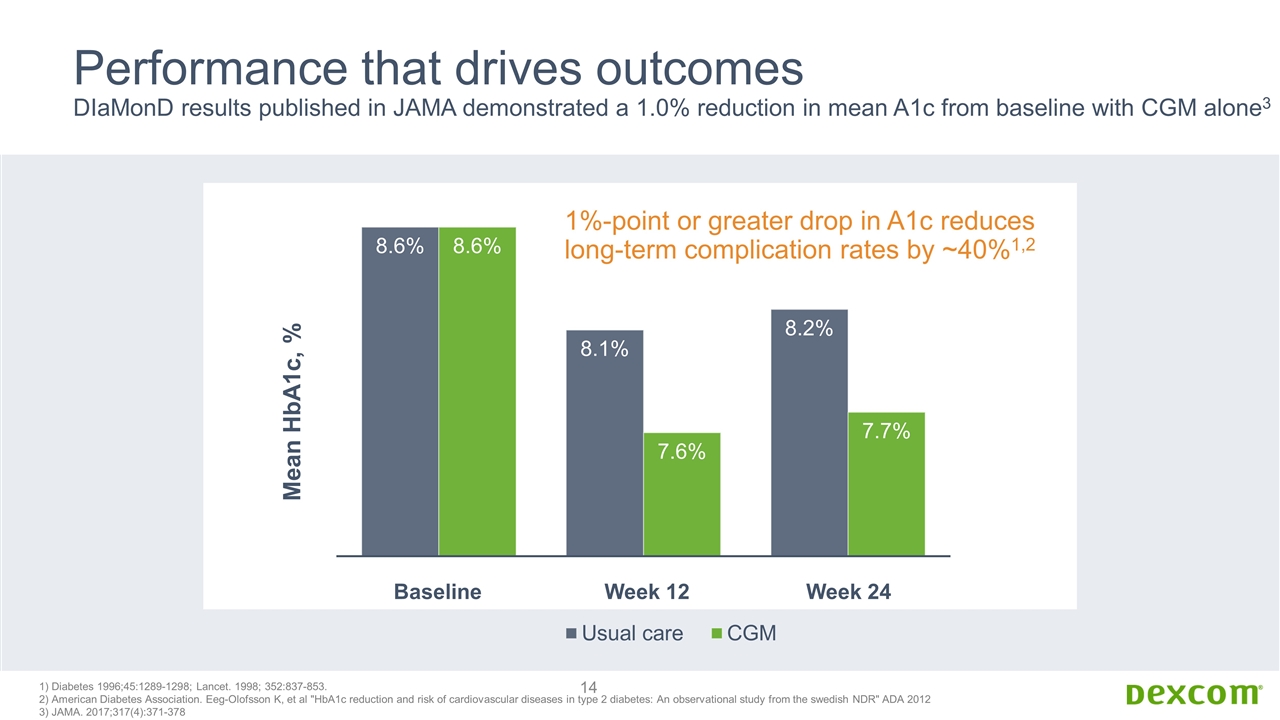
Performance that drives outcomes DIaMonD results published in JAMA demonstrated a 1.0% reduction in mean A1c from baseline with CGM alone3 Baseline Week 12 Week 24 1) Diabetes 1996;45:1289-1298; Lancet. 1998; 352:837-853. 2) American Diabetes Association. Eeg-Olofsson K, et al "HbA1c reduction and risk of cardiovascular diseases in type 2 diabetes: An observational study from the swedish NDR" ADA 2012 3) JAMA. 2017;317(4):371-378 1%-point or greater drop in A1c reduces long-term complication rates by ~40%1,2
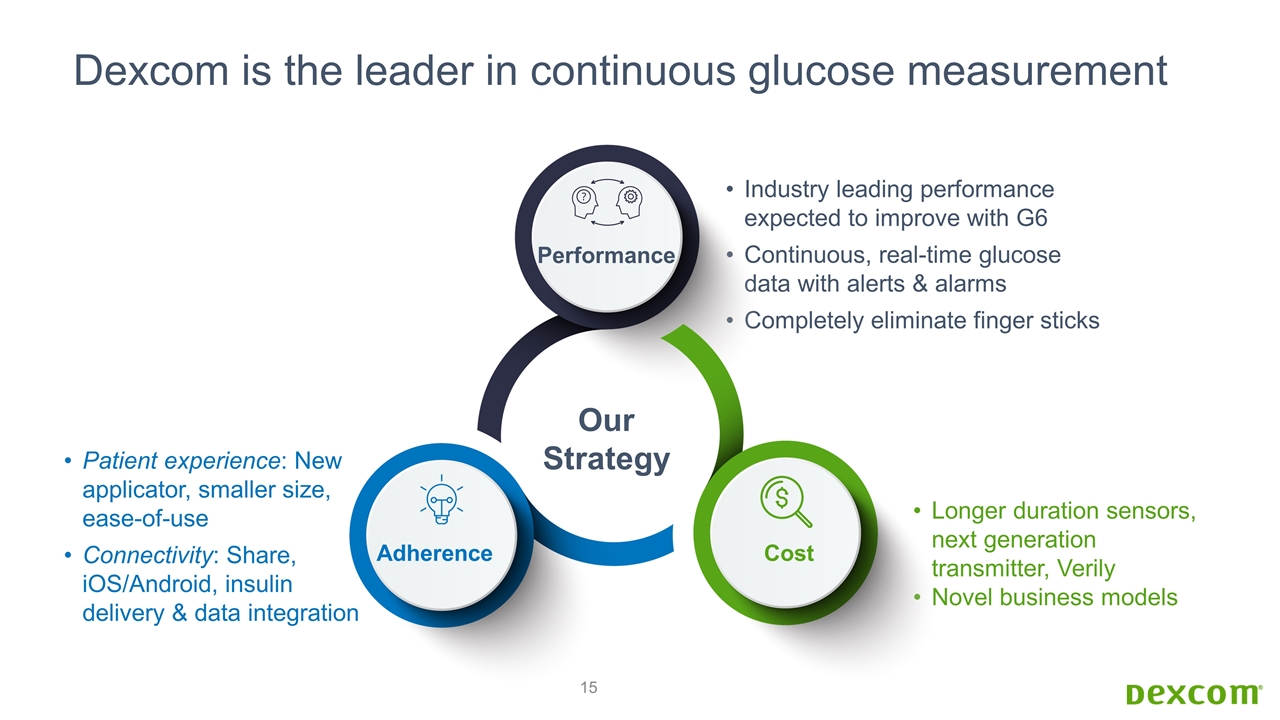
Dexcom is the leader in continuous glucose measurement Industry leading performance expected to improve with G6 Continuous, real-time glucose data with alerts & alarms Completely eliminate finger sticks Patient experience: New applicator, smaller size, ease-of-use Connectivity: Share, iOS/Android, insulin delivery & data integration Longer duration sensors, next generation transmitter, Verily Novel business models Our Strategy Performance Adherence Cost
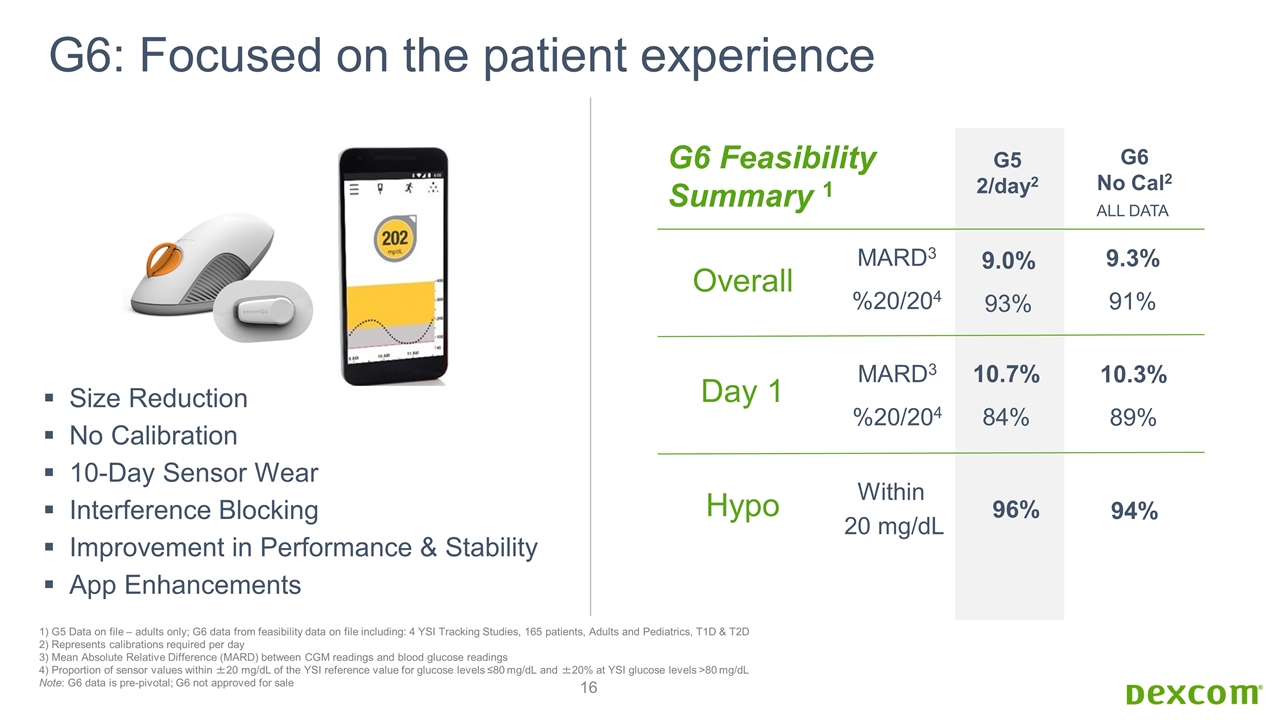
G6: Focused on the patient experience Size Reduction No Calibration 10-Day Sensor Wear Interference Blocking Improvement in Performance & Stability App Enhancements G6 No Cal2 9.3% 91% 10.3% 89% ALL DATA Day 1 Overall G5 2/day2 MARD3 %20/204 9.0% 93% Within 20 mg/dL 10.7% 84% 1) G5 Data on file – adults only; G6 data from feasibility data on file including: 4 YSI Tracking Studies, 165 patients, Adults and Pediatrics, T1D & T2D 2) Represents calibrations required per day 3) Mean Absolute Relative Difference (MARD) between CGM readings and blood glucose readings 4) Proportion of sensor values within ±20 mg/dL of the YSI reference value for glucose levels ≤80 mg/dL and ±20% at YSI glucose levels >80 mg/dL Note: G6 data is pre-pivotal; G6 not approved for sale Hypo 94% G6 Feasibility Summary 1 96% MARD3 %20/204
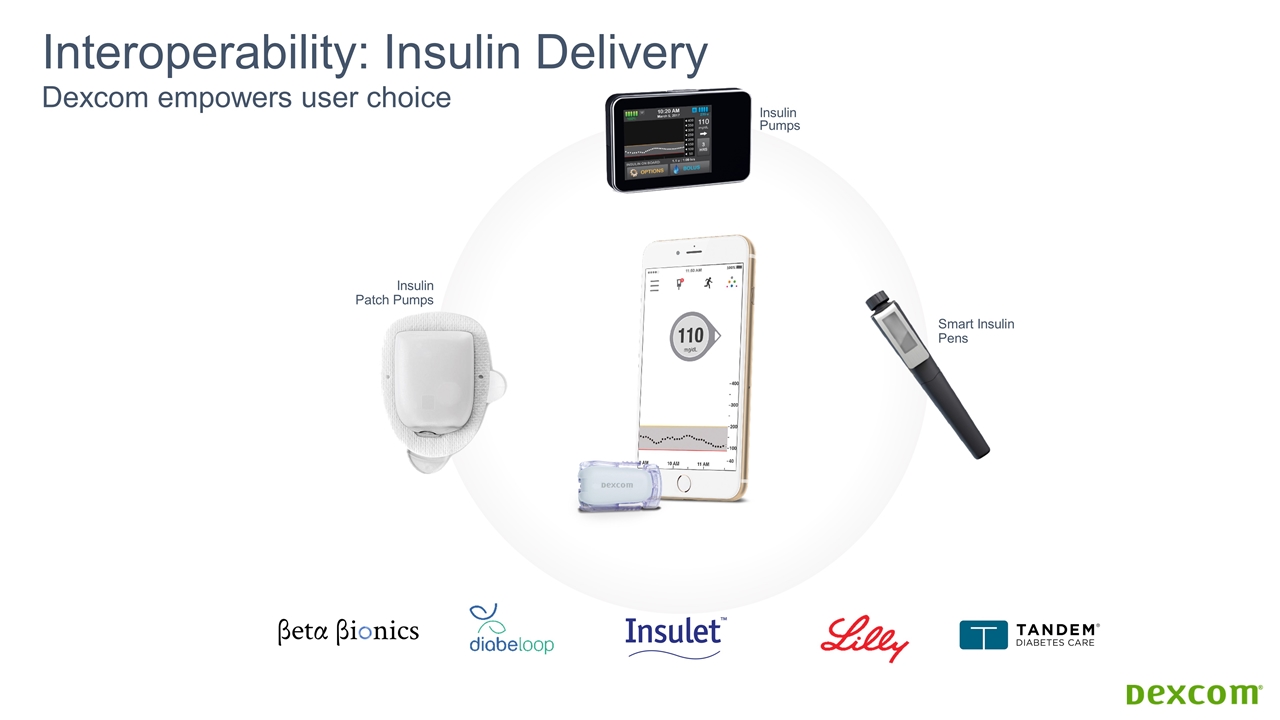
Interoperability: Insulin Delivery Dexcom empowers user choice Smart Insulin Pens Insulin Patch Pumps Insulin Pumps
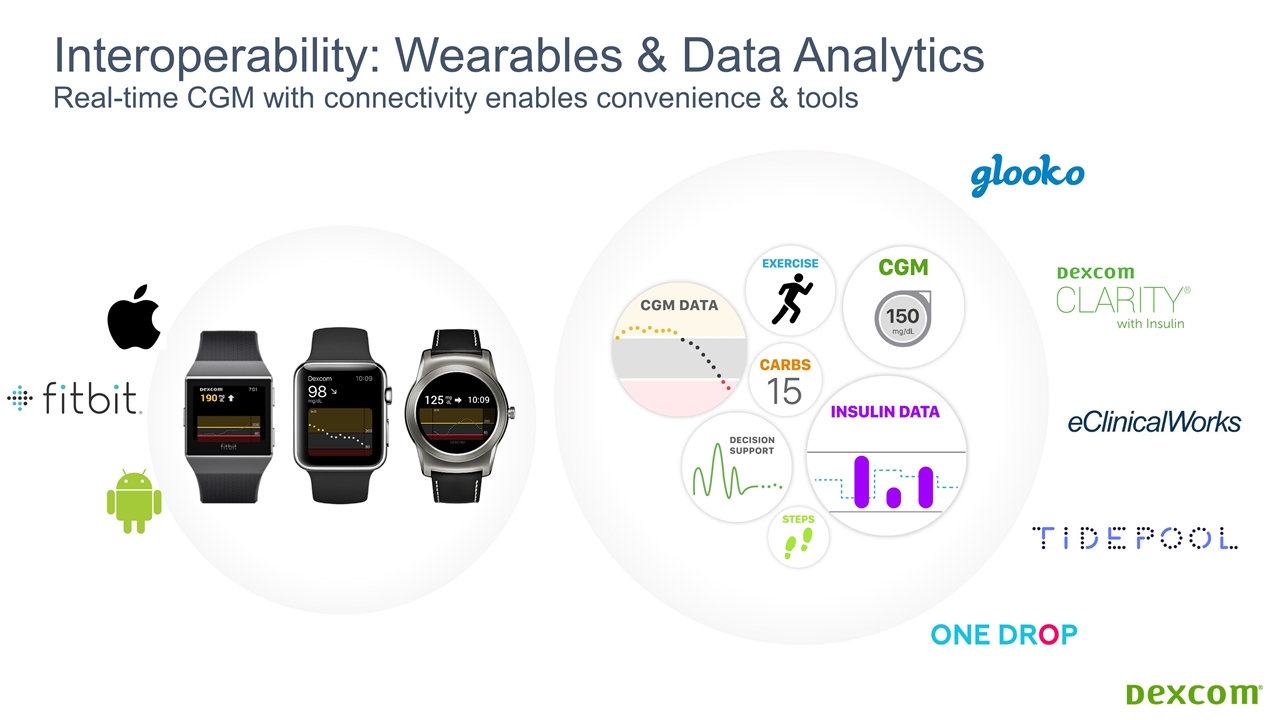
Interoperability: Wearables & Data Analytics Real-time CGM with connectivity enables convenience & tools
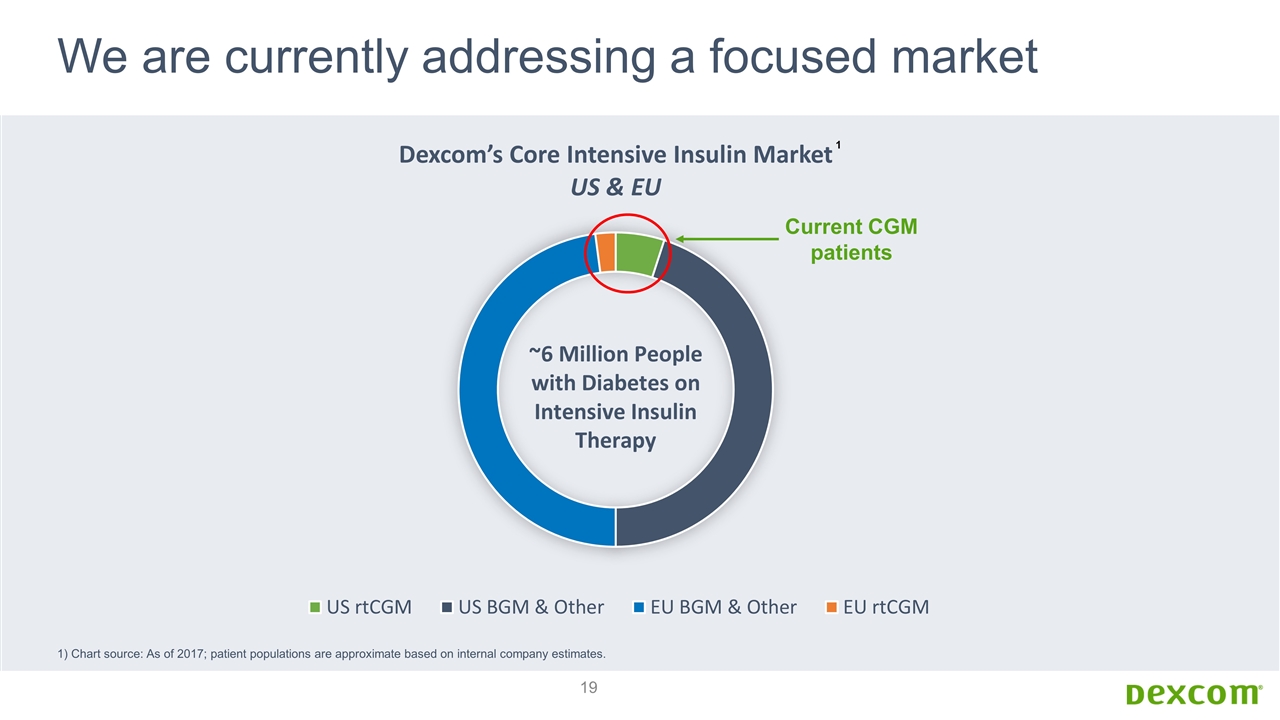
We are currently addressing a focused market 1) Chart source: As of 2017; patient populations are approximate based on internal company estimates. 1 Current CGM patients
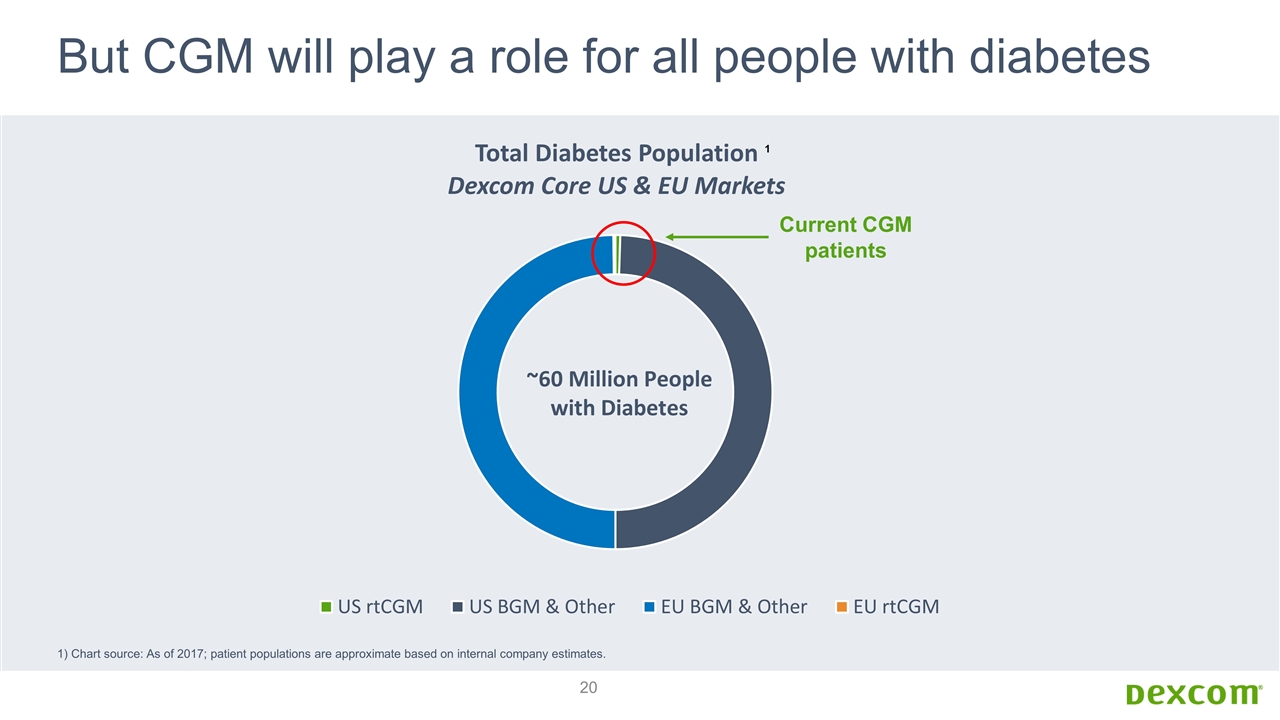
But CGM will play a role for all people with diabetes 1) Chart source: As of 2017; patient populations are approximate based on internal company estimates. 1 Current CGM patients
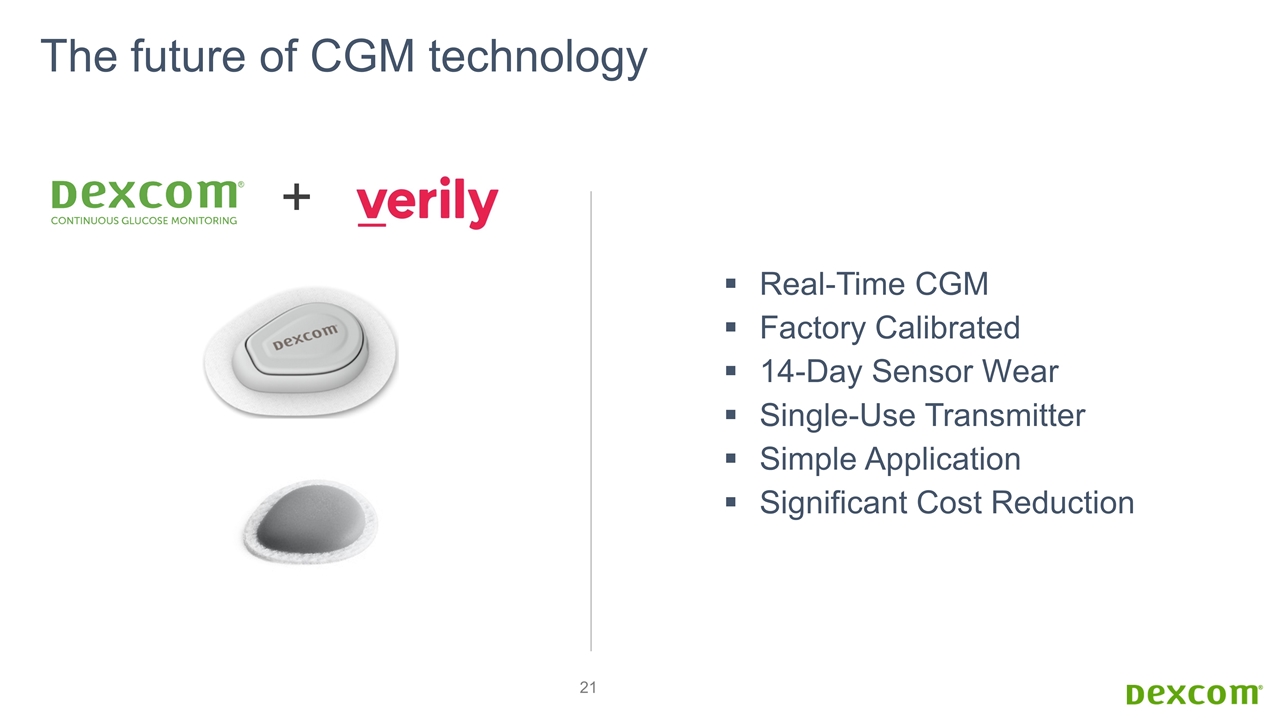
+ Real-Time CGM Factory Calibrated 14-Day Sensor Wear Single-Use Transmitter Simple Application Significant Cost Reduction The future of CGM technology
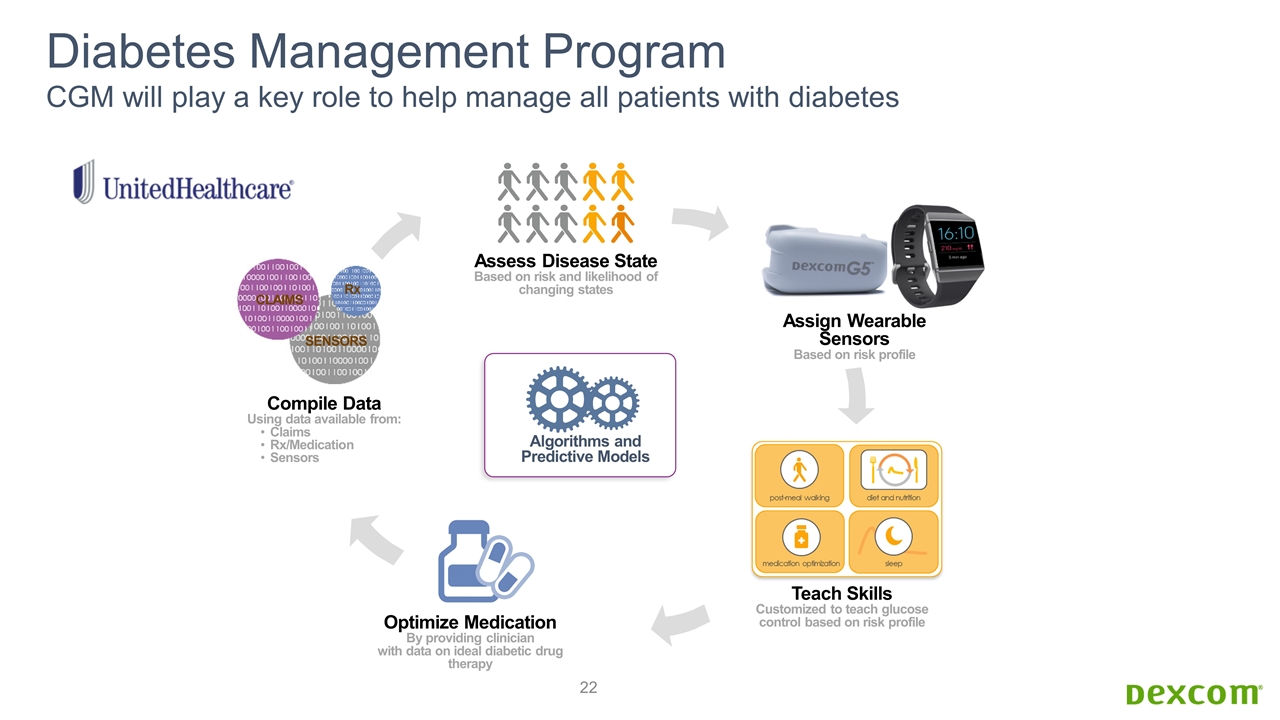
Diabetes Management Program CGM will play a key role to help manage all patients with diabetes Assign Wearable Sensors Based on risk profile Teach Skills Customized to teach glucose control based on risk profile Compile Data Using data available from: Claims Rx/Medication Sensors Assess Disease State Based on risk and likelihood of changing states Algorithms and Predictive Models CLAIMS SENSORS Rx Optimize Medication By providing clinician with data on ideal diabetic drug therapy
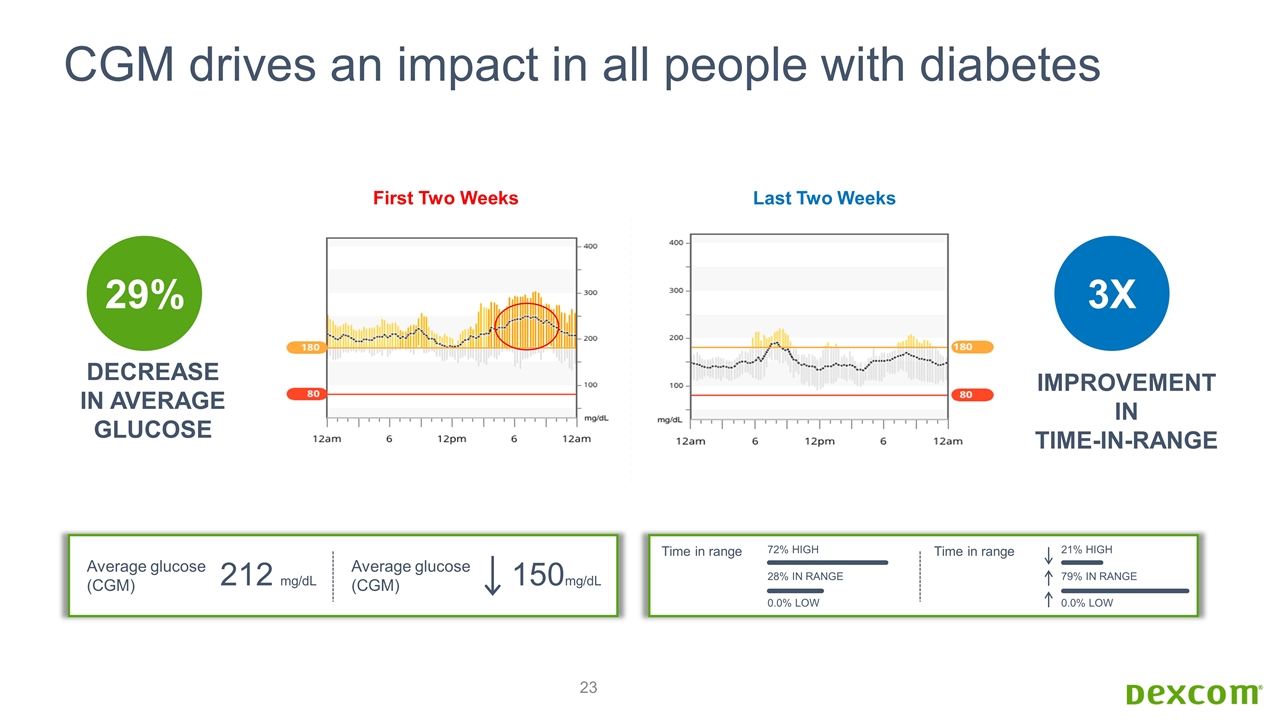
CGM drives an impact in all people with diabetes 212 mg/dL Average glucose (CGM) 150mg/dL Average glucose (CGM) 72% HIGH 28% IN RANGE 0.0% LOW Time in range 21% HIGH 79% IN RANGE 0.0% LOW Time in range IMPROVEMENT IN TIME-IN-RANGE 29% DECREASE IN AVERAGE GLUCOSE 3X First Two Weeks Last Two Weeks
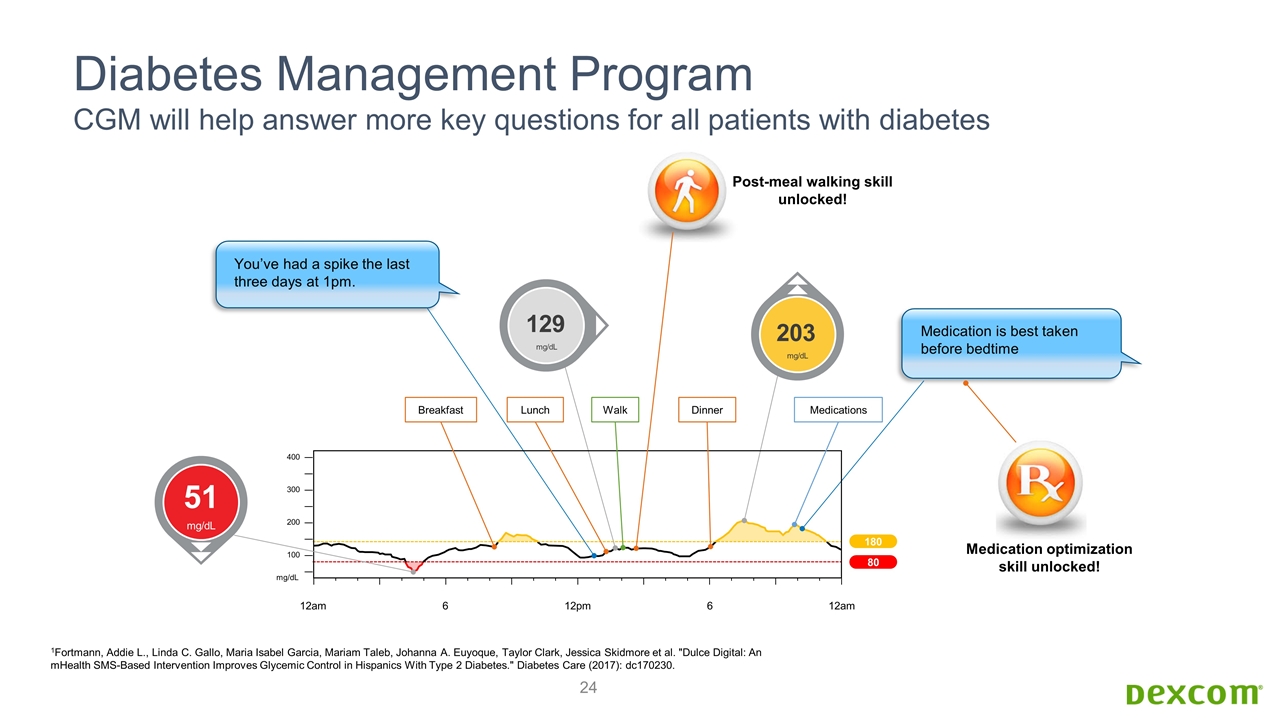
Diabetes Management Program CGM will help answer more key questions for all patients with diabetes 180 80 You’ve had a spike the last three days at 1pm. Medication is best taken before bedtime 1Fortmann, Addie L., Linda C. Gallo, Maria Isabel Garcia, Mariam Taleb, Johanna A. Euyoque, Taylor Clark, Jessica Skidmore et al. "Dulce Digital: An mHealth SMS-Based Intervention Improves Glycemic Control in Hispanics With Type 2 Diabetes." Diabetes Care (2017): dc170230. 51 mg/dL 129 mg/dL 203 mg/dL 400 300 200 100 mg/dL 12am 6 12am 6 12pm Breakfast Lunch Walk Dinner Medications Post-meal walking skill unlocked! Medication optimization skill unlocked!
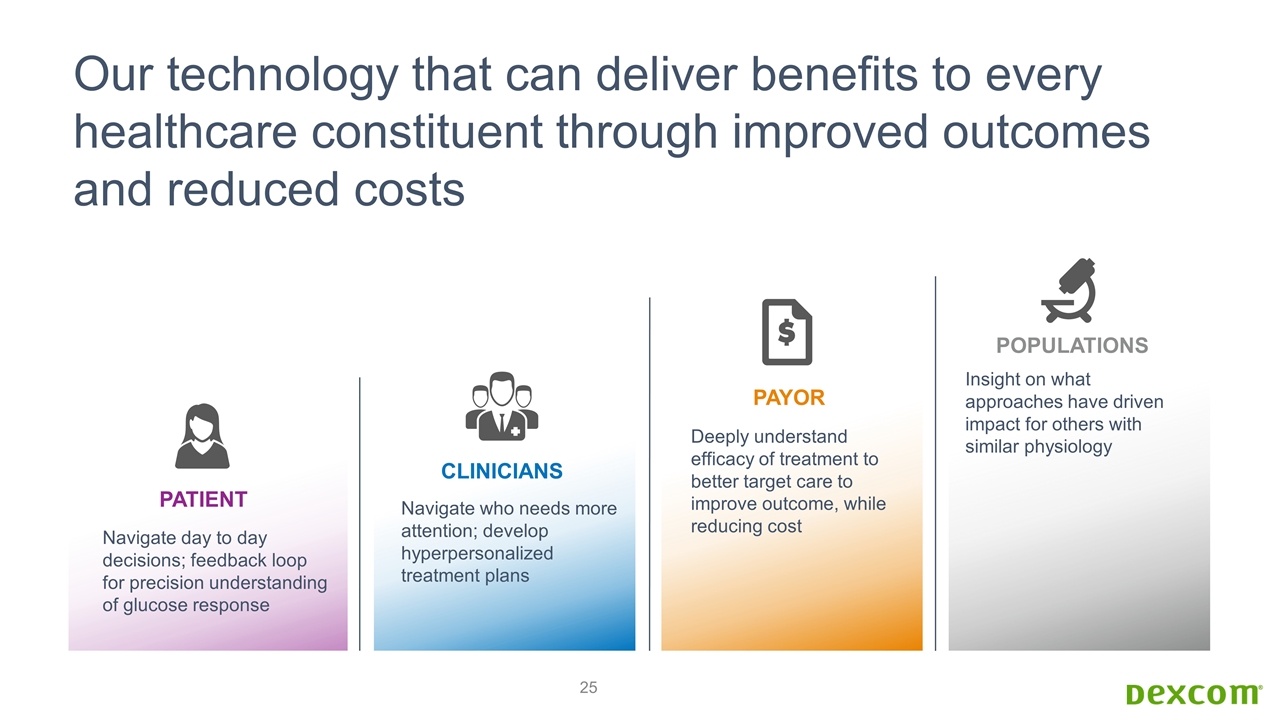
Our technology that can deliver benefits to every healthcare constituent through improved outcomes and reduced costs Clinicians Patient Populations Payor Navigate day to day decisions; feedback loop for precision understanding of glucose response Navigate who needs more attention; develop hyperpersonalized treatment plans Deeply understand efficacy of treatment to better target care to improve outcome, while reducing cost Insight on what approaches have driven impact for others with similar physiology

CGM to empower all people with diabetes
