Attached files
| file | filename |
|---|---|
| 8-K - 8-K - Wingstop Inc. | a8-kprelimq42017.htm |
| EX-99.1 - EXHIBIT 99.1 - Wingstop Inc. | wingq42017preliminarysales.htm |

0
JANUARY 2018
INVESTOR
PRESENTATION

1
Forward-Looking Statements
This presentation contains forward-looking statements that are subject to risks and uncertainties. All statements other than statements of historical fact or
relating to present facts or current conditions included in this presentation are forward-looking statements. Forward-looking statements give Wingstop Inc.’s (the
“Company”) current expectations and projections relating to its financial condition, results of operations, plans, objectives, future performance and business. You
can identify forward-looking statements by the fact that they do not relate strictly to historical or current facts. These statements may include words such as
“anticipates,” “believes,” “continues,” “estimates,” “expects,” “goal,” “objectives” “intends,” “may,” “opportunity,” “plans,” “potential,” “near-term,” “long-term,”
“projections,” “assumptions,” “projects,” “guidance,” “forecasts,” “outlook,” “target,” “trends,” “should,” “could,” “would,” “will” and similar expressions and
terms of similar meaning in connection with any discussion of the timing or nature of future operating or financial performance or other events.
The forward-looking statements contained in this presentation are based on assumptions that the Company has made in light of its industry experience and
perceptions of historical trends, current conditions, expected future developments and other factors it believes are appropriate under the circumstances. As
you read and consider this presentation, you should understand that these statements are not guarantees of performance or results. They involve risks,
uncertainties (many of which are beyond its control) and assumptions. Although the Company believes that these forward-looking statements are based on
reasonable assumptions, you should be aware that many factors could affect its actual operating and financial performance and cause its performance to
differ materially from the performance anticipated in the forward-looking statements. The Company believes these factors include, but are not limited to,
those described under the sections “Risk Factors” and “Management’s Discussion and Analysis of Financial Condition and Results of Operations” in its
Annual Report on Form 10-K filed with the Securities and Exchange Commission (the “SEC”). Should one or more of these risks or uncertainties materialize,
or should any of these assumptions prove incorrect, the Company’s actual operating and financial performance may vary in material respects from the
performance projected in these forward-looking statements.
Any forward-looking statement made by the Company in this presentation speaks only as of the date on which it is made. Factors or events that could cause
the Company’s actual operating and financial performance to differ may emerge from time to time, and it is not possible for the Company to predict all of
them. The Company undertakes no obligation to publicly update any forward-looking statement, whether as a result of new information, future developments
or otherwise, except as may be required by law.
Non-GAAP Financial Measures
This presentation contains certain non-GAAP financial measures. A “non-GAAP financial measure” is defined as a numerical measure of a company’s
financial performance that excludes or includes amounts so as to be different than the most directly comparable measure calculated and presented in
accordance with GAAP in the statements of income, balance sheets or statements of cash flow of the company. The Company has provided a reconciliation
of Adjusted EBITDA, a non-GAAP financial measure, to net income in the Appendix to this presentation. Adjusted EBITDA is presented because
management believes that such financial measure, when viewed with the Company’s results of operations presented in accordance with GAAP and the
reconciliation of Adjusted EBITDA to net income, provides additional information to investors about certain material non-cash items and about unusual items
that the Company does not expect to continue at the same level in the future. Adjusted EBITDA is used by investors as a supplemental measure to evaluate
the overall operating performance of companies in the Company’s industry, but you should not consider it in isolation, or as a substitute for analysis of
results as reported in accordance with GAAP. The Company’s calculation of Adjusted EBITDA may not be comparable to that reported by other companies.
For additional information about the Company’s non-GAAP financial measures, see the Company’s filings with the SEC.
FORWARD-LOOKING STATEMENTS

2
CATEGORY
OF ONE
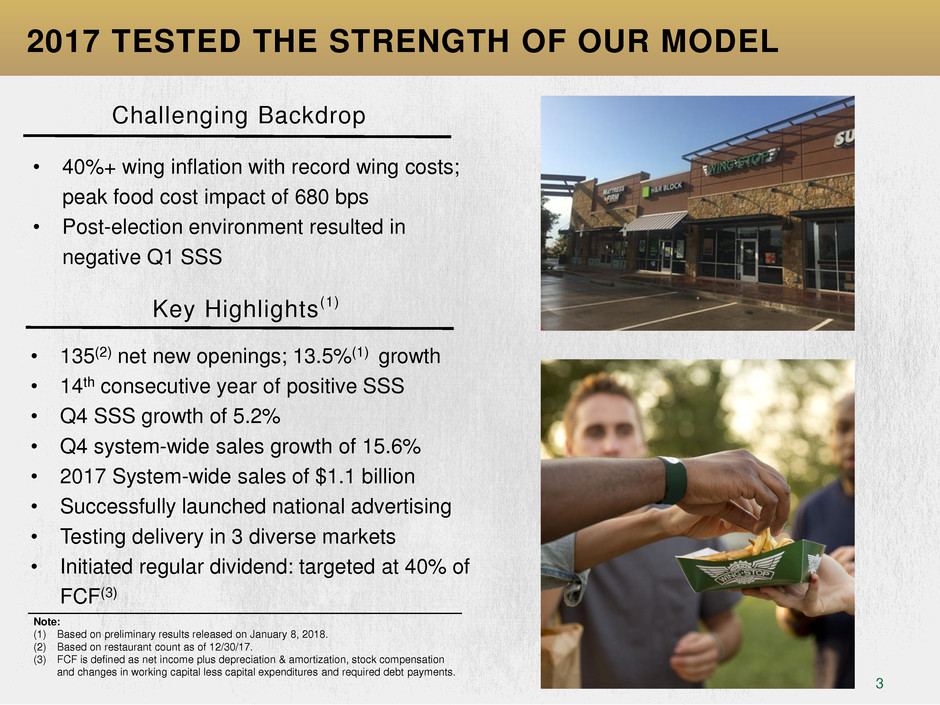
3
Challenging Backdrop
• 40%+ wing inflation with record wing costs;
peak food cost impact of 680 bps
• Post-election environment resulted in
negative Q1 SSS
• 135(2) net new openings; 13.5%(1) growth
• 14th consecutive year of positive SSS
• Q4 SSS growth of 5.2%
• Q4 system-wide sales growth of 15.6%
• 2017 System-wide sales of $1.1 billion
• Successfully launched national advertising
• Testing delivery in 3 diverse markets
• Initiated regular dividend: targeted at 40% of
FCF(3)
2017 TESTED THE STRENGTH OF OUR MODEL
Note:
(1) Based on preliminary results released on January 8, 2018.
(2) Based on restaurant count as of 12/30/17.
(3) FCF is defined as net income plus depreciation & amortization, stock compensation
and changes in working capital less capital expenditures and required debt payments.
Key Highlights (1)
4
LONG TRACK RECORD OF OUTSTANDING
RESULTS CONTINUES
Notes:
(1) Three-year period ended September 30, 2017.
(2) Refer to Adjusted EBITDA reconciliation in Appendix.
3 Year CAGR(1)
Unit Development 17%
System-Wide Sales 18%
Revenue 15%
Adjusted EBITDA(2) 20%
5
Source: Company filings.
Notes:
(1) Domestic system-wide
(2)
Americas
(3) Total System
(4) North America
2014
2013
2012
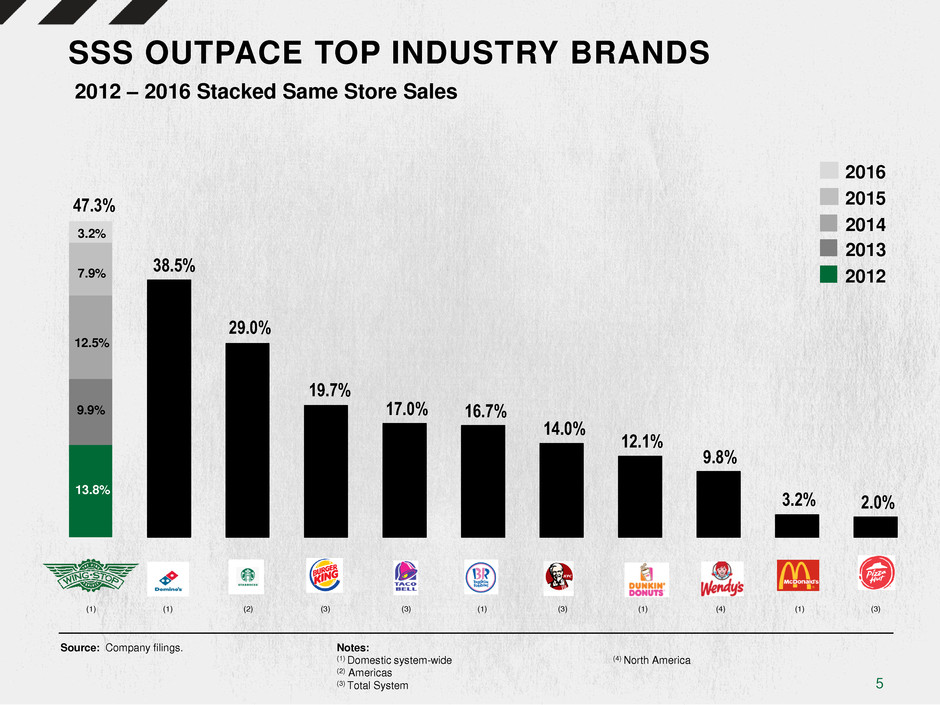
2012 – 2016 Stacked Same Store Sales
SSS OUTPACE TOP INDUSTRY BRANDS
2015
(1) (1) (3) (1) (1) (3) (4) (3) (1) (2)
47.3%
38.5%
29.0%
19.7%
17.0% 16.7%
14.0%
12.1%
9.8%
3.2% 2.0%
(3)
2016
3.2%
7.9%
12.5%
9.9%
13.8%
6
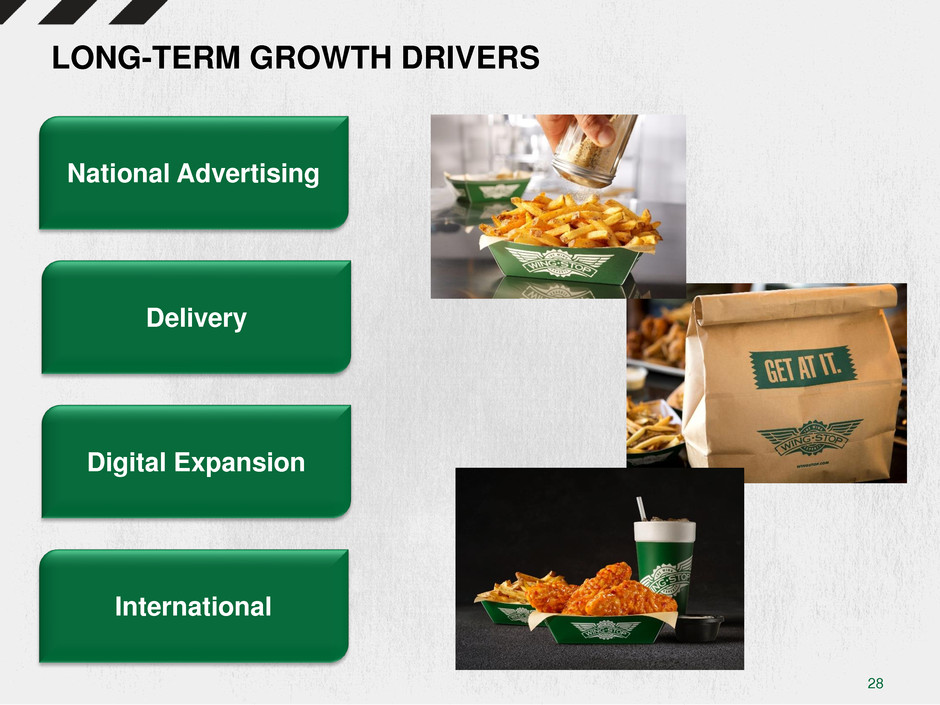
LONG-TERM GROWTH DRIVERS
National Advertising
Digital Expansion
Delivery
International

7
NATIONAL ADVERTISING
NATIONAL ADVERTISING
8
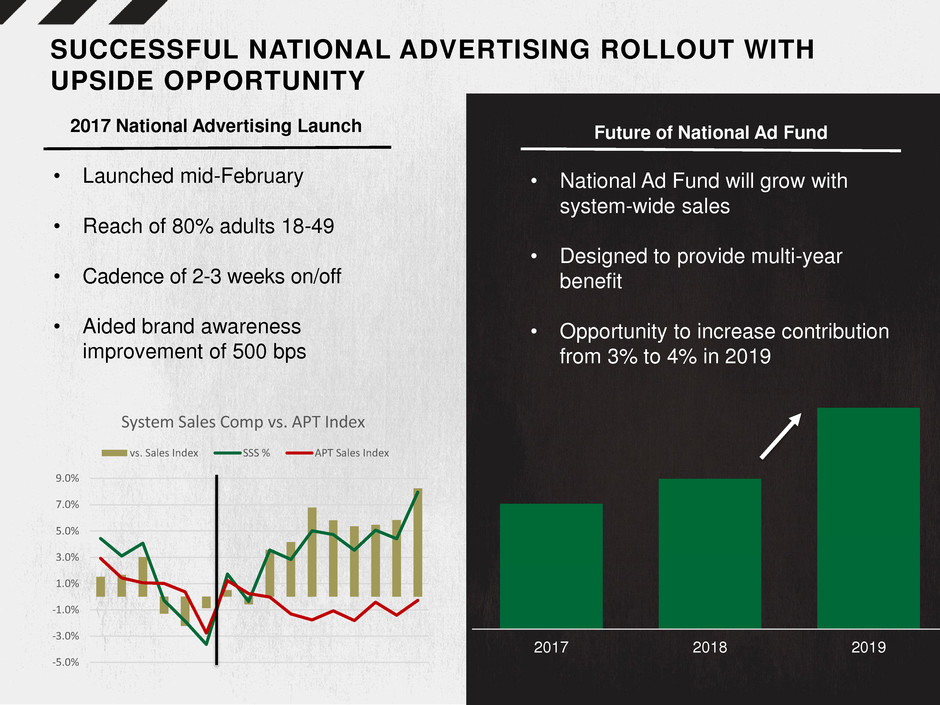
SUCCESSFUL NATIONAL ADVERTISING ROLLOUT WITH
UPSIDE OPPORTUNITY
2017 National Advertising Launch
• Launched mid-February
• Reach of 80% adults 18-49
• Cadence of 2-3 weeks on/off
• Aided brand awareness
improvement of 500 bps
2017 2018 2019
Future of National Ad Fund
• National Ad Fund will grow with
system-wide sales
• Designed to provide multi-year
benefit
• Opportunity to increase contribution
from 3% to 4% in 2019
-5.0%
-3.0%
-1.0%
1.0%
3.0%
5.0%
7.0%
9.0%
System Sales Comp vs. APT Index
vs. Sales Index SSS % APT Sales Index
9
4.9%
6.5%
4.6%
-2.1%
-9.1%
-9.6%
-6.6%
6.9%
-4.7%
12.1%
-2.6%
-8.9%
-12.1%
-5.5%
-9.7%
-4.6%
-8.6%
-9.2%
-8.7%
-12.2%
-12.7% -15.5%
-5.5% -5.3%
-9.2%
-10.5%
-11.8%
-3.4%
-10.6%
-6.6%
-15.8%
-4.5%
-16.8%
-11.8%
-9.0%
-5.7%
-9.3%
-17% to -12%
-12% to -8%
-8% to 0%
0% to 5%
5% to 13%
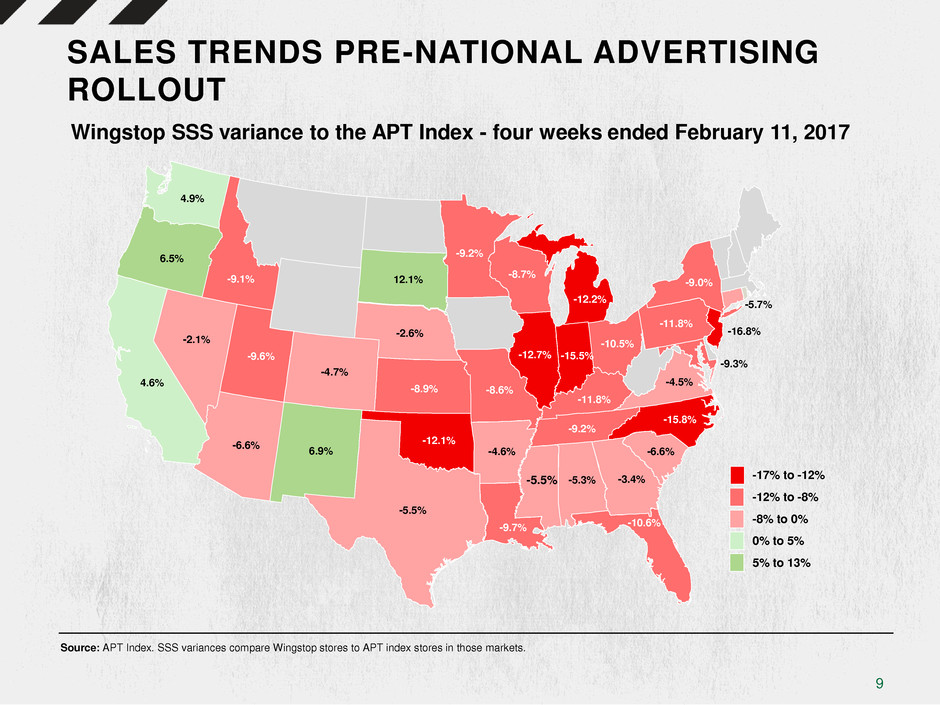
Wingstop SSS variance to the APT Index - four weeks ended February 11, 2017
SALES TRENDS PRE-NATIONAL ADVERTISING
ROLLOUT
Source: APT Index. SSS variances compare Wingstop stores to APT index stores in those markets.
10
7.1%
30.9%
1.7%
11.4%
11.9%
27.4%
3.0%
7.9%
10.9%
4.3%
11.1%
1.0%
7.5%
10.6%
30.4%
17.0%
55.3%
8.3%
17.9%
6.7%
14.2%
7.9%
11.4%
9.8%
22.9% 23.6%
17.3%
32.6%
32.9%
7.2%
4.6%
25.4%
16.4%
27.3%
9.5%
22.8%
1.5%
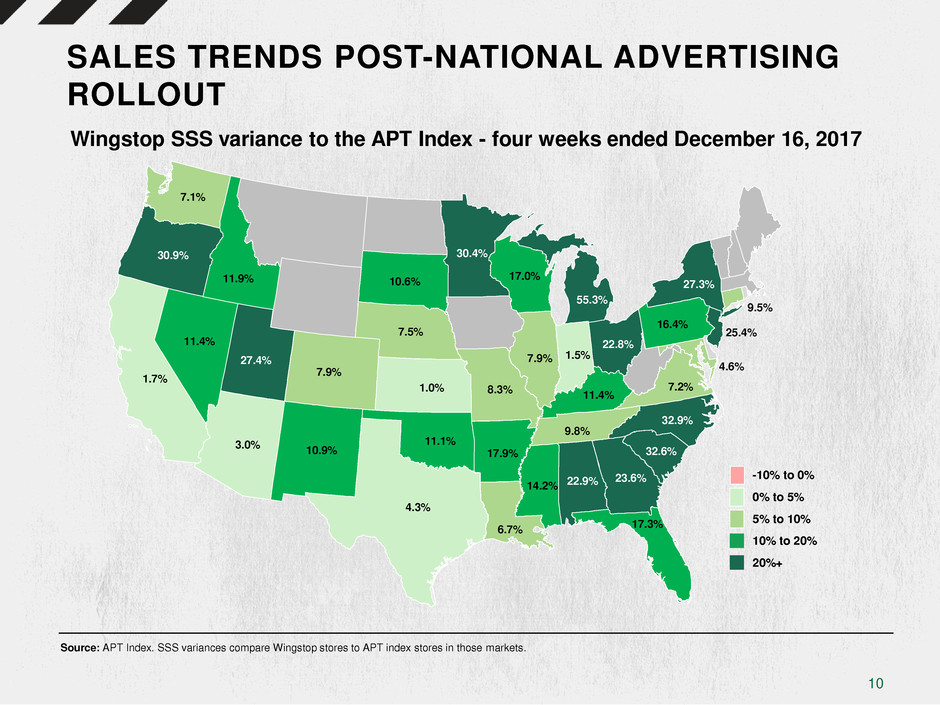
Wingstop SSS variance to the APT Index - four weeks ended December 16, 2017
SALES TRENDS POST-NATIONAL ADVERTISING
ROLLOUT
Source: APT Index. SSS variances compare Wingstop stores to APT index stores in those markets.
-10% to 0%
0% to 5%
5% to 10%
10% to 20%
20%+
11
DELIVERY
12
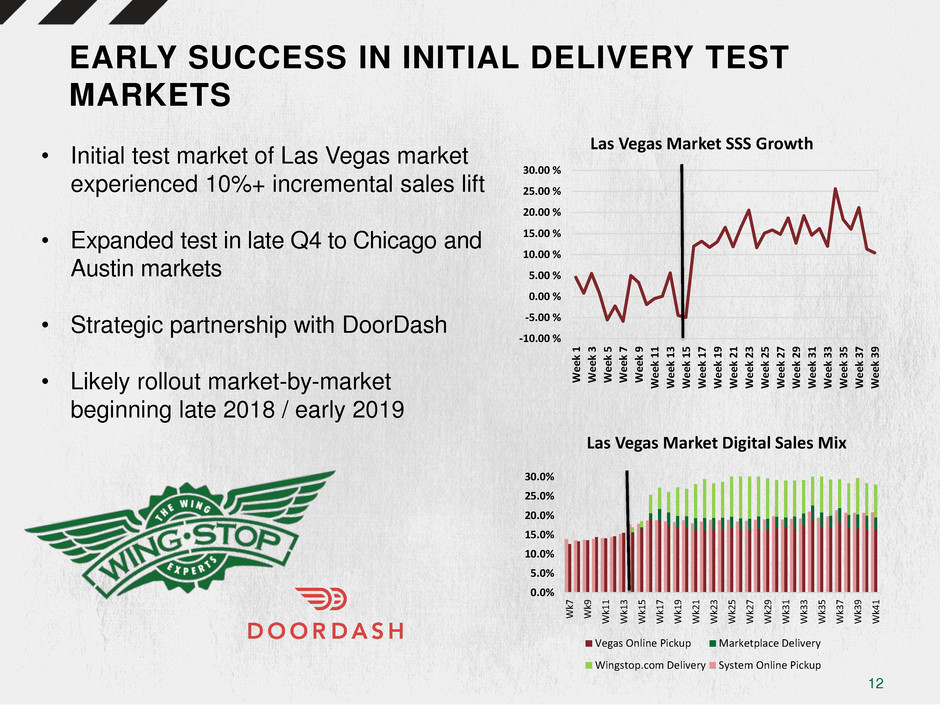
• Initial test market of Las Vegas market
experienced 10%+ incremental sales lift
• Expanded test in late Q4 to Chicago and
Austin markets
• Strategic partnership with DoorDash
• Likely rollout market-by-market
beginning late 2018 / early 2019
EARLY SUCCESS IN INITIAL DELIVERY TEST
MARKETS
-10.00 %
-5.00 %
0.00 %
5.00 %
10.00 %
15.00 %
20.00 %
25.00 %
30.00 %
W
e
ek
1
W
e
ek
3
W
e
ek
5
W
e
ek
7
W
e
ek
9
W
e
ek 1
1
W
e
ek 1
3
W
e
ek 1
5
W
e
ek 1
7
W
e
ek 1
9
W
e
ek 2
1
W
e
ek 2
3
W
e
ek 2
5
W
e
ek 2
7
W
e
ek 2
9
W
e
ek 3
1
W
e
ek 3
3
W
e
ek 3
5
W
e
ek 3
7
W
e
ek 3
9
Las Vegas Market SSS Growth
0.0%
5.0%
10.0%
15.0%
20.0%
25.0%
30.0%
W
k7
W
k9
W
k1
1
W
k1
3
W
k1
5
W
k1
7
W
k1
9
W
k2
1
W
k2
3
W
k2
5
W
k2
7
W
k2
9
W
k3
1
W
k3
3
W
k3
5
W
k3
7
W
k3
9
W
k4
1
Las Vegas Market Digital Sales Mix
Vegas Online Pickup Marketplace Delivery
Wingstop.com Delivery System Online Pickup

13
DIGITAL
14
16%
17%
18%
19%
20%
21%
22%
-
50
100
150
200
250
300
350
2016
Q3
2016
Q4
2017
Q1
2017
Q2
2017
Q3
T
o
tal
O
n
line
S
al
e
s
%
S
to
re
C
o
u
n
t
Less than 10% Between 10-15% Between 15-20%
Between 20-25% Greater than 25% Total Digital Sales %
POISED FOR CONTINUED DIGITAL GROWTH
Sources:
(1) As of quarter ended 9/30/17 for Domestic restaurants.
(2) OLO.
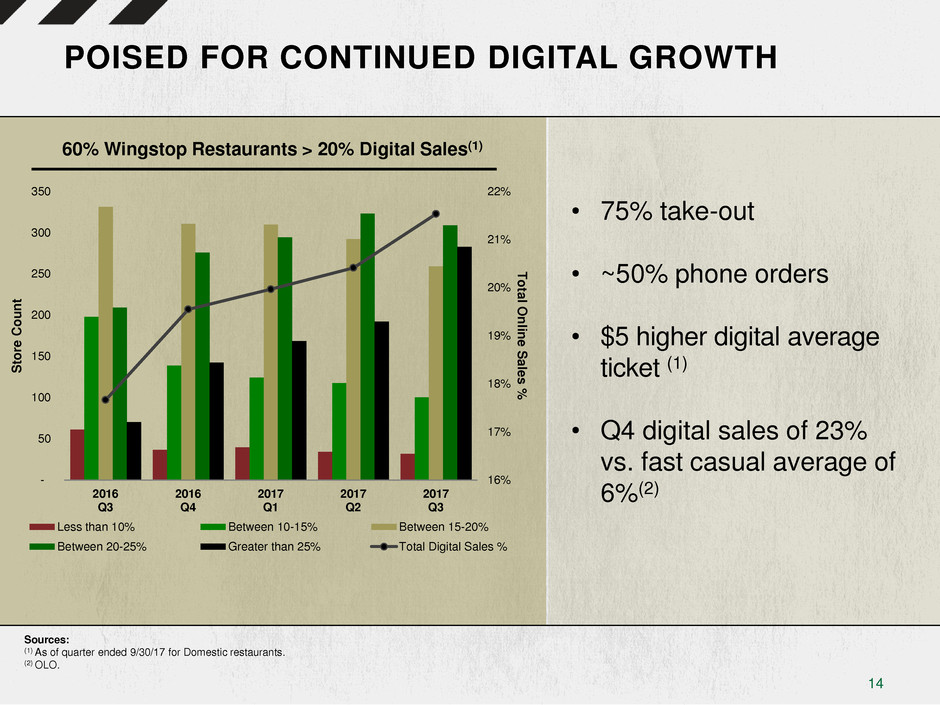
• 75% take-out
• ~50% phone orders
• $5 higher digital average
ticket (1)
• Q4 digital sales of 23%
vs. fast casual average of
6%(2)
60% Wingstop Restaurants > 20% Digital Sales(1)
15
ON OUR WAY TO BEST IN CLASS DIGITAL SALES
Sources:
(1) Q4 2016 earnings call transcript.
(2) Papa John’s Investor Presentation, Nov 2017.
(3) Q3 2017 earnings call transcript.
(4) Q4 2017 earnings call transcript.
(1) (2)
(3) (3) (3) (3)
0%
10%
20%
30%
40%
50%
60%
(4)
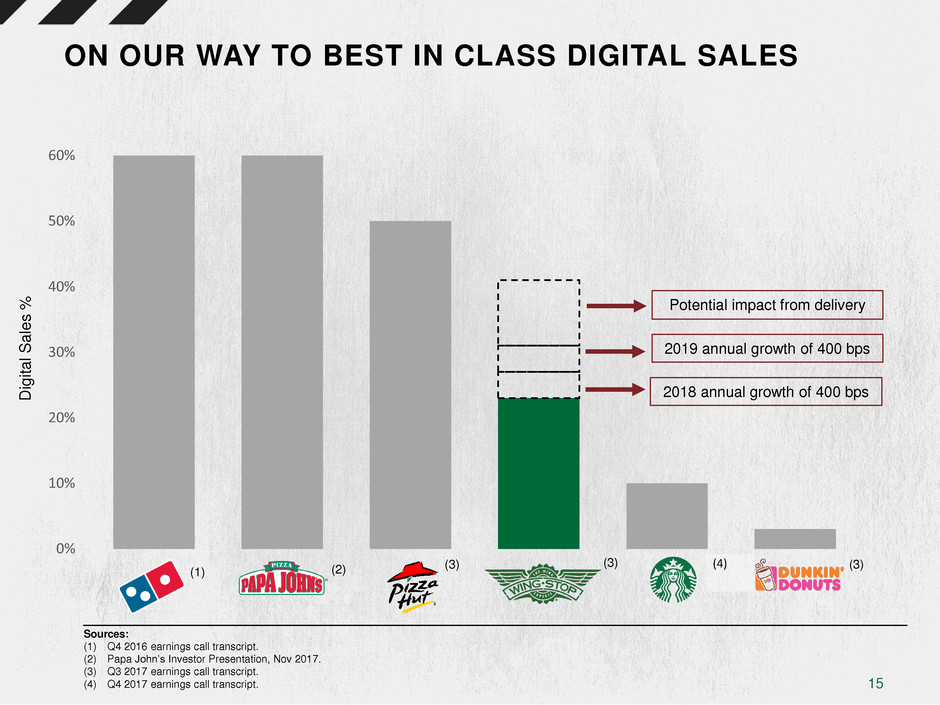
Potential impact from delivery
2019 annual growth of 400 bps
2018 annual growth of 400 bps D
ig
ita
l S
a
les
%

16
MEETING DIGITAL GUESTS WHERE THEY ARE
First to launch:
• Bot technology and
customizable ordering on
Facebook Messenger, Twitter
and Amazon Alexa
• Order directly from your GM
vehicle via OnStar Marketplace
17
INTERNATIONAL
18
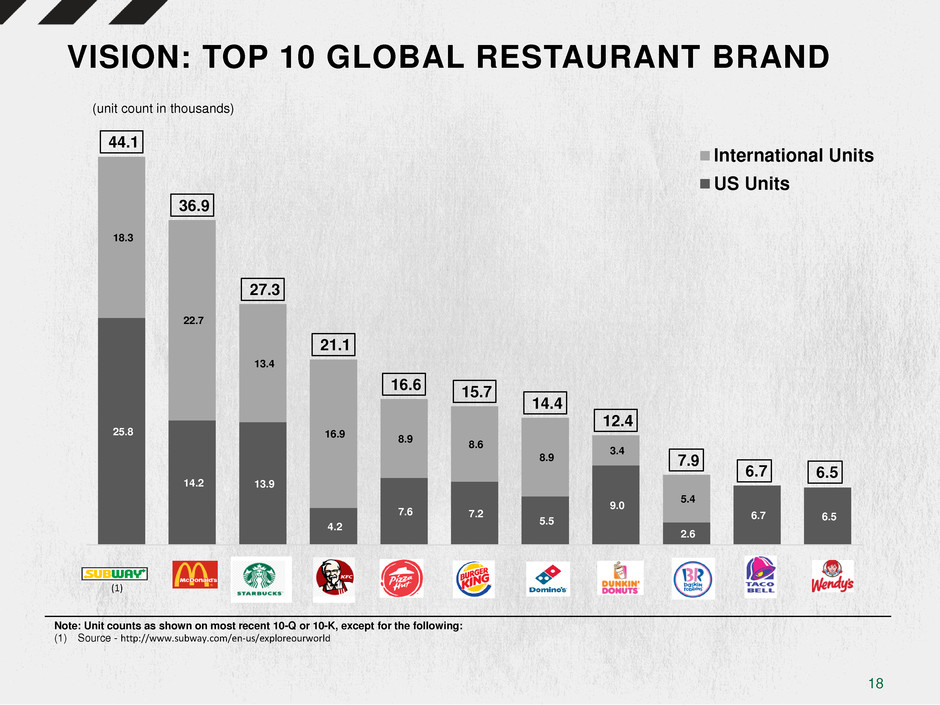
VISION: TOP 10 GLOBAL RESTAURANT BRAND
Note: Unit counts as shown on most recent 10-Q or 10-K, except for the following:
(1) Source - http://www.subway.com/en-us/exploreourworld
25.8
14.2 13.9
4.2
7.6 7.2
5.5
9.0
2.6
6.7 6.5
18.3
22.7
13.4
16.9 8.9
8.6
8.9
3.4
5.4
44.1
36.9
27.3
21.1
16.6 15.7
14.4
12.4
7.9
6.7 6.5
1 2 3 4 5 6 7 8 9 10 11
International Units
US Units
(1)
(unit count in thousands)
19
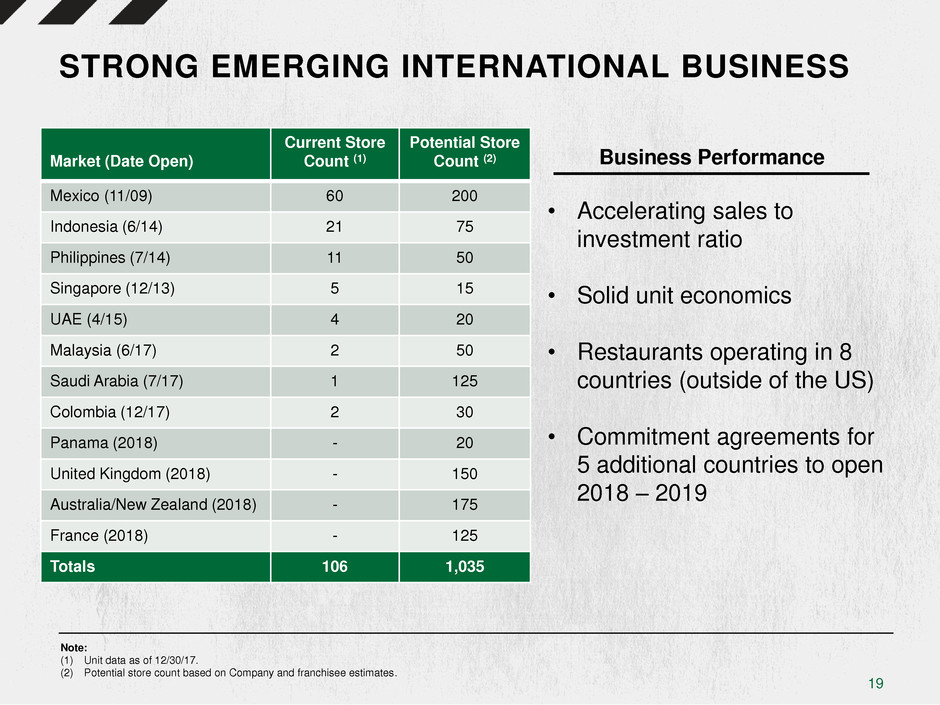
STRONG EMERGING INTERNATIONAL BUSINESS
Market (Date Open)
Current Store
Count (1)
Potential Store
Count (2)
Mexico (11/09) 60 200
Indonesia (6/14) 21 75
Philippines (7/14) 11 50
Singapore (12/13) 5 15
UAE (4/15) 4 20
Malaysia (6/17) 2 50
Saudi Arabia (7/17) 1 125
Colombia (12/17) 2 30
Panama (2018) - 20
United Kingdom (2018) - 150
Australia/New Zealand (2018) - 175
France (2018) - 125
Totals 106 1,035
Business Performance
• Accelerating sales to
investment ratio
• Solid unit economics
• Restaurants operating in 8
countries (outside of the US)
• Commitment agreements for
5 additional countries to open
2018 – 2019
Note:
(1) Unit data as of 12/30/17.
(2) Potential store count based on Company and franchisee estimates.

20
COMPELLING SSS GROWTH AND UNIT LEVEL
ECONOMICS
4.9%
11.2%
13.4%
3.9%
15.3%
9.9%
2012 2013 2014 2015 2016 2017
International SSS(1) Momentum
Market
Sales to
Investment
Ratio (2)
Mexico 2.0:1
Indonesia 2.0:1
Philippines 1.5:1
Singapore 3.5:1
UAE 1.5:1
Malaysia 4.0:1
Saudi Arabia 2.0:1
United States 3.0:1
Solid Unit Level Economics
Note:
(1) International sales exclude the impact of foreign currency exchange rate changes.
(2) Sales to investment ratio is based on fiscal 2017 sales / avg. investment cost as reported by the franchisee.
6th Consecutive Year of Positive
SSS Growth
21
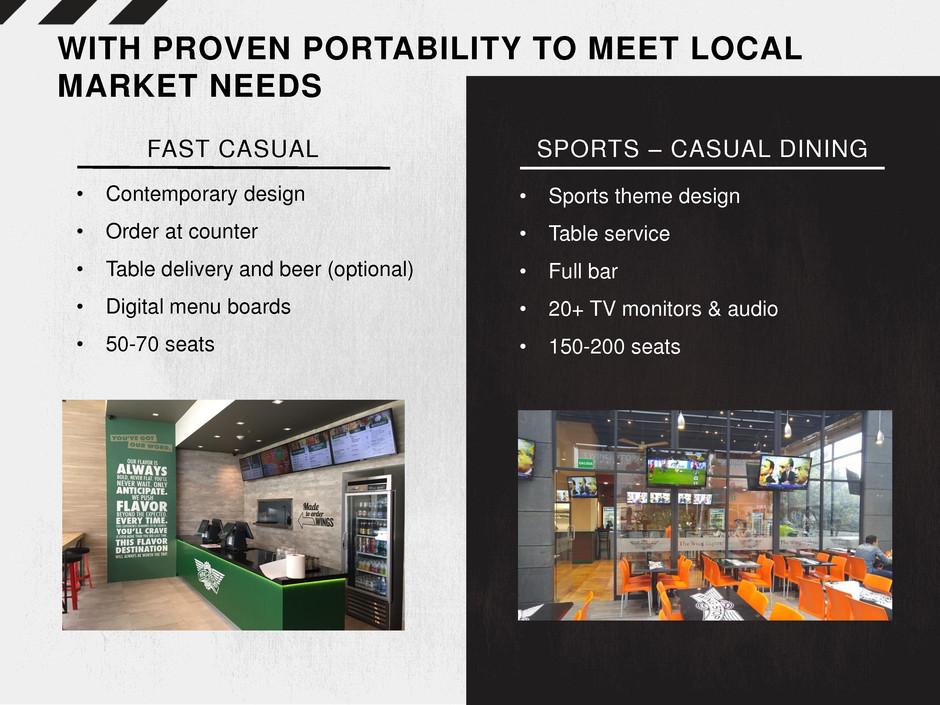
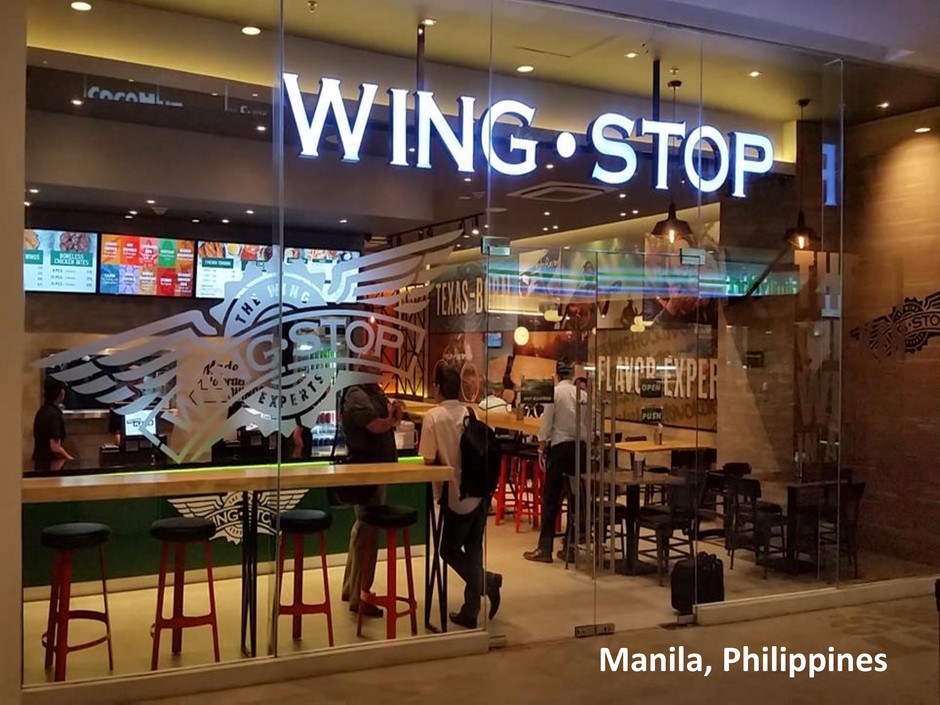
FAST CASUAL SPORTS – CASUAL DINING
• Contemporary design
• Order at counter
• Table delivery and beer (optional)
• Digital menu boards
• 50-70 seats
• Sports theme design
• Table service
• Full bar
• 20+ TV monitors & audio
• 150-200 seats
WITH PROVEN PORTABILITY TO MEET LOCAL
MARKET NEEDS
22
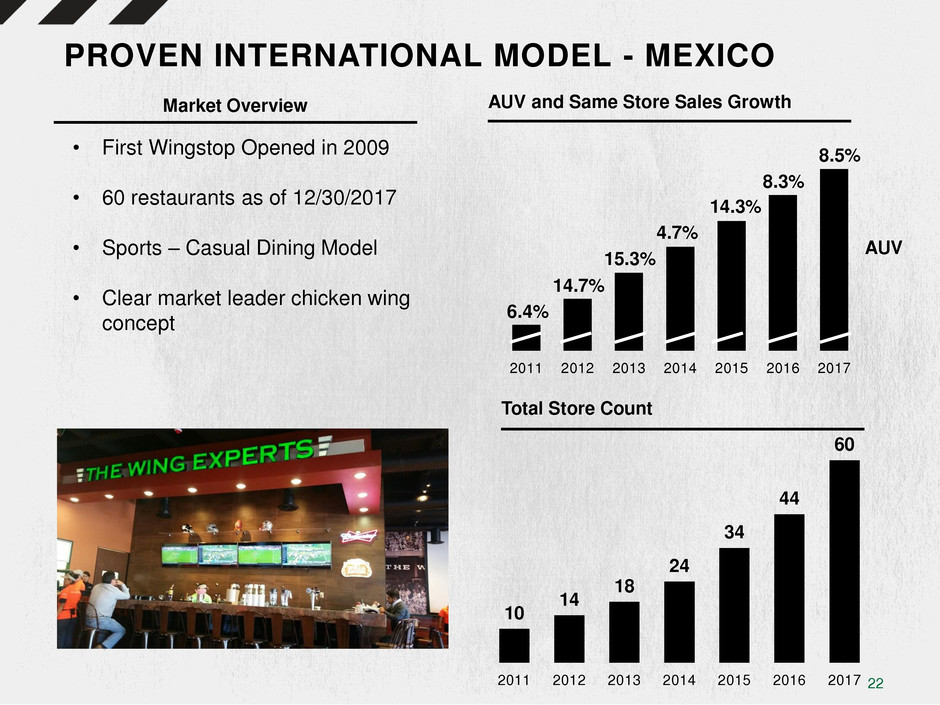
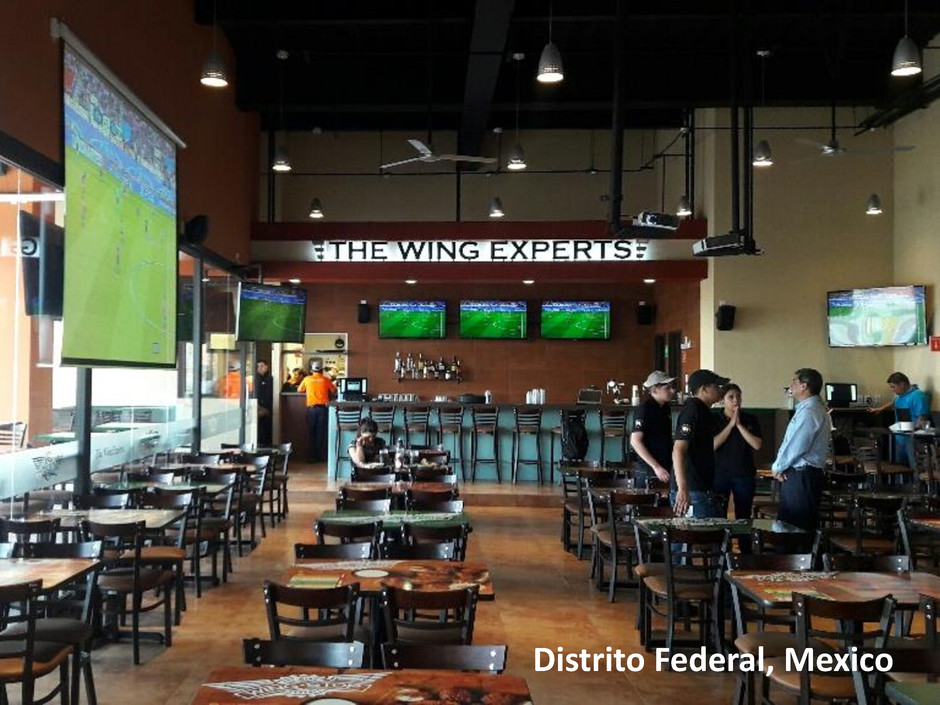
• First Wingstop Opened in 2009
• 60 restaurants as of 12/30/2017
• Sports – Casual Dining Model
• Clear market leader chicken wing
concept
10
14
18
24
34
44
60
2011 2012 2013 2014 2015 2016 2017
2011 2012 2013 2014 2015 2016 2017
PROVEN INTERNATIONAL MODEL - MEXICO
Total Store Count
AUV and Same Store Sales Growth Market Overview
6.4%
14.7%
15.3%
4.7%
14.3%
8.3%
8.5%
AUV
23
5
10
15
21
2014 2015 2016 2017
2015 2016 2017
PROVEN INTERNATIONAL MODEL - INDONESIA
Total Store Count
AUV and Same Store Sales Growth
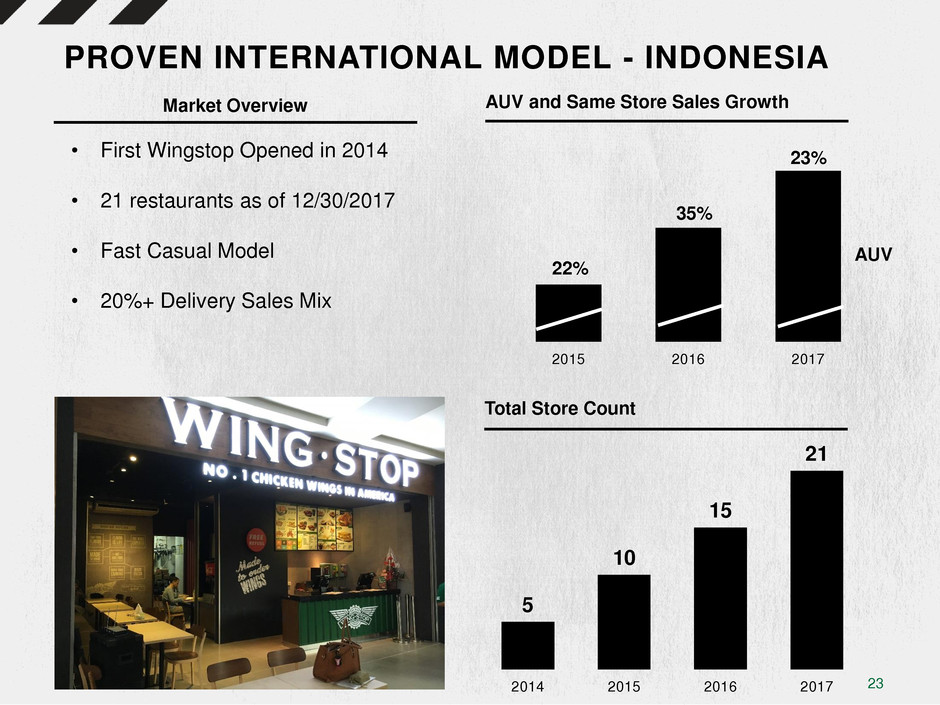
• First Wingstop Opened in 2014
• 21 restaurants as of 12/30/2017
• Fast Casual Model
• 20%+ Delivery Sales Mix
22%
35%
23%
AUV
Market Overview
24
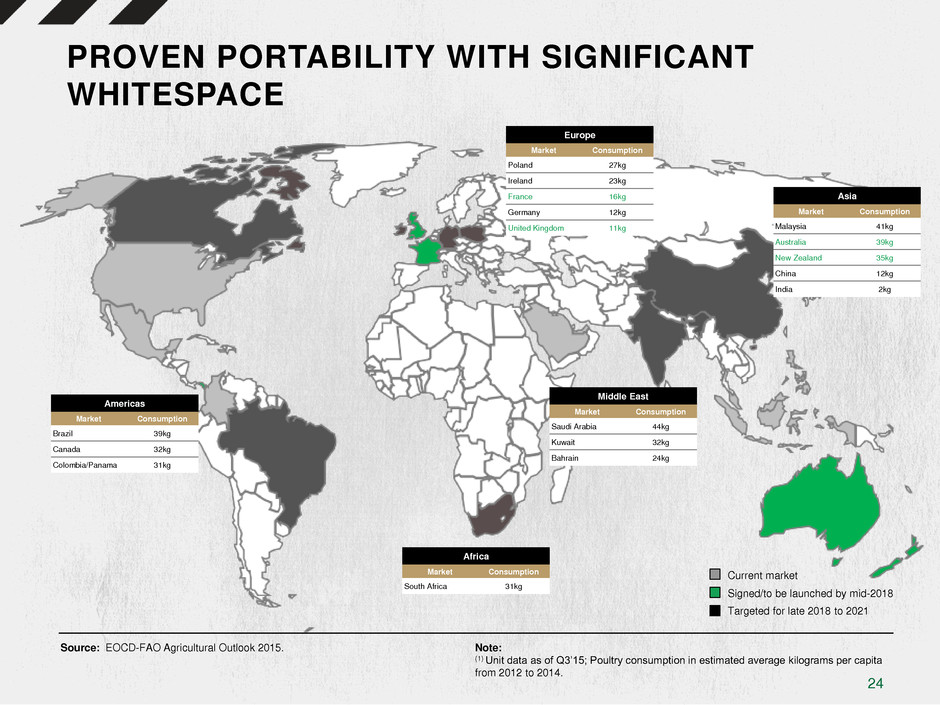
Americas
Market Consumption
Brazil 39kg
Canada 32kg
Colombia/Panama 31kg
PROVEN PORTABILITY WITH SIGNIFICANT
WHITESPACE
Source: EOCD-FAO Agricultural Outlook 2015.
Note:
(1) Unit data as of Q3’15; Poultry consumption in estimated average kilograms per capita
from 2012 to 2014.
Signed/to be launched by mid-2018
Targeted for late 2018 to 2021
Current market
Africa
Market Consumption
South Africa 31kg
Asia
Market Consumption
Malaysia 41kg
Australia 39kg
New Zealand 35kg
China 12kg
India 2kg
Europe
Market Consumption
Poland 27kg
Ireland 23kg
France 16kg
Germany 12kg
United Kingdom 11kg
Middle East
Market Consumption
Saudi Arabia 44kg
Kuwait 32kg
Bahrain 24kg

25
Distrito Federal, Mexico
26
Distrito Federal, Mexico
27
Manila, Philippines
28
LONG-TERM GROWTH DRIVERS
National Advertising
Digital Expansion
Delivery
International
29
53
64
82
118
139
115 4
10
20
24
20
32
57
74
102
142
159
147
2012 2013 2014 2015 2016 2017
Domestic International
274
363
503 530 518
445
107
136
268 249
359
596
381
499
771 779
877
1041
2012 2013 2014 2015 2016 2017
Domestic International
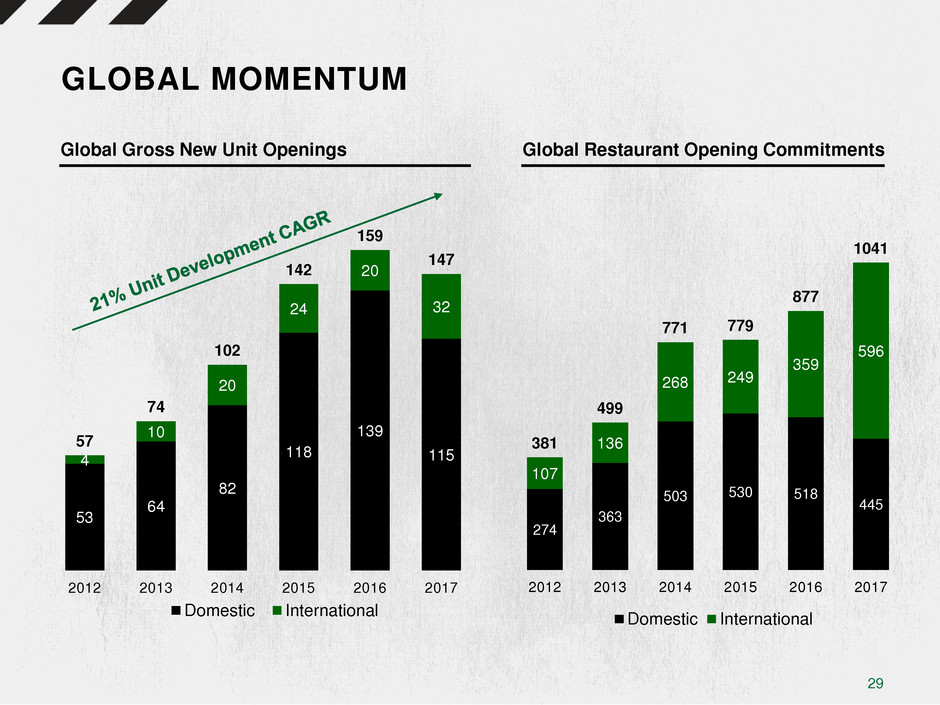
GLOBAL MOMENTUM
Global Gross New Unit Openings Global Restaurant Opening Commitments
30
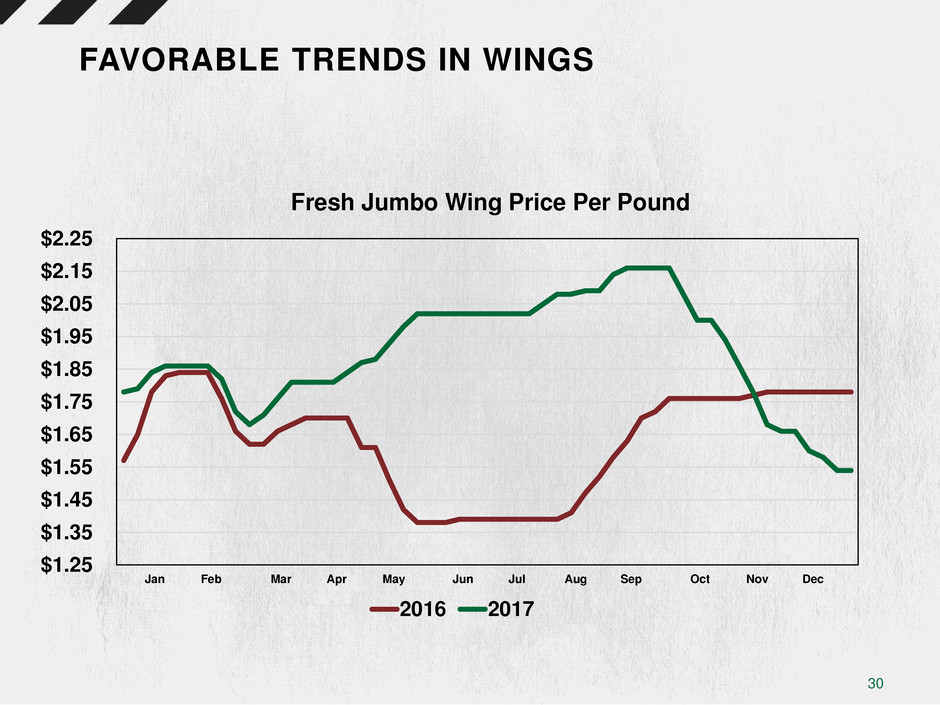
FAVORABLE TRENDS IN WINGS
Fresh Jumbo Wing Price Per Pound
$1.25
$1.35
$1.45
$1.55
$1.65
$1.75
$1.85
$1.95
$2.05
$2.15
$2.25
Jan Feb Mar Apr May Jun Jul Aug Sep Oct Nov Dec
2016 2017
31
Franchisee Year 2
Target(1)
Domestic System
Average(4)
Unit Economics
AUV $890k $1.1M
Investment Cost(2) $370k
Unlevered Year 2 COC Return(3) 35%-40% 50%+
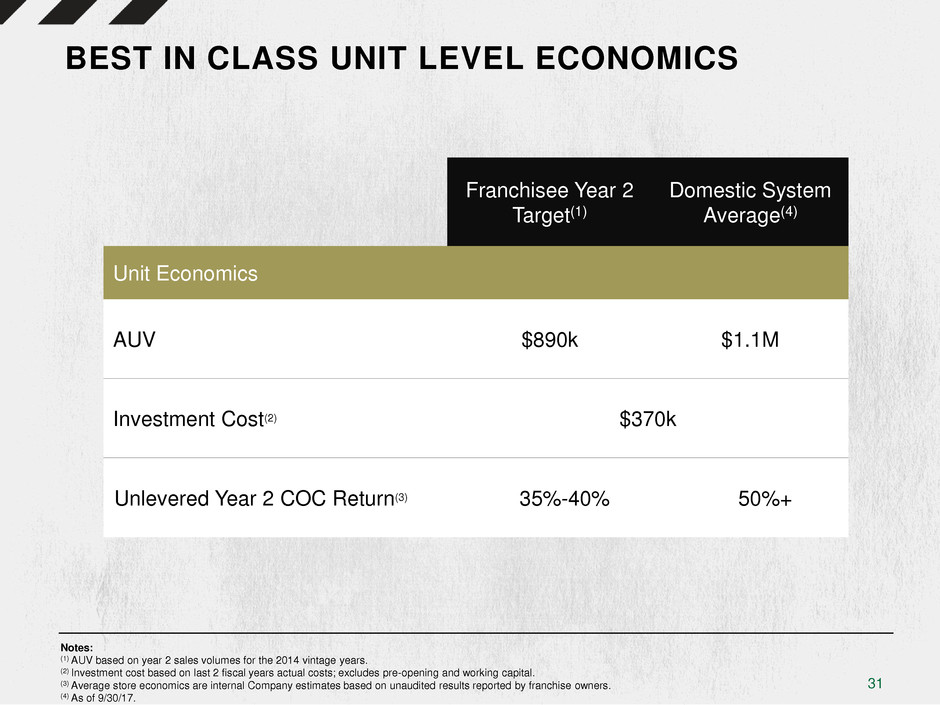
BEST IN CLASS UNIT LEVEL ECONOMICS
Notes:
(1) AUV based on year 2 sales volumes for the 2014 vintage years.
(2) Investment cost based on last 2 fiscal years actual costs; excludes pre-opening and working capital.
(3) Average store economics are internal Company estimates based on unaudited results reported by franchise owners.
(4) As of 9/30/17.
32
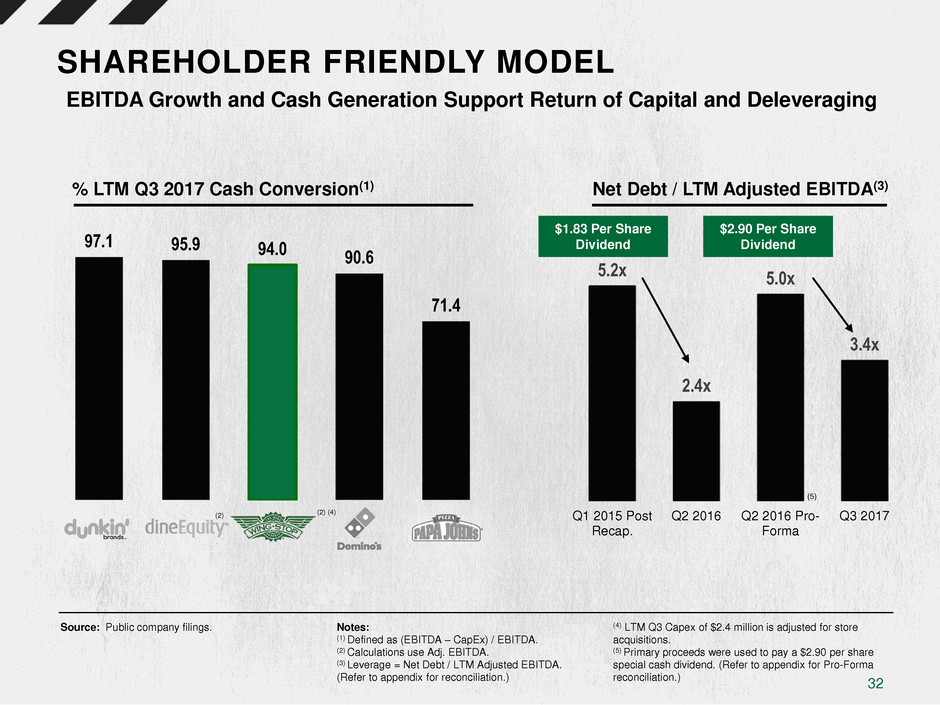
5.2x
2.4x
5.0x
3.4x
Q1 2015 Post
Recap.
Q2 2016 Q2 2016 Pro-
Forma
Q3 2017
97.1 95.9 94.0 90.6
71.4
EBITDA Growth and Cash Generation Support Return of Capital and Deleveraging
(5)
$1.83 Per Share
Dividend
(2) (2) (4)
% LTM Q3 2017 Cash Conversion(1)
$2.90 Per Share
Dividend
Net Debt / LTM Adjusted EBITDA(3)
SHAREHOLDER FRIENDLY MODEL
Source: Public company filings.
Notes:
(1) Defined as (EBITDA – CapEx) / EBITDA.
(2) Calculations use Adj. EBITDA.
(3) Leverage = Net Debt / LTM Adjusted EBITDA.
(Refer to appendix for reconciliation.)
(4)
LTM Q3 Capex of $2.4 million is adjusted for store
acquisitions.
(5) Primary proceeds were used to pay a $2.90 per share
special cash dividend. (Refer to appendix for Pro-Forma
reconciliation.)
33
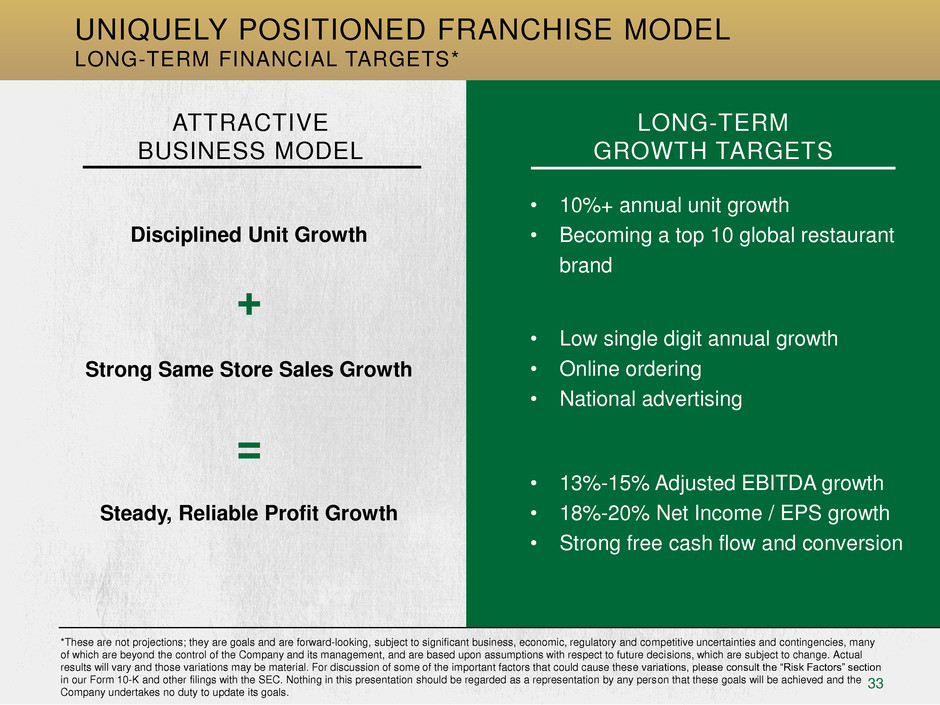
Disciplined Unit Growth
Strong Same Store Sales Growth
Steady, Reliable Profit Growth
+
=
ATTRACTIVE
BUSINESS MODEL
LONG-TERM
GROWTH TARGETS
UNIQUELY POSITIONED FRANCHISE MODEL
LONG-TERM FINANCIAL TARGETS*
*These are not projections; they are goals and are forward-looking, subject to significant business, economic, regulatory and competitive uncertainties and contingencies, many
of which are beyond the control of the Company and its management, and are based upon assumptions with respect to future decisions, which are subject to change. Actual
results will vary and those variations may be material. For discussion of some of the important factors that could cause these variations, please consult the “Risk Factors” section
in our Form 10-K and other filings with the SEC. Nothing in this presentation should be regarded as a representation by any person that these goals will be achieved and the
Company undertakes no duty to update its goals.
• 10%+ annual unit growth
• Becoming a top 10 global restaurant
brand
• Low single digit annual growth
• Online ordering
• National advertising
• 13%-15% Adjusted EBITDA growth
• 18%-20% Net Income / EPS growth
• Strong free cash flow and conversion
34
APPENDIX
35
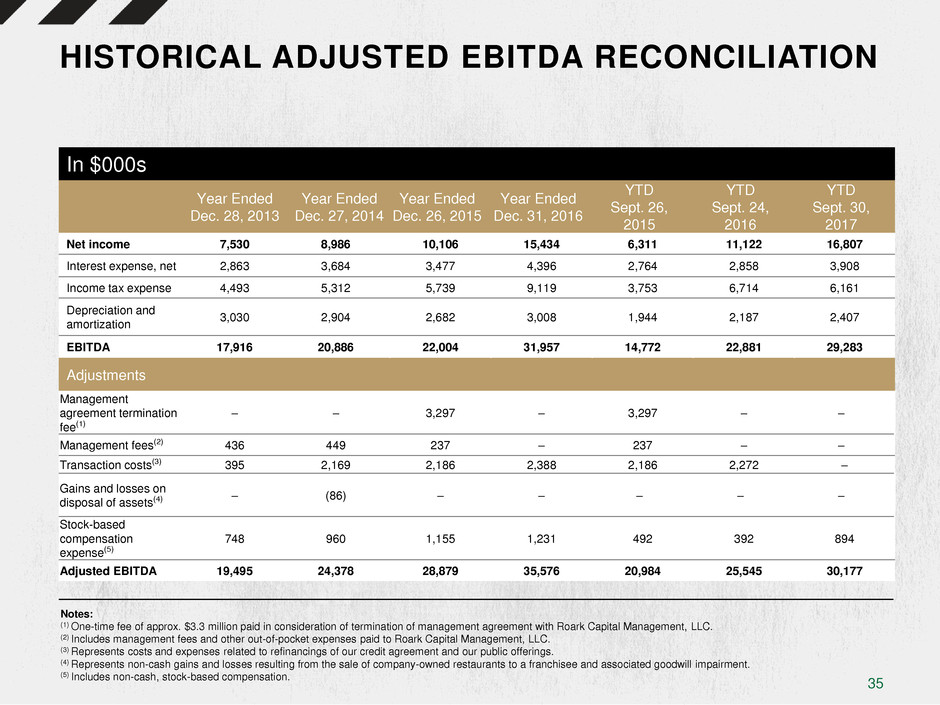
(1) In $000s
Year Ended
Dec. 28, 2013
Year Ended
Dec. 27, 2014
Year Ended
Dec. 26, 2015
Year Ended
Dec. 31, 2016
YTD
Sept. 26,
2015
YTD
Sept. 24,
2016
YTD
Sept. 30,
2017
Net income 7,530 8,986 10,106 15,434 6,311 11,122 16,807
Interest expense, net 2,863 3,684 3,477 4,396 2,764 2,858 3,908
Income tax expense 4,493 5,312 5,739 9,119 3,753 6,714 6,161
Depreciation and
amortization 3,030 2,904 2,682 3,008 1,944 2,187 2,407
EBITDA 17,916 20,886 22,004 31,957 14,772 22,881 29,283
Adjustments
Management
agreement termination
fee(1)
– – 3,297 – 3,297 – –
Management fees(2) 436 449 237 – 237 – –
Transaction costs(3) 395 2,169 2,186 2,388 2,186 2,272 –
Gains and losses on
disposal of assets(4) – (86) –
–
–
– –
Stock-based
compensation
expense(5)
748 960 1,155 1,231 492 392 894
Adjusted EBITDA 19,495 24,378 28,879 35,576 20,984 25,545 30,177
HISTORICAL ADJUSTED EBITDA RECONCILIATION
Notes:
(1) One-time fee of approx. $3.3 million paid in consideration of termination of management agreement with Roark Capital Management, LLC.
(2) Includes management fees and other out-of-pocket expenses paid to Roark Capital Management, LLC.
(3) Represents costs and expenses related to refinancings of our credit agreement and our public offerings.
(4) Represents non-cash gains and losses resulting from the sale of company-owned restaurants to a franchisee and associated goodwill impairment.
(5) Includes non-cash, stock-based compensation.
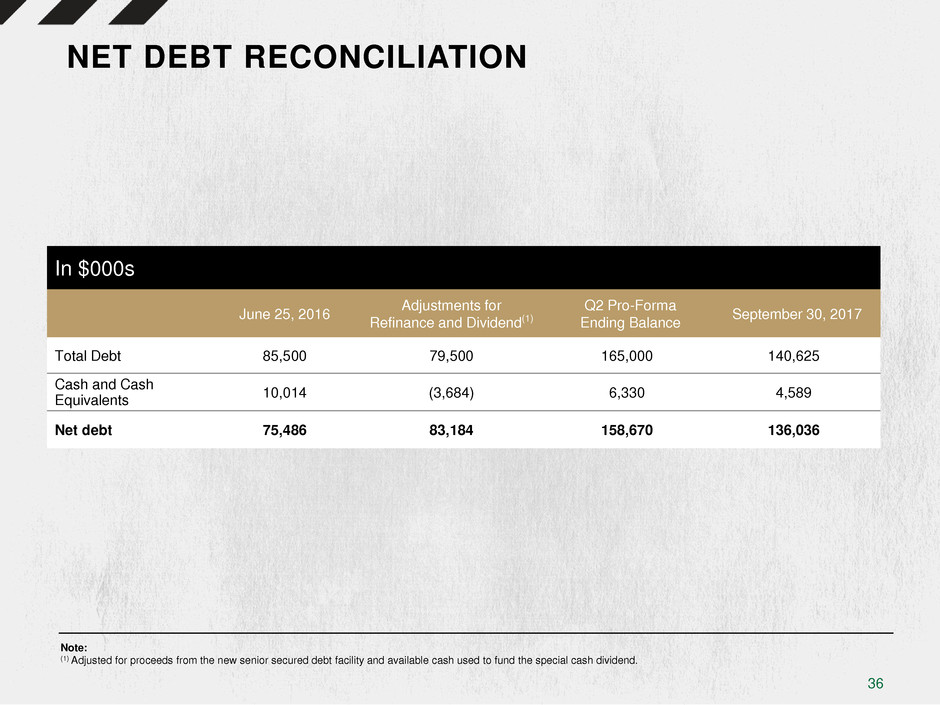
36
In $000s
June 25, 2016 Adjustments for Refinance and Dividend(1)
Q2 Pro-Forma
Ending Balance September 30, 2017
Total Debt 85,500 79,500 165,000 140,625
Cash and Cash
Equivalents 10,014 (3,684) 6,330 4,589
Net debt 75,486 83,184 158,670 136,036
NET DEBT RECONCILIATION
Note:
(1) Adjusted for proceeds from the new senior secured debt facility and available cash used to fund the special cash dividend.
