Attached files
| file | filename |
|---|---|
| EX-3.1 - EXHIBIT 3.1 - MPLX LP | ex31secondamended.htm |
| 8-K - 8-K - MPLX LP | mplx8-kjan8.htm |

UBS Midstream & MLP
Conference
January 2018

Forward‐Looking Statements
This presentation contains forward-looking statements within the meaning of federal securities laws regarding MPLX LP (“MPLX”) and Marathon Petroleum Corporation (“MPC”). These forward-looking statements relate to, among
other things, expectations, estimates and projections concerning the business and operations of MPLX and MPC, including proposed strategic initiatives and our value creation plans. You can identify forward-looking statements by
words such as “anticipate,” “believe,” “design,” “estimate,” “expect,” “forecast,” “goal,” “guidance,” “imply,” “intend,” “ob jective,” “opportunity,” “outlook,” “plan,” “position,” “pursue,” “prospective,” “predict,” “project,” “potential,” “seek,”
“strategy,” “target,” “could,” “may,” “should,” “would,” “will” or other similar expressions that convey the uncertainty of future events or outcomes. Such forward-looking statements are not guarantees of future performance and are
subject to risks, uncertainties and other factors, some of which are beyond the companies’ control and are difficult to predict. Factors that could cause MPLX’s actual results to differ materially from those implied in the forward-looking
statements include: negative capital market conditions, including an increase of the current yield on common units, adversely affecting MPLX’s ability to meet its distribution growth guidance; the time, costs and ability to obtain
regulatory or other approvals and consents and otherwise consummate the strategic initiatives discussed herein and other proposed transactions; the satisfaction or waiver of conditions in the agreements governing the strategic
initiatives discussed herein and other proposed transactions; our ability to achieve the strategic and other objectives related to the strategic initiatives discussed herein and other proposed transactions; adverse changes in laws
including with respect to tax and regulatory matters; the adequacy of MPLX’s capital resources and liquidity, including, but not limited to, availability of sufficient cash flow to pay distributions and access to debt to fund anticipated
dropdowns on commercially reasonable terms, and the ability to successfully execute its business plans and growth strategy; the timing and extent of changes in commodity prices and demand for crude oil, refined products,
feedstocks or other hydrocarbon-based products; continued/further volatility in and/or degradation of market and industry conditions; changes to the expected construction costs and timing of projects; completion of midstream
infrastructure by competitors; disruptions due to equipment interruption or failure, including electrical shortages and power grid failures; the suspension, reduction or termination of MPC’s obligations under MPLX’s commercial
agreements; modifications to earnings and distribution growth objectives; the level of support from MPC, including dropdowns, alternative financing arrangements, taking equity units, and other methods of sponsor support, as a result
of the capital allocation needs of the enterprise as a whole and its ability to provide support on commercially reasonable terms; compliance with federal and state environmental, economic, health and safety, energy and other policies
and regulations and/or enforcement actions initiated thereunder; adverse results in litigation; changes to MPLX’s capital budget; other risk factors inherent to MPLX’s industry; and the factors set forth under the heading “Risk Factors”
in MPLX’s Annual Report on Form 10-K for the year ended Dec. 31, 2016, filed with the Securities and Exchange Commission (SEC). Factors that could cause MPC’s actual results to differ materially from those implied in the forward-
looking statements include: the time, costs and ability to obtain regulatory or other approvals and consents and otherwise consummate the strategic initiatives discussed herein; the satisfaction or waiver of conditions in the
agreements governing the strategic initiatives discussed herein; our ability to achieve the strategic and other objectives related to the strategic initiatives discussed herein; our ability to manage disruptions in credit markets or changes
to our credit rating; adverse changes in laws including with respect to tax and regulatory matters; changes to the expected construction costs and timing of projects; continued/further volatility in and/or degradation of market and
industry conditions; the availability and pricing of crude oil and other feedstocks; slower growth in domestic and Canadian crude supply; the effects of the lifting of the U.S. crude oil export ban; completion of pipeline capacity to areas
outside the U.S. Midwest; consumer demand for refined products; transportation logistics; the reliability of processing units and other equipment; MPC’s ability to successfully implement growth opportunities; the impact of adverse
market conditions affecting MPLX’s midstream business; modifications to MPLX earnings and distribution growth objectives, and other risks described above with respect to MPLX; compliance with federal and state environmental,
economic, health and safety, energy and other policies and regulations, including the cost of compliance with the Renewable Fuel Standard, and/or enforcement actions initiated thereunder; adverse results in litigation; changes to
MPC’s capital budget; other risk factors inherent to MPC’s industry; and the factors set forth under the heading “Risk Factors” in MPC’s Annual Report on Form 10-K for the year ended Dec. 31, 2016, filed with the SEC. In addition,
the forward-looking statements included herein could be affected by general domestic and international economic and political conditions. Unpredictable or unknown factors not discussed here, in MPLX’s Form 10-K or in MPC’s Form
10-K could also have material adverse effects on forward-looking statements. Copies of MPLX’s Form 10-K are available on the SEC website, MPLX’s website at http://ir.mplx.com or by contacting MPLX’s Investor Relations office.
Copies of MPC’s Form 10-K are available on the SEC website, MPC’s website at http://ir.marathonpetroleum.com or by contacting MPC’s Investor Relations office.
Non-GAAP Financial Measures
Adjusted EBITDA, distributable cash flow (DCF) and distribution coverage ratio are non-GAAP financial measures provided in this presentation. Adjusted EBITDA and DCF reconciliations to the nearest GAAP financial measure are
included in the Appendix to this presentation. Adjusted EBITDA with respect to the joint-interest acquisition is calculated as cash distributions adjusted for maintenance capital, growth capital and financing activities. Distribution
coverage ratio is the ratio of DCF attributable to GP and LP unitholders to total GP and LP distributions declared. Adjusted EBITDA, DCF and distribution coverage ratio are not defined by GAAP and should not be considered in
isolation or as an alternative to net income attributable to MPLX, net cash provided by operating activities or other financial measures prepared in accordance with GAAP. The EBITDA forecasts related to certain projects were
determined on an EBITDA-only basis. Accordingly, information related to the elements of net income, including tax and interest, are not available and, therefore, reconciliations of these non-GAAP financial measures to the nearest
GAAP financial measures have not been provided.
2

Key Investment Highlights
Diversified large-cap MLP positioned to deliver attractive returns over the long term
Forecast distribution growth of ~12% for 2017 and ~10% for 2018
Gathering &
Processing
Logistics &
Storage
Stable Cash Flows
Cost of Capital
Optimization
• Largest processor and fractionator in the Marcellus/Utica basins
• Strong footprint in STACK play and growing presence in Permian basin
• Supports extensive operations of second-largest U.S. refiner
• Expanding third-party business and delivering industry solutions
• Substantial fee-based income with limited commodity exposure
• Long-term relationships with diverse set of producer customers
• Transportation and storage agreements with sponsor MPC
• Visibility to growth through robust portfolio of organic projects and strong coverage ratio
• Exchange of IDRs for MPLX LP units planned
• Anticipate no issuance of public equity to fund organic growth capital in 2018
3

Strategic Actions to Enhance Unitholder Value
4
(1)Adjusted EBITDA with respect to anticipated joint-interest acquisitions is calculated as cash distributions adjusted for maintenance capital, growth capital and financing activities
(2)All transactions subject to closing conditions, including tax and regulatory clearances
Exchange for
Asset Dropdowns
MLP-qualifying EBITDA
Simplifies structure
Expected to lower cost of capital
EBITDA from asset dropdowns adds
substantial stable cash flow
Provides unique opportunity to
target strong distribution coverage
while maintaining an attractive and
sustainable distribution growth rate
for the long term
First dropdown in March
– ~$250 MM annual EBITDA
– ~8x EBITDA multiple
Second dropdown in September
– ~$138 MM annual adjusted EBITDA(1)
– ~7.6x adjusted EBITDA multiple
Executed agreement for remaining dropdown
in November – expected to close Feb. 1, 2018
– ~$1 B annual EBITDA
– ~8.1x EBITDA multiple
Executed agreement for exchange of GP
economic interests, including IDRs, in
December – expected to close Feb. 1, 2018
– 275 MM newly issued common units
– ~$10.1 B transaction value
Remaining dropdown and IDR exchange
expected to close Feb. 1, 2018
Agreement to Exchange MPC’s GP Economic Interests
Completes the announced plan
Announced Dec. 15, 2017 and expected to close Feb. 1, 2018 subject to the completion of refining
logistics assets and fuels distribution services dropdown(1)
Exchanges MPC’s GP economic interests, including IDR’s, for 275 million MPLX common units
~$10.1 B transaction value(2)
Transaction represents one of the fastest paths to accretion compared with similar GP
transactions
– Result of rapid growth of GP/IDR cash flows in status-quo scenario
5
(1)All transactions subject to closing conditions including tax and other regulatory clearances
(2)As calculated in Dec. 15, 2017 press release

Exchange Agreement – Cont’d.
Exchanges MPLX GP/IDR cash distribution requirements to MPC for limited partner unit
distributions
Expected to be accretive to MPLX distributable cash flow (“DCF”) attributable to common
unitholders on a per unit basis in the third quarter and for the full-year 2018
– Compares pre- and post-exchange on DCF per unit available to common unitholders basis
– Pre-exchange basis allocates to LP DCF the maximum amount which is distributable per partnership
agreement
• In the high splits, total excess cash flow is allocated equally to LP and GP DCF – beyond actual distributions
– Post exchange basis eliminates the fully distributed GP/IDR take which results in an increase to total cash
flow allocated to LP DCF
Supports attractive long-term distribution growth rate and lower cost of capital for MPLX
– Continue to forecast ~10% distribution growth for 2018
6
All transactions subject to closing conditions including tax and other regulatory clearances

MPC and MPLX’s Long-term Strategic Linkage
MPLX was created in 2012 to grow MPC’s midstream platform
Assets and services provided by MPLX are integral to MPC’s operations and MPC is
MPLX’s largest customer
Earnings streams for assets/businesses sold to MPLX have effectively been converted
into distribution streams
Distributions from MPLX are fundamental elements of MPC’s discretionary free cash flow
and capital resources
LP unitholders, including MPC, benefit from continued
growth in DCF and distributions from MPLX
7
MPC expects to hold MPLX units permanently

Executed Agreement for Remaining Dropdown from MPC
Assets include:
– Refining logistics assets: storage tanks, rail and truck
racks, docks, and gasoline blending and inter-battery
piping
– Fuels distribution services: scheduling and marketing
services that support MPC’s refinery and marketing
operations
Total consideration of ~$8.1 B
– $4.1 B in cash and 114 million MPLX units
– ~$1 B annual EBITDA
– Expected to be immediately accretive to MPLX’s
distributable cash flow
8
Expect to close Feb. 1, 2018

Refining Logistics Overview
9
Integrated Tank Farm Assets Supporting MPC’s Operations
Tanks
Annual EBITDA ~$400 MM Fee for Capacity Arrangement
~56 MMBBL storage Multiple rail and truck loading racks
Handle ocean- and river-going
vessels at Gulf Coast refineries and
asphalt barges at Detroit refinery
Piping to connect process units,
tank farms, terminals
Racks
Docks Gasoline Blending & Associated Piping

Fuels Distribution Overview
10
Extensive Range of Scheduling and Marketing Services that Support MPC’s Refining and Marketing Operations
Services Description
Supply and demand balancing
Third-party exchange, terminaling and storage
Bulk purchases and sale of products
Product movements coordination
Products and intermediates inventory
Marketing Services
Customer identification, evaluation and set-up
Marketing analytics and forecasting
Sale of products
Branded product marketing
Annual EBITDA ~$600 MM
Supported by MPLX logistics assets
no additional maintenance capital
Scheduling
Model is different from other Fuels Distribution models
No title to inventory
Margin risk stays with MPC
100% fee for services

Demonstrated Track Record
11
Strong Financial and Operational Results – 2017 Highlights
Delivering results
– Consistent growth in EBITDA and DCF
– On track for year-over-year distribution growth of ~12%
– Multiple quarterly volume records
Executing organic growth capital plan
– Two new processing plants and three new fractionation plants placed in service
Completed strategic acquisitions in L&S segment
– Ozark Pipeline
– Equity interest in Bakken Pipeline system
Strong financial position with investment grade credit profile
– Year-to-date September coverage ratio of 1.29x
– Leverage ratio of 3.6x at end of third quarter
– No public equity issuances in the fourth quarter
Full-year results will be announced Feb. 1, 2018
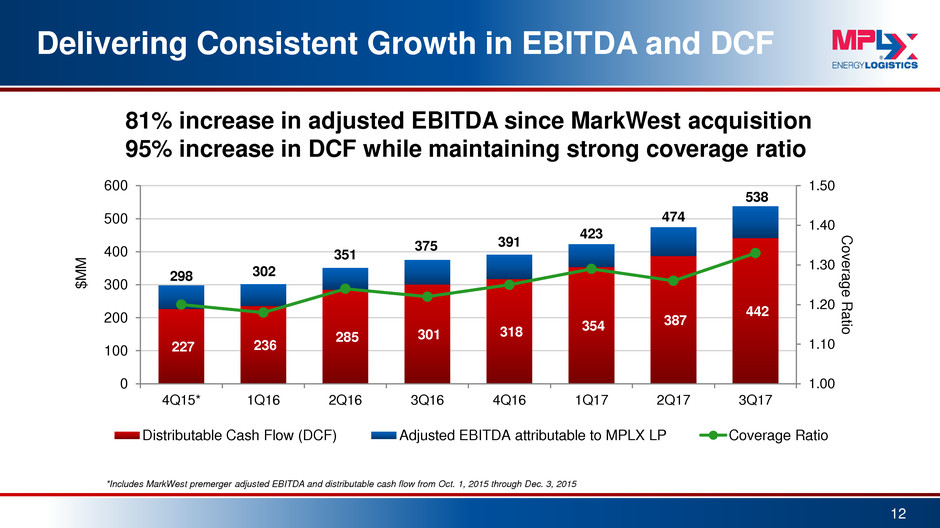
Delivering Consistent Growth in EBITDA and DCF
12
227 236
285 301 318
354 387
442
298 302
351
375 391
423
474
538
1.00
1.10
1.20
1.30
1.40
1.50
0
100
200
300
400
500
600
4Q15* 1Q16 2Q16 3Q16 4Q16 1Q17 2Q17 3Q17
C
o
vera
g
e
R
ati
o
$
M
M
Distributable Cash Flow (DCF) Adjusted EBITDA attributable to MPLX LP Coverage Ratio
81% increase in adjusted EBITDA since MarkWest acquisition
95% increase in DCF while maintaining strong coverage ratio
*Includes MarkWest premerger adjusted EBITDA and distributable cash flow from Oct. 1, 2015 through Dec. 3, 2015

Priorities for 2018
Positioning partnership through execution of strategic actions
– Expect to close remaining dropdown and IDR exchange on Feb. 1
Execution of organic growth capital plan
Deliver attractive returns for unitholders
– Forecast ~10% year-over-year distribution growth
– Expand portfolio of organic growth projects
Financing strategy
– Maintain investment grade credit profile
– Sustain strong coverage ratio
– Fund ~$2 B organic growth capital with retained cash and debt
– Anticipate no issuance of public equity to fund organic growth capital
13
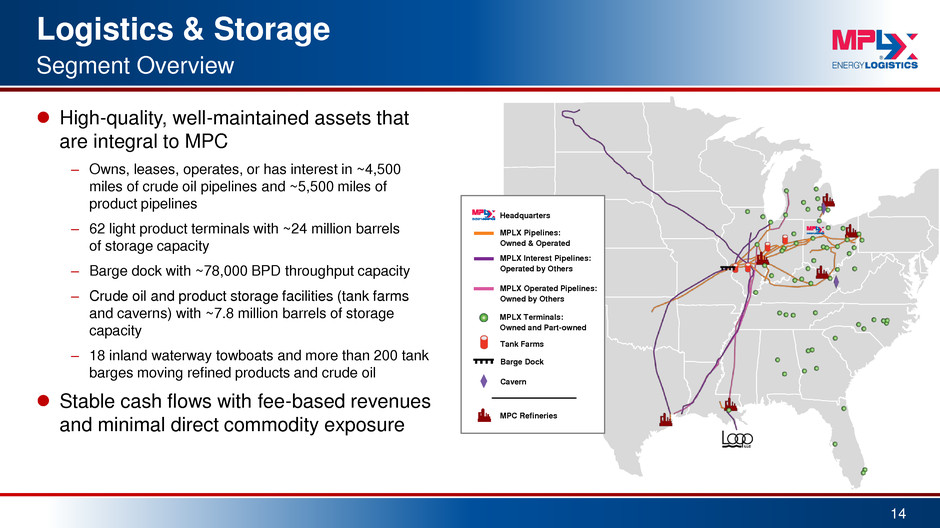
Logistics & Storage
14
Segment Overview
High-quality, well-maintained assets that
are integral to MPC
– Owns, leases, operates, or has interest in ~4,500
miles of crude oil pipelines and ~5,500 miles of
product pipelines
– 62 light product terminals with ~24 million barrels
of storage capacity
– Barge dock with ~78,000 BPD throughput capacity
– Crude oil and product storage facilities (tank farms
and caverns) with ~7.8 million barrels of storage
capacity
– 18 inland waterway towboats and more than 200 tank
barges moving refined products and crude oil
Stable cash flows with fee-based revenues
and minimal direct commodity exposure
MPC Refineries
MPLX Terminals:
Owned and Part-owned
Tank Farms
MPLX Pipelines:
Owned & Operated
MPLX Interest Pipelines:
Operated by Others
Cavern
Barge Dock
Headquarters
MPLX Operated Pipelines:
Owned by Others

Attractive Portfolio of Organic Growth Capital
15
Logistics & Storage Segment
Utica Build-out and related connectivity
Industry solution for Marcellus and Utica liquids
Multiple investments – estimated to complete
throughout 2017 and 1Q 2018
Ozark Pipeline Expansion
Crude sourcing optionality to Midwest refineries
Mid-2018 estimated completion
Texas City Tank Farm
MPC and third-party logistics solutions
3Q 2018 estimated completion
Robinson Butane Cavern
MPC shifting third-party services to MPLX and
optimizing Robinson butane handling
2Q 2018 estimated completion
Other projects in development

Gathering & Processing
16
Segment Overview
One of the largest NGL and natural gas midstream service providers
– Gathering capacity of 5.9 Bcf/d
• ~65% Marcellus/Utica; ~35% Southwest
– Processing capacity of 8.0 Bcf/d*
• ~70% Marcellus/Utica; ~20% Southwest; ~10% Southern Appalachia
– C2 + Fractionation capacity of ~610 MBPD**
• ~90% Marcellus/Utica; ~5% Southwest; ~5% Southern Appalachia
Top-rated midstream service provider since 2006 as determined by independent research provider
Primarily fee-based business with highly diverse customer base and established long-term contracts
Raw
Natural Gas
Production
Processing
Plants
Mixed
NGLs
Fractionation
Facilities
NGL
Products
• Ethane
• Propane
• Normal Butane
• Isobutane
• Natural Gasoline
Gathering
and
Compression
*Includes processing capacity of non-operated joint venture **Includes condensate stabilization capacity
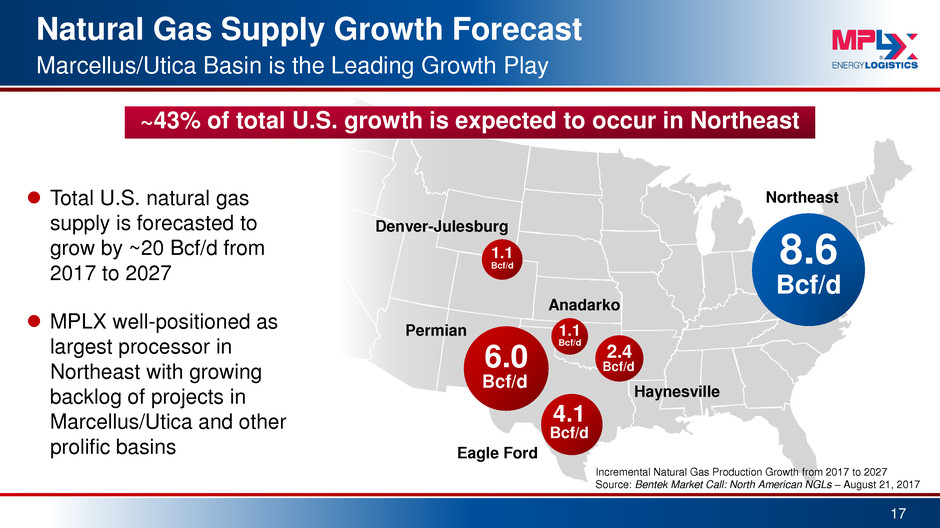
Natural Gas Supply Growth Forecast
17
Marcellus/Utica Basin is the Leading Growth Play
Incremental Natural Gas Production Growth from 2017 to 2027
Source: Bentek Market Call: North American NGLs – August 21, 2017
8.6
Bcf/d
Northeast Total U.S. natural gas
supply is forecasted to
grow by ~20 Bcf/d from
2017 to 2027
MPLX well-positioned as
largest processor in
Northeast with growing
backlog of projects in
Marcellus/Utica and other
prolific basins
Permian
6.0
Bcf/d
4.1
Bcf/d
Eagle Ford
Anadarko
1.1
Bcf/d
Denver-Julesburg
1.1
Bcf/d
Haynesville
2.4
Bcf/d
~43% of total U.S. growth is expected to occur in Northeast

Marcellus/Utica Processing Capacity
18
Building Infrastructure to Support Basin Volume Growth
0
2
4
6
8
2013 2014 2015 2016 2017E* 2018E
B
c
f/
d
~7.0 Bcf/d processing capacity by end of 2018
Throughput Year-end Capacity
Currently operate ~66% of processing capacity in Marcellus/Utica basin
2017 plant completions
Sherwood VII (in service 1Q17)
Sherwood VIII (in service 3Q17)
2018 expected plant completions
Harmon Creek
Houston I
Majorsville VII
Sherwood IX
Sherwood X
Sherwood XI
*2017 throughput assumes 15% growth rate over prior year Note: 2013 through 2015 include MarkWest volumes prior to acquisition by MPLX
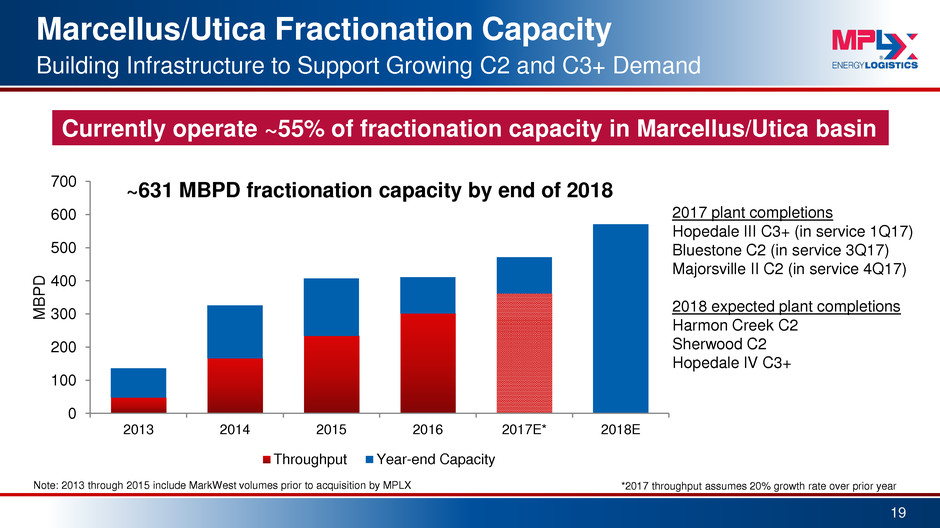
Marcellus/Utica Fractionation Capacity
Building Infrastructure to Support Growing C2 and C3+ Demand
0
100
200
300
400
500
600
700
2013 2014 2015 2016 2017E* 2018E
M
B
P
D
~631 MBPD fractionation capacity by end of 2018
Throughput Year-end Capacity
Currently operate ~55% of fractionation capacity in Marcellus/Utica basin
2017 plant completions
Hopedale III C3+ (in service 1Q17)
Bluestone C2 (in service 3Q17)
Majorsville II C2 (in service 4Q17)
2018 expected plant completions
Harmon Creek C2
Sherwood C2
Hopedale IV C3+
*2017 throughput assumes 20% growth rate over prior year Note: 2013 through 2015 include MarkWest volumes prior to acquisition by MPLX
19

Northeast Operations Well-Positioned
in Ethane Market
Ethane demand growing as exports and
steam cracker development continues in
Gulf Coast and Northeast
MPLX well-positioned to support
producer customers’ rich-gas
development with extensive distributed
de-ethanization system
Based on current utilization, MPLX can
support the production of an additional
~60 MBPD of purity ethane with existing
assets
Opportunity to invest $500 MM to
$1 B to support Northeast ethane
recovery over the next five years
20
West Virginia
Pennsylvania Ohio
Sherwood
Mobley
Majorsville
Cadiz Houston
Bluestone
Harmon Creek
Seneca
MPLX De-ethanization
Facility
MPLX Processing
Complex
MPLX Planned
De-ethanization Facility
Steam Cracker Planned
Steam Cracker Proposed
MPLX Ethane Pipeline
ATEX Pipeline
Mariner West Pipeline
Mariner East 1 Pipeline

Considerable Scale in the Southwest
2.1 Bcf/d Gathering, 1.5 Bcf/d Processing & 29 MBPD C2+ Fractionation Capacity
21
Southeast Oklahoma
120MMcf/d
Processing*
755MMcf/d
Gathering
East Texas
Gulf Coast
142MMcf/d
Processing
Western Oklahoma Oklahoma
Texas
425MMcf/d
Processing
585MMcf/d
Gathering
600MMcf/d
Gathering
680MMcf/d
Processing
Fractionation
29,000BPD
*Represents 40% of processing capacity through the Partnership’s
Centrahoma JV with Targa Resources Corp. Permian
200MMcf/d
Processing

Expanding Southwest Position to Support Growing
Production in High Performance Resource Plays
Hidalgo processing plant in Culberson County, Texas,
placed in service in 2Q 2016, currently operating at
near 100% utilization
Began construction of 200 MMcf/d processing plant in
Delaware Basin (Argo) expected to be in service in
1Q 2018
Began construction of 75 MMcf/d processing plant in
STACK shale (Omega) expected to be in service in
mid-2018
Full connectivity to 435 MMcf/d of processing capacity
via a 60-mile high-pressure rich-gas pipeline
Constructing rich-gas and crude oil gathering systems
with related storage and logistics facilities
22
Cana-Woodford
Dewey
Blaine Kingfisher
Canadian
Caddo
Grady
McClain
Garvin Comanche
Stephens
Washita
Beckham
Roger Mills
Custer
Buffalo Creek
Complex
Arapaho Complex
Newfield
STACK
area of
operations
Rich-gas
pipeline
Woodford Play
Meramec Play
Permian
Hidalgo Complex
200 MMcf/d
Delaware
Basin
Culberson
Eddy
Permian
Basin
Argo Complex
200 MMcf/d – Q1 2018

Strong Financial Flexibility to Manage and
Grow Asset Base
23
Committed to maintaining
investment grade credit profile
$2.25 B senior notes issued
1Q 2017
~$2.1 B of available liquidity at
end of 3Q 2017
No public equity issuance in 4Q
2017
Anticipate no issuance of public
equity to fund 2018 organic
growth capital
($MM except ratio data)
As of
9/30/17
Cash and cash equivalents 3
Total assets 19,238
Total debt(a) 7,051
Redeemable preferred units 1,000
Total equity 10,086
Consolidated total debt to LTM pro forma adjusted
EBITDA ratio(b)
3.6x
Remaining capacity available under $2.25 B revolving
credit agreement
1,827
Remaining capacity available under $500 MM credit
agreement with MPC
298
(a)Total debt includes $202 MM of outstanding intercompany borrowings classified in current liabilities as of Sept. 30, 2017
(b)Calculated using face value total debt and last twelve month adjusted EBITDA, which is pro forma for acquisitions. Face value
total debt includes approximately $428 MM of unamortized discount and debt issuance costs as of Sept. 30, 2017.

Long-Term Value Objectives
Deliver Sustainable Distribution Growth rate that provides attractive total
unitholder returns
Drive Lower Cost of Capital to achieve most efficient mix of growth and yield
Execute and expand Robust Portfolio of Organic Growth Projects in support of
producer customers and overall energy infrastructure build-out
Maintain Investment Grade Credit profile
Become Consolidator in midstream space
24
25
Appendix

About MPLX
Growth-oriented, diversified MLP with high-quality,
strategically located assets with leading midstream
position
Two primary businesses
– Logistics & Storage includes transportation, storage
and distribution of crude oil, refined petroleum products
and other hydrocarbon-based products
– Gathering & Processing includes gathering, processing,
and transportation of natural gas and the gathering,
transportation, fractionation, storage and marketing of NGLs
Investment grade credit profile with strong financial
flexibility
MPC as sponsor has interests aligned with MPLX
– MPLX assets are integral to MPC
– Growing stable cash flows through continued investment in
midstream infrastructure
26
See appendix for legend

March 1, 2017 Dropdown from MPC
27
Terminal, pipeline and storage assets
– 62 light product terminals with ~24 million barrels of
storage capacity
– 11 pipeline systems consisting of 604 pipeline miles
– 73 tanks with ~7.8 million barrels of storage capacity
– Crude oil truck unloading facility at MPC’s refinery in
Canton, Ohio
– Natural gas liquids storage cavern in Woodhaven,
Michigan, with ~1.8 million barrels of capacity
Total consideration of $2.015 B
– $1.511 B in cash and $504 MM in MPLX equity
– Represents ~8 times EBITDA multiple
– ~$250 MM estimated annual EBITDA
– Expected to be immediately accretive to
MPLX’s distributable cash flow

Sept. 1, 2017 Dropdown from MPC
Assets include MPC’s ownership interests:
– Explorer Pipeline Company, representing a 24.51 percent
ownership interest in the company
– Lincoln Pipeline LLC, representing a 35 percent interest in
the Southern Access Extension Pipeline (SAX)
– MPL Louisiana Holdings, representing a 40.7 percent
interest in the Louisiana Offshore Oil Port (LOOP)
– LOCAP LLC, representing an overall 58.52 percent
ownership interest in the company
Total consideration of $1.05 B
– $630 MM in MPLX equity and $420 MM in cash
– Represents 7.6 times EBITDA multiple
– ~$138 MM annual adjusted EBITDA(1)
– Expected to be immediately accretive to MPLX’s
distributable cash flow per unit
28
(1)Adjusted EBITDA with respect to joint-interest ownership is calculated as cash
distributions adjusted for maintenance capital, growth capital and financing activities.

Growth Capital Forecast
29
Projects completed in 2017
(a)Utica Rich- and Dry-Gas Gathering is a joint venture between MarkWest Utica EMG’s and Summit Midstream LLC. Dry-Gas Gathering in the Utica Shale is completed through a joint venture with MarkWest and EMG.
(b)MarkWest and MarkWest Utica EMG shared fractionation capacity
(c)Sherwood Midstream investment
Gathering & Processing Projects Shale Resource Capacity
Est. Completion
Date
Rich- and Dry-Gas Gathering(a) Marcellus & Utica N/A Ongoing
Western Oklahoma - STACK Rich-Gas and Oil
Gathering
Cana Woodford N/A Ongoing
Hopedale III C3+ Fractionation and NGL
Logistics(b)(c)
Marcellus & Utica 60,000 BPD In Service - 1Q17
Sherwood VII Processing Plant(c) Marcellus 200 MMcf/d In Service - 1Q17
Bluestone C2 Fractionation Marcellus 20,000 BPD In Service - 3Q17
Sherwood VIII Processing Plant Marcellus 200 MMcf/d In Service - 3Q17
Majorsville II C2 Fractionation Marcellus 40,000 BPD In Service - 4Q17
NGL Pipeline Expansions Marcellus N/A Ongoing
Logistics & Storage
Projects
Est. Completion
Date
Utica Build-out projects In Service – 3Q17
Midwest connectivity projects 4Q17/1Q18

Growth Capital Forecast
30
Projects expected to be completed in 2018
(a)Replacement of existing Houston 35 MMcf/d plant
(b)Sherwood Midstream investment
Gathering & Processing Projects Shale Resource Capacity
Est. Completion
Date
Houston I Processing Plant(a) Marcellus 200 MMcf/d 1Q18
Sherwood IX Processing Plant(b) Marcellus 200 MMcf/d 1Q18
Argo Processing Plant Delaware 200 MMcf/d 1Q18
Omega Processing Plant Cana-Woodford 75 MMcf/d Mid-2018
Majorsville VII Processing Plant Marcellus 200 MMcf/d 3Q18
Sherwood X Processing Plant(b) Marcellus 200 MMcf/d 3Q18
Sherwood C2 Fractionation Marcellus 20,000 BPD 3Q18
Sherwood XI Processing Plant(b) Marcellus 200 MMcf/d 4Q18
Harmon Creek Processing Plant Marcellus 200 MMcf/d 4Q18
Harmon Creek C2 Fractionation Marcellus 20,000 BPD 4Q18
Hopedale IV C3+ Fractionation Marcellus & Utica 60,000 BPD 4Q18
Logistics & Storage
Projects
Est. Completion
Date
Ozark Pipeline Expansion Mid-2018
Wood River-to-Patoka
Pipeline Expansion
Mid-2018
Midwest connectivity projects 1Q18
Robinson Butane Cavern 2Q18
Texas City Tank Farm 3Q18

Pipeline Acquisitions Announced in 2017
31
Extending the Footprint of the L&S Segment
– ~$220 MM investment
– 433 mile, 22″ crude pipeline running from Cushing,
Oklahoma, to Wood River, Illinois, with capacity of
~230 MBPD
–Planned expansion to ~345 MBPD in progress and
expected to be completed by mid-2018
Ozark Pipeline
Ozark Pipeline Acquisition Bakke Pipeline
– $500 MM investment
– ~9.2% equity interest in the Dakota Access Pipeline
(DAPL) and the Energy Transfer Crude Oil Pipeline
(ETCOP) projects
– Expected to deliver ~520 MBPD from the Bakken/Three
Forks production area to the Midwest and Gulf Coast with
capacity up to ~570 MBPD
– Commenced operations 2Q 2017

Executing a Comprehensive Utica Strategy
32
Phased Infrastructure Investment
Cornerstone Pipeline commenced
operations in October 2016
Hopedale pipeline connection
completed December 2016
Harpster-to-Lima pipeline fully
operational in July 2017
Links Marcellus and Utica condensate
and natural gasoline with Midwest
refiners
Constructing additional connectivity
and expanding pipelines to provide
more optionality for Midwest refiners
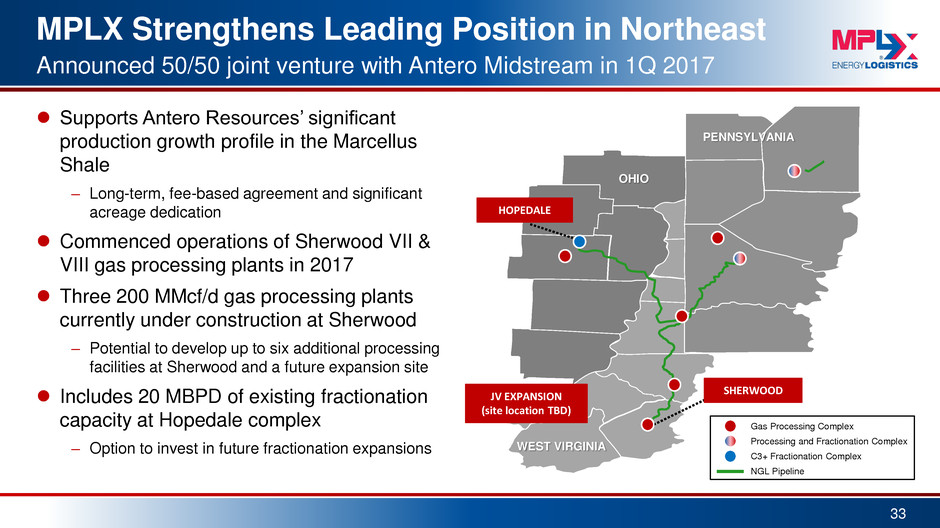
Supports Antero Resources’ significant
production growth profile in the Marcellus
Shale
– Long-term, fee-based agreement and significant
acreage dedication
Commenced operations of Sherwood VII &
VIII gas processing plants in 2017
Three 200 MMcf/d gas processing plants
currently under construction at Sherwood
– Potential to develop up to six additional processing
facilities at Sherwood and a future expansion site
Includes 20 MBPD of existing fractionation
capacity at Hopedale complex
– Option to invest in future fractionation expansions
33
MPLX Strengthens Leading Position in Northeast
Announced 50/50 joint venture with Antero Midstream in 1Q 2017
WEST VIRGINIA
PENNSYLVANIA
OHIO
SHERWOOD
JV EXPANSION
(site location TBD)
HOPEDALE
C3+ Fractionation Complex
NGL Pipeline
Gas Processing Complex
Processing and Fractionation Complex

Major Residue Gas Takeaway Expansion Projects
Originate at MPLX Facilities
New takeaway pipelines expected to
improve Northeast basis differentials
MPLX processing complexes:
– Access to all major gas residue gas
takeaway pipelines
– Provide multiple options with significant
excess residue capacity
– Ability to bring mass and synergies to
new residue gas pipelines
Critical new projects designed to serve
our complexes include:
Rover, Leach/Rayne Xpress, Ohio
Valley Connector, Mountaineer
Express and Mountain Valley Pipeline
34
Utica Complex
Marcellus Complex

Marcellus/Utica Overview
3.8 Bcf/d Gathering, 5.8 Bcf/d Processing & 531 MBPD C2+ Fractionation Capacity
WEST VIRGINIA
PENNSYLVANIA
OHIO
BLUESTONE COMPLEX
HARMON CREEK COMPLEX
(currently under construction)
MAJORSVILLE COMPLEX
MOBLEY COMPLEX SHERWOOD COMPLEX
CADIZ & SENECA COMPLEXES
MarkWest Joint Venture with EMG
HOPEDALE FRACTIONATION COMPLEX
HOUSTON COMPLEX
OHIO CONDENSATE
MarkWest Joint Venture with Summit Midstream
Utica Complex
ATEX Express Pipeline
Purity Ethane Pipeline
NGL Pipeline
Mariner East Pipeline
Marcellus Complex
Gathering System
Mariner West Pipeline
TEPPCO Product Pipeline
MarkWest Joint Venture with EMG
35

Gathering & Processing Segment
36
Marcellus & Utica Operations
Gathering
– Record volumes averaged over 2.3 Bcf/d
– Third-quarter volumes up ~25% versus
the same quarter last year
Processing
– Record volumes averaged ~5.0 Bcf/d
– Commenced operations of Sherwood VIII
in July
– Third-quarter volumes up ~15% versus
the same quarter last year
(a)Based on weighted average number of days plant(s) in service. Excludes periods of maintenance
Processed Volumes
Area
Available
Capacity
(MMcf/d)(a)
Average
Volume
(MMcf/d)
Utilization
(%)
Marcellus 4,520 3,986 88%
Houston 520 510 98%
Majorsville 1,070 937 88%
Mobley 920 654 71%
Sherwood 1,600 1,561 98%
Bluestone 410 324 79%
Utica 1,325 1,000 75%
Cadiz 525 514 98%
Seneca 800 486 61%
3Q 2017 Total 5,845 4,986 85%
2Q 2017 Total 5,645 4,690 83%

Gathering & Processing Segment
37
Marcellus & Utica Fractionation
Record fractionated volumes of
~365 MBPD
First full quarter of operations for
second de-ethanization plant at
Bluestone
Third-quarter fractionated volumes
up ~16% versus the same quarter
last year
Fractionated Volumes
Area
Available
Capacity
(MBPD)(a)(b)
Average
Volume
(MBPD)
Utilization
(%)
3Q17 Total C3+ 287 219 76%
3Q17 Total C2 204 146 72%
2Q17 Total C3+ 287 210 73%
2Q17 Total C2 184 141 77%
(a)Based on weighted average number of days plant(s) in service. Excludes periods of maintenance
(b)Excludes Cibus Ranch condensate facility

Gathering & Processing
38
Southwest Operations
0
Gathering capacity
1.5Bcf/d*
Processing capacity
29MBPD
C2+ Fractionation capacity
2.1Bcf/d
Javelina Complex Carthage Complex Buffalo Creek Complex
Transmission capacity
1.4Bcf/d
*Includes 40% of processing capacity through the Partnership’s Centrahoma Joint Venture
Hidalgo
Complex

Gathering & Processing Segment
Southwest Operations
Continued construction of gas
processing plants in the Southwest
– Delaware Basin (Argo)
– STACK (Omega)
2017 YTD processed volumes up
~8% versus same period last year
(a)Based on weighted average number of days plant(s) in service. Excludes periods of maintenance
(b)West Texas is composed of the Hidalgo plant in the Delaware Basin
(c)Processing capacity includes Partnership’s portion of Centrahoma JV and excludes volumes sent to
third parties
Processed Volumes
Area
Available
Capacity
(MMcf/d)(a)
Average
Volume
(MMcf/d)
Utilization
(%)
West Texas(b) 200 197 99%
East Texas 600 381 64%
Western OK 425 362 85%
Southeast OK(c) 120 120 100%
Gulf Coast 142 105 74%
3Q 2017 Total 1,487 1,165 78%
2Q 2017 Total 1,487 1,220 82%
39

74%
20%
6%
MPC Commited MPC Additional Third Party
Logistics & Storage Contract Structure
Fee-based assets with minimal commodity
exposure(c)
MPC has historically accounted for
– over 85% of the volumes shipped on MPLX’s
crude and product pipelines
– 100% of the volumes transported via MPLX’s
inland marine vessels
MPC has entered into multiple
long-term transportation and storage
agreements with MPLX
– Terms of up to 10 years, beginning in 2012
– Pipeline tariffs linked to FERC-based rates
– Indexed storage fees
– Fee-for-capacity inland marine business
40
2016 Revenue – Customer Mix
MPC = 94%
$633 MM
$171 MM
$51
MM
(a,b)
Notes:
(a)Includes revenues generated under Transportation and Storage agreements with MPC (excludes
marine agreements)
(b)Volumes shipped under joint tariff agreements are accounted for as third party for GAAP purposes,
but represent MPC barrels shipped
(c)Commodity exposure only to the extent of volume gains and losses

Gathering & Processing Contract Structure
41
Durable long-term partnerships across leading basins
Marcellus Utica Southwest
Resource Play
Marcellus, Upper Devonian
Utica Haynesville, Cotton Valley,
Woodford, Anadarko Basin,
Granite Wash, Cana-Woodford,
Permian, Eagle Ford
Producers 14 – including Range, Antero,
EQT, CNX, Southwestern, Rex
and others
7 – including Antero, Gulfport,
Ascent, Rice, PDC and others
140 – including Newfield, Devon,
BP, Cimarex, Chevron,
PetroQuest and others
Contract Structure Long-term agreements initially
10-15 years, which contain
renewal provisions
Long-term agreements initially
10-15 years, which contain
renewal provisions
Long-term agreements initially
10-15 years, which contain
renewal provisions
Volume Protection
(MVCs)
77% of 2017 capacity contains
minimum volume commitments
27% of 2017 capacity contains
minimum volume commitments
18% of 2017 capacity contains
minimum volume commitments
Area Dedications 4.1 MM acres 4.1 MM acres 1.4 MM acres
Inflation Protection Yes Yes Yes

Reconciliation of Adjusted EBITDA and Distributable Cash
from Net Income
42
(a)The Partnership makes a distinction
between realized or unrealized gains
and losses on derivatives. During the
period when a derivative contract is
outstanding, changes in the fair value of
the derivative are recorded as an
unrealized gain or loss. When a
derivative contract matures or is settled,
the previously recorded unrealized gain
or loss is reversed and the realized gain
or loss of the contract is recorded.
(b)The Adjusted EBITDA and DCF
adjustments related to the Predecessor
are excluded from adjusted EBITDA
attributable to MPLX LP and DCF prior
to the acquisition dates.
(c)MarkWest pre-merger EBITDA and
undistributed DCF relates to
MarkWest’s EBITDA and DCF from
Oct. 1, 2015, through Dec. 3, 2015.
($MM) 2013 2014 2015 1Q 2016 2Q 2016 3Q 2016 4Q 2016 1Q 2017 2Q 2017 3Q 2017
Net income (loss) 211 239 333 (14) 72 194 182 187 191 217
Depreciation and amortization 70 75 129 136 151 151 153 187 164 164
Provision (benefit) for income taxes 1 1 1 (4) (8) - - - 2 1
Amortization of deferred financing costs - - 5 11 12 11 12 12 13 13
Non-cash equity-based compensation 1 2 4 2 4 3 1 3 3 4
Impairment expense - - - 129 1 - - - - -
Net interest and other financial costs 1 5 42 57 52 53 53 66 74 80
(Income) loss from equity investments - - (3) (5) 83 (6) 2 (5) (1) (23)
Distributions from unconsolidated subsidiaries - - 15 38 40 33 39 33 33 70
Distributions of cash received from equity method
investments to MPC
- - - - - - - - - (13)
Other adjustments to equity method investment distributions - - - - - - - - - 8
Unrealized derivative (gains) losses(a) - - (4) 9 12 2 13 (16) (3) 17
Acquisition costs - - 30 1 (2) - - 4 - 2
Adjusted EBITDA 284 322 552 360 417 441 455 471 476 540
Adjusted EBITDA attributable to noncontrolling interests (86) (69) (1) (1) - (2) - (1) (2) (2)
Adjusted EBITDA attributable to Predecessor(b) (87) (87) (215) (57) (66) (64) (64) (47) - -
MarkWest’s pre-merger EBITDA(c) - - 162 - - - - - - -
Adjusted EBITDA attributable to MPLX LP 111 166 498 302 351 375 391 423 474 538
Deferred revenue impacts 17 (3) 6 3 4 1 8 8 9 8
Net interest and other financial costs (2) (6) (35) (57) (52) (53) (53) (66) (74) (80)
Maintenance capital expenditures (19) (22) (49) (13) (20) (25) (26) (12) (23) (24)
Portion of DCF adjustments attributable to Predecessor(b) - - 17 1 2 5 - 2 - -
Other 7 2 (6) - - (2) (2) (1) 1 -
Distributable cash flow pre-MarkWest undistributed 114 137 431 236 285 301 318 354 387 442
MarkWest undistributed DCF(c) - - (32) - - - - - - -
Distributable cash flow attributable to MPLX LP 114
137
399 236 285 301 318 354 387 442
Preferred unit distributions - - - - (9) (16) (16) (16) (17) (16)
Distributable cash flow available to GP and LP unitholders 114 137 399 236 276 285 302 338 370 426

Reconciliation of Adjusted EBITDA and Distributable Cash
from Net Cash Provided by Operating Activities (YTD)
43
($MM)
Dec 31,
2015
Mar 31,
2016
Jun 30,
2016
Sep 30,
2016
Dec 31,
2016
Mar 31,
2017
Jun 30,
2017
Sep 30,
2017
Net cash provided by operating activities 427 321 670 975 1,491 377 844 1.338
Changes in working capital items 63 (13) (9) 59 (66) 51 1 (41)
All other, net (11) (17) (22) (18) (26) (16) (32) (43)
Non-cash equity-based compensation 4 2 6 9 10 3 6 10
Net gain (loss) on disposal of assets - - - 1 1 (1) 1 1
Net interest and other financial costs 42 57 109 162 215 66 140 220
Current income taxes - - 1 4 5 - 1 1
Asset retirement expenditures 1 - 2 4 6 1 1 2
Unrealized derivative (gains) losses(a) (4) 9 21 23 36 (16) (19) (2)
Acquisition costs 30 1 (1) (1) (1) 4 4 6
Distributions of cash received from equity method investments to MPC - - - - - - - (13)
Other adjustments to equity method investment distributions - - - - - - - 8
Other - - - - 2 2 - -
Adjusted EBITDA 552 360 777 1,218 1,673 471 947 1,487
Adjusted EBITDA attributable to noncontrolling interests (1) (1) (1) (3) (3) (1) (3) (5)
Adjusted EBITDA attributable to Predecessor(b) (215) (57) (123) (187) (251) (47) (47) (47)
MarkWest’s pre-merger EBITDA(c) 162 - - - - - - -
Adjusted EBITDA attributable to MPLX LP 498 302 653 1,028 1,419 423 897 1,435
Deferred revenue impacts 6 3 7 8 16 8 17 25
Net interest and other financial costs (35) (57) (109) (162) (215) (66) (140) (220)
Maintenance capital expenditures (49) (13) (33) (58) (84) (12) (35) (59)
Other (6) - - (2) (4) (1) - -
Portion of DCF adjustments attributable to Predecessor(b) 17 1 3 8 8 2 2 2
Distributable cash flow pre-MarkWest undistributed 431 236 521 822 1,140 354 741 1,183
MarkWest undistributed DCF adjustment(c) (32) - - - - - - -
Distributable cash flow attributable to MPLX LP 399 236 521 822 1,140 354 741 1,183
Preferred unit distributions - - (9) (25) (41) (16) (33) (49)
Distributable cash flow available to GP and LP unitholders 399 236 512 797 1,099 338 708 1,134
(a)The Partnership makes a distinction between
realized or unrealized gains and losses on
derivatives. During the period when a
derivative contract is outstanding, changes in
the fair value of the derivative are recorded as
an unrealized gain or loss. When a derivative
contract matures or is settled, the previously
recorded unrealized gain or loss is reversed
and the realized gain or loss of the contract is
recorded.
(b)The Adjusted EBITDA and DCF adjustments
related to the Predecessor are excluded from
adjusted EBITDA attributable to MPLX LP and
DCF prior to the acquisition dates.
(c)MarkWest pre-merger EBITDA and
undistributed DCF relates to MarkWest’s
EBITDA and DCF from Oct. 1, 2015, through
Dec. 3, 2015.
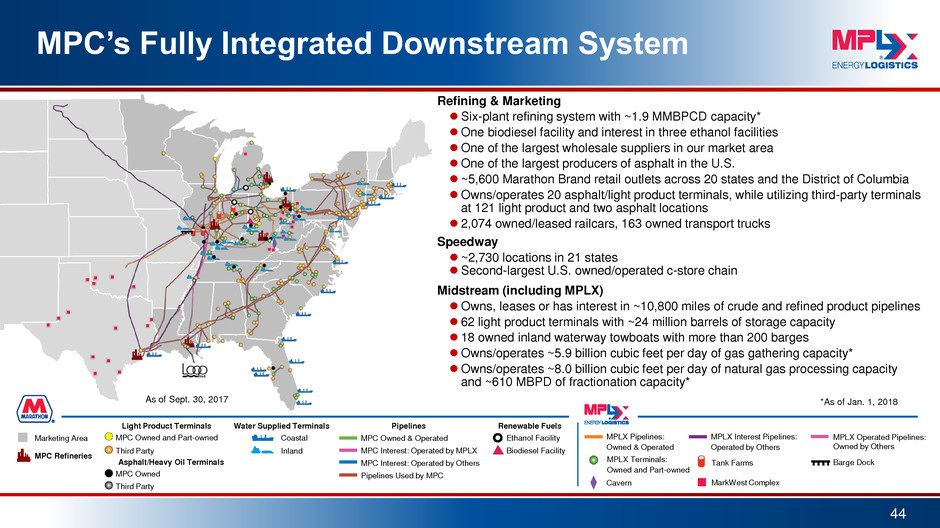
MPC’s Fully Integrated Downstream System
Refining & Marketing
Six-plant refining system with ~1.9 MMBPCD capacity*
One biodiesel facility and interest in three ethanol facilities
One of the largest wholesale suppliers in our market area
One of the largest producers of asphalt in the U.S.
~5,600 Marathon Brand retail outlets across 20 states and the District of Columbia
Owns/operates 20 asphalt/light product terminals, while utilizing third-party terminals
at 121 light product and two asphalt locations
2,074 owned/leased railcars, 163 owned transport trucks
Speedway
~2,730 locations in 21 states
Second-largest U.S. owned/operated c-store chain
Midstream (including MPLX)
Owns, leases or has interest in ~10,800 miles of crude and refined product pipelines
62 light product terminals with ~24 million barrels of storage capacity
18 owned inland waterway towboats with more than 200 barges
Owns/operates ~5.9 billion cubic feet per day of gas gathering capacity*
Owns/operates ~8.0 billion cubic feet per day of natural gas processing capacity
and ~610 MBPD of fractionation capacity*
44
Marketing Area Ethanol Facility
Biodiesel Facility
Renewable Fuels
MPC Interest: Operated by MPLX
MPC Owned & Operated
MPC Interest: Operated by Others
Pipelines
Pipelines Used by MPC
Water Supplied Terminals
Coastal
Inland
MPC Refineries
Light Product Terminals
MPC Owned and Part-owned
Third Party
Asphalt/Heavy Oil Terminals
MPC Owned
Third Party MarkWest Complex
MPLX Terminals:
Owned and Part-owned
MPLX Pipelines:
Owned & Operated
MPLX Interest Pipelines:
Operated by Others
Cavern
Barge Dock Tank Farms
MPLX Operated Pipelines:
Owned by Others
As of Sept. 30, 2017 *As of Jan. 1, 2018
