Attached files
| file | filename |
|---|---|
| EX-99.2 - EXHIBIT 99.2 - International Seaways, Inc. | tv481849_ex99-2.htm |
| 8-K - 8-K - International Seaways, Inc. | tv481849_8k.htm |
Exhibit 99.1
International Seaways, Inc. 237 125 49 0 45 115 255 192 0 185 220 255 153 204 255 91 155 213 165 165 165 68 84 106 1 International Seaways, Inc. Transaction Update to Shareholders December 21, 2017

International Seaways, Inc. 237 125 49 0 45 115 255 192 0 185 220 255 153 204 255 91 155 213 165 165 165 68 84 106 2 Disclaimer Forward - Looking Statements During the course of this presentation, the Company (International Seaways, Inc. (INSW)) may make forward - looking statements or provide forward - looking information. All statements other than statements of historical facts should be considered forward - looking state ments. Some of these statements include words such as ‘‘outlook,’’ ‘‘believe,’’ ‘‘expect,’’ ‘‘potential,’’ ‘‘continue,’’ ‘‘may,’’ ‘‘will,’’ ‘‘should,’’ ‘‘could,’’ ‘‘seek,’’ ‘‘pred ict ,’’ ‘‘intend,’’ ‘‘plan,’’ ‘‘estimate,’’ ‘‘anticipate,’’ ‘‘target,’’ ‘‘project,’’ ‘‘forecast,’’ ‘‘shall,’’ ‘‘contemplate’’ or the neg ative version of those words or other comparable words. Although they reflect INSW’s current expectations, these statements are not guarantees of future performance, but involve a number of risks, uncertainties, and assumptions which are difficult to predict. Some of the factors that may cause actual out com es and results to differ materially from those expressed in, or implied by, the forward - looking statements include, but are not necessarily limite d to, general economic conditions, competitive pressures, the nature of the Company’s services and their price movements, and the ability to retain key employees. The Company does not undertake to update any forward - looking statements as a result of future developments, new information or other wise. Non - GAAP Financial Measures Included in this presentation are certain non - GAAP financial measures, including Time Charter Equivalent (“TCE”) revenue, EBITDA , Adjusted EBITDA, and total leverage ratios, designed to complement the financial information presented in accordance with generally ac cep ted accounting principles in the United States of America because management believes such measures are useful to investors. TCE revenues, w hic h represents shipping revenues less voyage expenses, is a measure to compare revenue generated from a voyage charter to revenue generated fro m a time charter. EBITDA represents net (loss)/income before interest expense, income taxes and depreciation and amortization expense. Ad justed EBITDA consists of EBITDA adjusted for the impact of certain items that we do not consider indicative of our ongoing operatin g p erformance. Total leverage ratios are calculated as total debt divided by Adjusted EBITDA. We present non - GAAP measures when we believe that the a dditional information is useful and meaningful to investors. Non - GAAP financial measures do not have any standardized meaning and are ther efore unlikely to be comparable to similar measures presented by other companies. The presentation of non - GAAP financial measures is not intend ed to be a substitute for, and should not be considered in isolation from, the financial measures reported in accordance with GAAP. See App endix for a reconciliation of certain non - GAAP measures to the comparable GAAP measures. This presentation also contains estimates and other information concerning our industry that are based on industry publicatio ns, surveys and forecasts. This information involves a number of assumptions and limitations, and we have not independently verified the accu rac y or completeness of the information. Additional Information You should read the Company’s Quarterly Report on Form 10 - Q for the quarter ended September 30, 2017, and the other documents th e Company has filed with the SEC for additional information regarding the Company, its operations and the risks and uncertainti es it faces. You may obtain these documents for free by visiting EDGAR on the SEC Web site at www.sec.gov, or from the Company’s website at www.in tls eas.com.

International Seaways, Inc. 237 125 49 0 45 115 255 192 0 185 220 255 153 204 255 91 155 213 165 165 165 68 84 106 Transaction Overview 3 Transaction Summary o International Seaways, Inc. (the “Company” or “INSW”), has agreed to acquire 6 VLCCs from Euronav NV (“ Euronav ”) o Purchase price of $434 million o Will be funded with available liquidity and the anticipated assumption of existing Chinese export agency financing and / or new third - party financing o Vessels are expected to deliver in Q2 2018 o Transaction is subject to certain financing and other conditions Vessel Details o 300,000 DWT VLCC’s constructed at Shanghai Waigaoqiao Shipbuilding Co. o 5 built in 2016 and 1 built in 2015 o Average age of 1.7 years Chinese Export Agency Financing o Transaction includes an existing $311 million Chinese export agency financing o Matures between 2027 and 2028 o Interest Rate of LIBOR plus 2.0% Impact on Fleet Profile and Profitability o Meaningfully increases the size of INSW’s fleet o Reduces INSW fleet age from 11.6 to 9.3 years o Further positions INSW to capitalize on a recovery in both the crude and product tanker sectors

237 125 49 0 45 115 255 192 0 185 220 255 153 204 255 91 155 213 165 165 165 68 84 106 Key Transaction Benefits

International Seaways, Inc. 237 125 49 0 45 115 255 192 0 185 220 255 153 204 255 91 155 213 165 165 165 68 84 106 Key Transaction Benefits 5 Highly Attractive Existing Financing 3 Important Step in Fleet Modernization 2 Increases Size and Scale 4 Enhances Operating Leverage 6 Significant Enhancement of Tankers International Pool 1 Purchase of Highly Efficient, Modern Sister Ships at an Attractive Price 5
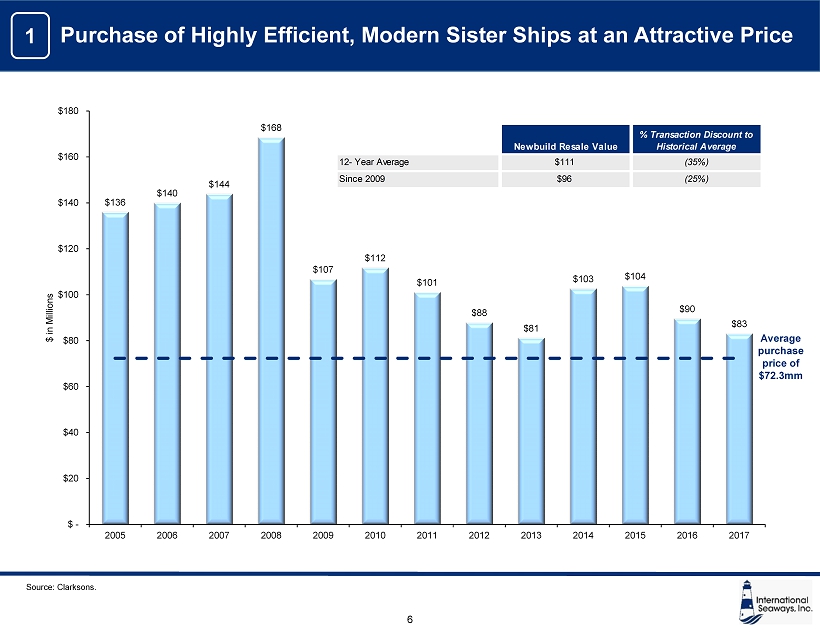
International Seaways, Inc. 237 125 49 0 45 115 255 192 0 185 220 255 153 204 255 91 155 213 165 165 165 68 84 106 Purchase of Highly Efficient, Modern Sister Ships at an Attractive Price 6 $136 $140 $144 $168 $107 $112 $101 $88 $81 $103 $104 $90 $83 $ - $20 $40 $60 $80 $100 $120 $140 $160 $180 2005 2006 2007 2008 2009 2010 2011 2012 2013 2014 2015 2016 2017 $ in Millions Average purchase price of $72.3mm Newbuild Resale Value % Transaction Discount to Historical Average 12- Year Average $111 (35%) Since 2009 $96 (25%) 1 Source: Clarksons.

International Seaways, Inc. 237 125 49 0 45 115 255 192 0 185 220 255 153 204 255 91 155 213 165 165 165 68 84 106 Increases Size and Scale 7 DWT (Operated Fleet) (1) # of Vessels (Operated Fleet) (1) 6,031,776 7,837,626 Status Quo Pro Forma 48 54 Status Quo Pro Forma Pro Forma Vessel Type by DWT 2 4,978,532 / 16 VLCCs 316,864 / 2 Suezmax 897,858 / 8 Aframax 853,214 / 12 Panamax 791,158 / 16 MR ULCC / VLCC Suezmax Aframax / LR2 Panamax / LR1 MR Note: Conventional fleet only. Excludes six joint venture vessels. (1) Status Quo DWT and vessel count assumes sale of Seaways Atalmar and Seaways Ambermar .
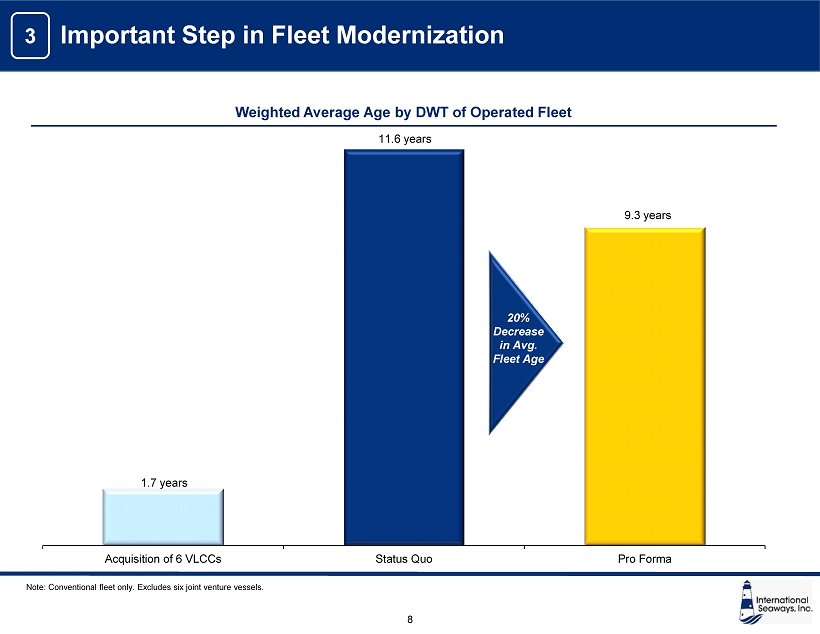
International Seaways, Inc. 237 125 49 0 45 115 255 192 0 185 220 255 153 204 255 91 155 213 165 165 165 68 84 106 Important Step in Fleet Modernization 8 Weighted Average Age by DWT of Operated Fleet 3 1.7 years 11.6 years 9.3 years Acquisition of 6 VLCCs Status Quo Pro Forma 20% Decrease in Avg. Fleet Age Note: Conventional fleet only. Excludes six joint venture vessels.

International Seaways, Inc. 237 125 49 0 45 115 255 192 0 185 220 255 153 204 255 91 155 213 165 165 165 68 84 106 Enhances Operating Leverage 9 # of Total Revenue Days (1) 4 17,280 19,440 Status Quo Pro Forma Note: Assumes operated conventional fleet only. (1) Assumes existing fleet to be all spot and assumes 360 revenue days per vessel. Annual Cash Flow Upside ($ in millions) $19.4 $48.6 $97.2 $194.4 +$1,000 +$2,500 +$5,000 +$10,000 Change in Spot Rate in Every Vessel Class Operated Conventional Fleet Only
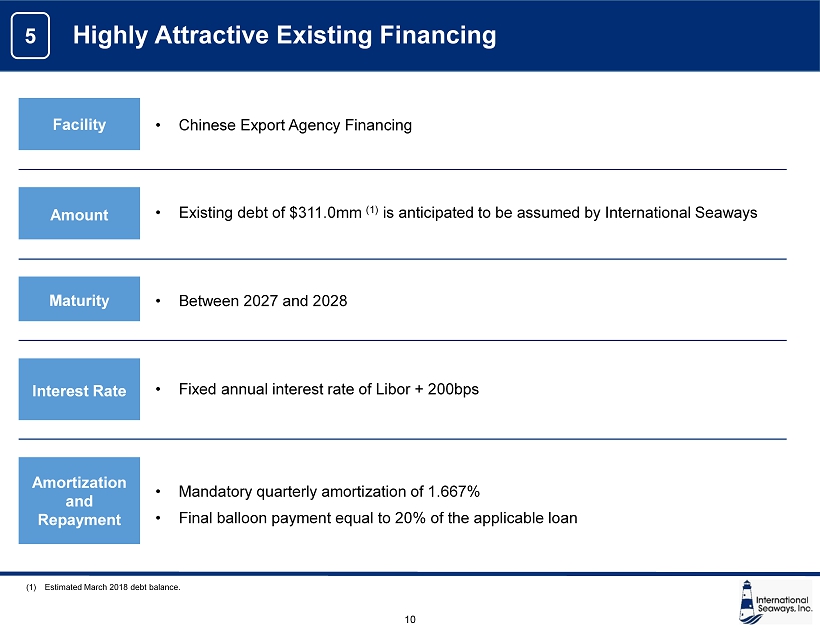
International Seaways, Inc. 237 125 49 0 45 115 255 192 0 185 220 255 153 204 255 91 155 213 165 165 165 68 84 106 Highly Attractive Existing Financing 10 Facility Amount Maturity Interest Rate Amortization and Repayment • Existing debt of $311.0mm (1) is anticipated to be assumed by International Seaways • Mandatory quarterly amortization of 1.667% • Final balloon payment equal to 20% of the applicable loan • Between 2027 and 2028 • Fixed annual interest rate of Libor + 200bps • Chinese Export Agency Financing (1) Estimated March 2018 debt balance. 5
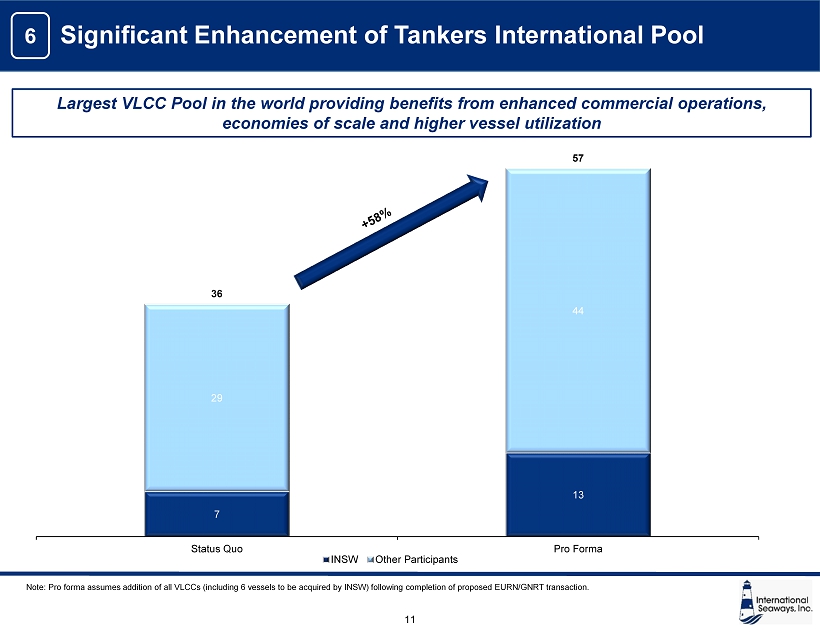
International Seaways, Inc. 237 125 49 0 45 115 255 192 0 185 220 255 153 204 255 91 155 213 165 165 165 68 84 106 Significant Enhancement of Tankers International Pool 11 Largest VLCC Pool in the world providing benefits from enhanced commercial operations, economies of scale and higher vessel utilization 6 Note: Pro forma assumes addition of all VLCCs (including 6 vessels to be acquired by INSW) following completion of proposed E URN /GNRT transaction. 7 13 29 44 36 57 Status Quo Pro Forma INSW Other Participants
237 125 49 0 45 115 255 192 0 185 220 255 153 204 255 91 155 213 165 165 165 68 84 106 Executing on Fleet Renewal Strategy
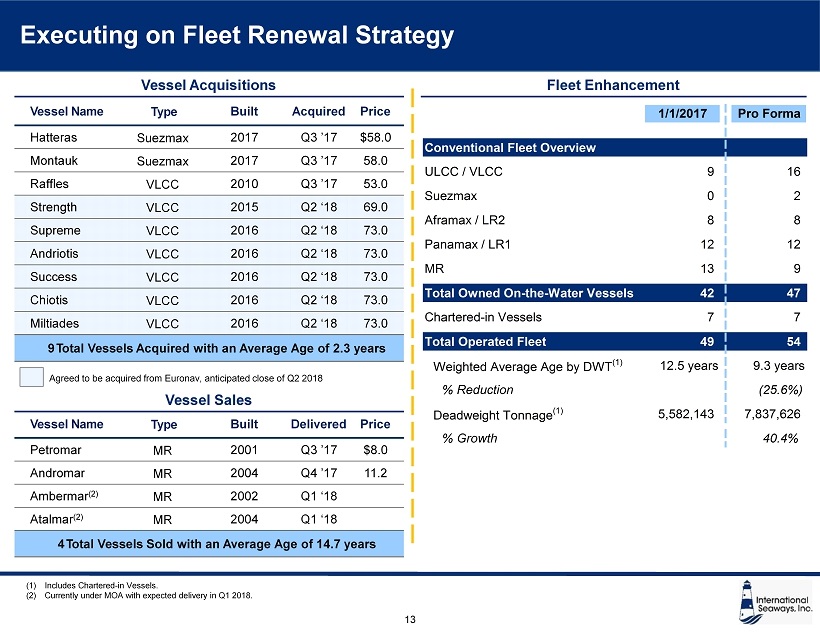
International Seaways, Inc. 237 125 49 0 45 115 255 192 0 185 220 255 153 204 255 91 155 213 165 165 165 68 84 106 Executing on Fleet Renewal Strategy 13 V ess e l Name Type Built Acquired Price Hatteras Suezmax 2017 Q3 ’17 $58.0 Montauk Suezmax 2017 Q3 ’17 58.0 Raffles VLCC 2010 Q3 ’17 53.0 Strength VLCC 2015 Q2 ‘18 69.0 Supreme VLCC 2016 Q2 ‘18 73.0 Andriotis VLCC 2016 Q2 ‘18 73.0 Success VLCC 2016 Q2 ‘18 73.0 Chiotis VLCC 2016 Q2 ‘18 73.0 Miltiades VLCC 2016 Q2 ‘18 73.0 9 T o t al Vessels Acquired with an Average Age of 2.3 years V ess e l Name Type Built Delivered Price Petromar MR 2001 Q3 ’17 $8.0 Andromar MR 2004 Q4 ’17 11.2 Ambermar (2) MR 2002 Q1 ‘18 Atalmar (2) MR 2004 Q1 ‘18 4 T o t al Vessels Sold with an Average Age of 14.7 years Vessel Acquisitions Fleet Enhancement Vessel Sales Agreed to be acquired from Euronav , anticipated close of Q2 2018 (1) Includes Chartered - in Vessels. (2) Currently under MOA with expected delivery in Q1 2018. 1/1/2017 Pro Forma Conventional Fleet Overview ULCC / VLCC 9 16 Suezmax 0 2 Aframax / LR2 8 8 Panamax / LR1 12 12 MR 13 9 Total Owned On-the-Water Vessels 42 47 Chartered-in Vessels 7 7 Total Operated Fleet 49 54 Weighted Average Age by DWT (1) 12.5 years 9.3 years % Reduction (25.6%) Deadweight Tonnage (1) 5,582,143 7,837,626 % Growth 40.4%
237 125 49 0 45 115 255 192 0 185 220 255 153 204 255 91 155 213 165 165 165 68 84 106 Strong Financial Position
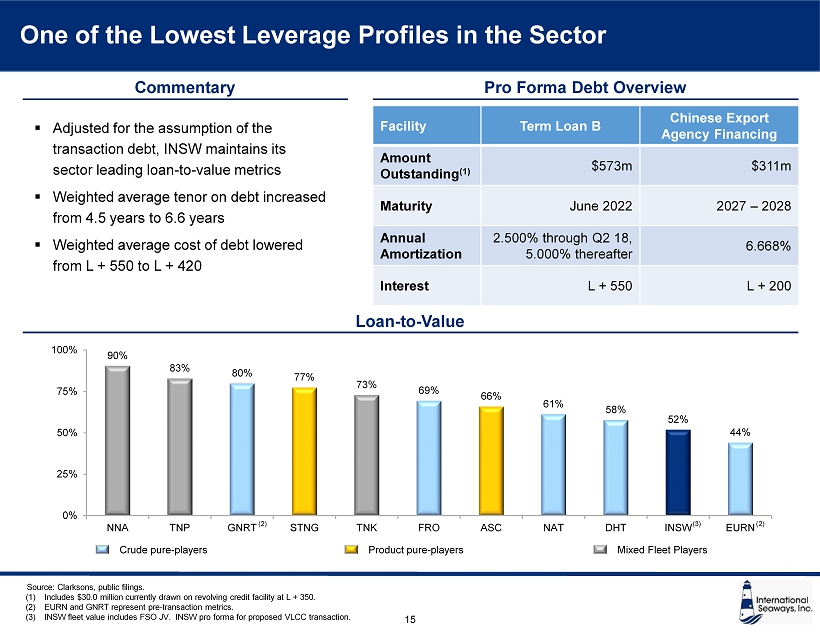
International Seaways, Inc. 237 125 49 0 45 115 255 192 0 185 220 255 153 204 255 91 155 213 165 165 165 68 84 106 Source: Clarksons , public filings. (1) Includes $30.0 million currently drawn on revolving credit facility at L + 350. (2) EURN and GNRT represent pre - transaction metrics. (3) INSW fleet value includes FSO JV. INSW pro forma for proposed VLCC transaction. One of the Lowest Leverage Profiles in the Sector 15 Loan - to - Value Crude pure - players Product pure - players Mixed Fleet Players Commentary Pro Forma Debt Overview ▪ Adjusted for the assumption of the transaction debt, INSW maintains its sector leading loan - to - value metrics ▪ Weighted average tenor on debt increased from 4.5 years to 6.6 years ▪ Weighted average cost of debt lowered from L + 550 to L + 420 Facility Term Loan B Chinese Export Agency Financing Amount Outstanding (1) $573m $311m Maturity June 2022 2027 – 2028 Annual Amortization 2.500% through Q2 18, 5.000% thereafter 6.668% Interest L + 550 L + 200 90% 83% 80% 77% 73% 69% 66% 61% 58% 52% 44% 0% 25% 50% 75% 100% NNA TNP GNRT STNG TNK FRO ASC NAT DHT INSW EURN (2) (2) (3)

237 125 49 0 45 115 255 192 0 185 220 255 153 204 255 91 155 213 165 165 165 68 84 106 Conclusion
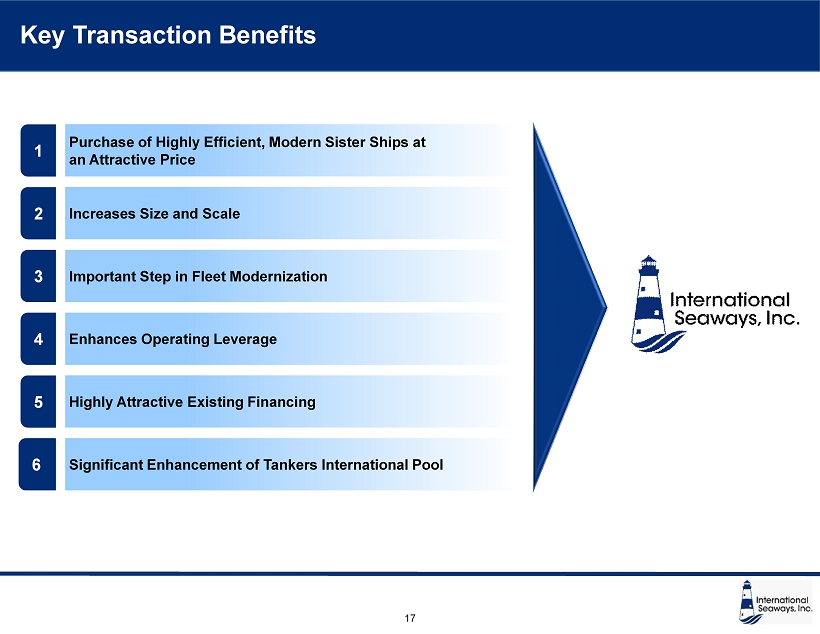
International Seaways, Inc. 237 125 49 0 45 115 255 192 0 185 220 255 153 204 255 91 155 213 165 165 165 68 84 106 Key Transaction Benefits 5 Highly Attractive Existing Financing 3 Important Step in Fleet Modernization 2 Increases Size and Scale 4 Enhances Operating Leverage 6 Significant Enhancement of Tankers International Pool 1 Purchase of Highly Efficient, Modern Sister Ships at an Attractive Price 17
237 125 49 0 45 115 255 192 0 185 220 255 153 204 255 91 155 213 165 165 165 68 84 106 Q&A