Attached files
| file | filename |
|---|---|
| EX-99.1 - EX-99.1 - SITE Centers Corp. | d512795dex991.htm |
| 8-K - 8-K - SITE Centers Corp. | d512795d8k.htm |
Exhibit 99.2

|
D D R C O R P.
STRATEGIC TRANSFORMATION INVESTOR PRESENTATION
DECEMBER 2017
|
SAFE HARBOR
DDR Corp. considers portions of the information in this presentation to be forward-looking statements within the meaning of Section 27A of the Securities Act of 1933 and
Section 21E of the Securities Exchange Act of 1934, both as amended, with respect to the Company’s expectation for future periods. Although the Company believes that the expectations reflected in such forward-looking statements are based
upon reasonable assumptions, it can give no assurance that its expectations will be achieved. For this purpose, any statements contained herein that are not historical fact may be deemed to be forward-looking statements. There are a number of
important factors that could cause our results to differ materially from those indicated by such forward-looking statements, including, among other factors, our ability to complete the spin-off in a timely
manner or at all, our ability to satisfy the various closing conditions to the spin-off and the financing thereof or have such conditions waived, our ability to obtain regulatory approvals required to complete
the spin-off in a timely manner or at all, the expected tax treatment of the spin-off, the composition of the spin-off portfolio,
our ability to obtain third-party consents required to transfer certain properties in connection with the spin-off, the impact of the spin-off on our business and that
of the spun-off company (“Spin-Co”), and the Company’s and Spin-Co’s ability to execute their respective business strategies following the spin-off. Other risks and uncertainties that could cause our results to differ materially from those indicated by such forward-looking statements include property damage, expenses related thereto and other business
and economic consequences (including the potential loss of rental revenues) resulting from extreme weather conditions in locations where we own properties, and the ability to estimate accurately the amounts thereof; sufficiency and timing of any
insurance recovery payments related to damages from extreme weather conditions; local conditions such as supply of space or a reduction in demand for real estate in the area; competition from other available space; dependence on rental income from
real property; the loss of, significant downsizing of or bankruptcy of a major tenant; redevelopment and construction activities may not achieve a desired return on investment; our ability to buy or sell assets on commercially reasonable terms; our
ability to complete acquisitions or dispositions of assets under contract; our ability to secure equity or debt financing on commercially acceptable terms or at all; our ability to enter into definitive agreements with regard to our financing and
joint venture arrangements or our failure to satisfy conditions to the completion of these arrangements; the success of our deleveraging strategy; and our ability to maintain our REIT status.
For additional factors that could cause the results of the Company to differ materially from those indicated in the forward-looking statements, please refer to the Company’s
most recent reports on Form 10-K and Form 10-Q. The Company undertakes no obligation to publicly revise these forward-looking statements to reflect events or
circumstances that arise after the date hereof.
In addition, this presentation includes certain non-GAAP financial
measures. Non-GAAP financial measures should not be considered replacements for, and should be read together with, the most comparable GAAP measures. Reconciliations of these
non-GAAP financial measures to the most directly comparable
GAAP measures can be found in the appendix to this
presentation.
DDR CORP. // STRAT E G I C T R A N S F O R M AT I O N I N V E S T O R P R E S E N TAT I O N
2
|
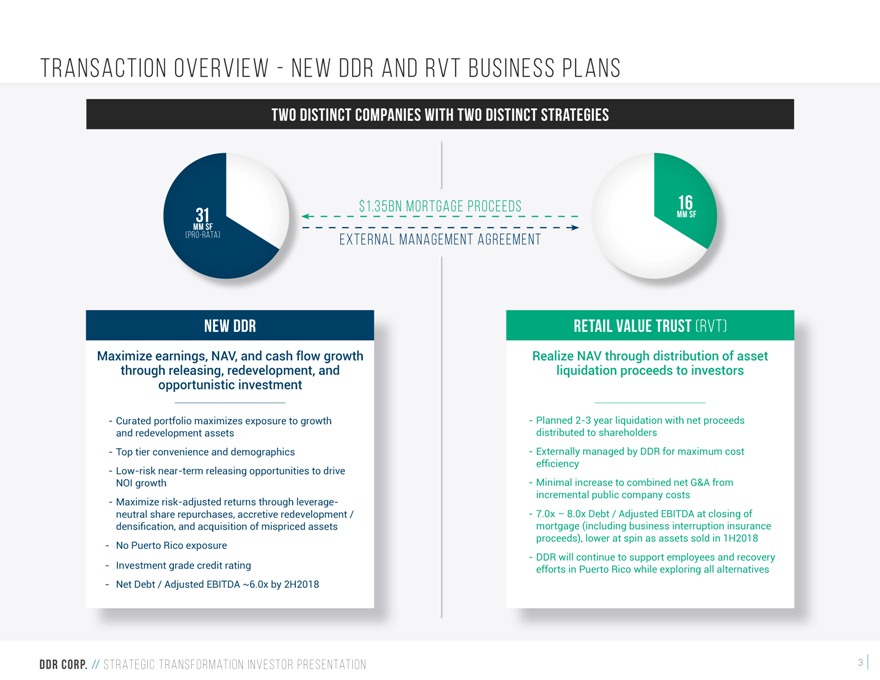
TRANSACTION OVERVIEW—NEW DDR AND RVT BUSINESS
PLANS
TWO DISTINCT COMPANIES WITH TWO DISTINCT STRATEGIES
MM 31 SF
(PRO-RATA)
$1.35BN MORTGAGE PROCEEDS
EXTERNAL MANAGEMENT AGREEMENT
16 MM SF
NEW DDR
Maximize earnings, NAV, and cash flow growth through releasing, redevelopment, and
opportunistic investment
Curated portfolio maximizes exposure to growth and redevelopment assets Top tier convenience and demographics Low-risk near-term releasing opportunities to drive NOI growth Maximize risk-adjusted returns through leverage- neutral share repurchases, accretive redevelopment /
densification,andacquisitionofmispricedassets
No Puerto Rico exposure Investment grade credit
rating
Net Debt / Adjusted EBITDA ~6.0x by 2H2018
RETAIL VALUE TRUST (RVT)
Realize NAV through distribution of asset liquidation proceeds to investors
Planned 2-3 year liquidation with net proceeds distributed to shareholders Externally managed by DDR for maximum cost
efficiency
Minimal increase to combined net G&A from incremental public
company costs 7.0x – 8.0x Debt / Adjusted EBITDA at closing of mortgage (including business interruption insurance proceeds), lower at spin as assets sold in 1H2018 DDR will continue to support employees and recovery efforts in Puerto Rico
while exploring all alternatives
DDR CORP. // STRAT E G I C T R A N S F O R M AT I O N I N V E S T O R P R E S E N TAT I O N
3
|
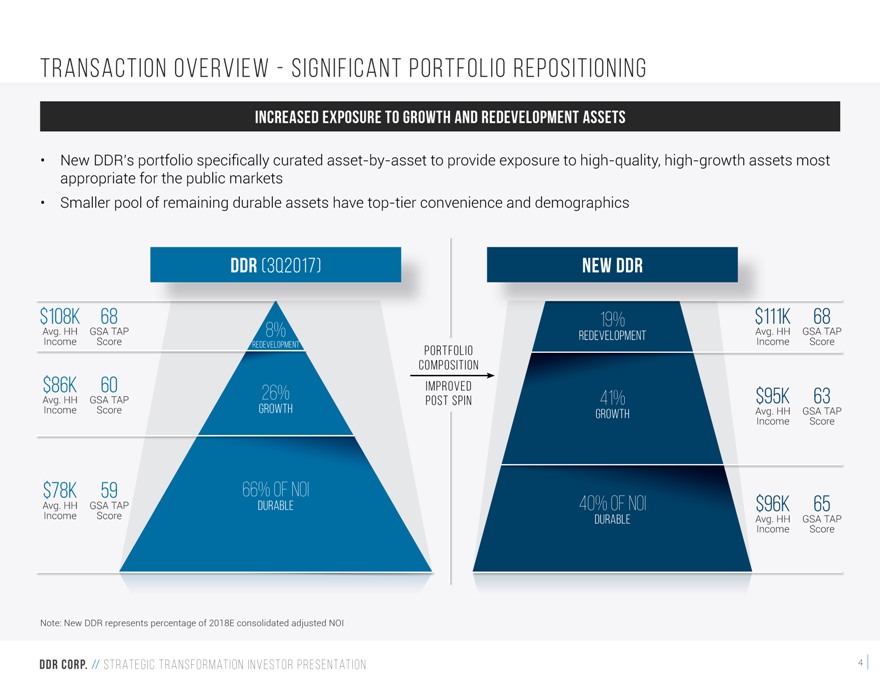
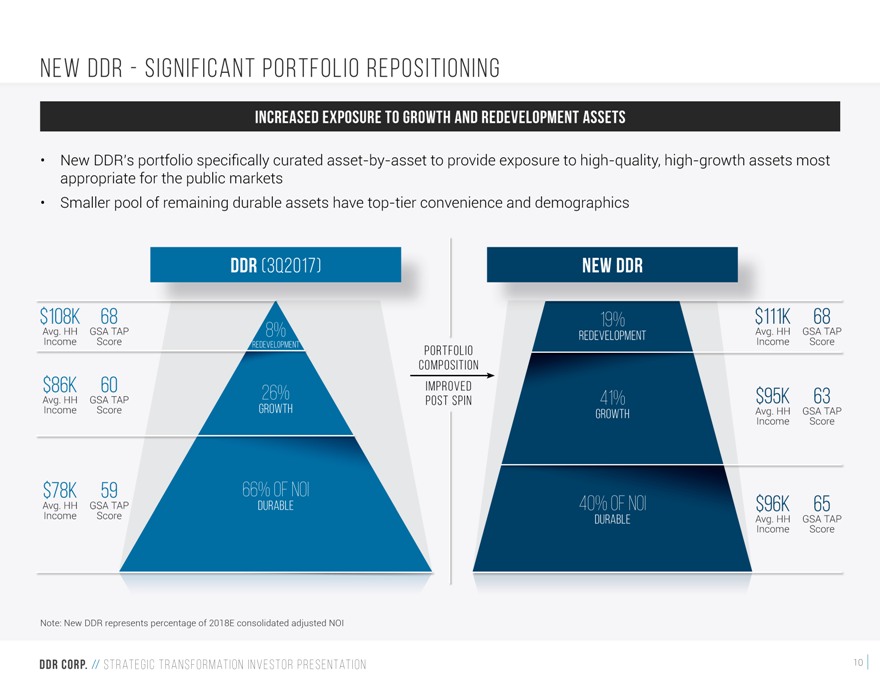
TRANSACTION OVERVIEW—SIGNIFICANT PORTFOLIO
REPOSITIONING
INCREASED EXPOSURE TO GROWTH AND REDEVELOPMENT ASSETS
New
DDR’s portfolio specifically curated asset-by-asset to provide exposure to high-quality, high-growth assets most appropriate for the public markets Smaller pool of
remaining durable assets have top-tier convenience and demographics
DDR (3Q2017)
$108K 68
Avg. Income HH GSA Score TAP 8%
REDEVELOPMENT
$86K 60 26%
Avg. HH GSA TAP
Income Score GROWTH
$78K 59 66% OF NOI
Avg. Income HH GSA Score TAP DURABLE
PORTFOLIO COMPOSITION
IMPROVED POST SPIN
NEW DDR
19%
REDEVELOPMENT
41%
GROWTH
40% OF NOI
DURABLE
$111K 68
Avg. Income HH GSA Score TAP
$95K 63
Avg. Income HH GSA Score TAP
$96K 65
Avg. Income HH GSA Score TAP
Note: New DDR represents percentage of 2018E consolidated
adjusted NOI
DDR CORP. // STRAT E G I C T R A N S F O R M AT I O N I N V E S T O R P R E S E N TAT I O N
4
|
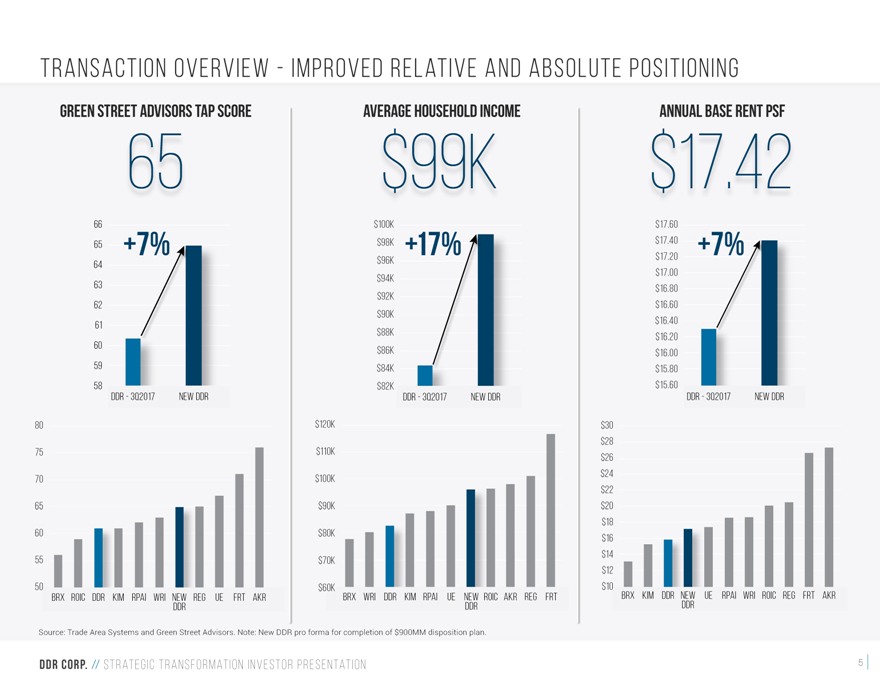
TRANSACTION OVERVIEW—IMPROVED RELATIVE AND
ABSOLUTE POSITIONING
GREEN STREET ADVISORS TAP SCORE
65
66
65 +7%
64 63 62 61 60 59 58
DDR—3Q2017 NEW DDR
80 75 70 65 60 55 50
BRX ROIC DDR KIM RPAI WRI NEW DDR REG UE FRT AKR
AVERAGE HOUSEHOLD INCOME
$99K
$100K $98K +17% $96K $94K $92K $90K $88K $86K $84K $82K
DDR—3Q2017 NEW DDR
$120K $110K $100K $90K $80K $70K
$60K BRX WRI DDR KIM RPAI UE NEW ROIC AKR REG FRT DDR
ANNUAL BASE RENT PSF
$17.42
$17.60 $17.40 +7% $17.20 $17.00 $16.80 $16.60 $16.40 $16.20 $16.00 $15.80 $15.60
DDR—3Q2017 NEW DDR
$30 $28 $26 $24 $22 $20 $18 $16 $14 $12
$10 BRX KIM DDR NEW UE RPAI WRI ROIC REG FRT AKR
DDR
Source: Trade Area Systems and Green Street Advisors. Note: New DDR pro forma for completion of $900MM disposition plan.
5
|
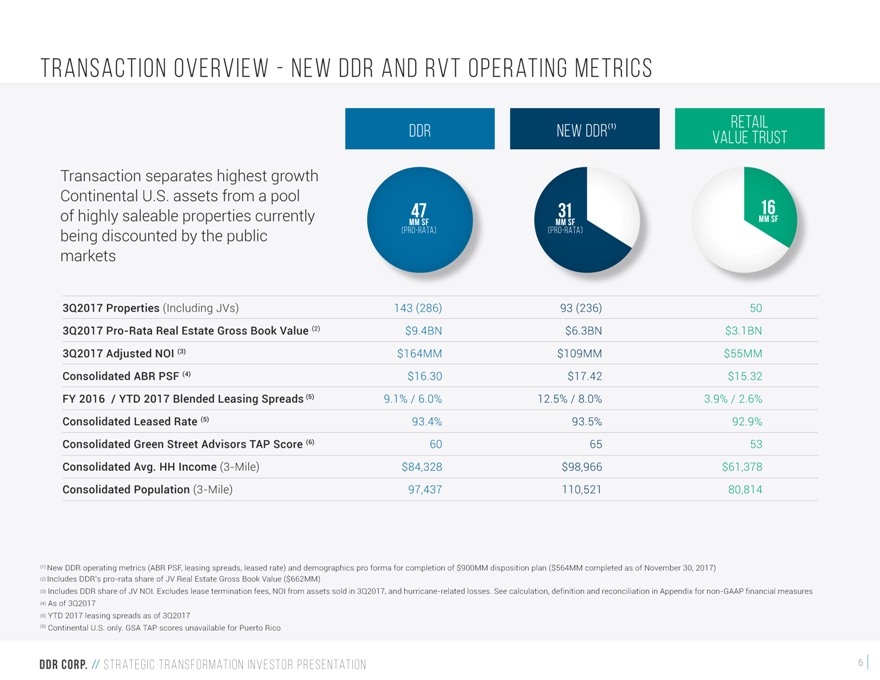
TRANSACTION OVERVIEW—NEW DDR AND RVT OPERATING
METRICS
Transaction separates highest growth Continental U.S. assets from a pool of highly saleable properties currently being discounted by the public markets
(1) RETAIL DDR NEW DDR VALUE TRUST
47 31 MM 16 SF
(PRO-RATA) MM SF (PRO-RATA) MM SF
3Q2017 Properties (Including JVs) 143 (286) 93 (236) 50
3Q2017
Pro-Rata Real Estate Gross Book Value (2) $9.4BN $6.3BN $3.1BN 3Q2017 Adjusted NOI (3) $164MM $109MM $55MM Consolidated ABR PSF (4) $16.30 $17.42 $15.32 FY 2016 / YTD 2017 Blended Leasing Spreads (5) 9.1% /
6.0% 12.5% / 8.0% 3.9% / 2.6% Consolidated Leased Rate (5) 93.4% 93.5% 92.9% Consolidated Green Street Advisors TAP Score (6) 60 65 53
Consolidated Avg. HH Income (3-Mile) $84,328 $98,966 $61,378
Consolidated Population (3-Mile) 97,437 110,521 80,814
(1) New DDR operating metrics (ABR PSF, leasing spreads, leased rate) and demographics pro forma for completion of $900MM disposition plan ($564MM completed as of
November 30, 2017) (2) Includes DDR’s pro-rata share of JV Real Estate Gross Book Value ($662MM)
(3) Includes DDR
share of JV NOI. Excludes lease termination fees, NOI from assets sold in 3Q2017, and hurricane-related losses. See calculation, definition and reconciliation in Appendix for non-GAAP financial measures
(4) As of 3Q2017
(5) YTD 2017 leasing spreads as of 3Q2017
(6) Continental U.S. only. GSA TAP scores unavailable for Puerto Rico
DDR CORP. // STRAT E G I
C T R A N S F O R M AT I O N I N V E S T O R P R E S E N TAT I O N
6
|
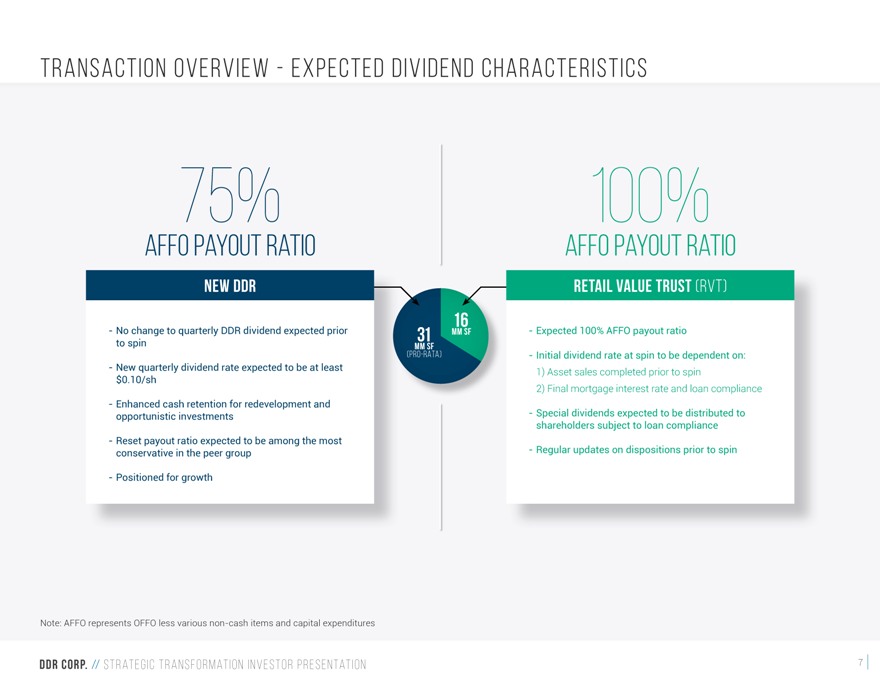
TRANSACTION OVERVIEW—EXPECTED DIVIDEND
CHARACTERISTICS
75%
AFFO PAYOUT RATIO
NEW DDR
No change to quarterly DDR dividend expected prior to spin
New quarterly dividend rate expected to be at least
$0.10/sh
Enhanced cash retention for redevelopment and opportunistic investments
Reset payout ratio
expected to be among the most conservative in the peer group
Positioned for growth
MM 16 SF MM 31 SF
(PRO-RATA)
100%
AFFO PAYOUT RATIO
RETAIL VALUE TRUST (RVT)
Expected 100% AFFO payout ratio
Initial dividend rate at spin to be dependent on:
1) Asset sales completed prior to spin
2) Final mortgage interest rate and loan compliance
Special dividends
expected to be distributed to shareholders subject to loan compliance
Regular updates on dispositions prior to spin
Note: AFFO represents OFFO less various non-cash items and capital expenditures
DDR CORP. // STRAT E G I C T R A N S F O R M AT I O N I N V E S T O R P R E S E N TAT I O N
7
|
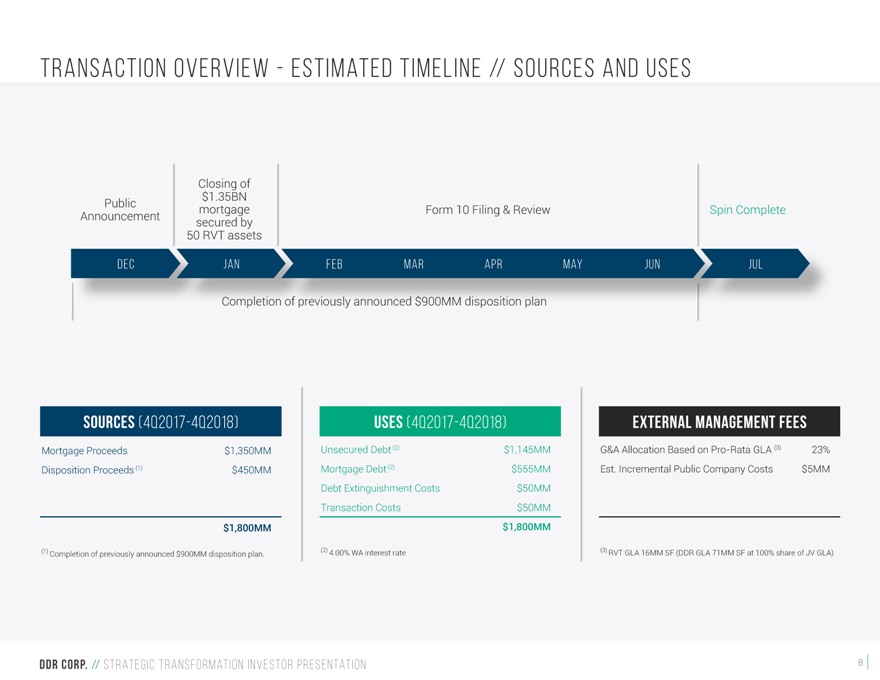
TRANSACTION OVERVIEW—ESTIMATED TIMELINE //
SOURCES AND USES
Closing $1.35BN of Public mortgage
Form 10 Filing &
Review Spin Complete Announcement secured by
50 RVT assets
DEC JAN FEB MAR
APR MAY JUN JUL
Completion of previously announced $900MM disposition plan
SOURCES (4Q2017-4Q2018)
Mortgage Proceeds $1,350MM
Disposition Proceeds (1) $450MM
$1,800MM
(1) Completion of previously announced $900MM disposition plan.
USES (4Q2017-4Q2018)
Unsecured Debt (2) $1,145MM Mortgage Debt (2) $555MM Debt Extinguishment Costs $50MM Transaction Costs $50MM $1,800MM
(2) 4.00% WA interest rate
EXTERNAL MANAGEMENT FEES
G&A Allocation Based on Pro-Rata GLA (3) 23% Est. Incremental Public Company Costs $5MM
(3) RVT GLA 16MM SF (DDR GLA 71MM SF at 100% share of JV GLA)
DDR CORP. // STRAT E G I C T R A
N S F O R M AT I O N I N V E S T O R P R E S E N TAT I O N
8
|
NEW DDR OVERVIEW
9
|
NEW DDR—SIGNIFICANT PORTFOLIO REPOSITIONING
INCREASED EXPOSURE TO GROWTH AND REDEVELOPMENT ASSETS
New DDR’s
portfolio specifically curated asset-by-asset to provide exposure to high-quality, high-growth assets most appropriate for the public markets Smaller pool of remaining
durable assets have top-tier convenience and demographics
DDR (3Q2017)
$108K 68
Avg. Income HH GSA Score TAP 8%
REDEVELOPMENT
$86K 60 26%
Avg. HH GSA TAP
Income Score GROWTH
$78K 59 66% OF NOI
Avg. Income HH GSA Score TAP DURABLE
Note: New DDR represents percentage of 2018E consolidated adjusted NOI
PORTFOLIO COMPOSITION
IMPROVED POST SPIN
NEW DDR
19% $111K 68
REDEVELOPMENT Avg. Income HH GSA Score TAP
41% $95K 63
GROWTH Avg. Income HH GSA Score TAP
40% OF NOI $96K 65
DURABLE Avg. Income HH GSA Score TAP
DDR CORP. // STRAT E G I C T R A N S F O R M AT I O N I N V E S T O R P R E S E N TAT I O N
10

|
NEW DDR—PORTFOLIO DIVERSITY
HIGH QUALITY DISCOUNTERS AND GROCERS ANCHOR THE MAJORITY OF NEW DDR CENTERS
Assets with
traditional / specialty grocers account for 40% of New DDR’s portfolio with average reported sales of $641/ft Including mass merchants with a grocery component, 70% of New DDR’s portfolio is anchored by a food component
VALUE / DISCOUNT TILT
27%
MAJOR OF ABR DISCOUNT WITH NO
COMPONENT
73%
QUALITY OF ABR ANCHORED DISCOUNTERS BY
High quality discounters, including Ross, T.J. Maxx brands, and Burlington anchor wholly-owned centers comprising
73% of New DDR’s ABR
ASSETS WITH SIGNIFICANT SHOP TO ANCHOR BALANCE
GROCERY COMPONENT
30% 18%
NO COMPONENT GROCERY SPECIALTY 22% 66%
GROCER
SHOP BY GLA
ANCHOR BY ABR
22% 34%
TRADITIONAL GROCER SHOP BY ABR
30% 78%
MASS MERCHANT ANCHOR BY GLA
Over two thirds of New DDR is anchored by traditional grocers, specialty grocers or mass merchants with a grocery component including Walmart, Target and Costco
New DDR’s centers derive 34% of ABR from in-line tenants even though only 22% of space is leased to shop tenants
DDR CORP. // STRAT E G I C T R A N S F O R M AT I O N I N V E S T O R P R E S E N TAT I O N
11
|
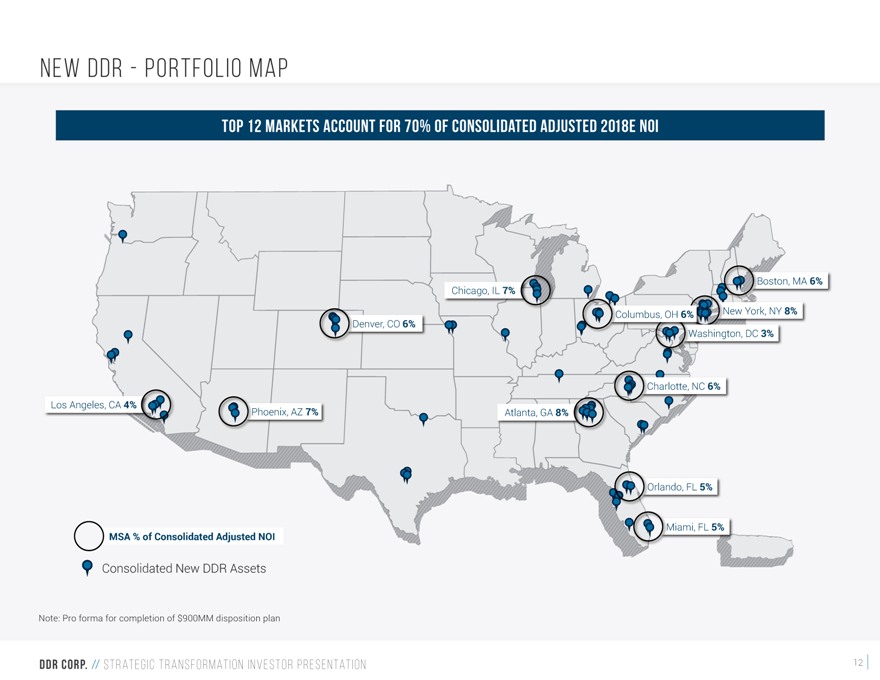
NEW DDR—PORTFOLIO MAP
TOP 12 MARKETS ACCOUNT FOR 70% OF CONSOLIDATED ADJUSTED 2018E NOI
Boston, MA 6%
Chicago, IL 7%
Columbus, OH 6% New York, NY 8%
Denver, CO 6%
Washington, DC 3%
Charlotte, NC 6%
Los Angeles, CA 4%
Phoenix, AZ 7% Atlanta, GA 8%
Orlando, FL 5%
Miami, FL 5%
MSA % of Consolidated Adjusted NOI
Consolidated New DDR Assets
Note: Pro forma for completion of $900MM disposition plan
DDR CORP. // STRAT E G I C T R A N S F O R M AT I O N I N V E S T O R P R E S E N TAT I O N
12
|
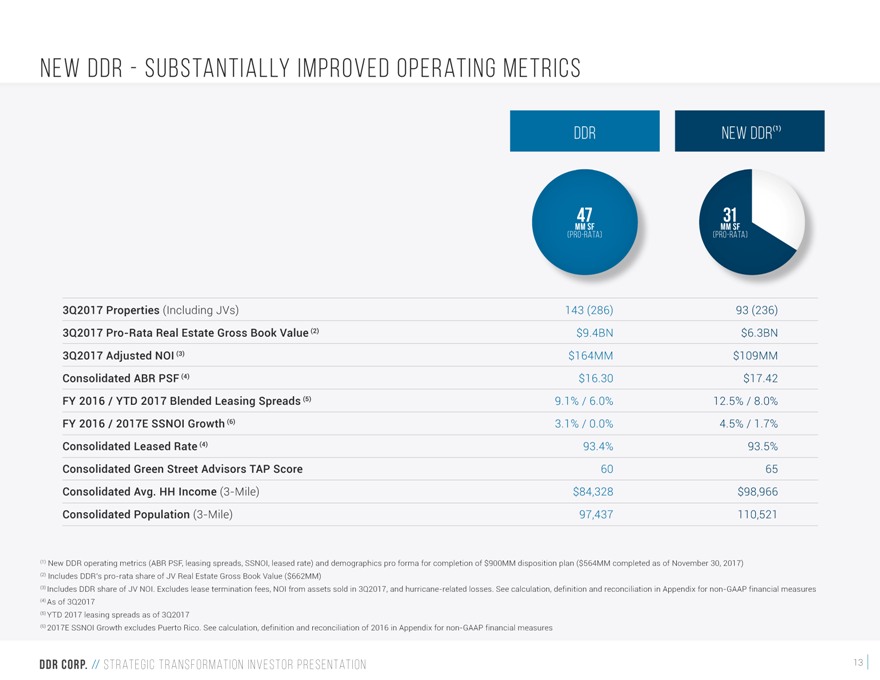
NEW DDR—SUBSTANTIALLY IMPROVED OPERATING
METRICS
DDR NEW DDR(1)
MM 47 SF MM 31 SF
(PRO-RATA) (PRO-RATA)
3Q2017 Properties (Including JVs) 143 (286) 93 (236)
3Q2017
Pro-Rata Real Estate Gross Book Value (2) $9.4BN $6.3BN
3Q2017 Adjusted NOI (3) $164MM $109MM
Consolidated ABR PSF (4) $16.30 $17.42
FY 2016 / YTD 2017 Blended Leasing Spreads (5) 9.1% /
6.0% 12.5% / 8.0%
FY 2016 / 2017E SSNOI Growth (6) 3.1% / 0.0% 4.5% / 1.7%
Consolidated Leased Rate (4) 93.4% 93.5%
Consolidated Green Street Advisors
TAP Score 60 65
Consolidated Avg. HH Income (3-Mile) $84,328 $98,966
Consolidated Population (3-Mile) 97,437 110,521
(1)
New DDR operating metrics (ABR PSF, leasing spreads, SSNOI, leased rate) and demographics pro forma for completion of $900MM disposition plan ($564MM completed as of November 30, 2017) (2) Includes DDR’s
pro-rata share of JV Real Estate Gross Book Value ($662MM)
(3) Includes DDR share of JV NOI. Excludes lease termination
fees, NOI from assets sold in 3Q2017, and hurricane-related losses. See calculation, definition and reconciliation in Appendix for non-GAAP financial measures
(4) As of 3Q2017
(5) YTD 2017 leasing spreads as of 3Q2017
(6) 2017E SSNOI Growth excludes Puerto Rico. See calculation, definition and reconciliation of 2016 in Appendix for non-GAAP financial
measures
DDR CORP. // STRAT E G I C T R A N S F O R M AT I O N I N V E S T O R P R E S E N TAT I O N
13
|
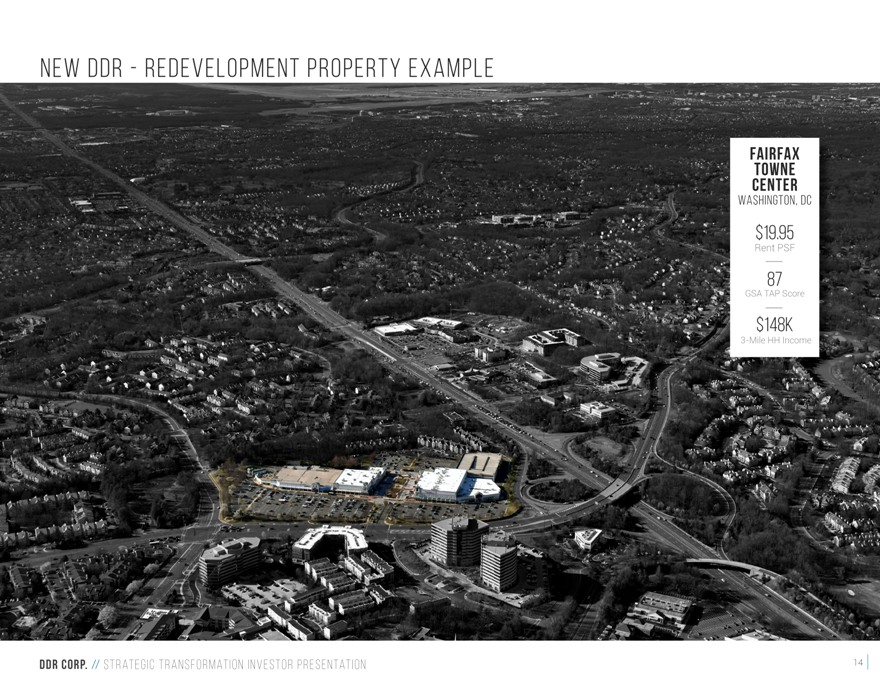
NEW DDR—REDEVELOPMENT PROPERTY EXAMPLE
FAIRFAX TOWNE
CENTER
WASHINGTON, DC
$19.95
Rent PSF
87
GSA TAP Score
$148K
3-Mile HH Income
DDR CORP. // STRAT E G I C T R A N S
F O R M AT I O N I N V E S T O R P R E S E N TAT I O N
14
|
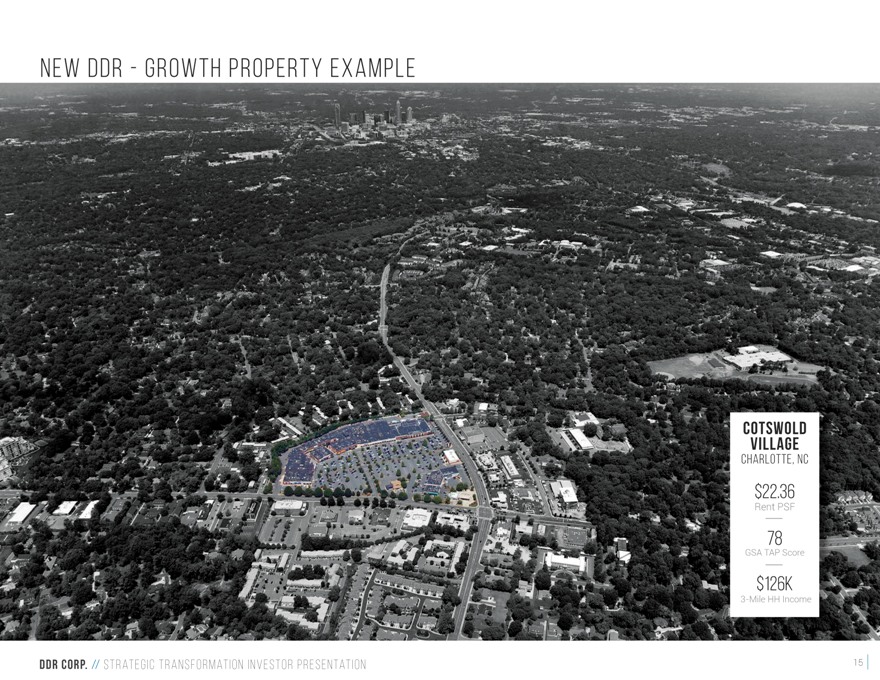
NEW DDR—GROWTH PROPERTY EXAMPLE
COTSWOLD VILLAGE
CHARLOTTE, NC
$22.36
Rent PSF
78
GSA TAP Score
$126K
3-Mile HH Income
DDR CORP. // STRAT E G I C T R A N S F O R M AT I O N I N V E S T O R P R E S E N TAT I O N
15
|
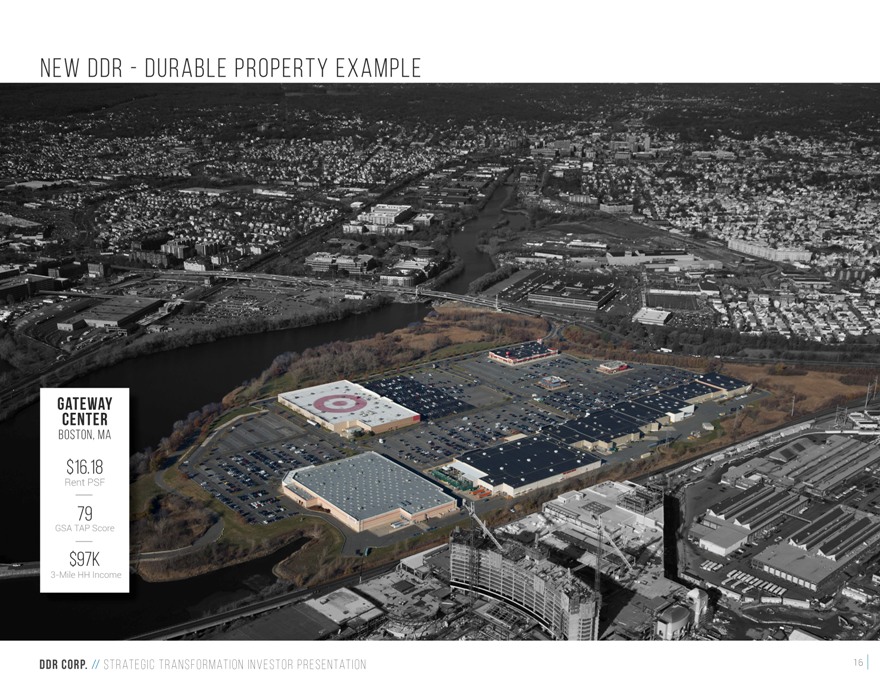
NEW DDR—DURABLE PROPERTY EXAMPLE
GATEWAY CENTER
BOSTON, MA
$16.18
Rent PSF
79
GSA TAP Score
$97K
3-Mile HH Income
DDR CORP. // STRAT E G I C T R A N S F O R M AT I O N I N V E S T O R P R E S E N TAT I O N
16
|
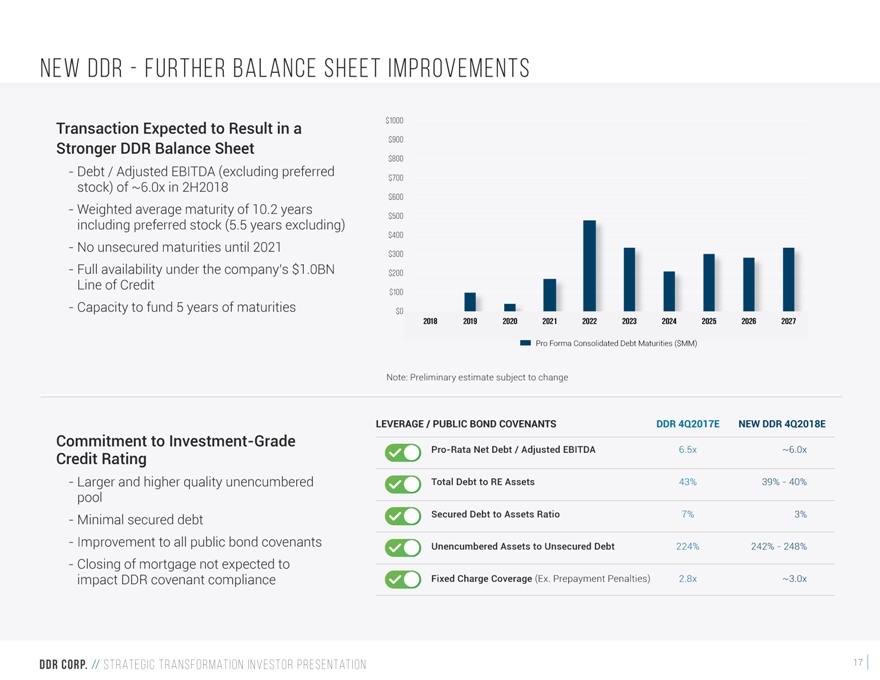
NEW DDR—FURTHER BALANCE SHEET IMPROVEMENTS
Transaction Expected to Result in a Stronger DDR Balance Sheet
Debt /
Adjusted EBITDA (excluding preferred stock) of ~6.0x in 2H2018
Weighted average maturity of 10.2 years including preferred stock (5.5 years excluding)
No unsecured maturities until 2021 Full availability under the company’s $1.0BN Line of Credit
Capacity to fund 5 years of maturities
$1000
$900
$800
$700
$600
$500
$400
$300
$200
$100
$0
2018 2019 2020 2021 2022 2023 2024 2025 2026 2027
Pro Forma Consolidated Debt
Maturities ($MM)
Note: Preliminary estimate subject to change
Commitment to
Investment-Grade Credit Rating
Larger and higher quality unencumbered pool
Minimal secured debt
Improvement to all public bond covenants Closing of
mortgage not expected to impact DDR covenant compliance
LEVERAGE / PUBLIC BOND COVENANTS DDR 4Q2017E NEW DDR 4Q2018E
Pro-Rata Net Debt / Adjusted EBITDA 6.5x ~6.0x Total Debt to RE Assets 43% 39%—40% Secured Debt to Assets Ratio 7% 3% Unencumbered
Assets to Unsecured Debt 224% 242%—248%
Fixed Charge Coverage (Ex. Prepayment Penalties) 2.8x ~3.0x
DDR CORP. // STRAT E G I C T R A N S F O R M AT I O N I N V E S T O R P R E S E N TAT I O N
17

|
RETAIL VALUE TRUST OVERVIEW
18
|
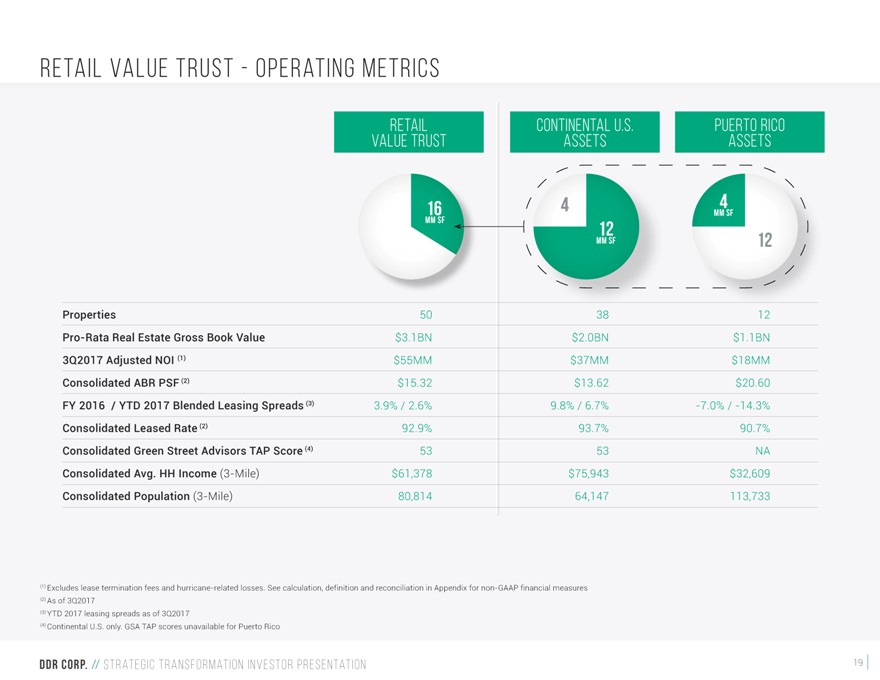
RETAIL VALUE TRUST—OPERATING METRICS
VALUE RETAIL TRUST CONTINENTAL ASSETS U.S. PUERTO ASSETS RICO
16 4 MM 4 SF
MM SF 12
MM SF 12
Properties 50 38 12
Pro-Rata Real Estate Gross Book
Value $3.1BN $2.0BN $1.1BN
3Q2017 Adjusted NOI (1) $55MM $37MM $18MM
Consolidated ABR PSF (2) $15.32 $13.62 $20.60
FY 2016 / YTD 2017 Blended
Leasing Spreads (3) 3.9% / 2.6% 9.8% / 6.7% -7.0% / -14.3%
Consolidated Leased Rate
(2) 92.9% 93.7% 90.7%
Consolidated Green Street Advisors TAP Score (4) 53 53 NA
Consolidated Avg. HH Income (3-Mile) $61,378 $75,943 $32,609
Consolidated Population (3-Mile) 80,814 64,147 113,733
(1) Excludes lease termination fees and hurricane-related losses. See calculation, definition and reconciliation in Appendix for
non-GAAP financial measures
(2) As of 3Q2017
(3) YTD 2017 leasing spreads as of 3Q2017
(4) Continental U.S. only. GSA TAP scores
unavailable for Puerto Rico
DDR CORP. // STRAT E G I C T R A N S F O R M AT I O N I N V E S T O R P R E S E N TAT I O N
19
|
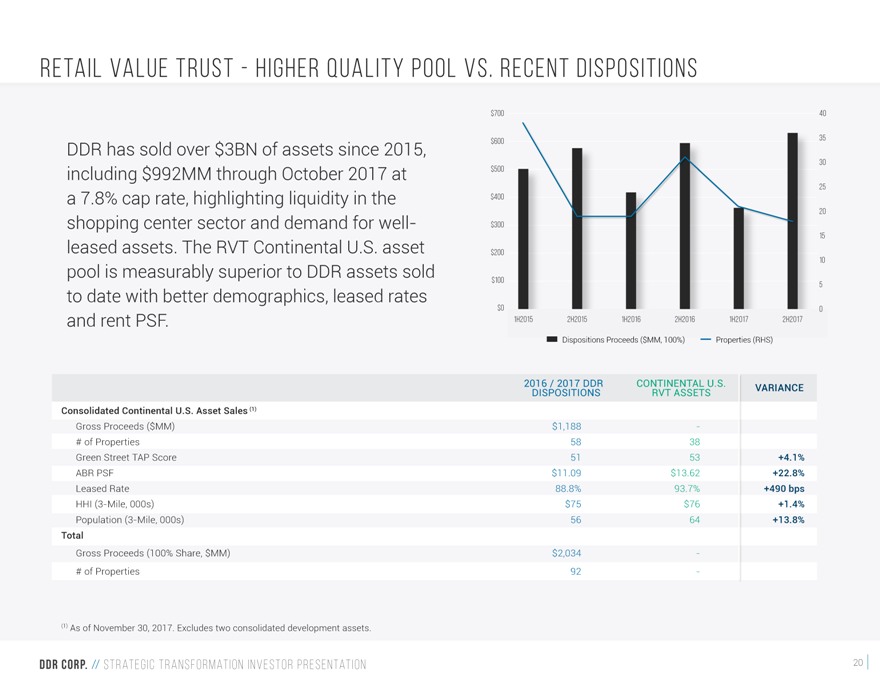
RETAIL VALUE TRUST—HIGHER QUALITY POOL VS.
RECENT DISPOSITIONS
DDR has sold over $3BN of assets since 2015, including $992MM through October 2017 at a 7.8% cap rate, highlighting liquidity in the shopping
center sector and demand for well-leased assets. The RVT Continental U.S. asset pool is measurably superior to DDR assets sold to date with better demographics, leased rates and rent PSF.
$700 40
$600 35
30
$500
25
$400
20
$300
15
$200 10
$100
5
$0 0
1H2015 2H2015 1H2016 2H2016 1H2017 2H2017
Dispositions Proceeds ($MM, 100%) Properties (RHS)
2016 / 2017 DDR CONTINENTAL U.S. VARIANCE
DISPOSITIONS RVT ASSETS
Consolidated Continental U.S. Asset Sales (1)
Gross Proceeds ($MM) $1,188 -
# of Properties 58 38
Green Street TAP Score 51 53 +4.1%
ABR PSF $11.09 $13.62 +22.8%
Leased Rate 88.8% 93.7% +490 bps
HHI (3-Mile, 000s)
$75 $76 +1.4%
Population (3-Mile, 000s) 56 64 +13.8%
Total
Gross Proceeds (100% Share, $MM) $2,034—
# of Properties 92—
(1) As of November 30, 2017. Excludes two consolidated
development assets.
DDR CORP. // STRAT E G I C T R A N S F O R M AT I O N I N V E S T O R P R E S E N TAT I O N
20
|
RETAIL VALUE TRUST—SELECT ASSET OVERVIEW
HIGHER QUALITY AND MORE LIQUID PORTFOLIO THAN ASSETS SOLD TO DATE
BEAVER
CREEK SEABROOK GRESHAM SILVER SPRING MARKETPLACE
CROSSINGS COMMONS STATION SQUARE AT TOWNE CENTRE
RALEIGH BOSTON PORTLAND HARRISBURG DALLAS
MSA MSA MSA MSA MSA
321K 175K 342K 343K 174K
Owned GLA Owned GLA Owned GLA Owned GLA Owned GLA
72 53 53 55 52
Green Street TAP Score Green Street TAP Score Green Street TAP Score Green
Street TAP Score Green Street TAP Score
$16.37 $18.57 $19.66 $17.90 $16.11
Rent PSF Rent PSF Rent PSF Rent PSF Rent PSF
DDR CORP. // STRAT E G I C T R A
N S F O R M AT I O N I N V E S T O R P R E S E N TAT I O N
21
|
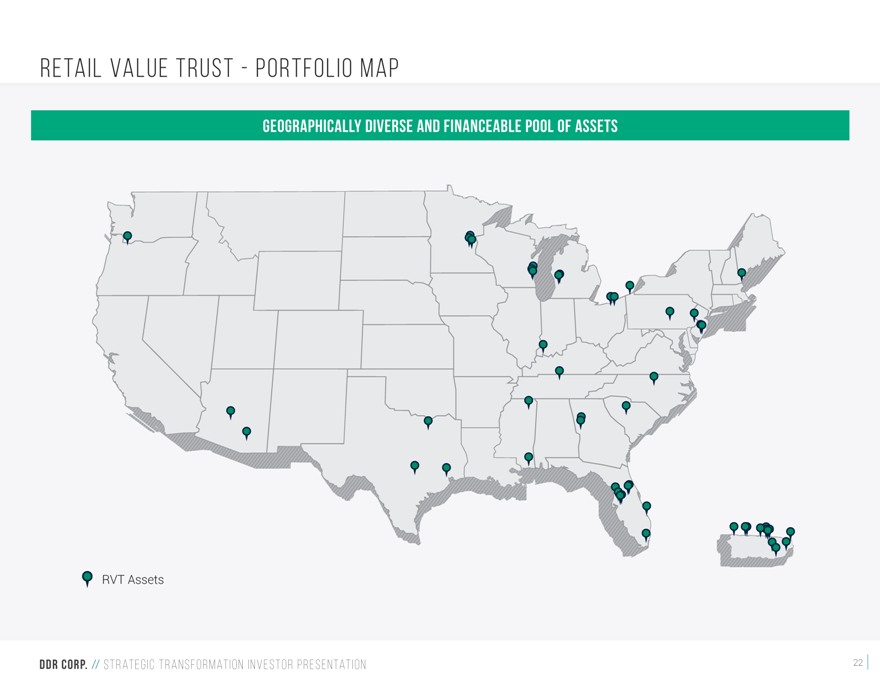
RETAIL VALUE TRUST—PORTFOLIO MAP
GEOGRAPHICALLY DIVERSE AND FINANCEABLE POOL OF ASSETS
RVT Assets
DDR CORP. // STRAT E G I C T R A N S F O R M AT I O N I N V E S T O R P R E S E N TAT I O N
22
|
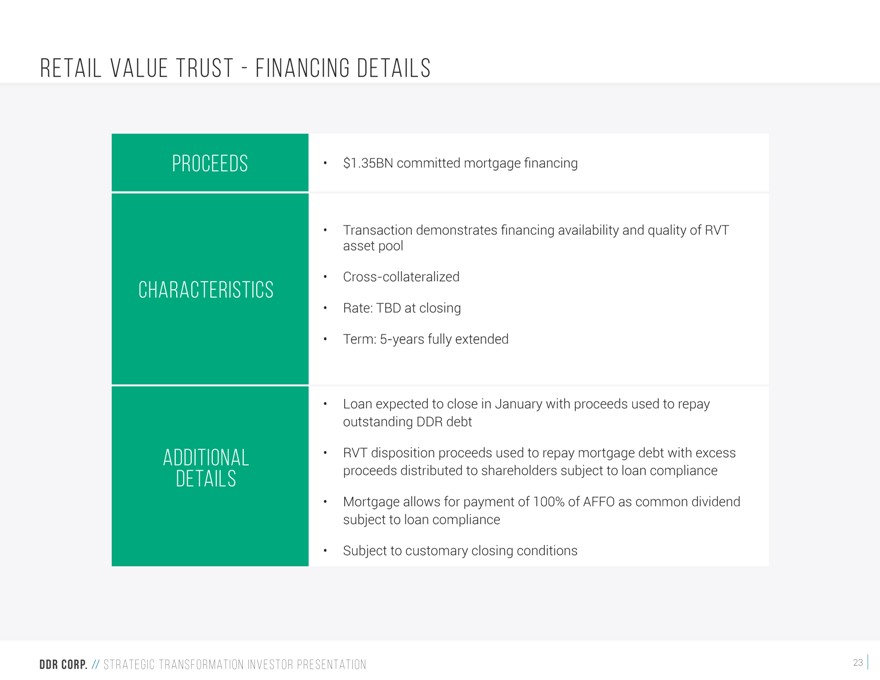
RETAIL VALUE TRUST—FINANCING DETAILS
PROCEEDS
CHARACTERISTICS
ADDITIONAL DETAILS
$1.35BN committed mortgage financing
Transaction demonstrates financing availability and quality of RVT asset pool
Cross-collateralized Rate: TBD at closing Term: 5-years fully extended
Loan expected to close in January with proceeds used to repay outstanding DDR debt RVT disposition proceeds used to repay mortgage debt with excess proceeds distributed to
shareholders subject to loan compliance Mortgage allows for payment of 100% of AFFO as common dividend subject to loan compliance Subject to customary closing conditions
DDR CORP. // STRAT E G I C T R A N S F O R M AT I O N I N V E S T O R P R E S E N TAT I O N
23

|
APPENDIX
24
|
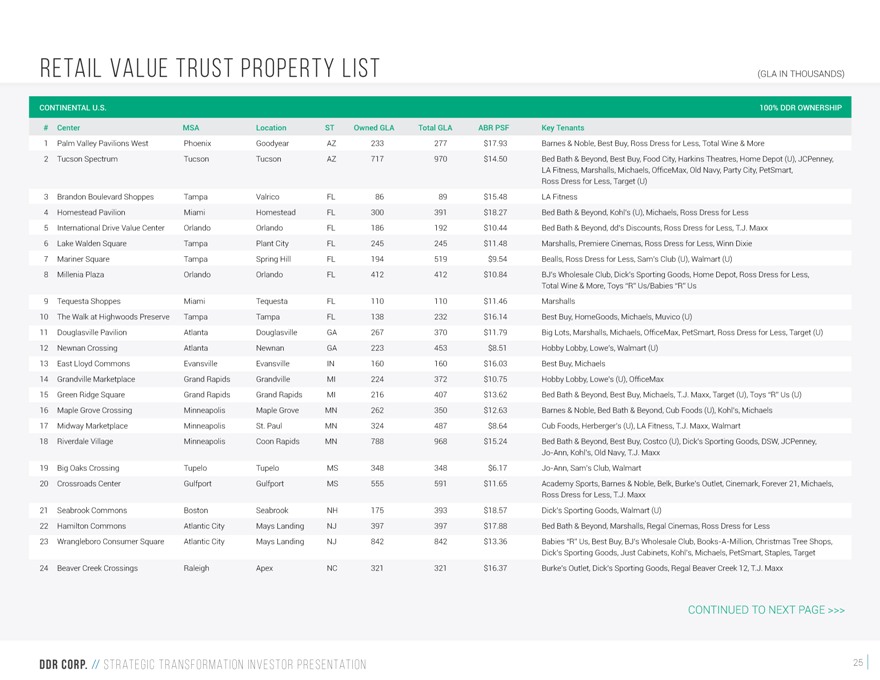
RETAIL VALUE TRUST PROPERTY LIST
(GLA IN THOUSANDS)
CONTINENTAL
U.S. 100% DDR OWNERSHIP
# Center MSA Location ST Owned GLA Total GLA
ABR PSF Key Tenants
1 Palm Valley Pavilions West Phoenix Goodyear AZ 233 277 $17.93 Barnes & Noble, Best Buy, Ross Dress for Less, Total Wine &
More
2 Tucson Spectrum Tucson Tucson AZ 717 970 $14.50 Bed Bath & Beyond, Best Buy, Food City, Harkins Theatres, Home Depot (U),
JCPenney, LA Fitness, Marshalls, Michaels, OfficeMax, Old Navy, Party City,
PetSmart, Ross Dress for Less, Target (U)
3 Brandon Boulevard
Shoppes Tampa Valrico FL 86 89 $15.48 LA Fitness
4 Homestead Pavilion Miami Homestead FL 300 391 $18.27 Bed Bath & Beyond, Kohl’s (U), Michaels, Ross
Dress for Less
5 International Drive Value Center Orlando Orlando FL 186 192 $10.44 Bed Bath & Beyond, dd’s Discounts, Ross Dress for Less, T.J. Maxx
6 Lake Walden Square Tampa Plant City FL 245 245 $11.48 Marshalls, Premiere Cinemas, Ross Dress for Less, Winn Dixie
7 Mariner Square Tampa Spring Hill FL 194 519 $9.54 Bealls, Ross Dress for Less, Sam’s Club (U), Walmart (U)
8 Millenia Plaza Orlando Orlando FL 412 412 $10.84 BJ’s Wholesale Club, Dick’s Sporting Goods, Home Depot, Ross Dress for
Less, Total Wine & More, Toys “R” Us/Babies “R” Us
9 Tequesta Shoppes Miami Tequesta FL 110 110 $11.46 Marshalls
10 The Walk at Highwoods
Preserve Tampa Tampa FL 138 232 $16.14 Best Buy, HomeGoods, Michaels, Muvico (U)
11 Douglasville Pavilion Atlanta Douglasville GA 267 370 $11.79 Big Lots,
Marshalls, Michaels, OfficeMax, PetSmart, Ross Dress for Less, Target (U)
12 Newnan Crossing Atlanta Newnan GA 223 453 $8.51 Hobby Lobby, Lowe’s, Walmart (U)
13 East Lloyd Commons Evansville Evansville IN 160 160 $16.03 Best Buy, Michaels
14 Grandville Marketplace Grand Rapids Grandville MI 224 372 $10.75 Hobby Lobby, Lowe’s (U), OfficeMax
15 Green Ridge Square Grand Rapids Grand Rapids MI 216 407 $13.62 Bed Bath & Beyond, Best Buy, Michaels, T.J. Maxx, Target (U), Toys “R” Us (U)
16 Maple Grove Crossing Minneapolis Maple Grove MN 262 350 $12.63 Barnes & Noble, Bed Bath & Beyond, Cub Foods (U), Kohl’s, Michaels
17 Midway Marketplace Minneapolis St. Paul MN 324 487 $8.64 Cub Foods, Herberger’s (U), LA Fitness, T.J. Maxx, Walmart
18 Riverdale Village Minneapolis Coon Rapids MN 788 968 $15.24 Bed Bath & Beyond, Best Buy, Costco (U), Dick’s Sporting Goods, DSW,
JCPenney, Jo-Ann, Kohl’s, Old Navy, T.J. Maxx
19 Big Oaks Crossing Tupelo Tupelo MS 348 348 $6.17 Jo-Ann, Sam’s Club, Walmart
20 Crossroads Center Gulfport Gulfport MS 555 591 $11.65 Academy Sports, Barnes & Noble, Belk, Burke’s Outlet, Cinemark, Forever 21,
Michaels, Ross Dress for Less, T.J. Maxx
21 Seabrook Commons Boston
Seabrook NH 175 393 $18.57 Dick’s Sporting Goods, Walmart (U)
22 Hamilton Commons Atlantic City Mays Landing NJ 397 397 $17.88 Bed Bath & Beyond,
Marshalls, Regal Cinemas, Ross Dress for Less
23 Wrangleboro Consumer Square Atlantic City Mays Landing NJ 842 842 $13.36 Babies “R” Us, Best Buy,
BJ’s Wholesale Club, Books-A-Million, Christmas Tree
Shops, Dick’s Sporting Goods, Just Cabinets, Kohl’s, Michaels, PetSmart, Staples, Target
24 Beaver Creek Crossings Raleigh Apex NC 321 321 $16.37 Burke’s Outlet, Dick’s Sporting Goods, Regal Beaver Creek 12, T.J. Maxx
CONTINUED TO NEXT PAGE >>>
DDR CORP. // STRAT E G I C T R A N S F O R M AT I O N I N
V E S T O R P R E S E N TAT I O N
25
|
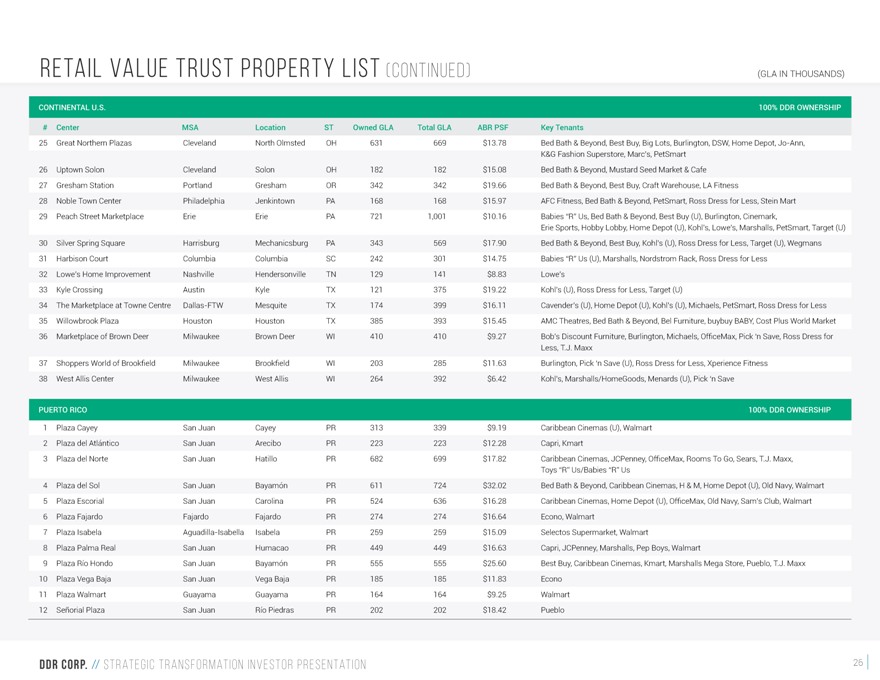
RETAIL VALUE TRUST PROPERTY LIST (CONTINUED)
(GLA IN THOUSANDS)
CONTINENTAL
U.S. 100% DDR OWNERSHIP
# Center MSA Location ST Owned GLA Total GLA
ABR PSF Key Tenants
25 Great Northern Plazas Cleveland North Olmsted OH 631 669 $13.78 Bed Bath & Beyond, Best Buy, Big Lots, Burlington, DSW, Home Depot,
Jo-Ann, K&G Fashion Superstore, Marc’s, PetSmart
26 Uptown Solon Cleveland Solon OH 182 182 $15.08 Bed Bath & Beyond, Mustard Seed Market & Cafe
27 Gresham Station Portland Gresham OR 342 342 $19.66 Bed Bath & Beyond, Best Buy, Craft Warehouse, LA Fitness
28 Noble Town Center Philadelphia Jenkintown PA 168 168 $15.97 AFC Fitness, Bed Bath & Beyond, PetSmart, Ross Dress for Less, Stein Mart
29 Peach Street Marketplace Erie Erie PA 721 1,001 $10.16 Babies “R” Us, Bed Bath & Beyond, Best Buy (U), Burlington, Cinemark,
Erie Sports, Hobby Lobby, Home Depot (U), Kohl’s, Lowe’s, Marshalls, PetSmart, Target (U)
30 Silver Spring Square Harrisburg Mechanicsburg PA 343 569 $17.90 Bed Bath & Beyond, Best Buy, Kohl’s (U), Ross Dress for Less, Target (U), Wegmans
31 Harbison Court Columbia Columbia SC 242 301 $14.75 Babies “R” Us (U), Marshalls, Nordstrom Rack, Ross Dress for Less
32 Lowe’s Home Improvement Nashville Hendersonville TN 129 141 $8.83 Lowe’s
33 Kyle
Crossing Austin Kyle TX 121 375 $19.22 Kohl’s (U), Ross Dress for Less, Target (U)
34 The Marketplace at Towne Centre
Dallas-FTW Mesquite TX 174 399 $16.11 Cavender’s (U), Home Depot (U), Kohl’s (U), Michaels, PetSmart, Ross Dress for Less
35 Willowbrook Plaza Houston Houston TX 385 393 $15.45 AMC Theatres, Bed Bath & Beyond, Bel Furniture, buybuy BABY, Cost Plus World Market
36 Marketplace of Brown Deer Milwaukee Brown Deer WI 410 410 $9.27 Bob’s Discount Furniture, Burlington, Michaels, OfficeMax, Pick ‘n Save, Ross Dress
for Less, T.J. Maxx
37 Shoppers World of Brookfield Milwaukee
Brookfield WI 203 285 $11.63 Burlington, Pick ‘n Save (U), Ross Dress for Less, Xperience Fitness
38 West Allis Center Milwaukee West Allis WI 264 392 $6.42
Kohl’s, Marshalls/HomeGoods, Menards (U), Pick ‘n Save
PUERTO
RICO 100% DDR OWNERSHIP
1 Plaza Cayey San Juan Cayey PR 313 339
$9.19 Caribbean Cinemas (U), Walmart
2 Plaza del Atlántico San Juan Arecibo PR 223 223 $12.28 Capri, Kmart
3 Plaza del Norte San Juan Hatillo PR 682 699 $17.82 Caribbean Cinemas, JCPenney, OfficeMax, Rooms To Go, Sears, T.J.
Maxx, Toys “R” Us/Babies “R” Us
4 Plaza del Sol
San Juan Bayamón PR 611 724 $32.02 Bed Bath & Beyond, Caribbean Cinemas, H & M, Home Depot (U), Old Navy, Walmart
5 Plaza Escorial San
Juan Carolina PR 524 636 $16.28 Caribbean Cinemas, Home Depot (U), OfficeMax, Old Navy, Sam’s Club, Walmart
6 Plaza Fajardo Fajardo Fajardo PR 274 274 $16.64
Econo, Walmart
7 Plaza Isabela Aguadilla-Isabella Isabela PR 259 259 $15.09 Selectos Supermarket, Walmart
8 Plaza Palma Real San Juan Humacao PR 449 449 $16.63 Capri, JCPenney, Marshalls, Pep Boys, Walmart
9 Plaza Río Hondo San Juan Bayamón PR 555 555 $25.60 Best Buy, Caribbean Cinemas, Kmart, Marshalls Mega Store, Pueblo, T.J. Maxx
10 Plaza Vega Baja San Juan Vega Baja PR 185 185 $11.83 Econo
11 Plaza Walmart Guayama Guayama
PR 164 164 $9.25 Walmart
12 Señorial Plaza San Juan Río Piedras PR 202 202 $18.42 Pueblo
DDR CORP. // STRAT E G I C T R A N S F O R M AT I O N I N V E S T O R P R E S E N TAT I O N
26
|
NON-GAAP
FINANCIAL MEASURES—DEFINITIONS
The Company uses Net Operating Income (“NOI”), a non-GAAP financial measure,
as a supplemental performance measure. NOI is calculated herein as property revenues less property expenses. The Company believes NOI provides useful information to investors regarding the Company’s financial condition and results of operations
because it reflects only those income and expense items that are incurred at the property level and, when compared across periods, reflects the impact on operations from trends in occupancy rates, rental rates, operating costs and acquisition and
disposition activity on an unleveraged basis. The Company has further adjusted NOI to exclude lease termination fees, hurricane-related losses and activity associated with all properties sold during the third quarter ended September 30, 2017
(“Adjusted NOI”).
The Company also presents NOI information on a same store basis or SSNOI. The Company defines SSNOI as property revenues less
property-related expenses, which exclude straight-line rental income and expenses, lease termination income, management fee expense, fair market value of leases and expense recovery adjustments. SSNOI also excludes activity associated with
development and major redevelopment and single tenant assets and includes assets owned in comparable periods. SSNOI excludes all non-property and corporate level revenue and expenses as well as
hurricane-related losses. Other real estate companies may calculate SSNOI in a different manner. The Company believes SSNOI provides investors with additional information regarding the operating performances of comparable assets because it excludes
certain non-cash and non-comparable items as noted above. SSNOI is frequently used by the real estate industry, as well as securities analysts, investors and other
interested parties, to evaluate the performance of REITs.
The Company believes that Adjusted NOI and SSNOI are not, and are not intended to be, presentations in
accordance with GAAP. Adjusted NOI and SSNOI information have their limitations as they exclude any capital expenditures associated with the re-leasing of tenant space or as needed to operate the assets.
Adjusted NOI and SSNOI do not represent amounts available for dividends, capital replacement or expansion, debt service obligations or other commitments and uncertainties. Management does not use Adjusted NOI or SSNOI as indicators of the
Company’s cash obligations and funding requirements for future commitments, acquisitions or development activities. Adjusted NOI and SSNOI do not represent cash generated from operating activities in accordance with GAAP, and are not
necessarily indicative of cash available to fund cash needs. Adjusted NOI and SSNOI should not be considered as alternatives to net income (computed in accordance with GAAP), as indicators of operating performance or as alternatives to cash flow as
measures of liquidity. Reconciliations of Adjusted NOI and SSNOI to the most directly comparable GAAP measure of net income (loss) have been provided herein.
DDR
CORP. // STRAT E G I C T R A N S F O R M AT I O N I N V E S T O R P R E S E N TAT I O N
27
|
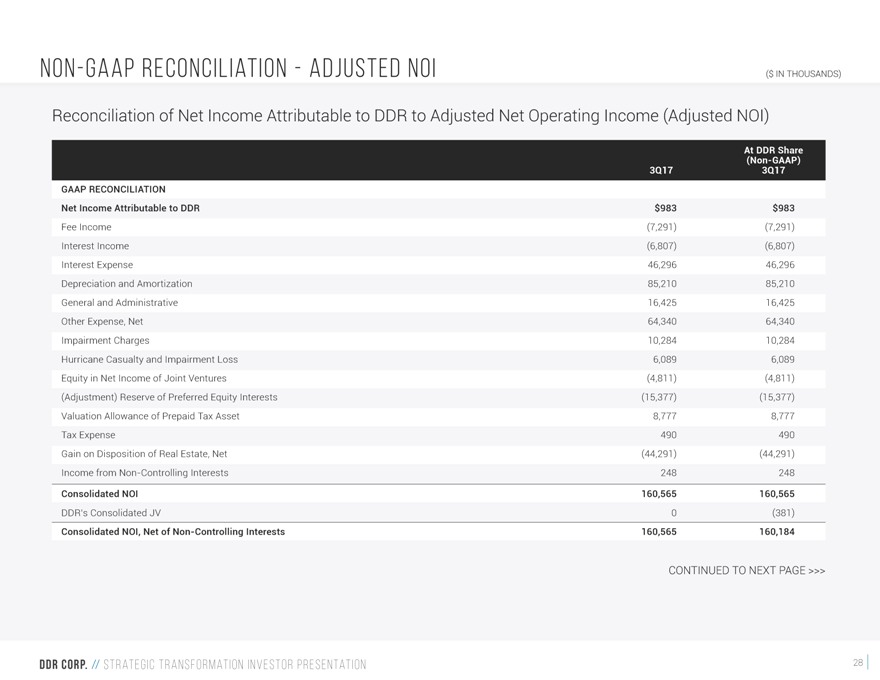
NON-GAAP
RECONCILIATION—ADJUSTED NOI
($ IN THOUSANDS)
Reconciliation of Net
Income Attributable to DDR to Adjusted Net Operating Income (Adjusted NOI)
At (Non DDR -GAAP) Share
3Q17 3Q17
GAAP RECONCILIATION
Net Income Attributable to DDR $983 $983
Fee Income (7,291) (7,291)
Interest Income (6,807) (6,807)
Interest Expense 46,296 46,296
Depreciation and Amortization 85,210 85,210
General and Administrative 16,425 16,425
Other Expense, Net 64,340 64,340
Impairment Charges 10,284 10,284
Hurricane Casualty and Impairment Loss 6,089 6,089
Equity in Net Income of Joint Ventures
(4,811) (4,811)
(Adjustment) Reserve of Preferred Equity Interests (15,377) (15,377)
Valuation Allowance of Prepaid Tax Asset 8,777 8,777
Tax Expense 490 490
Gain on Disposition of Real Estate, Net (44,291) (44,291)
Income from Non-Controlling Interests 248 248
Consolidated NOI 160,565 160,565
DDR’s Consolidated JV 0 (381)
Consolidated NOI, Net of
Non-Controlling Interests 160,565 160,184
CONTINUED TO NEXT PAGE >>>
DDR CORP. // STRAT E G I C T R A N S F O R M AT I O N I N V E S T O R P R E S E N TAT I O N
28
|
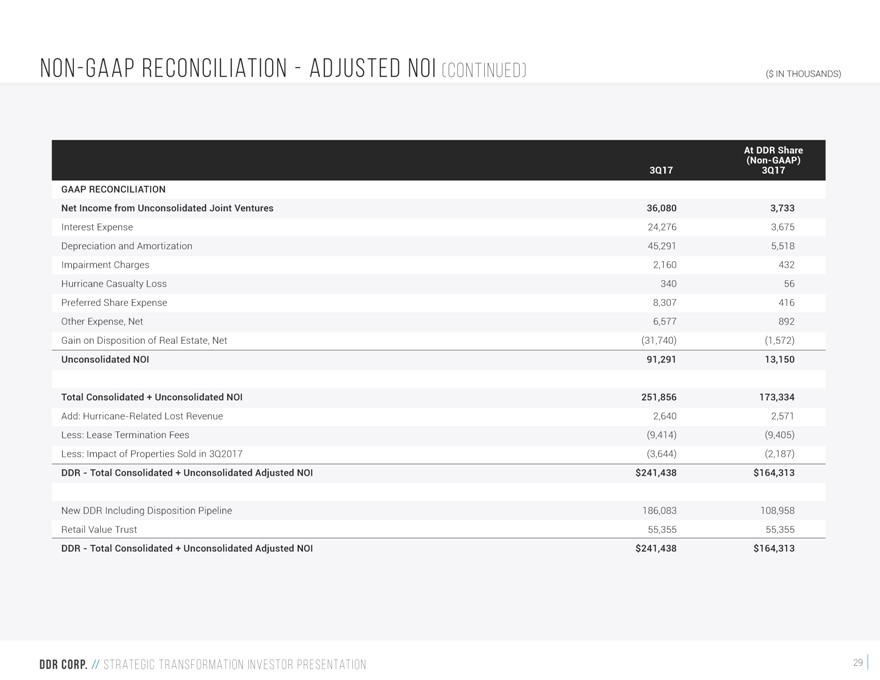
NON-GAAP
RECONCILIATION—ADJUSTED NOI (CONTINUED)
($ IN THOUSANDS)
At (Non-GAAP) DDR Share
3Q17 3Q17
GAAP
RECONCILIATION
Net Income from Unconsolidated Joint Ventures 36,080 3,733
Interest Expense 24,276 3,675
Depreciation and Amortization 45,291 5,518
Impairment Charges 2,160 432
Hurricane Casualty Loss 340 56
Preferred Share Expense 8,307 416
Other Expense, Net 6,577 892
Gain on Disposition of Real Estate, Net (31,740) (1,572)
Unconsolidated NOI 91,291 13,150
Total Consolidated + Unconsolidated NOI 251,856 173,334
Add:
Hurricane-Related Lost Revenue 2,640 2,571
Less: Lease Termination Fees (9,414) (9,405)
Less: Impact of Properties Sold in 3Q2017 (3,644) (2,187)
DDR—Total Consolidated +
Unconsolidated Adjusted NOI $241,438 $164,313
New DDR Including Disposition Pipeline 186,083 108,958
Retail Value Trust 55,355 55,355
DDR—Total Consolidated + Unconsolidated Adjusted NOI
$241,438 $164,313
DDR CORP. // STRAT E G I C T R A N S F O R M AT I O N I N V E S T O R P R E S E N TAT I O N
29
|
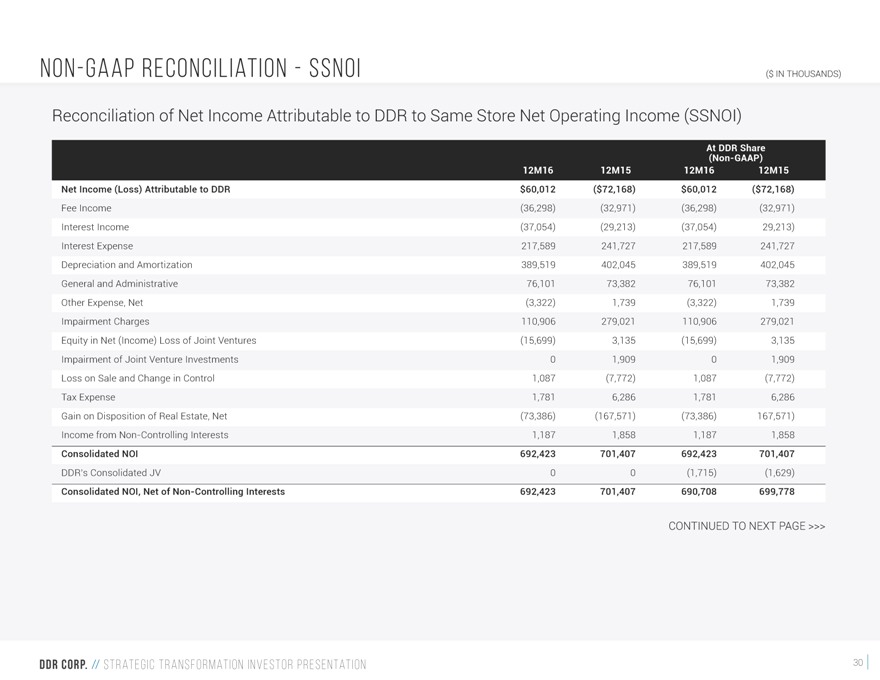
NON-GAAP
RECONCILIATION—SSNOI
($ IN THOUSANDS)
Reconciliation of Net Income
Attributable to DDR to Same Store Net Operating Income (SSNOI)
At (Non-GAAP) DDR Share 12M16 12M15
12M16 12M15
Net Income (Loss) Attributable to DDR $60,012 ($72,168) $60,012 ($72,168)
Fee Income (36,298) (32,971) (36,298) (32,971)
Interest Income (37,054) (29,213) (37,054)
29,213)
Interest Expense 217,589 241,727 217,589 241,727 Depreciation and Amortization 389,519 402,045 389,519 402,045 General and Administrative 76,101 73,382
76,101 73,382 Other Expense, Net (3,322) 1,739 (3,322) 1,739 Impairment Charges 110,906 279,021 110,906 279,021 Equity in Net (Income) Loss of Joint Ventures (15,699) 3,135 (15,699) 3,135
Impairment of Joint Venture Investments 0 1,909 0 1,909
Loss on Sale and Change in Control
1,087 (7,772) 1,087 (7,772) Tax Expense 1,781 6,286 1,781 6,286 Gain on Disposition of Real Estate, Net (73,386) (167,571) (73,386) 167,571) Income from Non-Controlling Interests 1,187 1,858 1,187 1,858
Consolidated NOI 692,423 701,407 692,423 701,407
DDR’s Consolidated JV 0
0 (1,715) (1,629)
Consolidated NOI, Net of Non-Controlling Interests 692,423 701,407 690,708 699,778
CONTINUED TO NEXT PAGE >>>
DDR CORP. // STRAT E G I C T R A N S F O R M AT I O N I N
V E S T O R P R E S E N TAT I O N
30
|
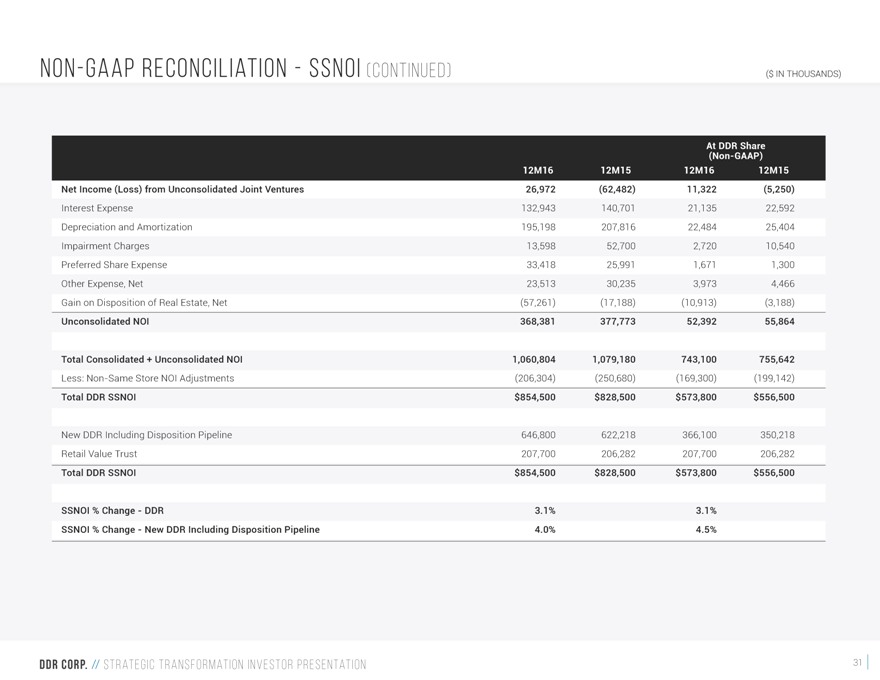
NON-GAAP
RECONCILIATION—SSNOI (CONTINUED)
($ IN THOUSANDS)
At (Non-GAAP) DDR Share 12M16 12M15 12M16 12M15
Net Income (Loss) from Unconsolidated Joint Ventures 26,972
(62,482) 11,322 (5,250)
Interest Expense 132,943 140,701 21,135 22,592
Depreciation and Amortization 195,198 207,816 22,484 25,404 Impairment Charges 13,598 52,700 2,720 10,540 Preferred Share Expense 33,418 25,991 1,671 1,300 Other
Expense, Net 23,513 30,235 3,973 4,466 Gain on Disposition of Real Estate, Net (57,261) (17,188) (10,913) (3,188)
Unconsolidated NOI 368,381 377,773 52,392 55,864
Total Consolidated + Unconsolidated NOI 1,060,804 1,079,180 743,100 755,642
Less: Non-Same Store NOI Adjustments (206,304) (250,680) (169,300) (199,142)
Total DDR SSNOI $854,500 $828,500 $573,800 $556,500
New DDR Including Disposition Pipeline
646,800 622,218 366,100 350,218 Retail Value Trust 207,700 206,282 207,700 206,282
Total DDR SSNOI $854,500 $828,500 $573,800 $556,500
SSNOI % Change—DDR 3.1% 3.1% SSNOI % Change—New DDR Including Disposition Pipeline 4.0% 4.5%
DDR CORP. // STRAT E G I C T R A N S F O R M AT I O N I N V E S T O R P R E S E N TAT I O N
31