Attached files
| file | filename |
|---|---|
| 8-K - 8-K - TE Connectivity Ltd. | a17-28270_18k.htm |

Forward-Looking Statements and Non-GAAP Measures Forward-Looking Statements This presentation contains certain “forward-looking statements” within the meaning of the U.S. Private Securities Litigation Reform Act of 1995. These statements are based on management’s current expectations and are subject to risks, uncertainty and changes in circumstances, which may cause actual results, performance, financial condition or achievements to differ materially from anticipated results, performance, financial condition or achievements. All statements contained herein that are not clearly historical in nature are forward-looking and the words “anticipate,” “believe,” “expect,” “estimate,” “plan,” and similar expressions are generally intended to identify forward-looking statements. We have no intention and are under no obligation to update or alter (and expressly disclaim any such intention or obligation to do so) our forward-looking statements whether as a result of new information, future events or otherwise, except to the extent required by law. The forward-looking statements in this presentation include statements addressing our future financial condition and operating results. Examples of factors that could cause actual results to differ materially from those described in the forward-looking statements include, among others, business, economic, competitive and regulatory risks, such as conditions affecting demand for products, particularly in the automotive and data and devices industries; competition and pricing pressure; fluctuations in foreign currency exchange rates and commodity prices; natural disasters and political, economic and military instability in countries in which we operate; developments in the credit markets; future goodwill impairment; compliance with current and future environmental and other laws and regulations; and the possible effects on us of changes in tax laws, tax treaties and other legislation. More detailed information about these and other factors is set forth in TE Connectivity Ltd.’s Annual Report on Form 10-K for the fiscal year ended Sept. 29, 2017 as well as in our Quarterly Reports on Form 10-Q, Current Reports on Form 8-K and other reports filed by us with the U.S. Securities and Exchange Commission. Non-GAAP Financial Measures Where we have used non-GAAP financial measures, reconciliations to the most comparable GAAP measure are provided, along with a disclosure on the usefulness of the non-GAAP measure, in this presentation.

THE OPPORTUNITY HAS NEVER BEEN GREATER We’ve built a portfolio with competitive advantage. The key elements to driving exciting shareholder value are in place. TERRENCE CURTIN, CEO

INVESTOR DAY AGENDA & KEY PRESENTER MESSAGES TRANSPORTATION Steve Merkt Global leadership position Content drives growth above vehicle production Auto sensors design wins propel future growth INDUSTRIAL Kevin Rock Levers to drive operating margins to high teens Content growth in Factory Automation & CommAir Leading position in fast-growing Medical market COMMUNICATIONS Shad Kroeger D&D transformation complete Growth driven by high speed connectivity Operational excellence results in mid-teens margins M&A Jeanne Quirk How TE thinks about M&A CFO Heath Mitts Strong business model to drive value creation OpEx discipline; targeting double-digit EPS growth Balanced capital strategy; ROIC focus Operating margin, EPS and ROIC refer to non-GAAP financial measures. See Appendix for descriptions.

SOLID FOUNDATION ESTABLISHED OVER THE PAST DECADE PORTFOLIO SHAPING ADJUSTED EBITDA MARGIN EXPANSION TOTAL SHAREHOLDER RETURN 50% revenue generated by harsh applications 360% versus 175% for the S&P 500 22% TO driven by gross margin expansion 80% TO 5 Adjusted EBITDA Margin is a non-GAAP financial measure; See Appendix for description and reconciliation. STOCK PERFORMANCE

THE COMPANY YOU KNOW, WITH A STRONGER FUTURE Serving large, attractive markets Providing value to customers Benefiting from the secular trend of content growth across segments Strong differentiation: Global presence, broad portfolio, engineered solutions Levers to expand margins, increased focus on ROIC, consistent capital return, strong Free Cash Flow Solid business model Focused on Harsh applications Portfolio positioned to deliver above-market growth

AN INDUSTRIAL TECHNOLOGY LEADER CONNECTING THE WORLD

OUR PURPOSE: TO CREATE A FUTURE THAT IS SAFER SUSTAINABLE PRODUCTIVE CONNECTED Interventional Medical Applications Electric Vehicles Smart Factories Data Centers WE HAVE THE ESSENTIAL TECHNOLOGY IN ENVIRONMENTS WHERE FAILURE IS NOT AN OPTION

WE BUILT A PORTFOLIO WITH CLEAR COMPETITIVE ADVANTAGES Businesses focused on Cash Businesses focused on Growth FY10 FY17 Portfolio focused on highly engineered custom products Capability to influence our customers’ roadmaps with integrated solutions Technology to address harsh environment applications Broad portfolio and expertise forges system-level engagements Global reach with local presence Manufacturing scale with leading technology

WHERE WE ARE WINNING FY17 SubCom Appliances Data and Devices Energy / Utilities Medical Industrial Equipment Aerospace, Defense and Marine Sensors Commercial Transportation Automotive END MARKET TRENDS EV adoption globally, driven by OEM & Government initiatives Safer, more autonomous vehicles Heavy truck content driven by regulatory requirements Smart, digital factories Lighter, more efficient aircraft Minimally invasive procedures driving cost and patient benefits Connected home Data everywhere Sensors proliferation We’re benefitting from content growth trends across our businesses

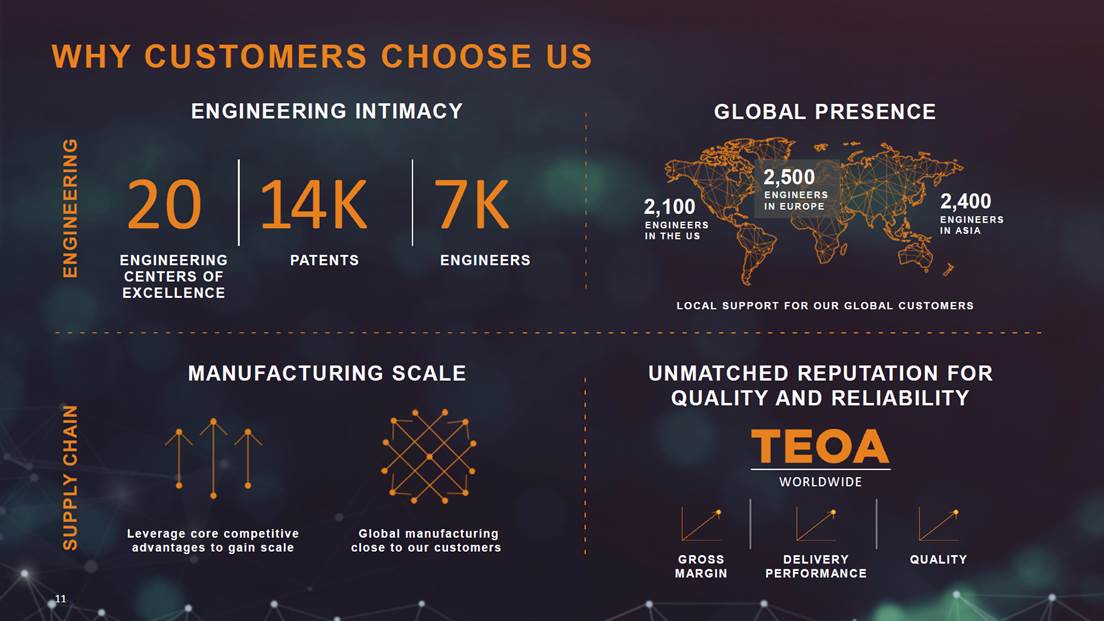
GLOBAL PRESENCE LOCAL SUPPORT FOR OUR GLOBAL CUSTOMERS 2,100 ENGINEERS IN THE US ENGINEERS IN ASIA 2,400 2,500 ENGINEERS IN EUROPE ENGINEERING ENGINEERING INTIMACY 20 1 4K 7K ENGINEERING CENTERS OF EXCELLENCE PATENTS ENGINEERS WHY CUSTOMERS CHOOSE US SUPPLY CHAIN MANUFACTURING SCALE Leverage core competitive advantages to gain scale Global manufacturing close to our customers UNMATCHED REPUTATION FOR QUALITY AND RELIABILITY WORLDWIDE GROSS MARGIN DELIVERY PERFORMANCE QUALITY 11
WE’RE ACCELERATING GROWTH AND PROFITABILITY

THE LEVERS OF OUR BUSINESS MODEL TOP LINE BOTTOM LINE ORGANIC REVENUE GROWTH EPS GROWTH +4-6% Pulling the levers for double-digit gains LOWER OPERATING EXPENSES Reduce SG&A by 100 basis points MARGIN EXPANSION M&A BALANCED CAPITAL STRATEGY Adding >100 basis points of growth annually Strategic M&A, Share Buybacks, Dividend increases, ROIC in mid-teens, strong FCF IMPROVED OPERATING MARGINS Expand 30-80 basis points annually Organic revenue growth, Operating margins, EPS, ROIC and FCF refer to non-GAAP financial measures. See Appendix for descriptions.

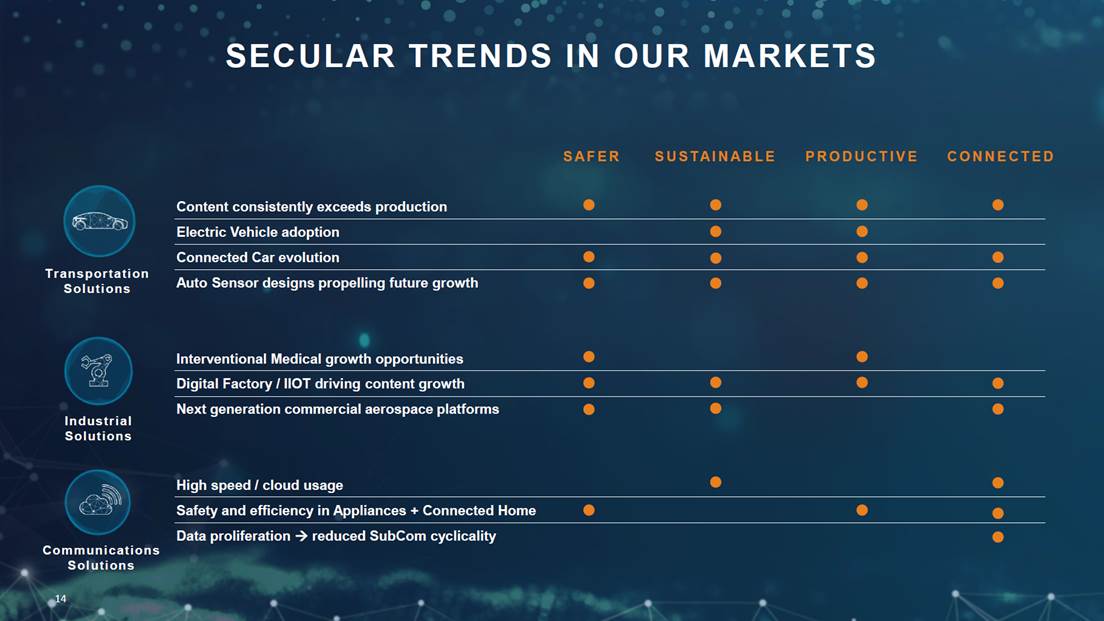
SECULAR TRENDS IN OUR MARKETS Transportation Solutions Industrial Solutions Communications Solutions SAFER SUSTAINABLE PRODUCTIVE CONNECTED Content consistently exceeds production Electric Vehicle adoption Connected Car evolution Auto Sensor designs propelling future growth Interventional Medical growth opportunities Digital Factory / IIOT driving content growth Next generation commercial aerospace platforms High speed / cloud usage Safety and efficiency in Appliances + Connected Home Data proliferation reduced SubCom cyclicality
THE LEVERS OF OUR BUSINESS MODEL TOP LINE BOTTOM LINE ORGANIC REVENUE GROWTH EPS GROWTH +4-6% Pulling the levers for double-digit gains LOWER OPERATING EXPENSES Reduce SG&A by 100 basis points MARGIN EXPANSION M&A BALANCED CAPITAL STRATEGY Adding >100 basis points of growth annually Strategic M&A, Share Buybacks, Dividend increases, ROIC in mid-teens, strong FCF IMPROVED OPERATING MARGINS Expand 30-80 basis points annually Organic revenue growth, Operating margins, EPS, ROIC and FCF refer to non-GAAP financial measures. See Appendix for descriptions.

WE’RE AN INDUSTRIAL TECHNOLOGY LEADER CONNECTING THE WORLD We’ve built a portfolio with competitive advantage. The key elements to driving exciting shareholder value are in place. Our opportunity has never been greater.

TRANSPORTATION SOLUTIONS STEVE MERKT, PRESIDENT

TRANSPORTATION SOLUTIONS 72.5M CONNECTED cars sold by 2023 95% of trucks with cleaner engine by 2025 (EU6) UP TO 50% of new cars sold with electrified powertrain by 2030 >$250 Available sensor content in average vehicle billion In sales in FY17 $7.0 Mid – High SINGLE DIGIT LONG TERM ORGANIC GROWTH RATE ~20% ADJUSTED OPERATING MARGIN billion Market $130 AUTOMOTIVE $5.2B KEY TRENDS CONNECTED DRIVING CONTENT GROWTH ELECTRIC VEHICLES SENSORS EVERYWHERE COMMERCIAL TRANSPORTATION $1B SENSORS $0.8B ASIA 45% EMEA 40% AMERICAS 15% HEAVY TRUCKS 50% AUTO 35% COMMERCIAL TRANSPORT 20% INDUSTRIAL 45% CONSTRUCTION 25% OTHER 10% AGRICULTURE 15% Organic Net Sales Growth and Adjusted Operating Margin are non-GAAP financial measures; See Appendix for descriptions.

OUR GLOBAL LEADERSHIP POSITION IN AUTOMOTIVE CONTENT PER VEHICLE (CPV) 45% ~$50 $22 TODAY 40% ~$75 ASIA EMEA AMERICAS % OF TE AUTO REVENUE GLOBAL 15% ~$55 ~$62 100% LONG TERM PRODUCTION GROWTH ~2% ~1% ~2% ~2% $1B business Partnering with ~50 OEMs CPV has doubled over past 5 years AUTOMOTIVE GROWTH DRIVEN BY ASIA AND EUROPE CHINA

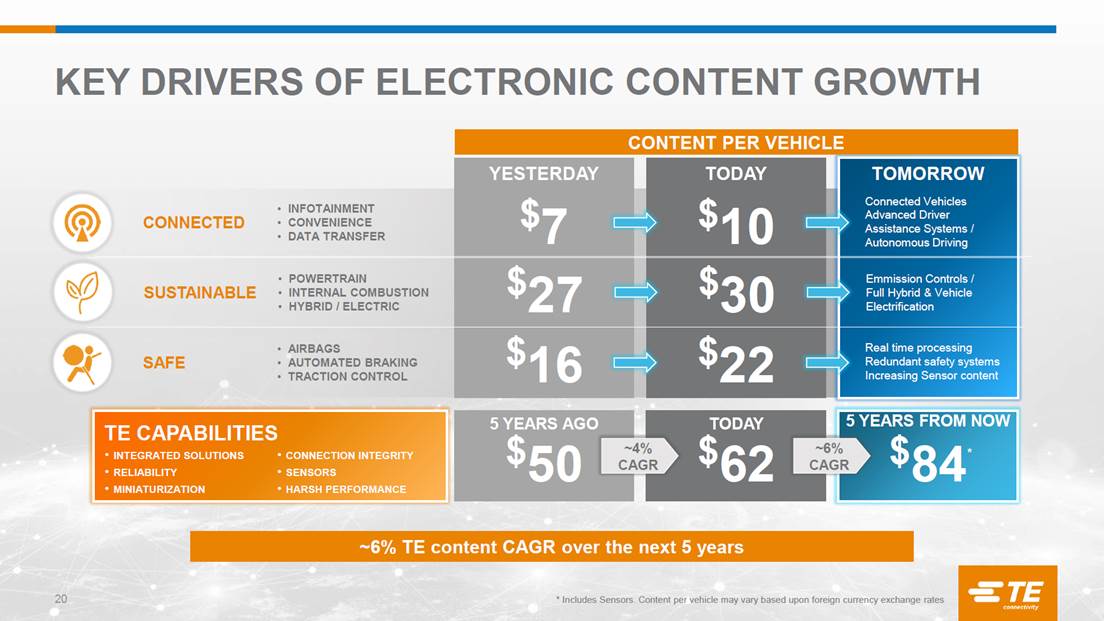
KEY DRIVERS OF ELECTRONIC CONTENT GROWTH ~6% TE content CAGR over the next 5 years * Includes Sensors. Content per vehicle may vary based upon foreign currency exchange rates $50 $27 $7 YESTERDAY 5 YEARS AGO INTEGRATED SOLUTIONS RELIABILITY MINIATURIZATION TE CAPABILITIES $84 5 YEARS FROM NOW CONNECTION INTEGRITY SENSORS HARSH PERFORMANCE Emmission Controls / Full Hybrid & Vehicle Electrification INFOTAINMENT CONVENIENCE DATA TRANSFER POWERTRAIN INTERNAL COMBUSTION HYBRID / ELECTRIC TOMORROW CONNECTED SUSTAINABLE CONTENT PER VEHICLE $62 $30 $10 TODAY TODAY * ~4% CAGR ~6% CAGR $16 Connected Vehicles Advanced Driver Assistance Systems / Autonomous Driving AIRBAGS AUTOMATED BRAKING TRACTION CONTROL SAFE $22 Real time processing Redundant safety systems Increasing Sensor content
LEVEL 0 LEVEL 1 LEVEL 2 LEVEL 3 LEVEL 4 LEVEL 5 NO AUTOMATION DRIVER ASSISTANCE PARTIAL AUTOMATION CONDITIONAL AUTOMATION HIGH AUTOMATION FULL AUTOMATION Driver controls it all Increased need for sensors and data connectivity 3 GB / second communications between driver assistance systems Ethernet connector transmit 1 GB / second for infotainment, on board diagnostics etc. Ethernet connectors transmit 10GB / second Transmits 20GB / second for camera, LIDAR, etc. High performance and high speed Completely autonomous driving TE ENABLES NEXT LEVEL DRIVING AUTOMATION CONNECTED TE IS UNIQUELY POSITIONED TO SERVE ALL LEVELS OF AUTOMATION TE CAPABILITY IS HERE CONSUMER ADOPTION IS HERE INCREASED SPEED RELIABILITY STEP UP INTEGRATION REQUIRED ADVANCED TECHNOLOGICAL CHALLENGES

TRENDS SUPPORTING ELECTRIC VEHICLE PRODUCTION GROWTH Consumer incentives Environmental concerns / emissions Phasing out diesel engines Quotas and combustion engine bans GOVERNMENT FACTORS OEM shifting roadmap to Hybrid / EV Increasing range Declining battery prices Greater charging infrastructure CONSUMER FACTORS ~35% CAGR for Hybrid / EV GLOBAL PRODUCTION OUTLOOK FY17 FY24 ASIA IS EXPECTED TO DRIVE ~50% OF HYBRID / EV GROWTH STANDARD COMBUSTION ELECTRIC VEHICLES SUSTAINABLE

CHINA WILL BE A MAJOR DRIVER FOR EV Consumer purchase incentives Local mandates to offer EVs Easy to acquire license plates Government wants to establish Chinese OEMs as global leader STRONG PUSH FROM GOVERNMENT Small share can represent high volumes Many cities with strong demand Emerging middle class MARKET SIZE AND POPULATION CHINA PRODUCTION OUTLOOK FY17 FY24 STANDARD COMBUSTION HYBRID / ELECTRIC VEHICLES ~ 40% of EV/Hybrid Global Production ~ 50% CAGR for Hybrid/EV SUSTAINABLE

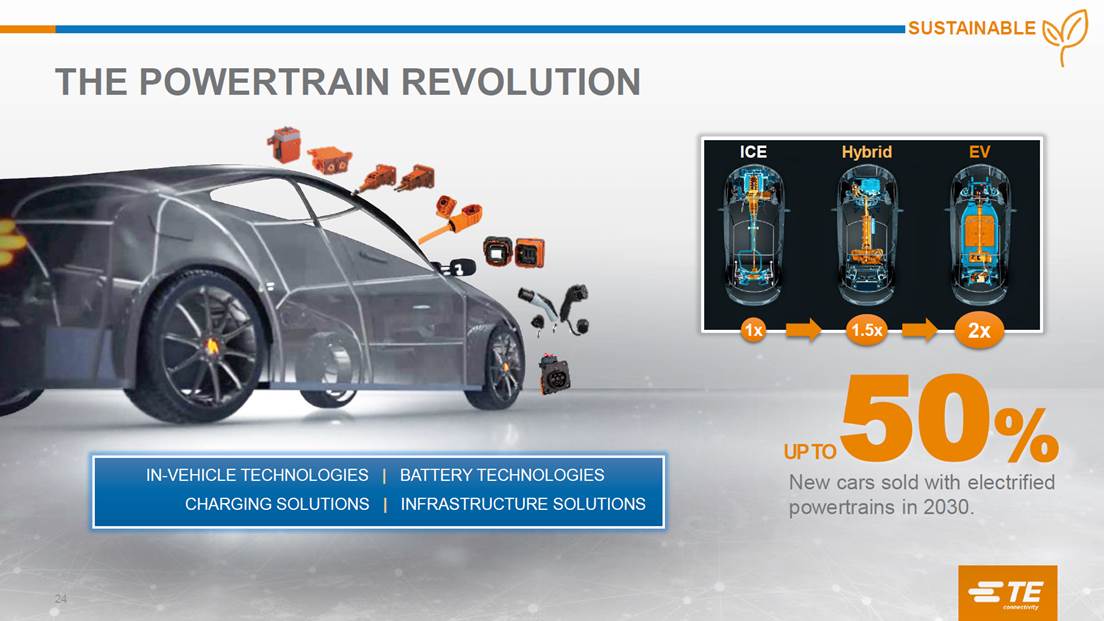
UP TO 50% New cars sold with electrified powertrains in 2030. 1x 1.5x 2x ICE Hybrid EV SUSTAINABLE THE POWERTRAIN REVOLUTION IN-VEHICLE TECHNOLOGIES BATTERY TECHNOLOGIES CHARGING SOLUTIONS INFRASTRUCTURE SOLUTIONS
TE IS WINNING GLOBALLY WITH EV OEMS Tesla Model 3 EXPANDING OUR TECHNICAL EXPERTISE NIO New Energy Vehicle EXPANDING OUR CONTENT & OUR CUSTOMER BASE CPV $500+ CPV $100+ CPV SUSTAINABLE $120 TE EV AVERAGE

CHARGING CABLES & INLETS TEMPERATURE SENSORS CONNECTORS CABLES CURRENT SENSORS E-MOTORS MULTI-COIL RESOLVER RESOLVER ROTARY POSITION SENSOR TEMPERATURE SENSOR CABLE ASSEMBLY CONNECTORS BATTERY PERFORMANCE BATTERY DISCONNECT UNIT HIGH VOLTAGE CONNECTORS RELAYS & CONTACTORS RESISTORS UNIQUELY POSITIONED TO DELIVER END TO END SOLUTIONS FOR ELECTRIC VEHICLES SUSTAINABLE

TE INTEGRATED SOLUTIONS FOR EV BATTERIES BATTERY DISCONNECT UNIT SERVICE DISCONNECT CONNECTION ASSEMBLY CONNECTOR CONTACTORS RESISTORS & SENSORS (THERMAL & CURRENT) INTEGRATED CELL CONNECTION SYSTEM SENSORS (THERMAL & CURRENT) CONNECTOR TRADITIONAL Connector Only Content $20 INTEGRATED Content $200 SUSTAINABLE

TE ENABLES VEHICLE SAFETY IMPACT SENSORS SENSES THE CRASH WEIGHT SENSORS MEASURES SEAT WEIGHT TO CLASSIFY AIRBAG DEPLOYMENT BATTERY DISCONNECT PREVENTS ELECTROCUTION & FIRES SMART ANTENNA TECHNOLOGY AUTONOMOUSLY CALLS EMERGENCY RESPONDERS CONNECTOR SYSTEMS/ARCHITECTURE TRIGGERS AIRBAGS AND ANIT-LOCK BRAKING SYSTEMS Connectors designed to support the transition to ADAS Transference of data from outside the vehicle into safety applications (braking, airbags, lane detection, etc) Need for real time computing, supporting high data volumes and signal integrity 94% of vehicle accidents are caused by human error. SAFE

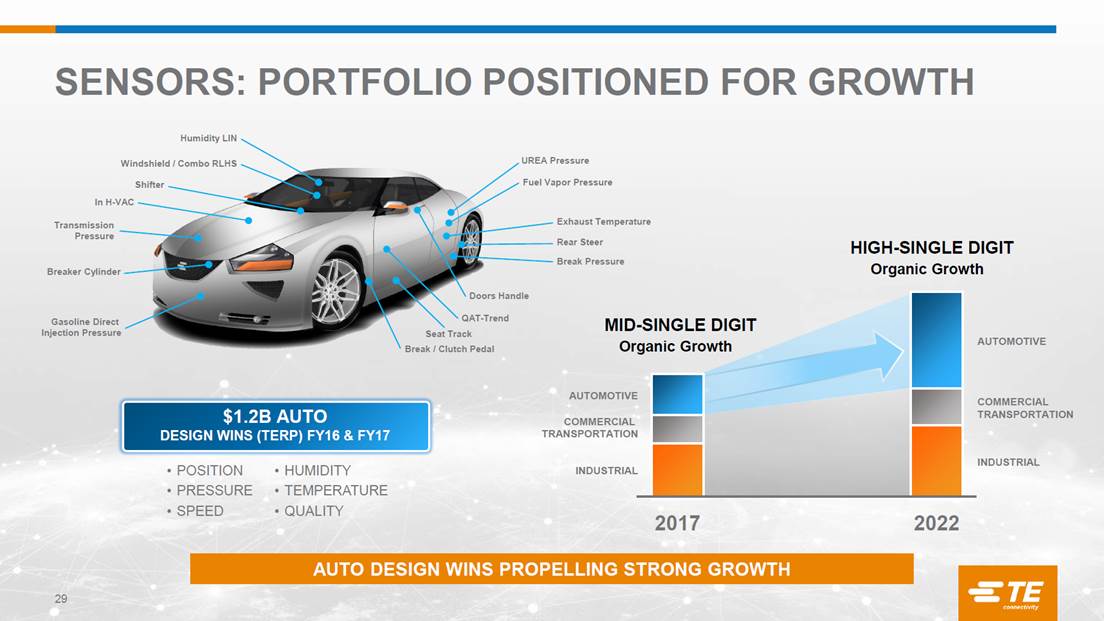
SENSORS: PORTFOLIO POSITIONED FOR GROWTH AUTO DESIGN WINS PROPELLING STRONG GROWTH INDUSTRIAL COMMERCIAL TRANSPORTATION AUTOMOTIVE INDUSTRIAL COMMERCIAL TRANSPORTATION AUTOMOTIVE $1.2B AUTO DESIGN WINS (TERP) FY16 & FY17 POSITION PRESSURE SPEED HUMIDITY TEMPERATURE QUALITY Organic Growth HIGH-SINGLE DIGIT Organic Growth MID-SINGLE DIGIT Humidity LIN Windshield / Combo RLHS In H-VAC Shifter Breaker Cylinder Break / Clutch Pedal Seat Track Doors Handle Rear Steer Exhaust Temperature QAT-Trend Transmission Pressure Break Pressure Fuel Vapor Pressure UREA Pressure Gasoline Direct Injection Pressure
TRANSPORTATION SOLUTIONS Market leader with global position and engineering expertise Consistently demonstrating above market growth Content growth driven by sustainable, connected and safe trends In a leadership position to capitalize on electric vehicle adoption Emissions standards driving electronification in Commercial Transportation Rich pipeline of design wins to drive growth in Sensors Adjusted Operating Margin of 20% with continuous investment for growth CONTENT GROWTH DRIVES CONSISTENT MARKET OUTPERFORMANCE Adjusted Operating Margin is a non-GAAP financial measure; See Appendix for description.
INDUSTRIAL SOLUTIONS KEVIN ROCK, PRESIDENT

INDUSTRIAL SOLUTIONS 5% growth in global AIR TRAVELERS 15% TAVR market growth (Aortic Valve Replacement) 16% Mid Single Digit LONG-TERM ORGANIC GROWTH RATE High Teens TARGET ADJUSTED OPERATING MARGIN billion In sales in FY17 $3.5 billion Market $38 KEY TRENDS DIGITAL CONNECTED FACTORIES AGING DEMOGRAPHICS INTERVENTIONAL MEDICAL SAFE AND RELIABLE URBANIZATION ENERGY EFFICIENCY AEROSPACE, DEFENSE & MARINE INDUSTRIAL EQUIPMENT ENERGY (UTILITIES) Oil and Gas FACTORY connected device market CAGR 12% ROBOT market CAGR CONTENT GROWTH OPPORTUNITY Organic Net Sales Growth and Adjusted Operating Margin are non-GAAP financial measures; See Appendix for descriptions.

TOP LINE DRIVERS DRIVING OPERATING MARGINS TO THE HIGH TEENS Footprint consolidation Productivity enhancement with TEOA SG&A expense reduction Market growth accelerating in Industrial end markets Content driving growth above markets in Medical, Commercial Air and Factory Automation OPERATIONAL DRIVERS HIGH TEENS OPERATING MARGIN 2/3 1/3 Operating Margin refers to a non-GAAP financial measure; See Appendix for description

FACTORY AUTOMATION GROWTH SERVO DRIVE PLC ROBOTICS FOCUSED APPLICATION MARKET CAGR FY17-22 TOP 4 APPLICATIONS CAPEX investment rate > GDP China and developing market automation On-shoring in Americas Falling cost of computing & bandwidth Digital convergence & open standards Miniaturization More Automated Factories Digitization in Factories 12% 6% 6% 5% 7+% FACTORY AUTOMATION MARKET 3% FOCUSING ON HIGH GROWTH APPLICATIONS TO OUTGROW THE MARKET Automation drives productivity Machine retrofit Robotics & Sensors Customization Efficiency and safety Quality MARKET TRENDS CUSTOMER DEMANDS Source: IHS; TE; VDMA; ZVEI; IRF; M&M SERVO MOTOR

CONTENT GROWTH IN EXISTING FACTORIES ~25%+ Increase in Available Content Ethernet Communication Electronic Drive System Integrated Safety System Information Management System Embedded Sensors Robotics Hydraulic Electronic Connectivity and remote access Robotics Safety enhancements Retrofit / upgrades MORE ELECTRONIC CONTENT IN MACHINES (example) SHIFT TO ELECTRONIC SYSTEMS DRIVES 3% CAGR IN CONTENT ABOVE MARKET CONTENT INCREASE DRIVEN BY:

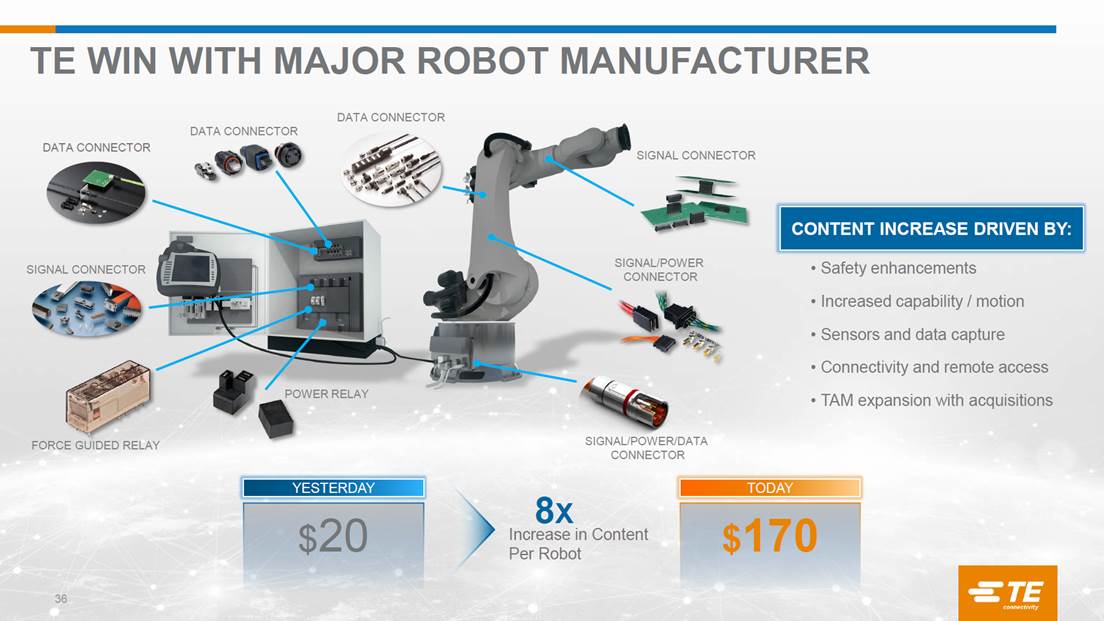
TE WIN WITH MAJOR ROBOT MANUFACTURER Safety enhancements Increased capability / motion Sensors and data capture Connectivity and remote access TAM expansion with acquisitions CONTENT INCREASE DRIVEN BY: $20 $170 YESTERDAY TODAY 8X Increase in Content Per Robot DATA CONNECTOR DATA CONNECTOR DATA CONNECTOR SIGNAL CONNECTOR SIGNAL/POWER CONNECTOR SIGNAL/POWER/DATA CONNECTOR POWER RELAY FORCE GUIDED RELAY SIGNAL CONNECTOR
MEDICAL OVERVIEW Portfolio mix shifting towards the more attractive Interventional and Surgical segments Ablation TRENDS DRIVING INTERVENTIONAL GROWTH 2017 2022 2012 Aging population Reducing hospital stay Shorter patient recovery Cost effective treatments PATIENT CABLES SURGICAL INTERVENTIONAL 7% Market CAGR

OUR MEDICAL STRATEGY Partner of choice to customers in designing & building medical devices that save lives Build on our leadership position in Interventional and Surgical applications Organic growth in the high single digits, higher than medical market average Expand portfolio with M&A opportunities Grow profitability with scale and strategic footprint Endoscopic procedures Wound closure Minimally invasive surgeries Diagnostic & imaging procedures Stroke Treatment Vascular repair (Stent/Angioplasty) Heart Valve repair/replacement Heart arrhythmia treatment Aneurism treatment DESIGN AND BUILD INTERVENTIONAL DELIVERY SYSTEMS & SURGICAL DEVICES Organic Net Sales growth is a non-GAAP financial measure; See Appendix for description.

CONTENT DRIVES COMMERCIAL AEROSPACE GROWTH $420k PER 2022 Widebody $110k Per 2022 narrowbody >15% INCREASE IN AVERAGE Content / Aircraft by 2022 NARROWBODY WIDEBODY A320 NEO B737 MAX C-Series C919 2017 16% 2022 17% 2017 2022 A330 NEO A350 B777X B787 TE Avg. Content per Aircraft Produced (‘000s) $95 k $110 k $360 k $420 k

INDUSTRIAL SOLUTIONS Content growth trends across businesses Key player in the smart factory evolution Leading position in high growth medical markets Strong growth in content as aircrafts advance Positioned for growth and margin expansion ADJUSTED OPERATING MARGIN EXPANSION OPPORTUNITY TO HIGH TEENS Adjusted Operating Margin is a non-GAAP financial measure; See Appendix for description.

COMMUNICATIONS SOLUTIONS SHAD KROEGER, PRESIDENT

COMMUNICATIONS SOLUTIONS SEGMENT 27% datacenter traffic growth reaching 15ZB in 2020 150M 5G global subscribers by 2021 100+ Cable systems to circle the earth 15x 25B Connected devices by 2020 KEY TRENDS HIGH-SPEED SOLUTIONS IOT AND CONNECTED LIFE GROWTH IN ASIA EMERGING APPLICATIONS Low Single Digit LONG-TERM ORGANIC GROWTH RATE Mid Teens ADJUSTED OPERATING MARGIN billion In sales in FY17 $2.6 billion Market $12 SUBCOM DATA AND DEVICES APPLIANCES Organic Net Sales Growth and Adjusted Operating Margin are non-GAAP financial measures; See Appendix for descriptions.

COMMUNICATIONS SOLUTIONS TRANSFORMATION GROW CONTENT REPOSITION PORTFOLIO WIN IN ASIA-PACIFIC WIN WITH HYPERSCALE RATIONALIZE FOOTPRINT STRATEGIC PRIORITIES HYPERSCALE SPENDING US Telco Capex Hyperscale Players REPOSITIONED TO GROWTH MARKETS MIX SHIFT TO ASIA 2011 2017 53% 47% 41% 59% ASIA US/EMEA

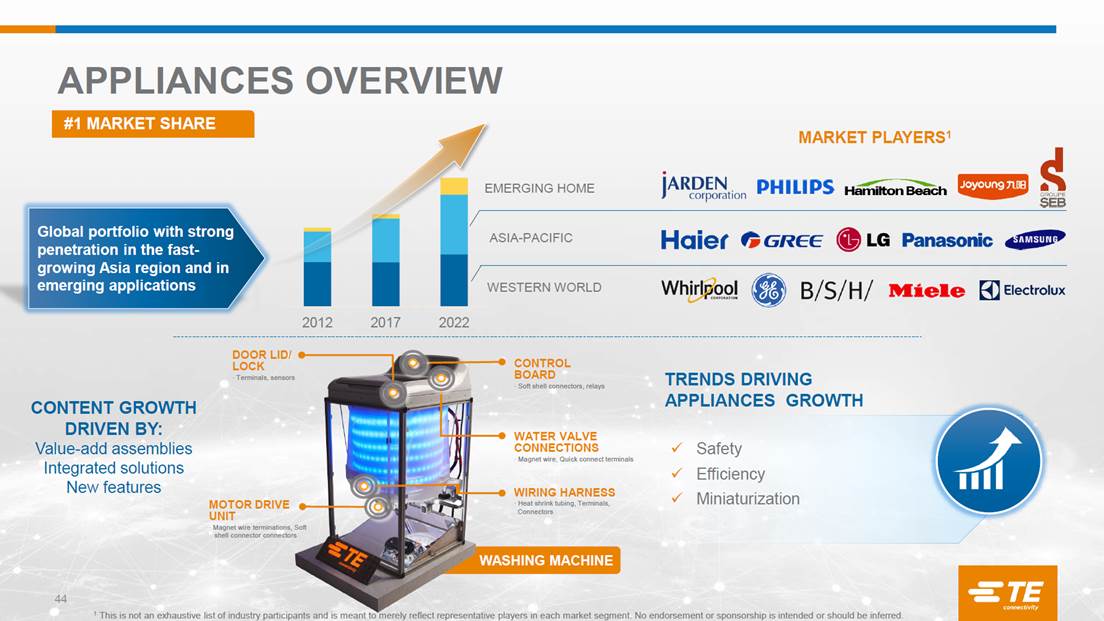
APPLIANCES OVERVIEW Global portfolio with strong penetration in the fast-growing Asia region and in emerging applications TRENDS DRIVING APPLIANCES GROWTH Safety Efficiency Miniaturization WESTERN WORLD ASIA-PACIFIC EMERGING HOME CONTENT GROWTH DRIVEN BY: Value-add assemblies Integrated solutions New features #1 MARKET SHARE MARKET PLAYERS1 CONTROL BOARD · Soft shell connectors, relays WIRING HARNESS · Heat shrink tubing, Terminals, Connectors WATER VALVE CONNECTIONS · Magnet wire, Quick connect terminals MOTOR DRIVE UNIT · Magnet wire terminations, Soft shell connector connectors DOOR LID/ LOCK · Terminals, sensors WASHING MACHINE 1 This is not an exhaustive list of industry participants and is meant to merely reflect representative players in each market segment. No endorsement or sponsorship is intended or should be inferred. 2012 2017 2022
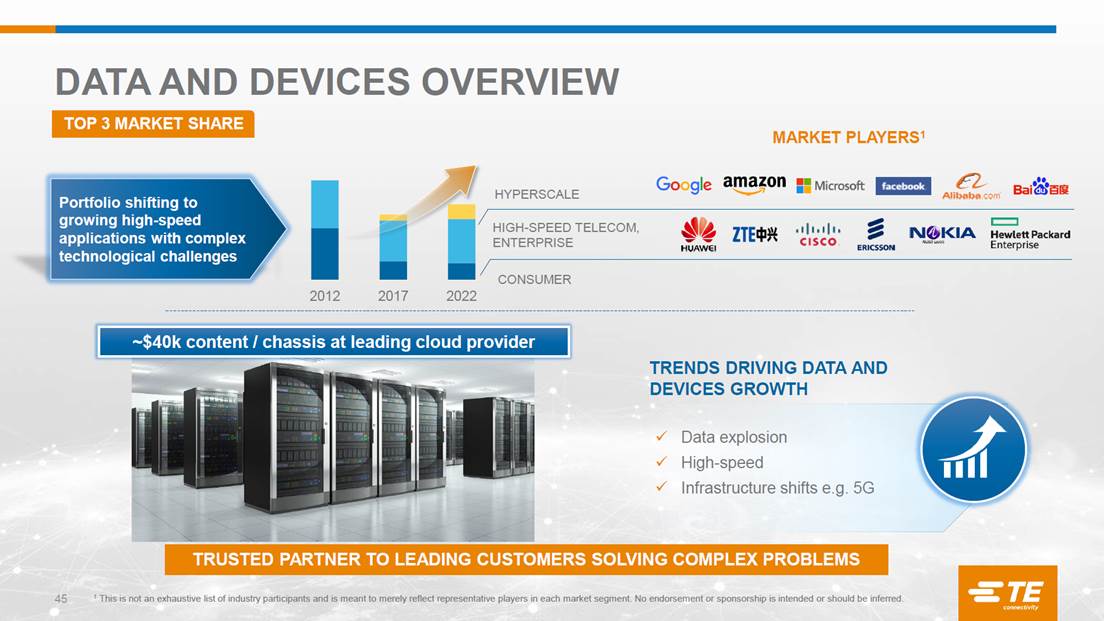
DATA AND DEVICES OVERVIEW Portfolio shifting to growing high-speed applications with complex technological challenges TRENDS DRIVING DATA AND DEVICES GROWTH Data explosion High-speed Infrastructure shifts e.g. 5G HIGH-SPEED TELECOM, ENTERPRISE CONSUMER HYPERSCALE TRUSTED PARTNER TO LEADING CUSTOMERS SOLVING COMPLEX PROBLEMS TOP 3 MARKET SHARE MARKET PLAYERS1 ~$40k content / chassis at leading cloud provider 1 This is not an exhaustive list of industry participants and is meant to merely reflect representative players in each market segment. No endorsement or sponsorship is intended or should be inferred. 2012 2017 2022
SUBCOM MARKET DRIVEN BY HYPERSCALES *Commercial fiber optic cable systems that achieve CIF HYPERSCALE TELCOS 2008 Current Cycle HYPERSCALES REPLACING TRADITIONAL TELCOS REDUCED CYCLICALITY With revenues ranging from $600M to $1B Need for SPEED and BANDWIDTH Require OPTIONALITY on technology Demand for FASTER deployment Stability Market Size $B NEW CABLE SYSTEMS* TAM CONTINUED FOCUS ON HYPERSCALE PROVIDERS DRIVING REDUCED CYCLICALITY TOP 2 MARKET SHARE 0.0 0.5 1.0 1.5 2.0 2.5 3.0 3.5

COMMUNICATIONS SOLUTIONS Winning in the markets we serve Well positioned in Asia Strong relationships with customers and partners Extensive portfolio and technology leadership Transformation and operational excellence key contributors to margin expansion Reduced cyclicality in the SubCom market POSITIONED IN MARKETS FOR GROWTH

MERGERS & ACQUISITIONS JEANNE QUIRK, SVP

M&A MARKET ENVIRONMENT Note: 2017 year-to-date data through September. Source: Wall Street investment banks, S&P Capital IQ, Federal Reserve Economic Data. INTEREST RATES AND LEVERAGE GLOBAL M&A MULTIPLES UTILIZE A ROBUST PROCESS INTERNALLY TO CREATE VALUE IN A COMPETITIVE ENVIRONMENT 0.0% 2.0% 4.0% 6.0% 8.0% 10.0% 12.0% 0.0x 1.0x 2.0x 3.0x 4.0x 5.0x 6.0x 2009 2010 2011 2012 2013 2014 2015 2016 2017 YTD Total Debt / EBITDA (S&P 500 annual median) Corp BBB Index (% Yield, daily) 6.0x 8.0x 10.0x 12.0x 14.0x 2009 2010 2011 2012 2013 2014 2015 2016 2017 YTD TEV / EBITDA (median)

STRONG DEAL ECO-SYSTEM PROVIDES FOR ROBUST PIPELINE PIPELINE comprised of significant number of targets BUSINESS UNIT RELATIONSHIPS CUSTOMER INFLUENCE INDUSTRY CONSORTIUMS PRIVATE EQUITY & VC RELATIONSHIPS INVESTMENT BANKS (LARGE & SMALL)

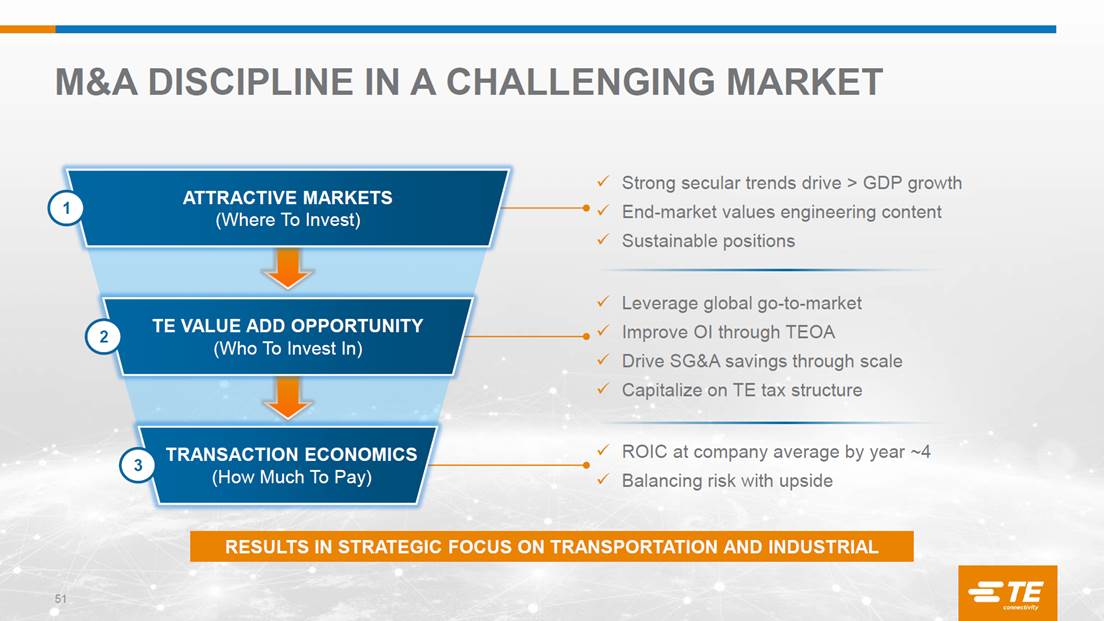
M&A DISCIPLINE IN A CHALLENGING MARKET RESULTS IN STRATEGIC FOCUS ON TRANSPORTATION AND INDUSTRIAL Strong secular trends drive > GDP growth End-market values engineering content Sustainable positions Leverage global go-to-market Improve OI through TEOA Drive SG&A savings through scale Capitalize on TE tax structure ROIC at company average by year ~4 Balancing risk with upside 1 2 3 ATTRACTIVE MARKETS (Where To Invest) TE VALUE ADD OPPORTUNITY (Who To Invest In) TRANSACTION ECONOMICS (How Much To Pay)
PLATFORMS CREATE OPPORTUNITY FOR BOLT ONS 16x 11x CAPITAL DEPLOYED $2.6B $3.5B EBITDA Multiple EBITDA Multiple Sensors and Medical MARKET FOCUS: Bolt On Platform

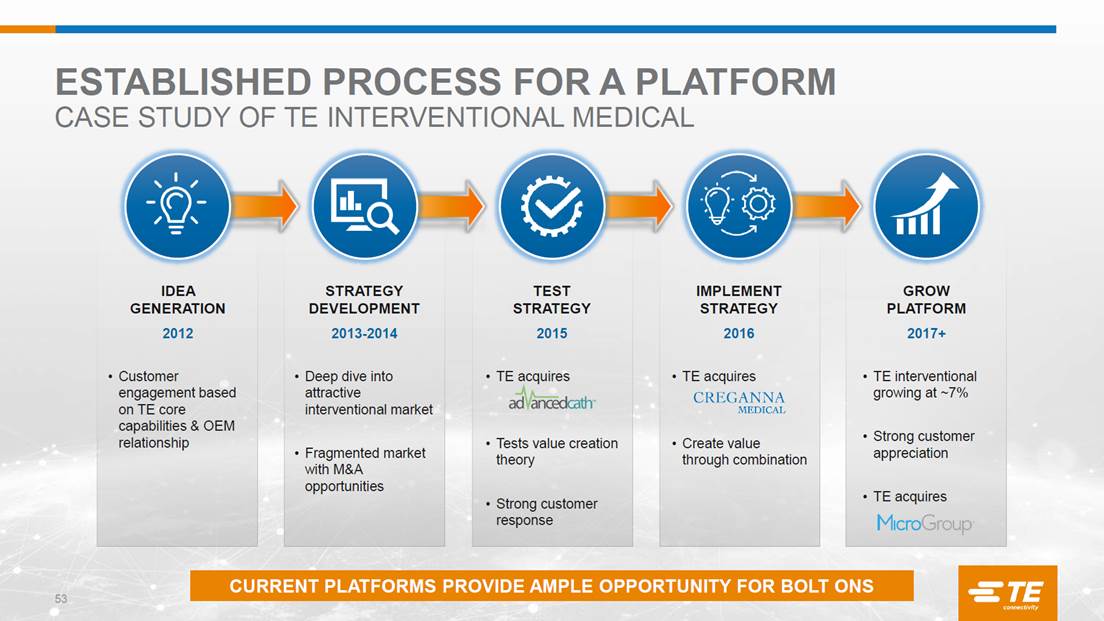
ESTABLISHED PROCESS FOR A PLATFORM CASE STUDY OF TE INTERVENTIONAL MEDICAL IDEA GENERATION STRATEGY DEVELOPMENT TEST STRATEGY IMPLEMENT STRATEGY GROW PLATFORM 2012 2013-2014 2015 2016 2017+ Customer engagement based on TE core capabilities & OEM relationship TE acquires Tests value creation theory Strong customer response Deep dive into attractive interventional market Fragmented market with M&A opportunities TE acquires Create value through combination TE interventional growing at ~7% Strong customer appreciation TE acquires CURRENT PLATFORMS PROVIDE AMPLE OPPORTUNITY FOR BOLT ONS
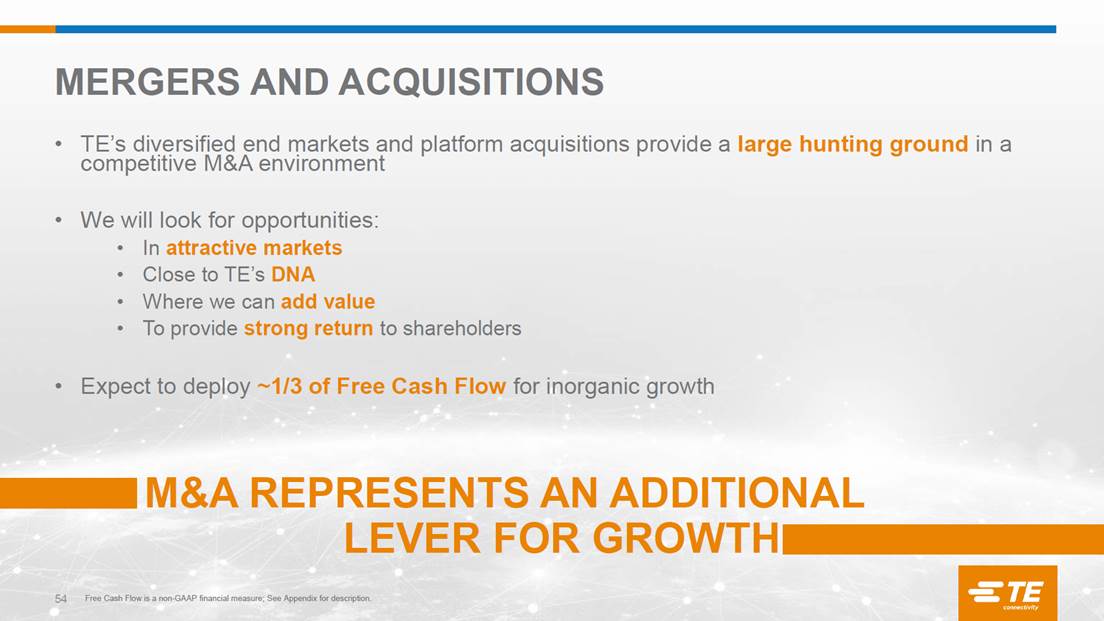
MERGERS AND ACQUISITIONS TE’s diversified end markets and platform acquisitions provide a large hunting ground in a competitive M&A environment We will look for opportunities: In attractive markets Close to TE’s DNA Where we can add value To provide strong return to shareholders Expect to deploy ~1/3 of Free Cash Flow for inorganic growth M&A REPRESENTS AN ADDITIONAL LEVER FOR GROWTH Free Cash Flow is a non-GAAP financial measure; See Appendix for description.
55 VALUE CREATION HEATH MITTS, CFO

WHAT GETS THE CFO EXCITED GROWTH ACROSS PORTFOLIO Organic growth accelerating To Mid Single Digits MARGIN EXPANSION Growth and cost opportunity ROIC Focus on balance between growth and returns CAPITAL DEPLOYMENT Strong cash generation provides flexibility Organic Net Sales Growth is a non-GAAP financial measure; See Appendix for description.

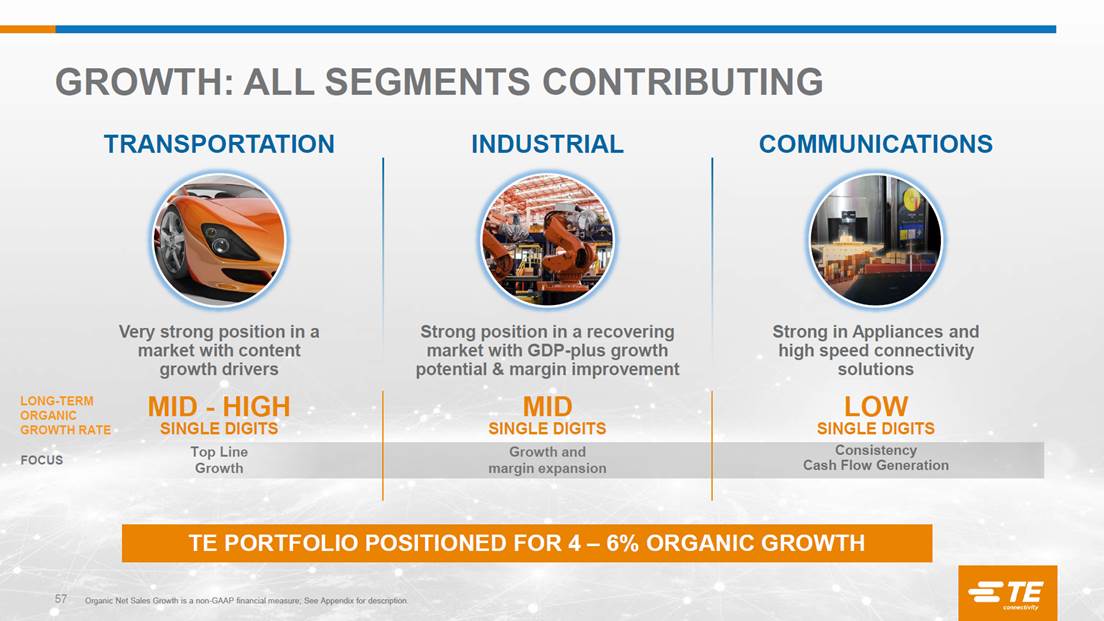
MID - HIGH SINGLE DIGITS GROWTH: ALL SEGMENTS CONTRIBUTING FOCUS Top Line Growth Growth and margin expansion Consistency Cash Flow Generation TE PORTFOLIO POSITIONED FOR 4 – 6% ORGANIC GROWTH TRANSPORTATION INDUSTRIAL COMMUNICATIONS Very strong position in a market with content growth drivers Strong position in a recovering market with GDP-plus growth potential & margin improvement Strong in Appliances and high speed connectivity solutions LONG-TERM ORGANIC GROWTH RATE MID SINGLE DIGITS LOW SINGLE DIGITS Organic Net Sales Growth is a non-GAAP financial measure; See Appendix for description.
MARGIN EXPANSION: EFFICIENT EXPENSE MODEL BUSINESS MODEL TARGETED AT REDUCING OPEX TO 16% OF REVENUE WHAT WE ARE DOING Teams formed to address SG&A opportunities Outsourced IT TEOA – leaning our enterprise (Supply chain and overhead) Maintaining R&D at 5% to support growth initiatives Absorbing cost structure for acquired businesses 16% OPEX % of Sales PERCENT Opex consists of selling, general, and administrative expenses and research, development, and engineering expenses. 15 16 17 18 FY13 FY14 FY15 FY16 FY17 TARGET

MARGIN AND EPS EXPANSION WHAT WE’VE DONE Focused the portfolio on growth Exited low margin products Driven TEOA across manufacturing Balanced capital allocation GOING FORWARD: Adjusted Operating Margin Expansion 30-80 bps Mid single digit organic growth Transportation Margins 20% +/- while investing for growth above market Industrial expanding to high teens through revenue growth, footprint consolidation and expense reduction Communications maintains mid teens depending upon product mix ADJUSTED OPERATING MARGIN ADJUSTED EARNINGS PER SHARE 15% CAGR EXPECT DOUBLE DIGIT ADJUSTED EPS GROWTH Adjusted Operating Margin, Adjusted EPS, and Organic Net Sales Growth are non-GAAP financial measures; See Appendix for descriptions and reconciliations. 14.2% 16.3% 16.8% FY13 FY15 FY17 $2.79 $3.60 $4.83 FY13 FY15 FY17

ROIC Progression Deployment of Capital ROIC: TARGETING MID TEENS ADJUSTED ROIC Focused investment supporting organic growth Mergers and Acquisitions Value creation Enabling long term growth opportunities ORGANIC: Growing profit > asset base LEVERS TO PULL M&A: Right acquisition at the right price GOAL OPTIMIZE DYNAMIC TENSION ADJUSTED ROIC Adjusted ROIC is a non-GAAP financial measure; See Appendix for description and reconciliation. 13% 14% 15% FY13 FY15 FY17

CAPITAL STRATEGY: BALANCED DEPLOYMENT DIVIDENDS PER SHARE Share Repurchases $6.8B Acquisitions* $7.4B Dividends $3.9B MAJOR CAPITAL DEPLOYMENT** FY08 through FY17 Denotes dividends paid during the fiscal year. BNS Proceeds $2B FY18 dividends are subject to shareholder approval. Free Cash Flow is a non-GAAP financial measure; See Appendix for description EXPECT TO RETURN ~2/3 OF FREE CASH FLOW TO SHAREHOLDERS OVER TIME EXPECT TO UTILIZE ~1/3 OF FREE CASH FLOW AS AN ADDITIONAL LEVER FOR REVENUE GROWTH ~2/3 ~1/3 * Includes $1.3 billion used to acquire ADC Telecommunications in 2010, which is part of our divested BNS business. ** Select uses of cash. Represents capital returned to shareholders and acquisition activity. $0.64 $0.68 $0.78 $0.92 $1.08 $1.24 $1.40 $1.54 $1.68 FY10 FY11 FY12 FY13 FY14 FY15 FY16 FY17 FY18

TE BUSINESS MODEL Content enables growth > market Growth from Sensors and Medical platforms M&A in Transportation and Industrial SG&A leverage; Maintaining R&D at 5% of sales Driven by operational excellence and Industrial Solutions Flexibility with strong FCF Balancing deployment of capital Consistent growth, operational levers and capital deployment * Assumes 2% GDP growth ADJUSTED OPERATING MARGIN OPERATING EXPENSE REVENUE ADJUSTED EPS FREE CASH FLOW ADJUSTED ROIC 30 – 80 bps expansion ~16% OF SALES 4-6% ORGANIC GROWTH* + M&A DOUBLE DIGIT GROWTH ~ NET INCOME MID TEENS Organic Net Sales Growth, Adjusted Operating Margin, Adjusted EPS, Free Cash Flow and Adjusted ROIC are non-GAAP financial measures; See Appendix for descriptions.

TE IS AN INDUSTRIAL TECHNOLOGY LEADER CONNECTING THE WORLD We’ve built a portfolio with competitive advantage. The key elements to driving exciting shareholder value are in place. Our opportunity has never been greater.

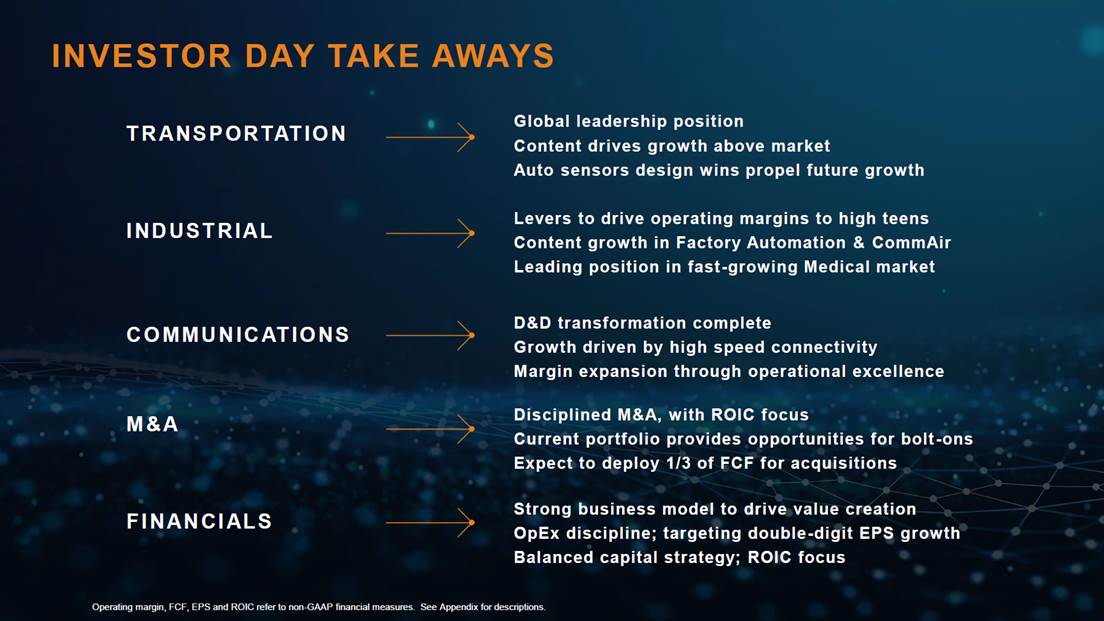
INVESTOR DAY TAKE AWAYS TRANSPORTATION Global leadership position Content drives growth above market Auto sensors design wins propel future growth INDUSTRIAL Levers to drive operating margins to high teens Content growth in Factory Automation & CommAir Leading position in fast-growing Medical market COMMUNICATIONS D&D transformation complete Growth driven by high speed connectivity Margin expansion through operational excellence M&A Disciplined M&A, with ROIC focus Current portfolio provides opportunities for bolt-ons Expect to deploy 1/3 of FCF for acquisitions FINANCIALS Strong business model to drive value creation OpEx discipline; targeting double-digit EPS growth Balanced capital strategy; ROIC focus Operating margin, FCF, EPS and ROIC refer to non-GAAP financial measures. See Appendix for descriptions.
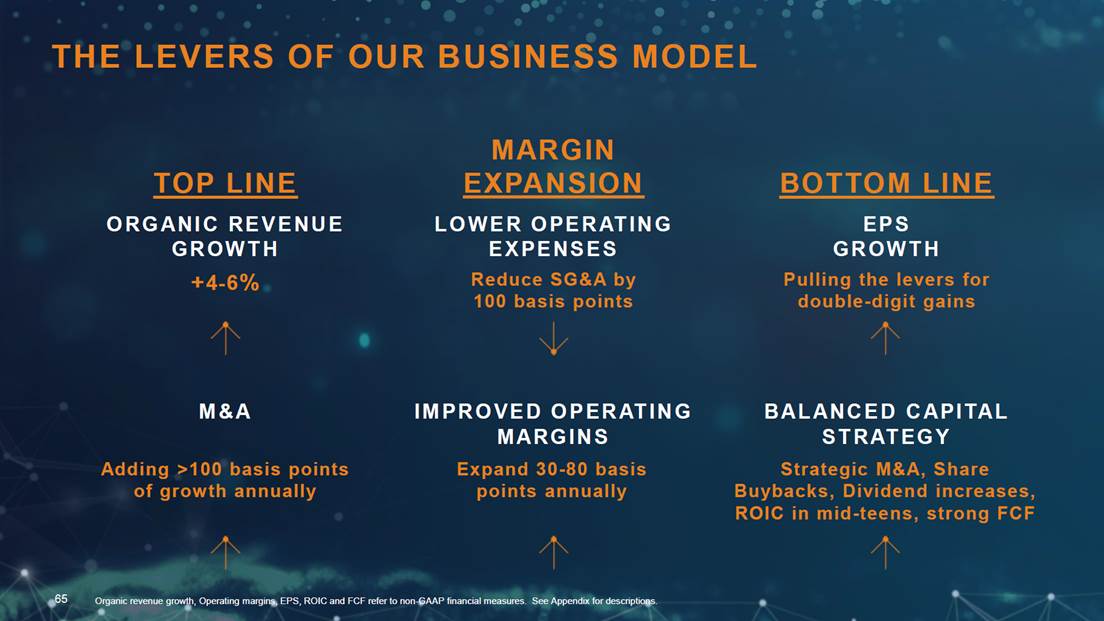
THE LEVERS OF OUR BUSINESS MODEL TOP LINE BOTTOM LINE ORGANIC REVENUE GROWTH EPS GROWTH +4-6% Pulling the levers for double-digit gains LOWER OPERATING EXPENSES Reduce SG&A by 100 basis points MARGIN EXPANSION M&A BALANCED CAPITAL STRATEGY Adding >100 basis points of growth annually Strategic M&A, Share Buybacks, Dividend increases, ROIC in mid-teens, strong FCF IMPROVED OPERATING MARGINS Expand 30-80 basis points annually Organic revenue growth, Operating margins, EPS, ROIC and FCF refer to non-GAAP financial measures. See Appendix for descriptions.
THE OPPORTUNITY HAS NEVER BEEN GREATER The key elements to driving exciting shareholder value are in place.

67 APPENDIX

68 Non-GAAP Financial Measures We present non-GAAP performance and liquidity measures as we believe it is appropriate for investors to consider adjusted financial measures in addition to results in accordance with accounting principles generally accepted in the U.S. (“GAAP”). These non-GAAP financial measures provide supplemental information and should not be considered replacements for results in accordance with GAAP. Management uses non-GAAP financial measures internally for planning and forecasting purposes and in its decision-making processes related to the operations of our company. We believe these measures provide meaningful information to us and investors because they enhance the understanding of our operating performance, ability to generate cash, and the trends of our business. Additionally, we believe that investors benefit from having access to the same financial measures that management uses in evaluating our operations. The primary limitation of these measures is that they exclude the financial impact of items that would otherwise either increase or decrease our reported results. This limitation is best addressed by using these non-GAAP financial measures in combination with the most directly comparable GAAP financial measures in order to better understand the amounts, character, and impact of any increase or decrease in reported amounts. These non-GAAP financial measures may not be comparable to similarly-titled measures reported by other companies. The following provides additional information regarding our non-GAAP financial measures: Organic Net Sales Growth – represents net sales growth (the most comparable GAAP financial measure) excluding the impact of foreign currency exchange rates, and acquisitions and divestitures that occurred in the preceding twelve months, if any. Organic Net Sales Growth is a useful measure of our performance because it excludes items that are not completely under management’s control, such as the impact of changes in foreign currency exchange rates, and items that do not reflect the underlying growth of the company, such as acquisition and divestiture activity. This measure is a significant component in our incentive compensation plans. Adjusted Operating Income and Adjusted Operating Margin – represent operating income and operating margin, respectively, (the most comparable GAAP financial measures) before special items including restructuring and other charges, acquisition related charges, and other income or charges, if any. We utilize these measures to assess segment level operating performance and to provide insight to management in evaluating segment operating plan execution and market conditions. Adjusted Operating Income is a significant component in our incentive compensation plans. Adjusted Other Income, Net – represents net other income (the most comparable GAAP financial measure) before special items including tax sharing income related to adjustments to prior period tax returns and other items, if any. Adjusted Income Tax Expense – represents income tax expense (the most comparable GAAP financial measure) after adjusting for the tax effect of special items including restructuring and other charges, acquisition related charges, other income or charges, and certain significant tax items, if any. Adjusted Income from Continuing Operations – represents income from continuing operations (the most comparable GAAP financial measure) before special items including restructuring and other charges, acquisition related charges, tax sharing income related to adjustments to prior period tax returns and other tax items, other income or charges, and certain significant tax items, if any, and, if applicable, the related tax effects. Adjusted Earnings Per Share – represents diluted earnings per share from continuing operations (the most comparable GAAP financial measure) before special items including restructuring and other charges, acquisition related charges, tax sharing income related to adjustments to prior period tax returns and other tax items, other income or charges, and certain significant tax items, if any, and, if applicable, the related tax effects. This measure is a significant component in our incentive compensation plans.

69 Adjusted EBITDA and Adjusted EBITDA Margin - represent net income and net income as a percentage of net sales, respectively, (the most comparable GAAP financial measures) before interest expense, interest income, income taxes, depreciation, and amortization, as adjusted for net other income, income from discontinued operations, and special items including restructuring and other charges, acquisition related charges, and other income or charges, if any. Free Cash Flow (FCF) – is a useful measure of our ability to generate cash. The difference between net cash provided by continuing operating activities (the most comparable GAAP financial measure) and Free Cash Flow consists mainly of significant cash outflows and inflows that we believe are useful to identify. We believe Free Cash Flow provides useful information to investors as it provides insight into the primary cash flow metric used by management to monitor and evaluate cash flows generated from our operations. Free Cash Flow is defined as net cash provided by continuing operating activities excluding voluntary pension contributions and the cash impact of special items, if any, minus net capital expenditures. Voluntary pension contributions are excluded from the GAAP financial measure because this activity is driven by economic financing decisions rather than operating activity. Certain special items, including net payments related to pre-separation tax matters and cash paid (collected) pursuant to collateral requirements related to cross currency swaps, are also excluded by management in evaluating Free Cash Flow. Net capital expenditures consist of capital expenditures less proceeds from the sale of property, plant, and equipment. These items are subtracted because they represent long-term commitments. In the calculation of Free Cash Flow, we subtract certain cash items that are ultimately within management’s and the Board of Directors’ discretion to direct and may imply that there is less or more cash available for our programs than the most comparable GAAP financial measure indicates. It should not be inferred that the entire Free Cash Flow amount is available for future discretionary expenditures, as our definition of Free Cash Flow does not consider certain non-discretionary expenditures, such as debt payments. In addition, we may have other discretionary expenditures, such as discretionary dividends, share repurchases, and business acquisitions, that are not considered in the calculation of Free Cash Flow. Adjusted Return on Invested Capital (ROIC) – represents adjusted net operating profit after tax divided by average invested capital. We use Adjusted Return on Invested Capital as an indicator of our capital efficiency. Adjusted Return on Invested Capital is not a measure defined by GAAP. It is calculated by us, in part, using non-GAAP financial measures. We are providing our calculation of Adjusted Return on Invested Capital as this measure may not be defined and calculated by other companies in the same manner. Non-GAAP Financial Measures (cont.)
70 Reconciliation of Non-GAAP Financial Measures to GAAP Financial Measures for the Year Ended September 29, 2017 Acquisition Restructuring Related and Other Tax Adjusted U.S. GAAP Charges (1) Charges, Net (1) Items (2) (Non-GAAP) (3) Operating Income: Transportation Solutions 1,299 $ 3 $ 67 $ - $ 1,369 $ Industrial Solutions 364 8 73 - 445 Communications Solutions 384 - 8 - 392 Total 2,047 $ 11 $ 148 $ - $ 2,206 $ Operating Margin 15.6% 16.8% Other Expense, Net (9) $ - $ - $ 7 $ (2) $ Income Tax Expense (255) $ (3) $ (40) $ (66) $ (364) $ Income from Continuing Operations 1,673 $ 8 $ 108 $ (59) $ 1,730 $ Diluted Earnings per Share from Continuing Operations 4.67 $ 0.02 $ 0.30 $ (0.16) $ 4.83 $ (2) Includes income tax benefits associated with the tax impacts of certain intercompany transactions and the corresponding reduction in the valuation allowance for U.S. tax loss carryforwards. Also includes income tax benefits associated with pre-separation tax matters and the related impact to other expense pursuant to the tax sharing agreement with Tyco International and Covidien. (3) See description of non-GAAP financial measures. Adjustments ($ in millions, except per share data) (1) The tax effect of each non-GAAP adjustment is calculated based on the jurisdictions in which the expense (income) is incurred and the tax laws in effect for each such jurisdiction.

71 Reconciliation of Non-GAAP Financial Measures to GAAP Financial Measures for the Year Ended September 25, 2015 Acquisition Restructuring Related and Other Tax Adjusted U.S. GAAP Charges (1)(2) Charges, Net (2) Items (3) (Non-GAAP) (4) Operating Income: Transportation Solutions 1,193 $ 61 $ 39 $ - $ 1,293 $ Industrial Solutions 352 33 44 - 429 Communications Solutions 204 - 66 - 270 Total 1,749 $ 94 $ 149 $ - $ 1,992 $ Operating Margin 14.3% 16.3% Other Income (Expense), Net (55) $ - $ - $ 84 $ 29 $ Income Tax Expense (337) $ (22) $ (29) $ (36) $ (424) $ Income from Continuing Operations 1,238 $ 72 $ 120 $ 48 $ 1,478 $ Diluted Earnings per Share from Continuing Operations 3.01 $ 0.18 $ 0.29 $ 0.12 $ 3.60 $ (3) Includes $264 million of income tax benefits associated with the settlement of audits of prior year income tax returns as well as the related impact of $84 million to other expense pursuant to the tax sharing agreement with Tyco International and Covidien. Also includes $216 million of income tax charges associated with the tax impacts of certain intercompany legal entity restructurings made in connection with our integration of Measurement Specialties, Inc. and $29 million of income tax charges for the tax impacts of certain intercompany dividends related to the restructuring and sale of the Broadband Network Solutions business. (4) See description of non-GAAP financial measures. ($ in millions, except per share data) (1) Includes $55 million of acquisition and integration costs, $36 million of non-cash amortization associated with fair value adjustments related to acquired inventories and customer order backlog recorded in cost of sales, and $3 million of restructuring costs. (2) The tax effect of each non-GAAP adjustment is calculated based on the jurisdictions in which the expense (income) is incurred and the tax laws in effect for each such jurisdiction. Adjustments

72 Reconciliation of Non-GAAP Financial Measures to GAAP Financial Measures for the Year Ended September 27, 2013 Acquisition Restructuring Related and Other Tax Adjusted U.S. GAAP Charges (1) Charges, Net (1) Items (2) (Non-GAAP) (3) Operating Income: Transportation Solutions 934 $ 7 $ 39 $ - $ 980 $ Industrial Solutions 344 7 63 - 414 Communications Solutions 107 - 120 - 227 Total 1,385 $ 14 $ 222 $ - $ 1,621 $ Operating Margin 12.2% 14.2% Other Income (Expense), Net (183) $ - $ - $ 213 $ 30 $ Income Tax (Expense) Benefit 75 $ (5) $ (62) $ (354) $ (346) $ Income from Continuing Operations Attributable to TE Connectivity Ltd. 1,154 $ 9 $ 160 $ (141) $ 1,182 $ Diluted Earnings per Share from Continuing Operations Attributable to TE Connectivity Ltd. 2.73 $ 0.02 $ 0.38 $ (0.33) $ 2.79 $ (3) See description of non-GAAP financial measures. Adjustments ($ in millions, except per share data) (1) The tax effect of each non-GAAP adjustment is calculated based on the jurisdictions in which the expense (income) is incurred and the tax laws in effect for each such jurisdiction. (2) Includes $331 million of income tax benefits associated with the settlement of an audit of prior year income tax returns as well as the related impact of $231 million to other expense pursuant to the tax sharing agreement with Tyco International and Covidien. Also includes income tax expense related to adjustments to prior year income tax returns, income tax benefits recognized in connection with a reduction in the valuation allowance associated with certain tax loss carryforwards, and income tax benefits recognized in connection with the lapse of statutes of limitations for examinations of prior year income tax returns. In addition, the other income adjustment includes amounts related to reimbursements by Tyco International and Covidien in connection with pre-separation tax matters.

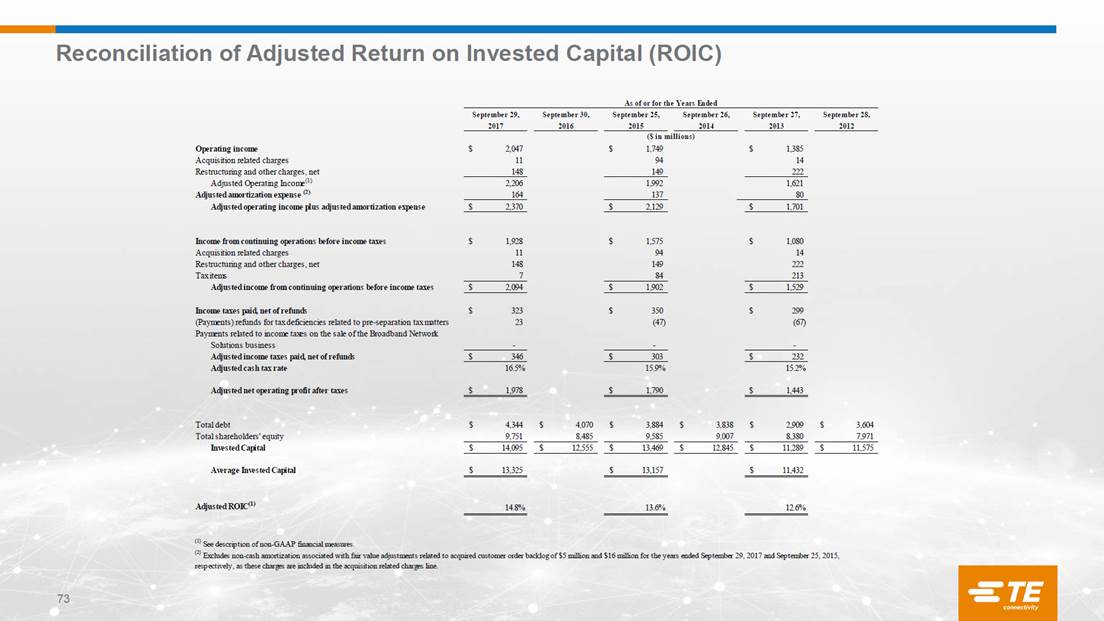
73 Reconciliation of Adjusted Return on Invested Capital (ROIC) September 29, September 30, September 25, September 26, September 27, September 28, 2017 2016 2015 2014 2013 2012 Operating income 2,047 $ 1,749 $ 1,385 $ Acquisition related charges 11 94 14 Restructuring and other charges, net 148 149 222 Adjusted Operating Income (1) 2,206 1,992 1,621 Adjusted amortization expense (2) 164 137 80 Adjusted operating income plus adjusted amortization expense 2,370 $ 2,129 $ 1,701 $ Income from continuing operations before income taxes 1,928 $ 1,575 $ 1,080 $ Acquisition related charges 11 94 14 Restructuring and other charges, net 148 149 222 Tax items 7 84 213 Adjusted income from continuing operations before income taxes 2,094 $ 1,902 $ 1,529 $ Income taxes paid, net of refunds 323 $ 350 $ 299 $ (Payments) refunds for tax deficiencies related to pre-separation tax matters 23 (47) (67) Payments related to income taxes on the sale of the Broadband Network Solutions business - - - Adjusted income taxes paid, net of refunds 346 $ 303 $ 232 $ Adjusted cash tax rate 16.5% 15.9% 15.2% Adjusted net operating profit after taxes 1,978 $ 1,790 $ 1,443 $ Total debt 4,344 $ 4,070 $ 3,884 $ 3,838 $ 2,909 $ 3,604 $ Total shareholders' equity 9,751 8,485 9,585 9,007 8,380 7,971 Invested Capital 14,095 $ 12,555 $ 13,469 $ 12,845 $ 11,289 $ 11,575 $ Average Invested Capital 13,325 $ 13,157 $ 11,432 $ Adjusted ROIC (1) 14.8% 13.6% 12.6% As of or for the Years Ended ($ in millions) (1) See description of non-GAAP financial measures. (2) Excludes non-cash amortization associated with fair value adjustments related to acquired customer order backlog of $5 million and $16 million for the years ended September 29, 2017 and September 25, 2015, respectively, as these charges are included in the acquisition related charges line.
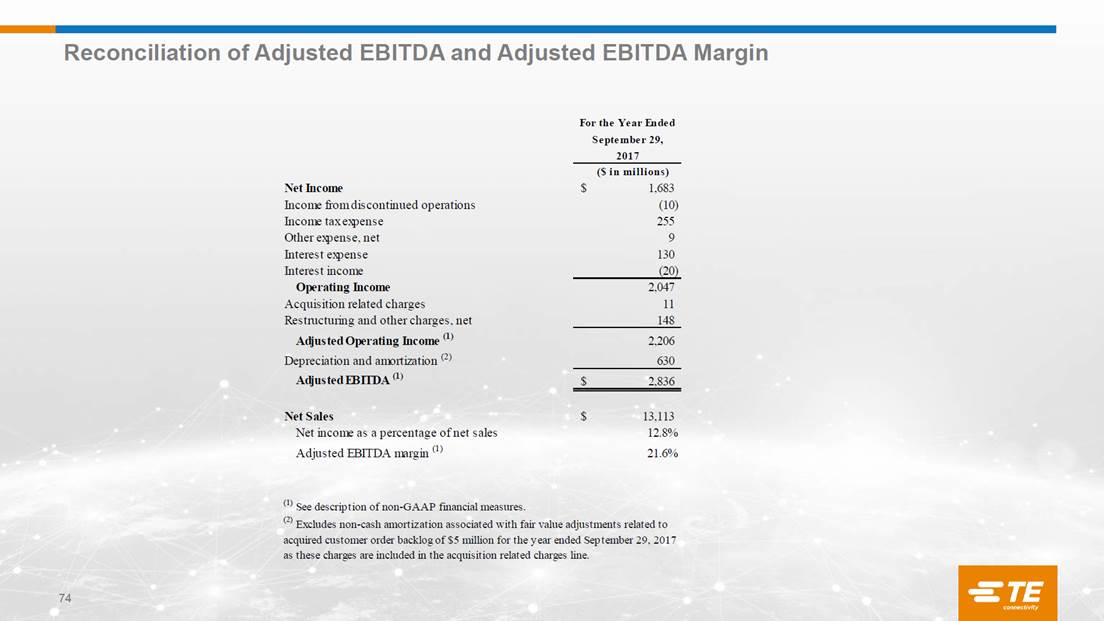
74 Reconciliation of Adjusted EBITDA and Adjusted EBITDA Margin For the Year Ended September 29, 2017 Net Income 1,683 $ Income from discontinued operations (10) Income tax expense 255 Other expense, net 9 Interest expense 130 Interest income (20) Operating Income 2,047 Acquisition related charges 11 Restructuring and other charges, net 148 Adjusted Operating Income (1) 2,206 Depreciation and amortization (2) 630 Adjusted EBITDA (1) 2,836 $ Net Sales 13,113 $ Net income as a percentage of net sales 12.8% Adjusted EBITDA margin (1) 21.6% (1) See description of non-GAAP financial measures. ($ in millions) (2) Excludes non-cash amortization associated with fair value adjustments related to acquired customer order backlog of $5 million for the year ended September 29, 2017 as these charges are included in the acquisition related charges line.