Attached files
| file | filename |
|---|---|
| 8-K - 8-K - ILG, LLC | a17-28364_18k.htm |
Safe Harbor This presentation may contain “forward–looking statements” within the meaning of the Private Securities Litigation Reform Act of 1995. These forward–looking statements include statements relating to the anticipated financial performance, business prospects, new developments, and similar matters of/relating to ILG, Inc., and/or statements that use words such as “anticipates,” “estimates,” “expects,” “intends,” “plans,” “believes,” and similar expressions. These forward-looking statements are based on management’s current expectations and assumptions, which are inherently subject to uncertainties, risks, and changes in circumstances that are difficult to predict. Actual results could differ materially from those contained in the forward-looking statements included herein for a variety of reasons, including, among others: (1) adverse trends in economic conditions generally or in the vacation ownership, vacation rental and travel industries, or adverse events or trends in key vacation destinations, (2) lack of available financing for, or insolvency or consolidation of developers, including availability of receivables financing for our business, (3) adverse changes to, or interruptions in, relationships with third parties, (4) our ability to compete effectively and successfully and to add new products and services, (5) our ability to market VOIs successfully and efficiently, (6) our ability to source sufficient inventory to support VOI sales and risks related to development of inventory in accordance with applicable brand standards, (7) the occurrence of a termination event under the master license agreement with Starwood or Hyatt, (8) actions of Starwood, Hyatt or any successor that affect the reputation of the licensed marks, the offerings of or access to these brands and programs, (9) decreased demand from prospective purchasers of vacation interests, (10) travel-related health concerns, (11) significant increase in defaults on our vacation ownership mortgage receivables, (12) the restrictive covenants in our revolving credit facility and indenture and our ability to refinance our debt on acceptable terms, (13) our ability to successfully manage and integrate acquisitions, including Vistana Signature Experiences, (14) impairment of ILG’s assets or other adverse changes to estimates and assumptions underlying our financial results, (15) our ability to expand successfully in international markets and manage risks specific to international operations, (16) fluctuations in currency exchange rates, (17) the ability of managed homeowners’ associations to collect sufficient maintenance fees, (18) business interruptions in connection with technology systems, (19) regulatory changes, and (20) timing and collection of insurance proceeds. Discussions of additional risks and uncertainties are contained in ILG’s filings with the U.S. Securities Exchange Commission. ILG is not under any obligation, and expressly disclaims any obligation, to update, alter, or otherwise revise any forward-looking statements, whether written or oral, that may be made from time to time, whether as a result of new information, future events, or otherwise. Persons reading this presentation are cautioned not to place undue reliance on these forward-looking statements which speak only as of the date hereof. The “Hyatt Vacation Ownership” business or “HVO” refers to the group of businesses using the Hyatt® brand in the shared ownership business pursuant to an exclusive, global master license agreement with a subsidiary of Hyatt Hotels Corporation (“Hyatt”). The Vistana™ Signature Experiences business or “Vistana” uses the Westin® and Sheraton® brands (and to a limited extent the St. Regis® and The Luxury Collection® brands) in vacation ownership pursuant to an exclusive global license agreement with Starwood Hotels & Resorts Worldwide, LLC (“Starwood”). All brand trademarks, service marks or trade names, including without limitation World of Hyatt, World of Hyatt Points, SPG, Starpoints, and ILG’s brands cited in this report, are the property of their respective holders. 2
Company Overview

Business Overview 4 Key Statistics¹ Business Description ILG, Inc. (“ILG”) is a leisure company focused on the timeshare industry Provides a variety of services through two business segments: Vacation Ownership (VO): Develops, markets, manages, operates, and finances vacation ownership properties 43 owned branded resorts with 6,639 units and over 250k owner families Exclusive global licensee for the Hyatt, Sheraton and Westin brands in VO Exchange and Rental: Operates a series of exchange networks that allow timeshare owners to trade usage of their home properties for stays at alternate properties or other leisure experiences. In addition, operates Aqua-Aston Hospitality, a rental management company and leader in the Hawaiian market The exchange network for Interval International consists of 1.8mm members with ~3,000 resorts in over 80 countries History: Spun off from IAC in 2008 Acquisition History: Trading Places International (2010), Vacation Resorts International (2012), VRI Europe JV (2013), Aqua Hospitality (2013), Hyatt VO business (2014), Vistana, VO business of Starwood (2016) Market Cap $3.7bn Enterprise Value $4.0bn 2017E Revenue (Ex. Cost Reimbursements) $1.4 – 1.5bn 2017E Adj. EBITDA $340 – 350mm 2017E Adj. EBITDA Margin (Ex. Cost Reimbursements) 18 - 21 % Net Debt / 2017E Adj. EBITDA2 0.9 x As of September 30, 2017, unless otherwise noted ¹ Information based on 2017E guidance as of November 7, 2017, except for market cap and enterprise value as of December 8, 2017 2 Based on mid-point of 2017E Adj. EBITDA guidance. ³ Information for the twelve months ended September 30, 2017. 4 Revenue excludes cost reimbursements. Operating Segments³ Breakdown by LTM Revenue 4 ?Vacation Ownership 64% ?Exchange & Rental 36% Breakdown by LTM Adj. EBITDA ?Vacation Ownership 48% ?Exchange & Rental 52%

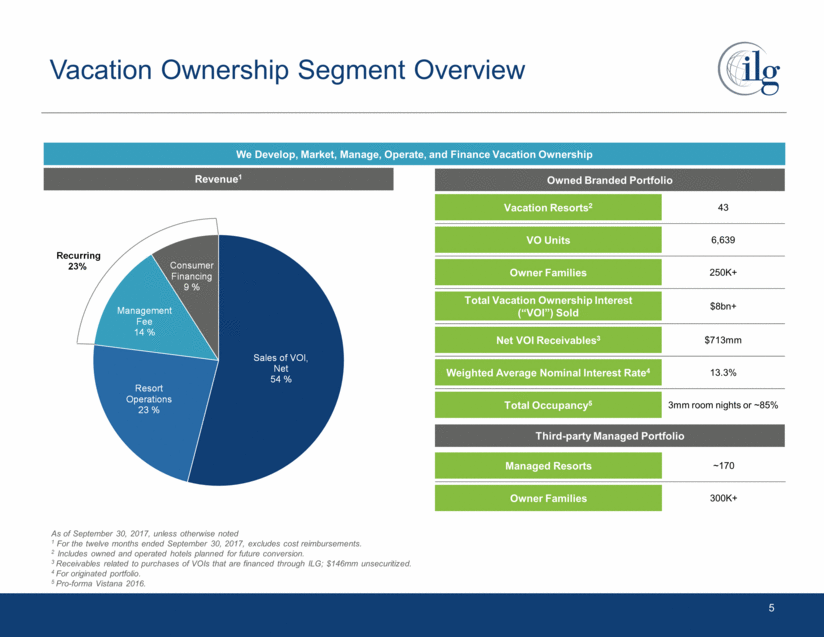
Vacation Ownership Segment Overview 5 Owned Branded Portfolio We Develop, Market, Manage, Operate, and Finance Vacation Ownership Revenue1 Vacation Resorts2 43 VO Units 6,639 Owner Families 250K+ Total Vacation Ownership Interest (“VOI”) Sold $8bn+ Net VOI Receivables3 $713mm Weighted Average Nominal Interest Rate4 13.3% Total Occupancy5 3mm room nights or ~85% Third-party Managed Portfolio Managed Resorts ~170 Owner Families 300K+ As of September 30, 2017, unless otherwise noted 1 For the twelve months ended September 30, 2017, excludes cost reimbursements. 2 Includes owned and operated hotels planned for future conversion. 3 Receivables related to purchases of VOIs that are financed through ILG; $146mm unsecuritized. 4 For originated portfolio. 5 Pro-forma Vistana 2016. Sales of VOI, Net 54 % Resort Operations 23 % Management Fee 14 % Consumer Financing 9 % Recurring 23%
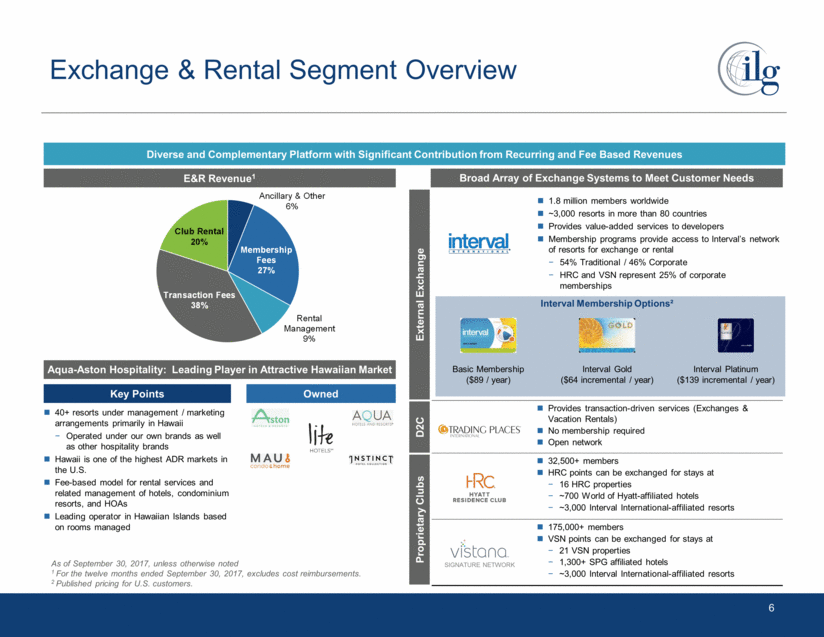
Provides transaction-driven services (Exchanges & Vacation Rentals) No membership required Open network 32,500+ members HRC points can be exchanged for stays at 16 HRC properties ~700 World of Hyatt-affiliated hotels ~3,000 Interval International-affiliated resorts 175,000+ members VSN points can be exchanged for stays at 21 VSN properties 1,300+ SPG affiliated hotels ~3,000 Interval International-affiliated resorts Exchange & Rental Segment Overview 6 1.8 million members worldwide ~3,000 resorts in more than 80 countries Provides value-added services to developers Membership programs provide access to Interval’s network of resorts for exchange or rental 54% Traditional / 46% Corporate HRC and VSN represent 25% of corporate memberships E&R Revenue1 Interval Membership Options² Basic Membership ($89 / year) Interval Gold ($64 incremental / year) Interval Platinum ($139 incremental / year) Broad Array of Exchange Systems to Meet Customer Needs As of September 30, 2017, unless otherwise noted 1 For the twelve months ended September 30, 2017, excludes cost reimbursements. 2 Published pricing for U.S. customers. SIGNATURE NETWORK External Exchange D2C Proprietary Clubs Diverse and Complementary Platform with Significant Contribution from Recurring and Fee Based Revenues Aqua-Aston Hospitality: Leading Player in Attractive Hawaiian Market Key Points 40+ resorts under management / marketing arrangements primarily in Hawaii Operated under our own brands as well as other hospitality brands Hawaii is one of the highest ADR markets in the U.S. Fee-based model for rental services and related management of hotels, condominium resorts, and HOAs Leading operator in Hawaiian Islands based on rooms managed Owned ?Ancillary & Other 6% ?Membership Fees 27% ?Rental Management 9% ?Transaction Fees 38% ?Club Rental 20%
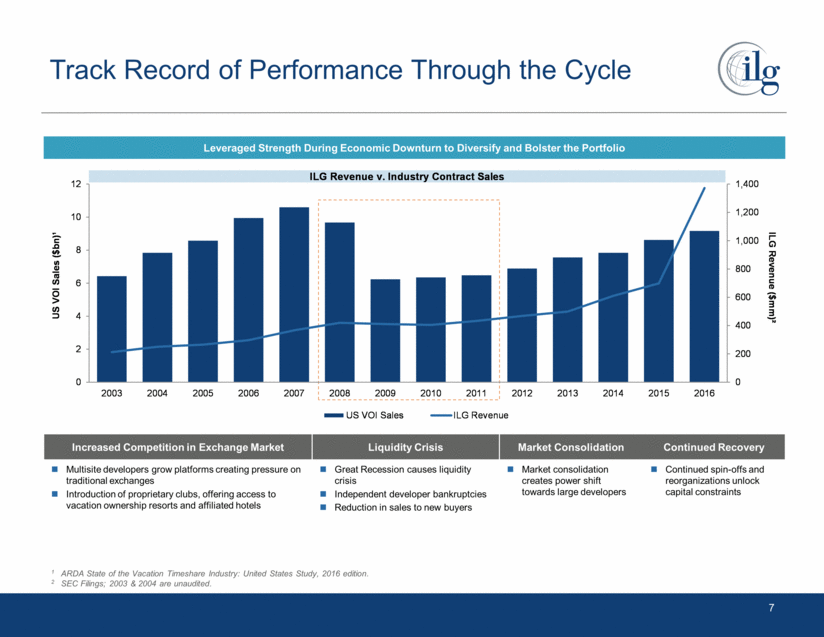
Track Record of Performance Through the Cycle 7 Leveraged Strength During Economic Downturn to Diversify and Bolster the Portfolio Increased Competition in Exchange Market Liquidity Crisis Market Consolidation Continued Recovery Multisite developers grow platforms creating pressure on traditional exchanges Introduction of proprietary clubs, offering access to vacation ownership resorts and affiliated hotels Great Recession causes liquidity crisis Independent developer bankruptcies Reduction in sales to new buyers Market consolidation creates power shift towards large developers Continued spin-offs and reorganizations unlock capital constraints 1 ARDA State of the Vacation Timeshare Industry: United States Study, 2016 edition. 2 SEC Filings; 2003 & 2004 are unaudited. 0 200 400 600 800 1,000 1,200 1,400 0 2 4 6 8 10 12 2003 2004 2005 2006 2007 2008 2009 2010 2011 2012 2013 2014 2015 2016 ILG Revenue ($mm)² US VOI Sales ($bn)¹ US VOI Sales ILG Revenue ILG Revenue v. Industry Contract Sales
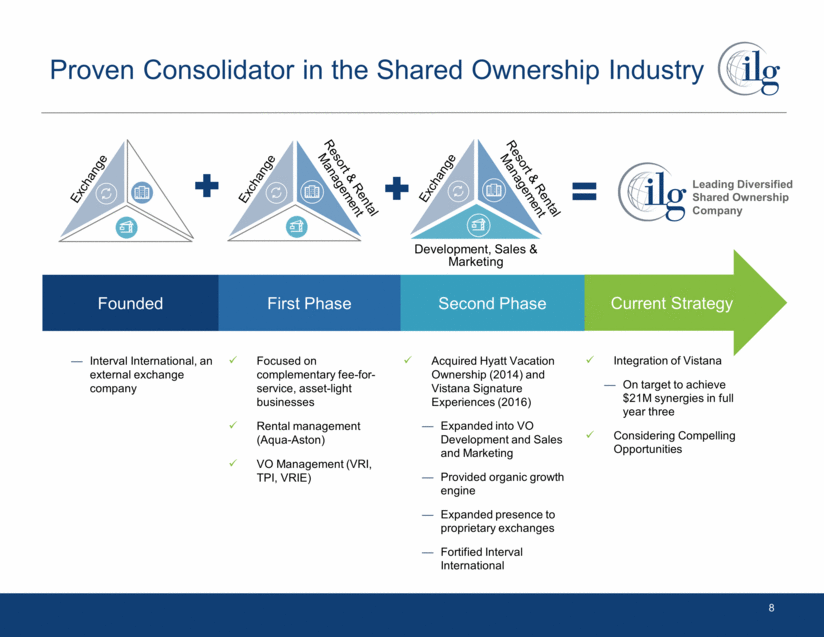
Proven Consolidator in the Shared Ownership Industry 8 Current Strategy Founded First Phase Focused on complementary fee-for-service, asset-light businesses Rental management (Aqua-Aston) VO Management (VRI, TPI, VRIE) Acquired Hyatt Vacation Ownership (2014) and Vistana Signature Experiences (2016) Expanded into VO Development and Sales and Marketing Provided organic growth engine Expanded presence to proprietary exchanges Fortified Interval International Integration of Vistana On target to achieve $21M synergies in full year three Considering Compelling Opportunities Resort & Rental Management Exchange Resort & Rental Management Exchange Development, Sales & Marketing Second Phase Interval International, an external exchange company Leading Diversified Shared Ownership Company
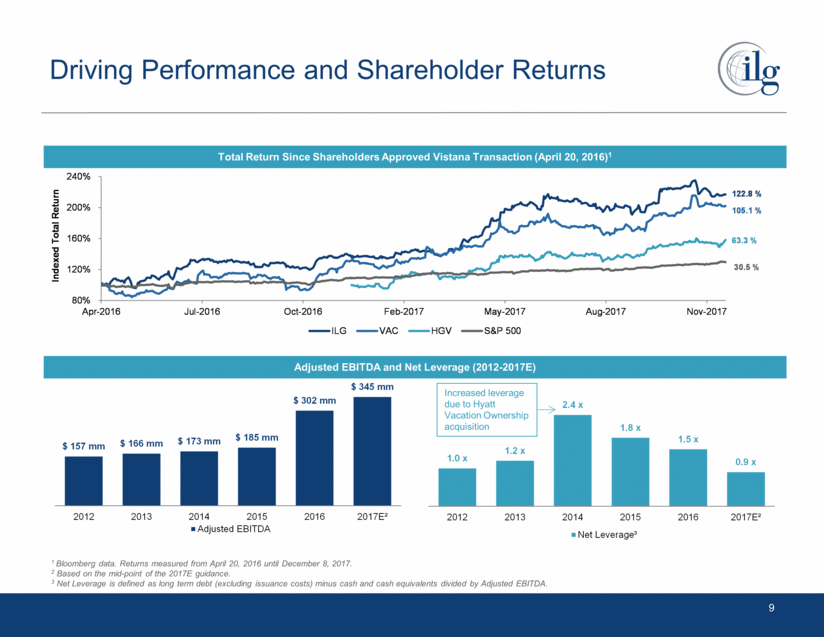
Driving Performance and Shareholder Returns 9 Total Return Since Shareholders Approved Vistana Transaction (April 20, 2016)1 Adjusted EBITDA and Net Leverage (2012-2017E) 1 Bloomberg data. Returns measured from April 20, 2016 until December 8, 2017. 2 Based on the mid-point of the 2017E guidance. 3 Net Leverage is defined as long term debt (excluding issuance costs) minus cash and cash equivalents divided by Adjusted EBITDA. Increased leverage due to Hyatt Vacation Ownership acquisition 1.0 x 1.2 x 2.4 x 1.8 x 1.5 x 0.9 x 2012 2013 2014 2015 2016 2017E² Net Leverage³ $ 157 mm $ 166 mm $ 173 mm $ 185 mm $ 302 mm $ 345 mm 2012 2013 2014 2015 2016 2017E² Adjusted EBITDA 80% 120% 160% 200% 240% Apr-2016 Jul-2016 Oct-2016 Feb-2017 May-2017 Aug-2017 Nov-2017 Indexed Total Return ILG VAC HGV S&P 500 122.8 % 105.1 % 63.3 % 30.5 %
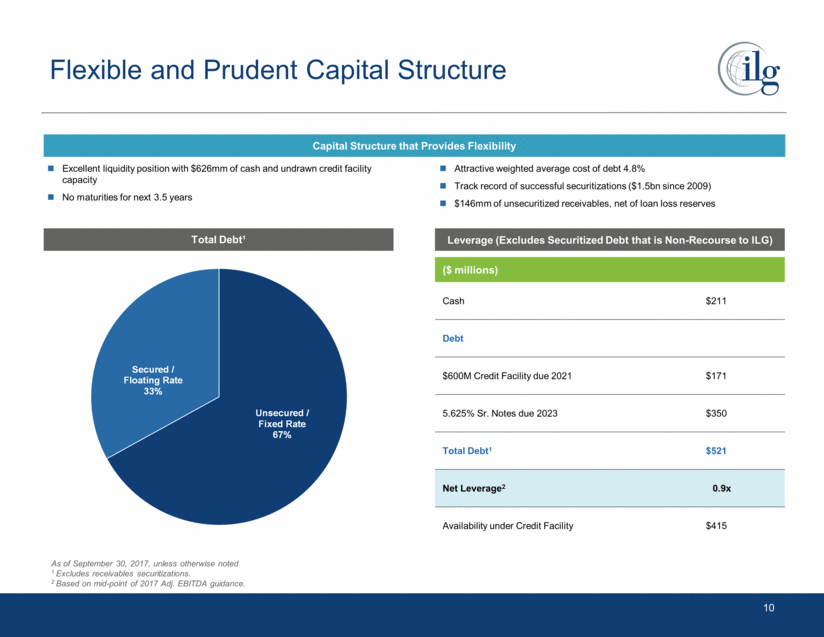
Flexible and Prudent Capital Structure 10 Capital Structure that Provides Flexibility Leverage (Excludes Securitized Debt that is Non-Recourse to ILG) Total Debt¹ Excellent liquidity position with $626mm of cash and undrawn credit facility capacity No maturities for next 3.5 years Attractive weighted average cost of debt 4.8% Track record of successful securitizations ($1.5bn since 2009) $146mm of unsecuritized receivables, net of loan loss reserves As of September 30, 2017, unless otherwise noted 1 Excludes receivables securitizations. 2 Based on mid-point of 2017 Adj. EBITDA guidance. ($ millions) Cash $211 Debt $600M Credit Facility due 2021 $171 5.625% Sr. Notes due 2023 $350 Total Debt1 $521 Net Leverage2 0.9x Availability under Credit Facility $415 ?Unsecured / Fixed Rate 67% ?Secured / Floating Rate 33%
Focused Company with Competitive Advantages 11 Our Strategic Focus Growth Through Effective Capital Allocation Enhance Customer Engagement Drive Continued Operational Efficiency Grow VO Sales and Related Revenue Streams Experienced Management Team Successful track record in the global vacation ownership and hospitality industries Exclusive Upper-Upscale Brand Licenses Exclusive global rights to Hyatt, Sheraton, and Westin in VO Long-term license agreements Market Leadership World-class resorts in key locations with branded experiences Largest manager of legacy VO resorts Leading provider of room nights in Hawaii Long-Term Embedded Growth Significant inventory for development Recurring and Fee Based Revenue Streams Membership, club, and related transaction fees Management and financing fees Competitive Advantages
Board & Corporate Governance
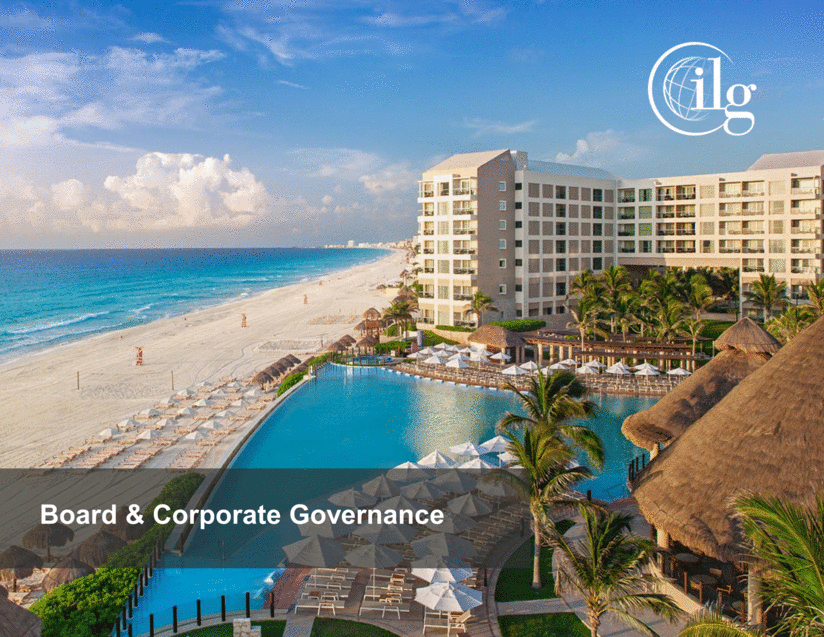
ILG Corporate Governance Promotes Accountability to Shareholders 13 Governance Highlights Shareholder-Friendly? Prevalence / Average Among Proxy Peers?1 Single Class of Stock 92 % Annually Elected Board 62 % No Shareholder Rights Plan in Place 100 % Lead Independent Director 54 % New Directors in Past 3 Years? 6 Directors 4 Directors Average Board Tenure 6 Years 6.5 Years Robust Stock Ownership Guidelines 85 % Majority Vote Standard to Elect Directors 62 % Formal CEO and Key Executive Succession Plan 77 % Performance Based Executive Compensation 100 % Support for Say-on-Pay 98% 93 % Rigorous and Regular Board Review and Self-Evaluation - Significant Shareholder Representation on Board - Source: Institutional Shareholder Services, FactSet, Spencer Stuart Board Index 2016 1 Proxy peers include: Choice Hotels, Eldorado Resorts, Hospitality Properties Trust, Hyatt Hotels, Intercontinental Hotels, La Quinta Holdings, Marriott Vacations, Norwegian Cruise Line Holdings, Pinnacle Entertainment, Ryman Hospitality Properties, Vail Resorts, Viad, and Wyndham Worldwide; percentages based on most recent ISS annual report.
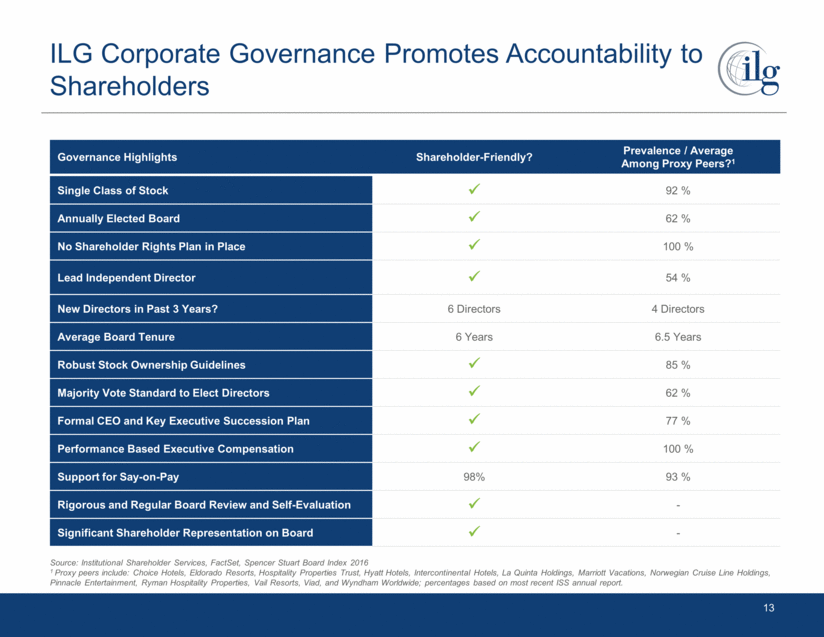
Evolution of Board Composition 14 2017 Board of Directors Craig Nash Avy Stein Victoria Freed Lizanne Galbreath Lewis Korman Thomas Kuhn Thomas McInerney Thomas Murphy Stephen Quazzo Sergio Rivera Thomas Ryder David Flowers Chad Hollingsworth 2008 Spin-off 2012 2015 2016 2017 2009 2010 2011 2013 2014 2008 Board of Directors Craig Nash Gregory Blatt Lewis Korman Thomas Kuhn Thomas McInerney Thomas Murphy Avy Stein David Flowers Gary Howard Lizanne Galbreath Stephen Quazzo Sergio Rivera Thomas Ryder + Chad Hollingsworth + Gary Howard Jeanette Marbert - Victoria Freed + Gregory Blatt - Since inception in 2008, the ILG board has been in a steady state of evolution Experience-based refreshment due to the addition of 6 directors in the past 3 years Deep expertise on assets and industry lead to an informed board with a well-founded perspective on our growth and strategic opportunity Board currently has 11 independent directors and engages in regular self-evaluation Agreement between ILG and Starwood following Vistana acquisition Starwood entitled to nominate 4 directors Additional agreements related to licensing, tax, management, and transition services Board size increased at Liberty’s Request Liberty entitled to nominate up to 20% of the board of directors Agreement terminated if Liberty’s beneficial ownership falls below 10% Jeanette Marbert
ILG Board is Driving Corporate Strategy 15 Board is Committed to Maximizing Shareholder Value and Has a Successful Track Record of M&A1 Director Skillset Aligns With Corporate Strategy Vistana Signature Experiences Announced: 28-Oct-2015 Deal Value ($mm): $1,500 Hyatt Vacation Ownership Announced: 6-May-2014 Deal Value ($mm): $220 Aqua Hospitality Announced: 11-Dec-2013 VRI Europe Joint Venture Announced: 4-Nov-2013 Vacation Resorts International Announced: 28-Feb-2012 Trading Places International Announced: 29-Nov-2010 Deal Value ($mm): $12.9 1 Reflects values for publicly disclosed deal size. Nash Flowers Freed Galbreath Hollingsworth Korman Kuhn McInerney Murphy Quazzo Rivera Ryder Stein Corporate Leadership Branding Ethnic/Gender Diversity Finance & Capital Markets Financial Literacy Independence Legal & Regulatory Leisure Industry Public Company Board Service Real Estate & Development Sales & Marketing

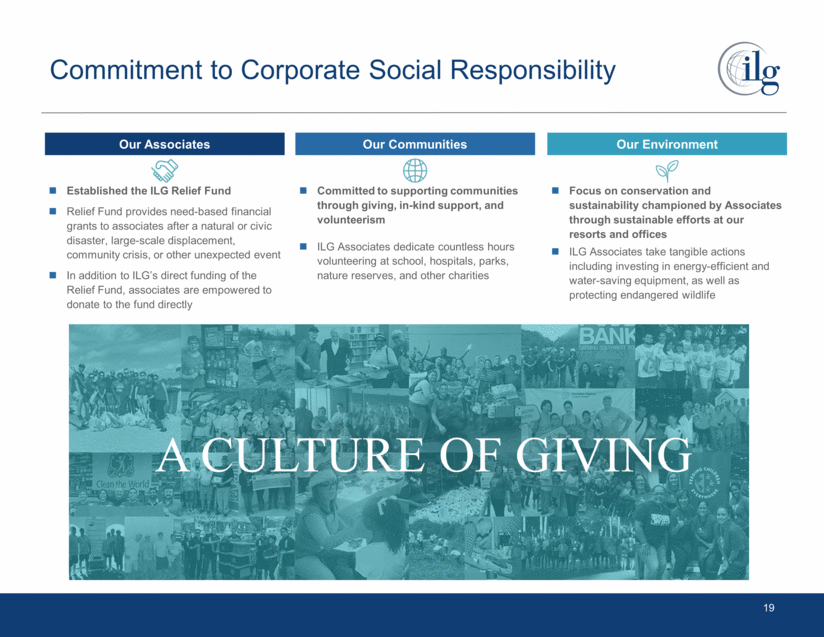
Key Board Experience and Leadership 16 Director Key Info Bio Director Key Info Bio Craig Nash Age: 64 CEO/Chairman Director Since: 2008 Current Chairman & CEO of ILG Former President and CEO of Interval International Thomas Kuhn Age: 55 Independent Director Since: 2008 Of Counsel, Covington & Burling Managing Member, Doorbrook, LLC Former Managing Director at Allen & Co. Avy Stein Age: 62 Independent Lead Director Since: 2008 Managing Partner, Willis Stein & Partner Co-chairman of the Development Council for B.U.I.L.D Thomas McInerney Age: 53 Independent Director Since: 2008 CEO, Altaba Former EVP and CFO of IAC Former CEO of IAC Retailing David Flowers Age: 63 Independent Director Since: 2008 Former SVP, Liberty Media Former SVP and Treasurer of Discovery Holding Company Thomas Murphy Age: 69 Independent Director Since: 2008 Chairman & CEO, Coastal Construction Group Serves as a director of the St. Joe Company Victoria Freed Age: 60 Independent Director Since: 2013 SVP Sales, Trade Support & Service, Royal Caribbean International Former SVP Sales and Marketing Carnival Cruise Lines Stephen Quazzo Age: 57 Independent Director Since: 2016 CEO & Co-Founder, Pearlmark Real Estate, LLC Director of Phillips Edison & Co. Former President of Equity Institutional Investors Lizanne Galbreath Age: 60 Independent Director Since: 2016 Managing Partner, Galbreath & Company Former Managing Director at LaSalle Partners Sergio Rivera Age: 55 Insider Director Since: 2016 President & CEO, ILG Vacation Ownership Former President of the Americas for Starwood Hotels & Resorts Chad Hollingsworth Age: 41 Independent Director Since: 2015 SVP, Liberty Interactive, Media, Broadband, and TripAdvisor Holdings Former VP of Liberty interactive and Liberty Media Thomas Ryder Age: 73 Independent Director Since: 2016 Chairman, The Reader’s Digest Association Former Chairman of the Board at Virgin Mobile USA Lewis Korman Age: 72 Independent Director Since: 2008 Business Advisor, Trident Media & Sandler, Travis & Rosenberg Former President and COO of Savoy Pictures Entertainment
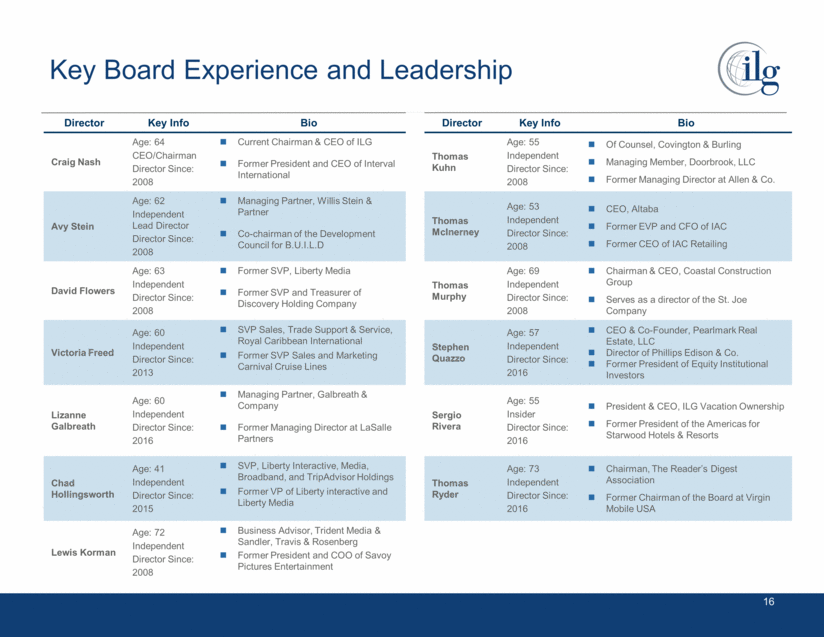
Key Board Committees 17 Name Key Committee Memberships Audit Compensation Nominating Craig Nash Avy Stein C David Flowers Victoria Freed Lizanne Galbreath Chad Hollingsworth Lewis Korman C Thomas Kuhn C Thomas McInerney Thomas Murphy Jr. Stephen Quazzo Sergio Rivera Thomas Ryder
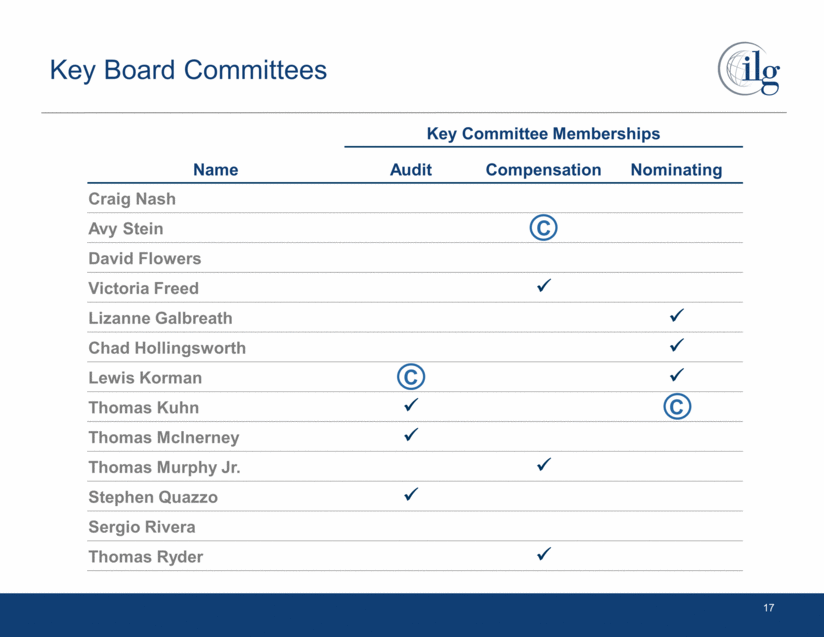
Rigorous Performance Based Compensation Targets Ensure Alignment with Shareholders' Interests 18 Compensation Program Highlights Designed to attract top talent and align incentives between management and long term value creation Approved by an independent compensation committee with an independent compensation consultant Focus on pay for performance as central tenet Performance conditions on 87% of 2016 CEO target comp. and 86% on the comp. for other named executive officers Performance-based pay subject to recoupment (“claw back”) policy Caps performance-based awards at 200% of target Robust executive stock ownership guidelines (6x for CEO) Executives and directors prohibited from hedging or pledging ILG stock Double Trigger for RSU vesting in the event of a change of control In 2016, instituted annual Say-on-Pay vote 98% Say on Pay approval at the 2017 AGM reflects strong shareholder support for current compensation practices Significant Portion of Executive Comp. Based on Performance CEO Other NEOs = Base Salary = Performance-Based (ST + LT) Source: Institutional Shareholder Services Incentives Aligned with Returns 2016 CEO annual incentives determined based on adjusted EBITDA and revenue hurdles: 80% of CEO bonus based on adjusted EBITDA goals; incentive payout ranged from 0 – 200% of base salary 20% of CEO bonus based on revenue goals; incentive payout ranged from 0 – 140% of base salary Long term incentives made up of two parts: Annual RSUs – specific performance conditions based on year granted, vest in equal portions over several years Long Term Performance RSUs – based on specific, multi-year performance conditions, vest 3 years after being granted 86.5 % 13.5 % 85.6 % 14.4 %
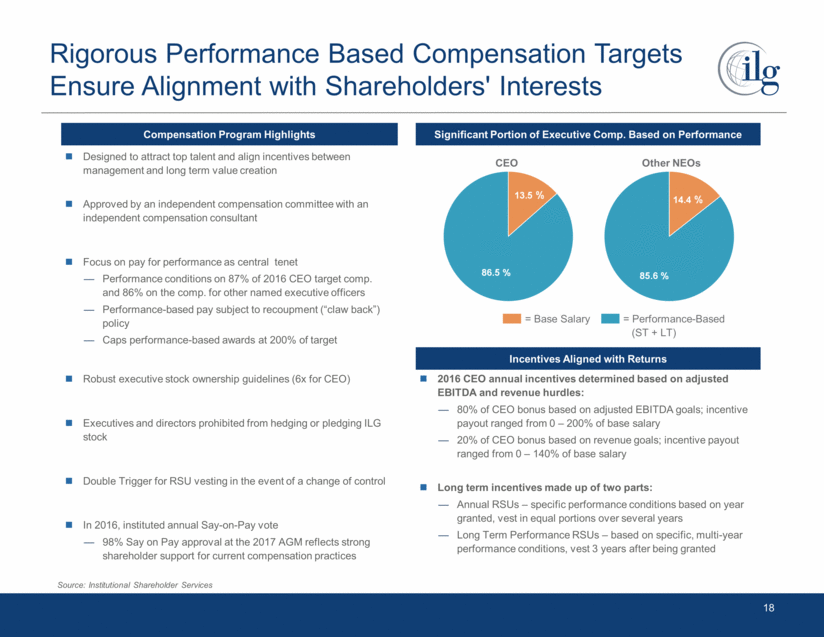
Commitment to Corporate Social Responsibility 19 Our Associates Established the ILG Relief Fund Relief Fund provides need-based financial grants to associates after a natural or civic disaster, large-scale displacement, community crisis, or other unexpected event In addition to ILG’s direct funding of the Relief Fund, associates are empowered to donate to the fund directly Our Communities Committed to supporting communities through giving, in-kind support, and volunteerism ILG Associates dedicate countless hours volunteering at school, hospitals, parks, nature reserves, and other charities Our Environment Focus on conservation and sustainability championed by Associates through sustainable efforts at our resorts and offices ILG Associates take tangible actions including investing in energy-efficient and water-saving equipment, as well as protecting endangered wildlife A CULTURE OF GIVING
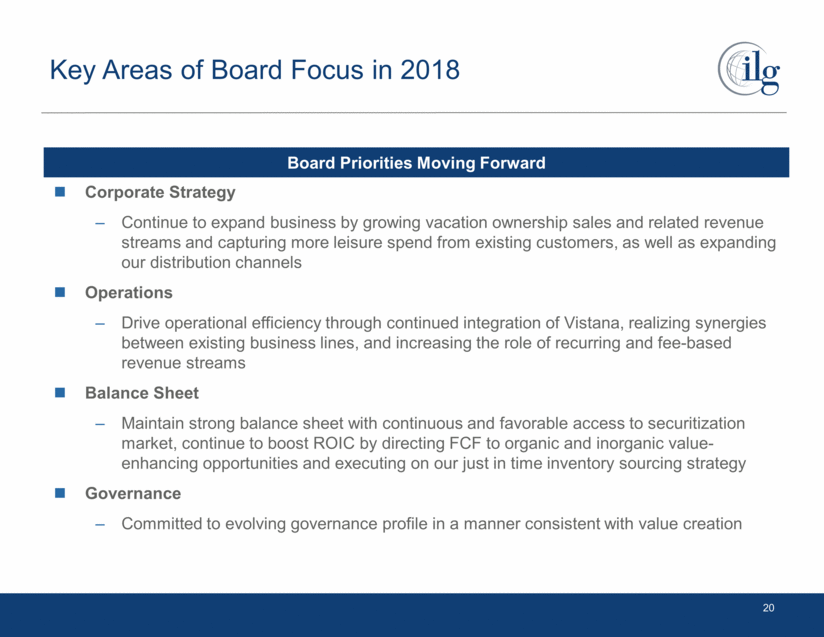
Key Areas of Board Focus in 2018 20 Board Priorities Moving Forward Corporate Strategy Continue to expand business by growing vacation ownership sales and related revenue streams and capturing more leisure spend from existing customers, as well as expanding our distribution channels Operations Drive operational efficiency through continued integration of Vistana, realizing synergies between existing business lines, and increasing the role of recurring and fee-based revenue streams Balance Sheet Maintain strong balance sheet with continuous and favorable access to securitization market, continue to boost ROIC by directing FCF to organic and inorganic value-enhancing opportunities and executing on our just in time inventory sourcing strategy Governance Committed to evolving governance profile in a manner consistent with value creation
Appendix

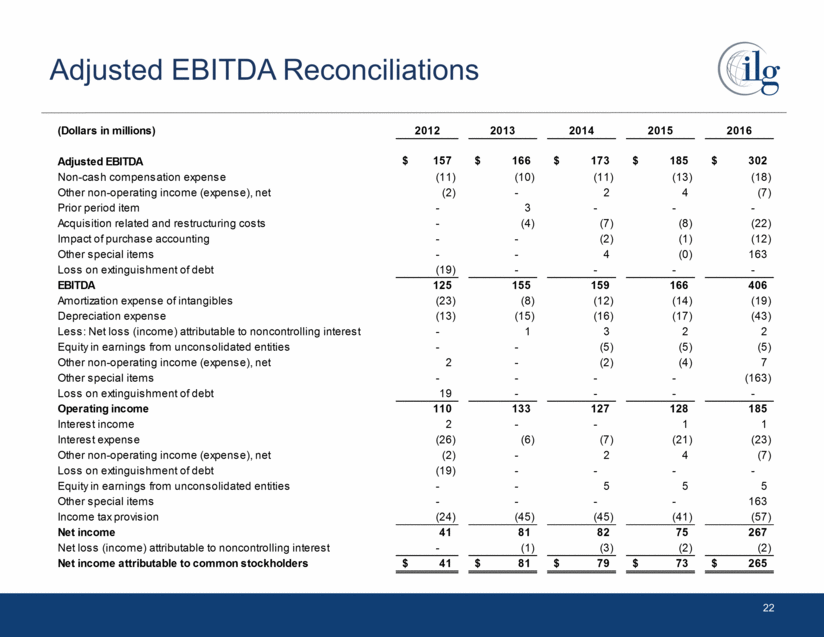
Adjusted EBITDA Reconciliations 22 (Dollars in millions) 2012 2013 2014 2015 2016 Adjusted EBITDA 157 $ 166 $ 173 $ 185 $ 302 $ Non-cash compensation expense (11) (10) (11) (13) (18) Other non-operating income (expense), net (2) - 2 4 (7) Prior period item - 3 - - - Acquisition related and restructuring costs - (4) (7) (8) (22) Impact of purchase accounting - - (2) (1) (12) Other special items - - 4 (0) 163 Loss on extinguishment of debt (19) - - - - EBITDA 125 155 159 166 406 Amortization expense of intangibles (23) (8) (12) (14) (19) Depreciation expense (13) (15) (16) (17) (43) Less: Net loss (income) attributable to noncontrolling interest - 1 3 2 2 Equity in earnings from unconsolidated entities - - (5) (5) (5) Other non-operating income (expense), net 2 - (2) (4) 7 Other special items - - - - (163) Loss on extinguishment of debt 19 - - - - Operating income 110 133 127 128 185 Interest income 2 - - 1 1 Interest expense (26) (6) (7) (21) (23) Other non-operating income (expense), net (2) - 2 4 (7) Loss on extinguishment of debt (19) - - - - Equity in earnings from unconsolidated entities - - 5 5 5 Other special items - - - - 163 Income tax provision (24) (45) (45) (41) (57) Net income 41 81 82 75 267 Net loss (income) attributable to noncontrolling interest - (1) (3) (2) (2) Net income attributable to common stockholders 41 $ 81 $ 79 $ 73 $ 265 $
2017E Guidance 23 (Dollars in millions) Low High Consolidated Revenues 1,710 $ 1,835 $ Consolidated Revenues Ex. Cost Reimbursements 1,370 $ 1,470 $ Adjusted EBITDA 340 350 Non-cash compensation expense (23) (23) Other non-operating income, net 8 8 Acquisition-related and restructuring costs (11) (11) Asset impairments (5) (5) Other special items (6) (6) Impact of purchase accounting 4 4 Depreciation and amortization (79) (79) Interest, net (25) (25) Income tax provision (74) (77) Net income attributable to common stockholders 129 $ 136 $

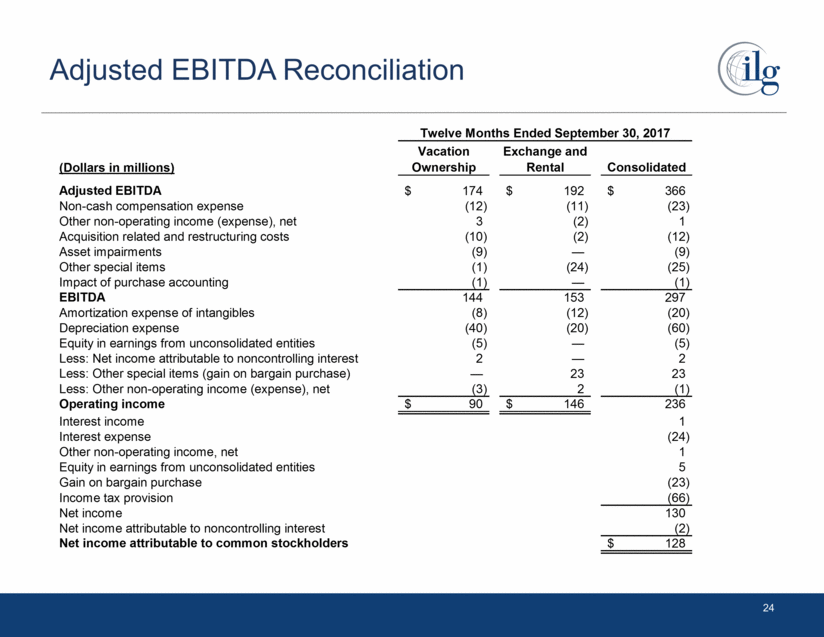
Adjusted EBITDA Reconciliation 24 (Dollars in millions) Vacation Ownership Exchange and Rental Consolidated Adjusted EBITDA 174 $ 192 $ 366 $ Non-cash compensation expense (12) (11) (23) Other non-operating income (expense), net 3 (2) 1 Acquisition related and restructuring costs (10) (2) (12) Asset impairments (9) — (9) Other special items (1) (24) (25) Impact of purchase accounting (1) — (1) EBITDA 144 153 297 Amortization expense of intangibles (8) (12) (20) Depreciation expense (40) (20) (60) Equity in earnings from unconsolidated entities (5) — (5) Less: Net income attributable to noncontrolling interest 2 — 2 Less: Other special items (gain on bargain purchase) — 23 23 Less: Other non-operating income (expense), net (3) 2 (1) Operating income 90 $ 146 $ 236 Interest income 1 Interest expense (24) Other non-operating income, net 1 Equity in earnings from unconsolidated entities 5 Gain on bargain purchase (23) Income tax provision (66) Net income 130 Net income attributable to noncontrolling interest (2) Net income attributable to common stockholders 128 $ Twelve Months Ended September 30, 2017
