Attached files
| file | filename |
|---|---|
| 8-K - 8-K - CENTRAL PACIFIC FINANCIAL CORP | a8-kdecember2017.htm |

A. CATHERINE NGO
President & Chief Executive Officer
DAVID S. MORIMOTO
Executive Vice President & Chief
Financial Officer
December 2017

Forward-Looking Statements
1
This presentation may contain forward-looking statements concerning: projections of revenues, income/loss, earnings/loss per share, capital
expenditures, dividends, capital structure, or other financial items, plans and objectives of management for future operations, future economic
performance, or any of the assumptions underlying or relating to any of the foregoing. Forward-looking statements can be identified by the fact
that they do not relate strictly to historical or current facts, and may include the words “believes,” “plans,” “intends,” “expects,” “anticipates,”
“forecasts,” “hopes,” “should,” “estimates”, “may”, “will”, “target” or words of similar meaning. While we believe that our forward-looking
statements and the assumptions underlying them are reasonably based, such statements and assumptions are by their nature subject to risks and
uncertainties, and thus could later prove to be inaccurate or incorrect. Accordingly, actual results could materially differ from forward-looking
statements for a variety of reasons, including, but not be limited to: an increase in inventory or adverse conditions in the Hawaii and California real
estate markets and deterioration in the construction industry; adverse changes in the financial performance and/or condition of our borrowers
and, as a result, increased loan delinquency rates, deterioration in asset quality, and losses in our loan portfolio; the impact of local, national, and
international economies and events (including natural disasters such as wildfires, tsunamis, storms and earthquakes) on the Company’s business
and operations and on tourism, the military, and other major industries operating within the Hawaii market and any other markets in which the
Company does business; deterioration or malaise in domestic economic conditions, including destabilization in the financial industry and
deterioration of the real estate market, as well as the impact of declining levels of consumer and business confidence in the state of the economy in
general and in financial institutions in particular; changes in estimates of future reserve requirements based upon the periodic review thereof
under relevant regulatory and accounting requirements; the impact of the Dodd-Frank Wall Street Reform and Consumer Protection Act, changes
in capital standards, other regulatory reform, including but not limited to regulations promulgated by the Consumer Financial Protection Bureau,
government-sponsored enterprise reform, and any related rules and regulations on our business operations and competitiveness; the costs and
effects of legal and regulatory developments, including the resolution of legal proceedings or regulatory or other governmental inquiries and the
results of regulatory examinations or reviews; ability to successfully implement our initiatives to lower our efficiency ratio; the effects of and
changes in trade, monetary and fiscal policies and laws, including the interest rate policies of the Board of Governors of the Federal Reserve
System; inflation, interest rate, securities market and monetary fluctuations; negative trends in our market capitalization and adverse changes in
the price of the Company’s common shares; political instability; acts of war or terrorism; changes in consumer spending, borrowings and savings
habits; failure to maintain effective internal control over financial reporting or disclosure controls and procedures; technological changes; changes
in the competitive environment among financial holding companies and other financial service providers; the effect of changes in accounting
policies and practices, as may be adopted by the regulatory agencies, as well as the Public Company Accounting Oversight Board, the Financial
Accounting Standards Board and other accounting standard setters; our ability to attract and retain skilled employees; changes in our
organization, compensation and benefit plans; and our success at managing the risks involved in the foregoing items. For further information on
factors that could cause actual results to materially differ from forward-looking statements, please see the Company’s publicly available Securities
and Exchange Commission filings, including the Company’s Form 10-K for the fiscal year ended December 31, 2016, and, in particular, the
discussion of “Risk Factors” set forth therein. The Company does not update any of its forward-looking statements except as required by law.

Corporate Profile
2
Founded in 1954 by Japanese-American veterans
of World War II
Fourth largest financial institution in Hawaii.
2011: $345 million recapitalization, including rights offering.
Profitable every quarter since recapitalization
CPF stock price is up ~ 222% from recapitalization; CAGR of 19%
3Q2013-3Q2017: Returned $355 million to shareholders through
repurchase of $274 million of CPF common stock and aggregate cash
dividends of $81 million.
Today: NYSE market capitalization of approximately $896 million.
Total assets of $5.6 billion Deposit market share of 11%
Note: Market data as of November 13, 2017.

Shareholder Value Drivers
3
Strong Hawaii Market
Relationship Banking Growth
Opportunities
Asset Quality Improvements
Efficiency Enhancements
Capital Optimization

Population of 1.4 million (2016).
Four major islands – Oahu is home to 70% of the state’s total population.
Real State GDP (2016) $72.9 billion, +2.0% from 2015. Forecasts expect a 1.9%
increase in 2017.
State unemployment rate of 2.5% is below the national unemployment rate of
4.2% (September 2017).
Economy driven primarily by tourism, military & real estate construction
industries.
2016 marked the fifth straight year of record tourism in Hawaii and is on pace
for a sixth straight record year in 2017. In 2016, visitor spending was $15.6
billion and over 8.9 million visitors came to Hawaii. Through September 2017,
visitor spending and arrivals increased 7.1% and 4.9%, respectively, over the
same prior year period.
Hawaii at a Glance
4
Source: US Census Bureau, Bureau of Economic Analysis , Bureau of Labor Statistics, Hawaii
Tourism Authority and State of Hawaii Department of Business Economic Development & Tourism

Diversity of Tourism – Visitor Arrivals
5
Source: Hawaii Tourism Authority
2016 Growth Regions
Korea +27%
US West +4%
US East +4%
US West
40.9%
US East
20.9%
Japan
16.6%
Canada
5.4%
Australia
4.5%
China
1.9%
Korea
2.7%
Europe
1.6%
Other
5.5%
Visitor Arrivals
2016
6
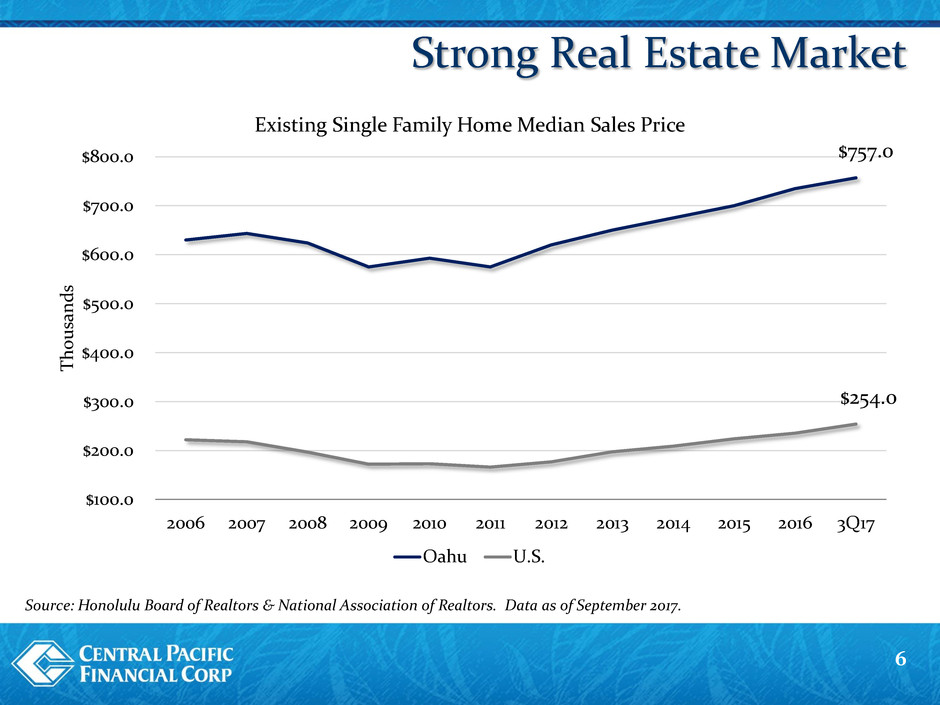
Source: Honolulu Board of Realtors & National Association of Realtors. Data as of September 2017.
Strong Real Estate Market
$757.0
$254.0
$100.0
$200.0
$300.0
$400.0
$500.0
$600.0
$700.0
$800.0
2006 2007 2008 2009 2010 2011 2012 2013 2014 2015 2016 3Q17
T
h
ous
an
d
s
Existing Single Family Home Median Sales Price
Oahu U.S.

Continued Growth and Development
7
1. Residential High-Rise Condominium Development in Honolulu
Proposed master plan includes 22 new high-rise towers in Honolulu.
Thirteen developments have completed successful sales and begun construction or have
completed construction over the past few years.
2. Rail Construction
$10.0 billion, 20-mile route. Full route to be in operation by 2024.
3. Modernization of Honolulu International Airport
$1.3 billion effort that began in 2013 and is expected to be completed by the end of 2020.
4. Military Construction
Hawaii remains a key strategic location for the U.S. Military as it is the headquarters of
the United States Pacific Command. As a result, Hawaii benefits from consistent federal
construction investments in its military bases.
5. Ko Olina Resort Development in West Oahu
Four Seasons Resort Oahu Ko Olina completed $500 million renovation in 2016. China
Oceanwide Holdings Group Company plans to break ground in 2017 on a $1 billion+
project to develop an Atlantis Resorts in West Oahu.
Source: Honolulu Star Advertiser, Hawaii Community Development Authority, Honolulu Rail Transit, Hawaii Airports Modernization,
Pacific Business News.

Continued Growth and Development
8

Hawaii Banking Market
Note: Deposit data as of September 30, 2017. For consistency, total deposits at the regulated depository level.
Source: SNL Financial
9
Total
Deposits Market
Rank Institution Type Ownership Branches (millions) Share
1 First Hawaiian Bank Bank Public - BNP 62 $17,605 38.1%
2 Bank of Hawaii Bank Public 70 15,094 32.7%
3 American Savings Bank Savings Bank Private - HEI 50 5,797 12.5%
4 Central Pacific Bank Bank Public 35 4,927 10.7%
5 Territorial Savings Bank Savings Bank Public 30 1,608 3.5%
6 Hawaii National Bank Bank Private 14 591 1.3%
7 Finance Factors Bank Private 13 468 1.0%
8 Ohana Pacific Bank Bank Private 2 126 0.3%
Market Total 276 $46,216

Kauai (2)
Oahu (27)
Maui (4)
Hawaii (2)
CPB Branch Positioning
($ millions) September 30, 2017
10
Total Assets $5,569
Total Loans $3,636
Total Deposits $4,927
Total Branches 35

Relationship Banking Growth Opportunities
11
Launched a company-wide customer
experience initiative.
Targeted small business market niches –
CPB won the 2017 Overall SBA Lender of
the Year Award.
Initiated strategic business development
agreements with Hokuyo Bank in 2015
and with the TSUBASA Alliance of Japan
in 2017.
Established joint ventures with local real
estate companies and developers to
source residential mortgage loan volume.

Strong Loan Growth
12
5.75 Year
CAGR
+11%
+25%
+19%
-8%
+5%
$4,030
$3,042
$2,169 $2,064
$2,204
$2,631
$2,932
$3,212
$3,525 $3,546 $3,592
$3,636
$0
$500
$1,000
$1,500
$2,000
$2,500
$3,000
$3,500
$4,000
$4,500
2008 2009 2010 2011 2012 2013 2014 2015 2016 1Q17 2Q17 3Q17
Balances Outstanding
Comml Mtg Construct/Dev C&I Consumer/Other Res Mtg
Million
s

Core Deposit Franchise
13
$4.9 billion in deposits as of September 30, 2017, with total core deposits at 80%
Noninterest-
Bearing DDA
28%
Interest-Bearing
DDA
19%
Savings & Money
Mkt
30%
CDs < $100M
4%
CDs > $100M
5%
Government CDs
14%

Total Deposit Cost Advantage
14
Note: National peer group is comprised of publicly traded U.S. banks with total assets between $3 and $7 billion (84 banks).
Source: SNL Financial
1.63%
1.09%
0.64%
0.30%
0.14% 0.11% 0.09% 0.09% 0.12%
0.18% 0.21%
0.25%
2.35%
1.59%
1.05%
0.78%
0.54%
0.40% 0.34% 0.33% 0.36%
0.40% 0.40%
0.47%
0.00%
0.50%
1.00%
1.50%
2.00%
2.50%
2008 2009 2010 2011 2012 2013 2014 2015 2016 1Q17 2Q17 3Q17
CPF Peer

Significantly Reduced NPAs
15
0.11% of
Total Assets
$144
$500
$303
$196
$90
$47 $42
$16 $9 $9 $9 $6
$-
$100
$200
$300
$400
$500
$600
2008 2009 2010 2011 2012 2013 2014 2015 2016 1Q17 2Q17 3Q17
Million
s
C&D Comml Mtg Res Mtg C&I/Other
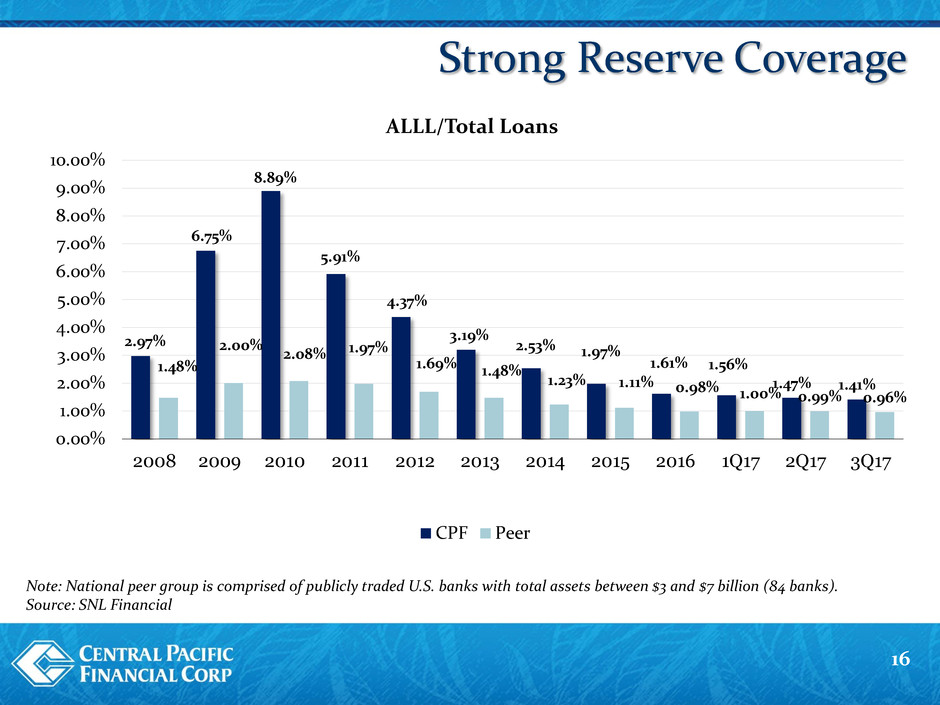
Strong Reserve Coverage
16
Note: National peer group is comprised of publicly traded U.S. banks with total assets between $3 and $7 billion (84 banks).
Source: SNL Financial
2.97%
6.75%
8.89%
5.91%
4.37%
3.19%
2.53% 1.97%
1.61% 1.56%
1.47% 1.41%
1.48%
2.00%
2.08% 1.97%
1.69% 1.48%
1.23% 1.11% 0.98% 1.00% 0.99% 0.96%
0.00%
1.00%
2.00%
3.00%
4.00%
5.00%
6.00%
7.00%
8.00%
9.00%
10.00%
2008 2009 2010 2011 2012 2013 2014 2015 2016 1Q17 2Q17 3Q17
ALLL/Total Loans
CPF Peer
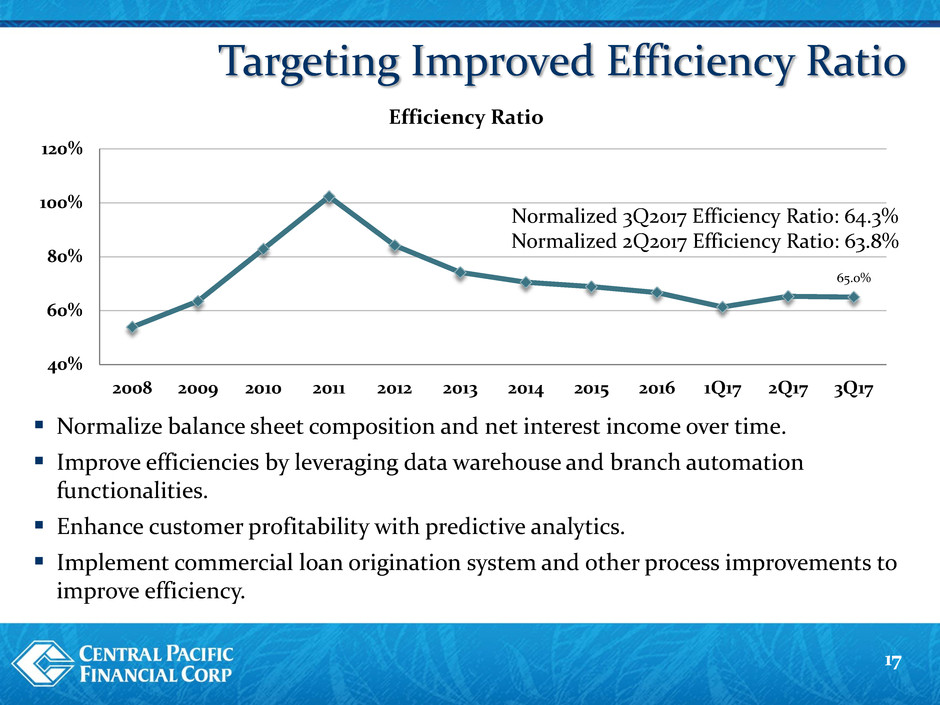
Targeting Improved Efficiency Ratio
17
Normalize balance sheet composition and net interest income over time.
Improve efficiencies by leveraging data warehouse and branch automation
functionalities.
Enhance customer profitability with predictive analytics.
Implement commercial loan origination system and other process improvements to
improve efficiency.
Normalized 3Q2017 Efficiency Ratio: 64.3%
Normalized 2Q2017 Efficiency Ratio: 63.8%
65.0%
40%
60%
80%
100%
120%
2008 2009 2010 2011 2012 2013 2014 2015 2016 1Q17 2Q17 3Q17
Efficiency Ratio
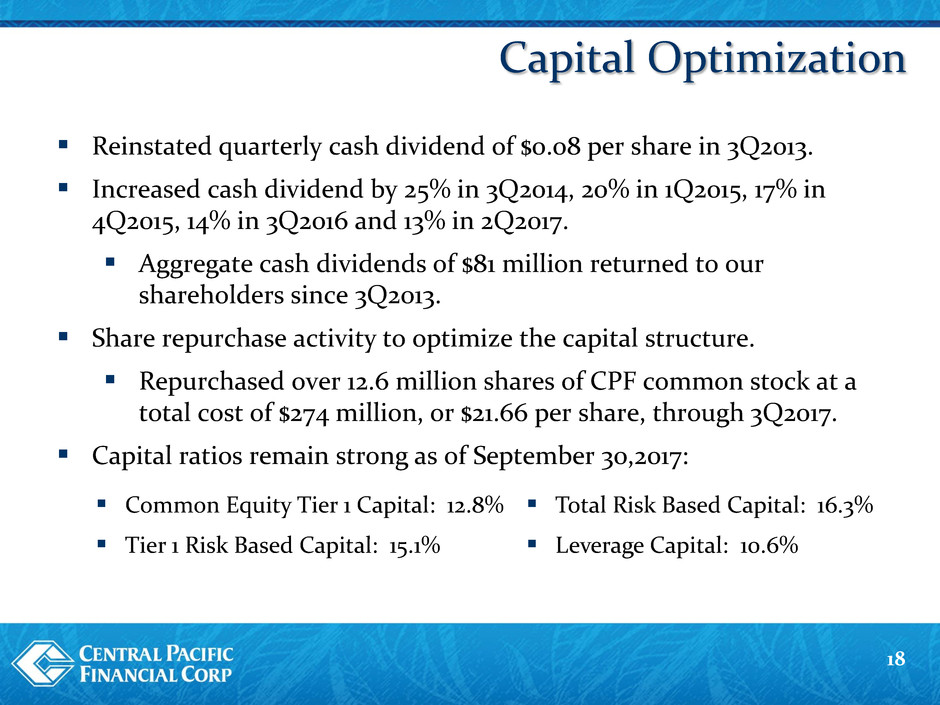
Capital Optimization
18
Reinstated quarterly cash dividend of $0.08 per share in 3Q2013.
Increased cash dividend by 25% in 3Q2014, 20% in 1Q2015, 17% in
4Q2015, 14% in 3Q2016 and 13% in 2Q2017.
Aggregate cash dividends of $81 million returned to our
shareholders since 3Q2013.
Share repurchase activity to optimize the capital structure.
Repurchased over 12.6 million shares of CPF common stock at a
total cost of $274 million, or $21.66 per share, through 3Q2017.
Capital ratios remain strong as of September 30,2017:
Common Equity Tier 1 Capital: 12.8% Total Risk Based Capital: 16.3%
Tier 1 Risk Based Capital: 15.1% Leverage Capital: 10.6%

Shareholder Value Drivers
19
Strong Hawaii Market
Relationship Banking Growth
Opportunities
Asset Quality Improvements
Efficiency Enhancements
Capital Optimization

APPENDIX
20

Relative Value Comparison
21
Note: National peer group is comprised of publicly traded U.S. banks with total assets between $3 and $7 billion (84 banks).
Source: SNL Financial
National
Peer
CPF Average
ROAA 0.90% 0.96%
ROATCE 9.26% 10.73%
Net Interest Margin 3.27% 3.46%
Efficiency Ratio 64.02% 59.87%
ALLL/Gross Loans 1.59% 0.97%
NPAs/Total Assets 0.49% 0.80%
NCOs/Avg Loans 0.03% 0.20%
Tang. Common Equity Ratio 9.29% 9.24%
Total RBC Ratio 15.49% 14.40%
Price/Tang. Book Value 1.8x 2.1x
Price/2018 Est. EPS 16.7x 16.6x
LTM Profitability
Asset Quality
Capital Adequacy
Valuation

Financial Highlights
22
($ in millions) QTD QTD QTD
3Q17 2Q17 1Q17 2016 2015 2014 2013 2012 2011
Balance Sheet (period end data)
Loans and leases $3,636.4 $3,591.7 $3,545.7 $3,524.9 $3,211.5 $2,932.2 $2,630.6 $2,203.9 $2,064.4
Total assets 5,569.2 5,553.1 5,443.2 5,384.2 5,131.3 4,853.0 4,741.2 4,370.4 4,132.9
Total deposits 4,927.5 4,886.4 4,777.4 4,608.2 4,433.4 4,110.3 3,936.2 3,680.8 3,443.5
Total shareholders' equity 509.8 512.9 511.5 504.7 494.6 568.0 660.1 504.8 456.4
Income Statement
Net interest income $42.0 $41.6 $41.3 $158.0 $149.5 $143.4 $133.1 $119.7 $117.8
Provision (credit) for loan & lease losses (0.1) (2.3) (0.1) (5.5) (15.7) (6.4) (11.3) (18.9) (40.7)
Other operating income 9.6 7.9 10.0 42.3 34.8 41.2 50.2 54.2 52.8
Other operating expense (excl goodwill) 33.5 32.3 31.5 133.6 127.0 130.2 134.8 145.4 174.8
Income taxes (benefit) 6.4 7.4 6.8 25.2 27.1 20.4 (112.2) 0.0 0.0
Net income 11.8 12.1 13.1 47.0 45.9 40.4 172.1 47.4 36.5
Profitability
Return on average assets 0.85% 0.88% 0.96% 0.90% 0.92% 0.85% 3.73% 1.13% 0.90%
Return on avg shareholders' equity 9.16% 9.32% 10.24% 9.16% 8.91% 6.80% 27.70% 9.81% 9.83%
Efficiency ratio 64.99% 65.32% 61.36% 66.69% 68.92% 70.51% 73.53% 83.60% 102.41%
Net interest margin 3.25% 3.29% 3.30% 3.27% 3.30% 3.32% 3.19% 3.10% 3.09%
Capital Adequacy (period end data)
Leverage capital ratio 10.6% 10.7% 10.7% 10.6% 10.7% 12.0% 13.7% 14.3% 13.8%
Total risk-based capital ratio 16.3% 16.4% 16.5% 15.5% 15.7% 18.2% 21.6% 23.8% 24.2%
Asset Quality
Net loan charge-offs/average loans 0.16% 0.03% 0.13% 0.03% -0.16% 0.12% 0.05% 0.32% 1.42%
Nonaccrual loans/total loans (period end) 0.14% 0.22% 0.23% 0.24% 0.44% 1.33% 1.58% 3.60% 5.89%
Year ended December 31,

Loan and Credit Composition
23
($ in Millions)
Balance % Balance % $ %
Hawaii Portfolio
Residential Mortgage $1,267 35% $1,161 33% $106 9%
Home Equity 397 11% 351 10% 46 13%
Commercial Mortgage 801 22% 743 22% 58 8%
Commercial & Ind/Leasing 399 11% 368 11% 31 8%
Construction 95 3% 105 3% -10 -10%
Automobiles 152 4% 126 4% 26 21%
Other Consumer 162 4% 164 5% -2 -1%
Total Hawaii Portfolio $3,273 90% $3,018 88% $255 8%
Mainland Portfolio
Commercial Mortgage $139 4% $120 3% $19 16%
Commercial & Industrial 88 2% 140 4% -52 -37%
Constructio 3 0% 3 0% 0 0%
Automobiles 98 3% 92 3% 6 7%
Other Consumer 35 1% 67 2% -32 -48%
Total Mainland Portfolio $363 10% $422 12% -$59 -14%
Total Loan Portfolio $3,636 100% $3,440 100% $196 6%
September 30, 2017 September 30, 2016 Change

Stable Net Interest Margin
24
NIM has been stable around 3.30% for the last 3 years.
Expect NIM to be in the 3.20 t0 3.30% range over the next couple of quarters.
Future improvements in the NIM will result from continuing to grow the loan
portfolio and stabilizing the investment and loan yields.
4.02%
3.62%
2.91%
3.09% 3.10%
3.19%
3.32% 3.30% 3.27% 3.30% 3.29% 3.25%
2.00%
2.50%
3.00%
3.50%
4.00%
4.50%
2008 2009 2010 2011 2012 2013 2014 2015 2016 1Q17 2Q17 3Q17
Net Interest Margin
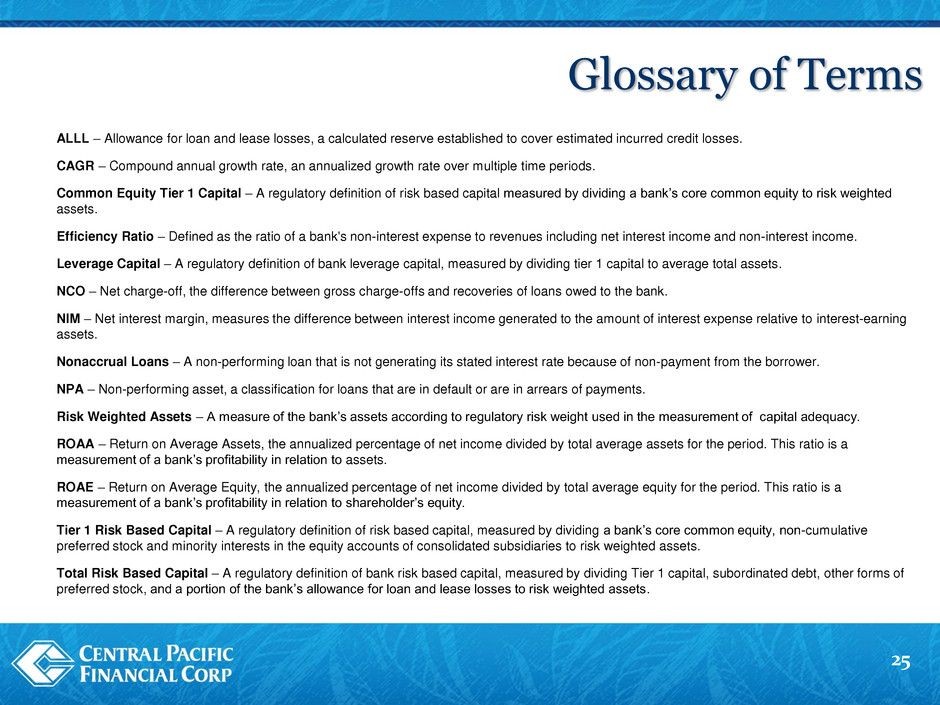
ALLL – Allowance for loan and lease losses, a calculated reserve established to cover estimated incurred credit losses.
CAGR – Compound annual growth rate, an annualized growth rate over multiple time periods.
Common Equity Tier 1 Capital – A regulatory definition of risk based capital measured by dividing a bank’s core common equity to risk weighted
assets.
Efficiency Ratio – Defined as the ratio of a bank's non-interest expense to revenues including net interest income and non-interest income.
Leverage Capital – A regulatory definition of bank leverage capital, measured by dividing tier 1 capital to average total assets.
NCO – Net charge-off, the difference between gross charge-offs and recoveries of loans owed to the bank.
NIM – Net interest margin, measures the difference between interest income generated to the amount of interest expense relative to interest-earning
assets.
Nonaccrual Loans – A non-performing loan that is not generating its stated interest rate because of non-payment from the borrower.
NPA – Non-performing asset, a classification for loans that are in default or are in arrears of payments.
Risk Weighted Assets – A measure of the bank’s assets according to regulatory risk weight used in the measurement of capital adequacy.
ROAA – Return on Average Assets, the annualized percentage of net income divided by total average assets for the period. This ratio is a
measurement of a bank’s profitability in relation to assets.
ROAE – Return on Average Equity, the annualized percentage of net income divided by total average equity for the period. This ratio is a
measurement of a bank’s profitability in relation to shareholder’s equity.
Tier 1 Risk Based Capital – A regulatory definition of risk based capital, measured by dividing a bank’s core common equity, non-cumulative
preferred stock and minority interests in the equity accounts of consolidated subsidiaries to risk weighted assets.
Total Risk Based Capital – A regulatory definition of bank risk based capital, measured by dividing Tier 1 capital, subordinated debt, other forms of
preferred stock, and a portion of the bank’s allowance for loan and lease losses to risk weighted assets.
Glossary of Terms
25
