Attached files
| file | filename |
|---|---|
| 8-K - 8-K - TRICO BANCSHARES / | d56929d8k.htm |
| EX-99.2 - EX-99.2 - TRICO BANCSHARES / | d56929dex992.htm |
| EX-2.1 - EX-2.1 - TRICO BANCSHARES / | d56929dex21.htm |
Acquisition of FNB Bancorp Milestone Transaction Building Northern California’s Premier Community Bank Investor Presentation December 11, 2017 Service With SolutionsTM Exhibit 99.1
Safe harbor statement December 2017 Forward Looking Statements This investor presentation may contain forward-looking statements regarding TriCo Bancshares (“TriCo”), including its wholly owned subsidiary Tri Counties Bank, FNB Bancorp (“FNBG”), including its wholly owned subsidiary First National Bank of Northern California (“FNB NorCal”), and the the proposed merger of FNBG with and into TriCo. These statements involve certain risks and uncertainties that could cause actual results to differ materially from those in the forward- looking statements. Such risks and uncertainties include, but are not limited to, the following factors: the possibility that any of the anticipated benefits of the proposed merger will not be realized or will not be realized within the expected time period; the risk that integration of FNBG’s operations with those of TriCo will be materially delayed or will be more costly or difficult than expected; the inability to close complete the merger in a timely manner; the inability to complete the merger due to the failure of TriCo’s or FNBG’s shareholders to adopt the merger agreement; diversion of management’s attention from ongoing business operations and opportunities; the failure to satisfy other any conditions to completion of the merger, including receipt of required regulatory and other approvals; the failure of the proposed merger to close for any other reason; the challenges of integrating and retaining key employees; the effect of the announcement of the merger on TriCo’s, FNBG’s or the combined company’s respective customer relationships and operating results; the possibility that the merger may be more expensive to complete than anticipated or that the combined company will not achieve anticipated earnings accretion or cost savings, including as a result of unexpected factors or events; the risks of expanding into a new market; and general competitive, economic, political and market conditions and fluctuations. Annualized, pro forma, projected and estimated numbers in the investor presentation are used for illustrative purposes only, are not forecasts and may not reflect actual results. TriCo, Tri Counties Bank, FNBG and FNB NorCal undertake no obligation to revise or publicly release any revision or update to these forward-looking statements to reflect events or circumstances that occur after the date on which such statements were made. Additional Information About the Merger and Where to Find It This investor presentation does not constitute an offer to sell or the solicitation of an offer to buy any securities or a solicitation of any vote or approval. In connection with the proposed acquisition transaction, TriCo will file a registration statement on Form S-4 with the SEC. The registration statement will contain a joint proxy statement/prospectus to be distributed to the shareholders of FNBG and TriCo in connection with their vote on the acquisition. SHAREHOLDERS OF FNBG AND TRICO ARE ENCOURAGED TO READ THE REGISTRATION STATEMENT AND ANY OTHER RELEVANT DOCUMENTS FILED WITH THE SEC, INCLUDING THE JOINT PROXY STATEMENT/PROSPECTUS THAT WILL BE PART OF THE REGISTRATION STATEMENT, BECAUSE THEY WILL CONTAIN IMPORTANT INFORMATION ABOUT THE PROPOSED TRANSACTION. The final joint proxy statement/prospectus will be mailed to shareholders of FNBG and TriCo. Investors and security holders will be able to obtain those documents, and any other documents TriCo and FNBG have filed with the SEC, free of charge at the SEC's website, www.sec.gov. In addition, documents filed with the SEC by TriCo and FNBG will be available free of charge by (1) accessing TriCo’s website at www.tcbk.com under the “Investor Relations” link and then under the heading “SEC Filings,” (2) accessing FNBG’s website at www.fnbnorcal.com under the “Investor Relations” link and then under the heading “SEC Information” (3) writing TriCo at 63 Constitution Drive, Chico, CA 95973, Attention: Shareholder Services or (4) writing FNBG at 975 El Camino Real, South San Francisco, CA 94080, Attention: Investor Relations Officer. The directors, executive officers and certain other members of management and employees of TriCo may be deemed to be participants in the solicitation of proxies in respect of the proposed acquisition. Information about the directors and executive officers of TriCo is included in the proxy statement for its 2017 annual meeting of TriCo shareholders, which was filed with the SEC April 17, 2017. The directors, executive officers and certain other members of management and employees of FNBG may also be deemed to be participants in the solicitation of proxies in favor of the acquisition from the shareholders of FNBG. Information about the directors and executive officers of FNBG is included in the proxy statement for its 2017 annual meeting of FNBG shareholders, which was filed with the SEC on May 12, 2017. Additional information regarding the interests of those participants and other persons who may be deemed participants in the transaction may be obtained by reading the joint proxy statement/prospectus regarding the proposed acquisition when it becomes available. Free copies of this document may be obtained as described in the preceding paragraph.
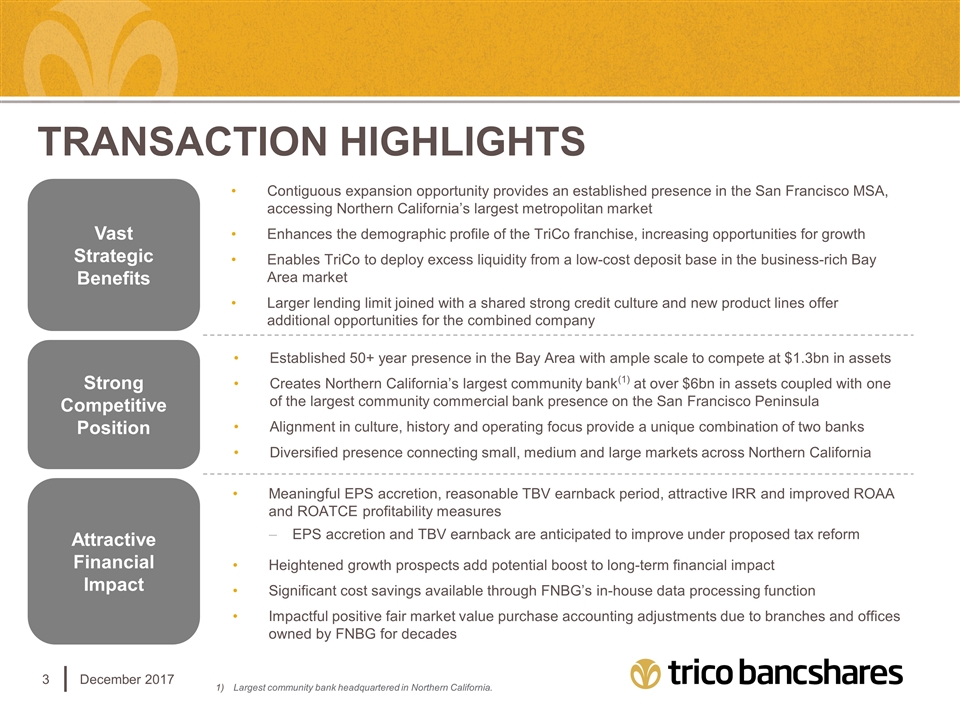
Transaction highlights December 2017 Vast Strategic Benefits Contiguous expansion opportunity provides an established presence in the San Francisco MSA, accessing Northern California’s largest metropolitan market Enhances the demographic profile of the TriCo franchise, increasing opportunities for growth Enables TriCo to deploy excess liquidity from a low-cost deposit base in the business-rich Bay Area market Larger lending limit joined with a shared strong credit culture and new product lines offer additional opportunities for the combined company Attractive Financial Impact Meaningful EPS accretion, reasonable TBV earnback period, attractive IRR and improved ROAA and ROATCE profitability measures EPS accretion and TBV earnback are anticipated to improve under proposed tax reform Heightened growth prospects add potential boost to long-term financial impact Significant cost savings available through FNBG’s in-house data processing function Impactful positive fair market value purchase accounting adjustments due to branches and offices owned by FNBG for decades Strong Competitive Position Established 50+ year presence in the Bay Area with ample scale to compete at $1.3bn in assets Creates Northern California’s largest community bank(1) at over $6bn in assets coupled with one of the largest community commercial bank presence on the San Francisco Peninsula Alignment in culture, history and operating focus provide a unique combination of two banks Diversified presence connecting small, medium and large markets across Northern California Largest community bank headquartered in Northern California.
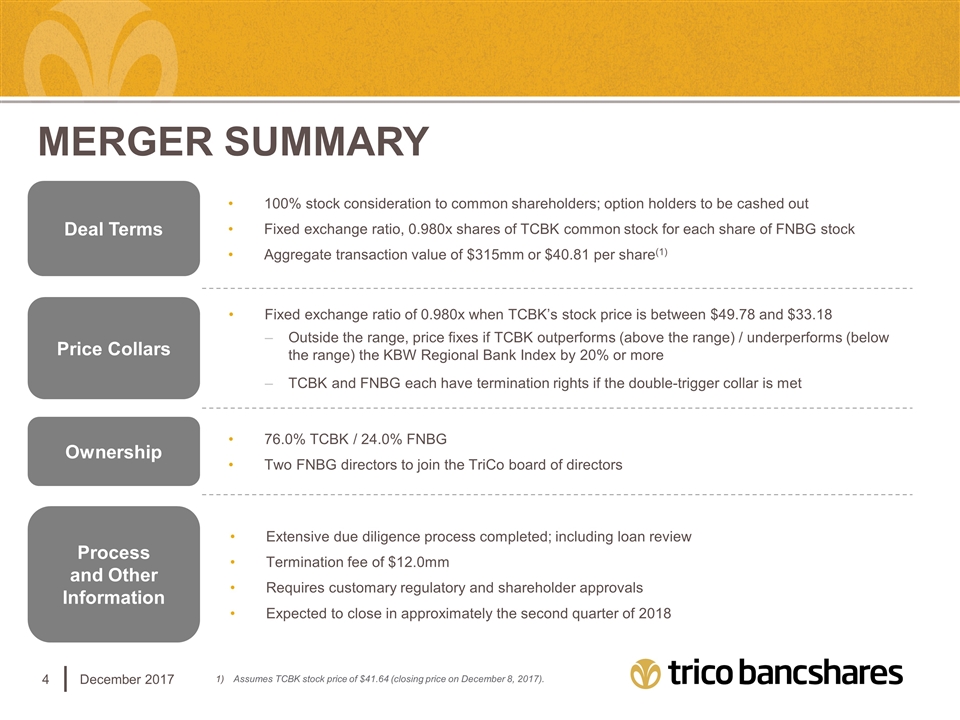
Merger summary December 2017 Deal Terms 100% stock consideration to common shareholders; option holders to be cashed out Fixed exchange ratio, 0.980x shares of TCBK common stock for each share of FNBG stock Aggregate transaction value of $315mm or $40.81 per share(1) Ownership 76.0% TCBK / 24.0% FNBG Two FNBG directors to join the TriCo board of directors Price Collars Fixed exchange ratio of 0.980x when TCBK’s stock price is between $49.78 and $33.18 Outside the range, price fixes if TCBK outperforms (above the range) / underperforms (below the range) the KBW Regional Bank Index by 20% or more TCBK and FNBG each have termination rights if the double-trigger collar is met Process and Other Information Extensive due diligence process completed; including loan review Termination fee of $12.0mm Requires customary regulatory and shareholder approvals Expected to close in approximately the second quarter of 2018 Assumes TCBK stock price of $41.64 (closing price on December 8, 2017).
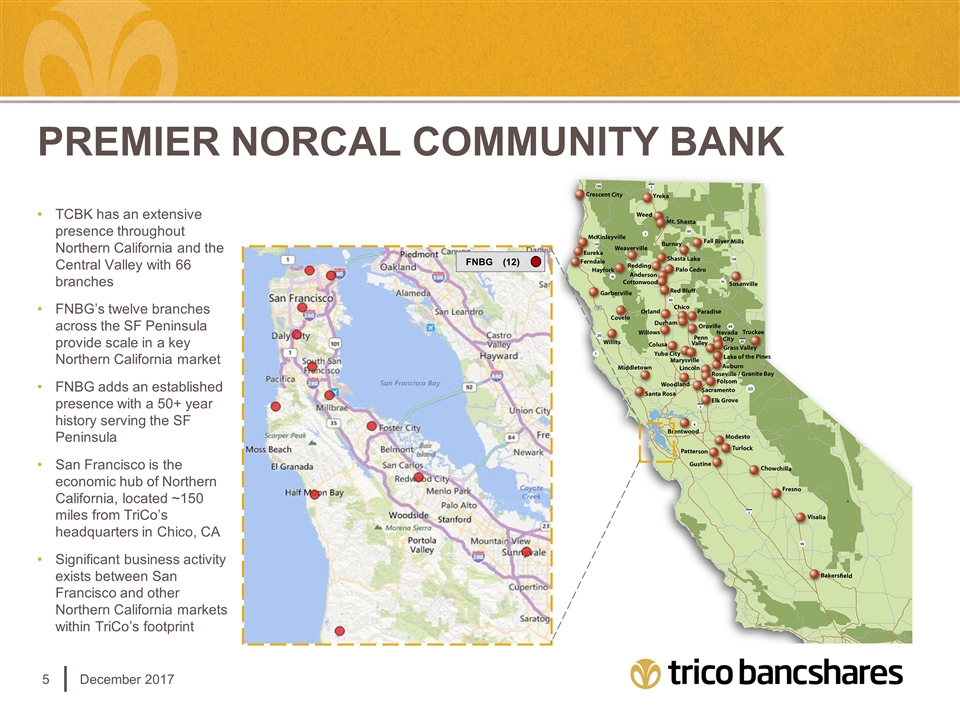
Premier Norcal Community bank December 2017 TCBK has an extensive presence throughout Northern California and the Central Valley with 66 branches FNBG’s twelve branches across the SF Peninsula provide scale in a key Northern California market FNBG adds an established presence with a 50+ year history serving the SF Peninsula San Francisco is the economic hub of Northern California, located ~150 miles from TriCo’s headquarters in Chico, CA Significant business activity exists between San Francisco and other Northern California markets within TriCo’s footprint FNBG (12)
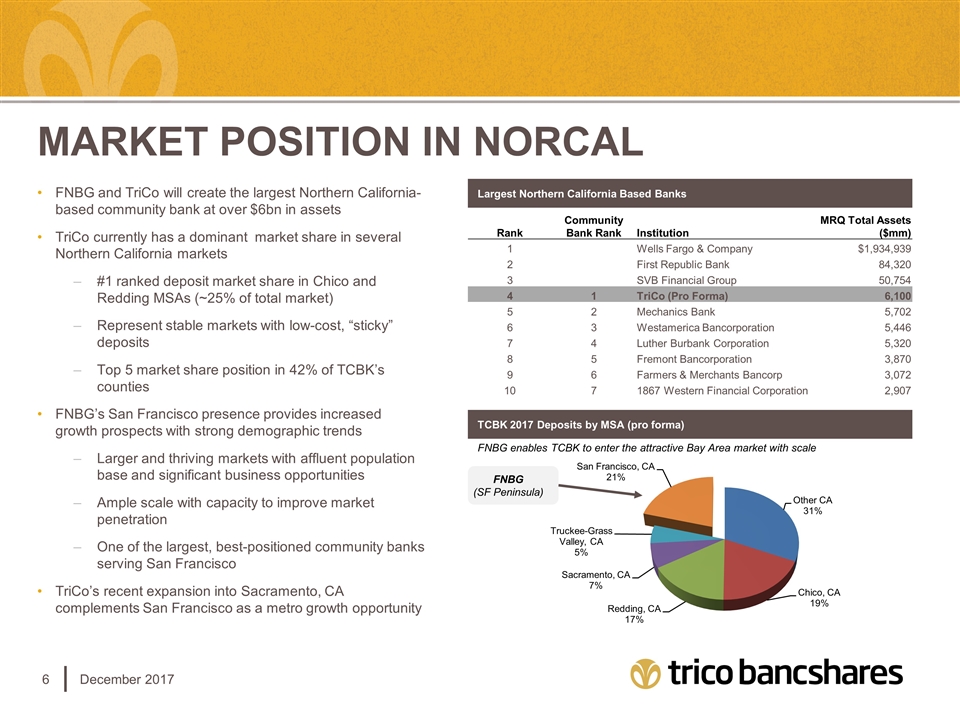
Market position in Norcal December 2017 FNBG (SF Peninsula) FNBG and TriCo will create the largest Northern California-based community bank at over $6bn in assets TriCo currently has a dominant market share in several Northern California markets #1 ranked deposit market share in Chico and Redding MSAs (~25% of total market) Represent stable markets with low-cost, “sticky” deposits Top 5 market share position in 42% of TCBK’s counties FNBG’s San Francisco presence provides increased growth prospects with strong demographic trends Larger and thriving markets with affluent population base and significant business opportunities Ample scale with capacity to improve market penetration One of the largest, best-positioned community banks serving San Francisco TriCo’s recent expansion into Sacramento, CA complements San Francisco as a metro growth opportunity TCBK 2017 Deposits by MSA (pro forma) FNBG enables TCBK to enter the attractive Bay Area market with scale Rank Community Bank Rank Institution MRQ Total Assets ($mm) 1 Wells Fargo & Company $1,934,939 2 First Republic Bank 84,320 3 SVB Financial Group 50,754 4 1 TriCo (Pro Forma) 6,100 5 2 Mechanics Bank 5,702 6 3 Westamerica Bancorporation 5,446 7 4 Luther Burbank Corporation 5,320 8 5 Fremont Bancorporation 3,870 9 6 Farmers & Merchants Bancorp 3,072 10 7 1867 Western Financial Corporation 2,907 Largest Northern California Based Banks
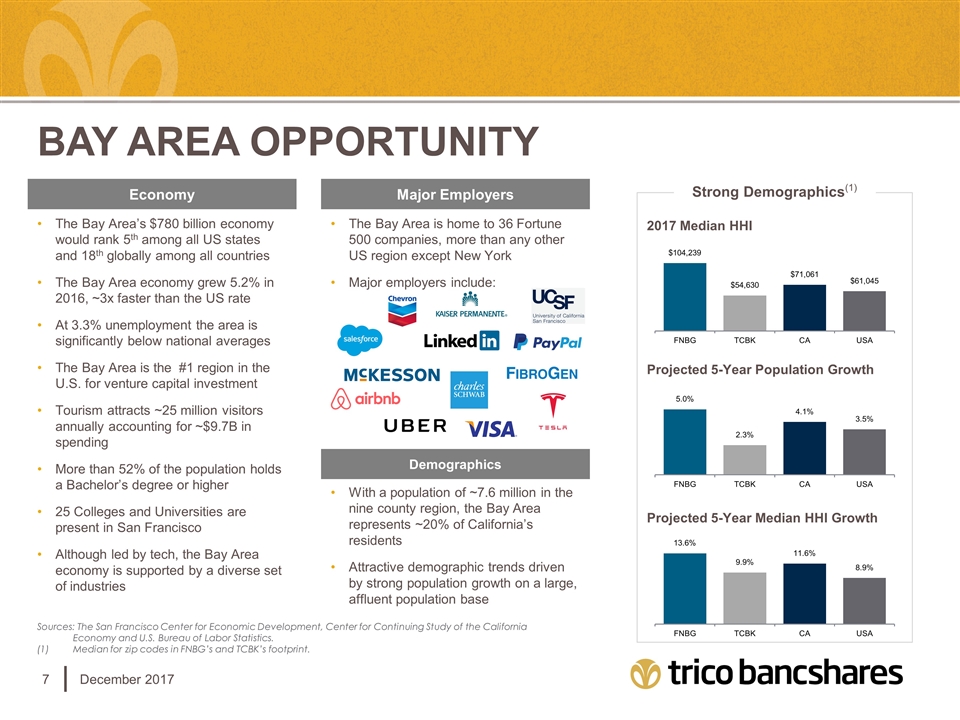
The Bay Area’s $780 billion economy would rank 5th among all US states and 18th globally among all countries The Bay Area economy grew 5.2% in 2016, ~3x faster than the US rate At 3.3% unemployment the area is significantly below national averages The Bay Area is the #1 region in the U.S. for venture capital investment Tourism attracts ~25 million visitors annually accounting for ~$9.7B in spending More than 52% of the population holds a Bachelor’s degree or higher 25 Colleges and Universities are present in San Francisco Although led by tech, the Bay Area economy is supported by a diverse set of industries The Bay Area is home to 36 Fortune 500 companies, more than any other US region except New York Major employers include: Economy Major Employers Demographics With a population of ~7.6 million in the nine county region, the Bay Area represents ~20% of California’s residents Attractive demographic trends driven by strong population growth on a large, affluent population base Bay area opportunity December 2017 2017 Median HHI Projected 5-Year Population Growth Projected 5-Year Median HHI Growth Strong Demographics(1) Sources: The San Francisco Center for Economic Development, Center for Continuing Study of the California Economy and U.S. Bureau of Labor Statistics. Median for zip codes in FNBG’s and TCBK’s footprint.
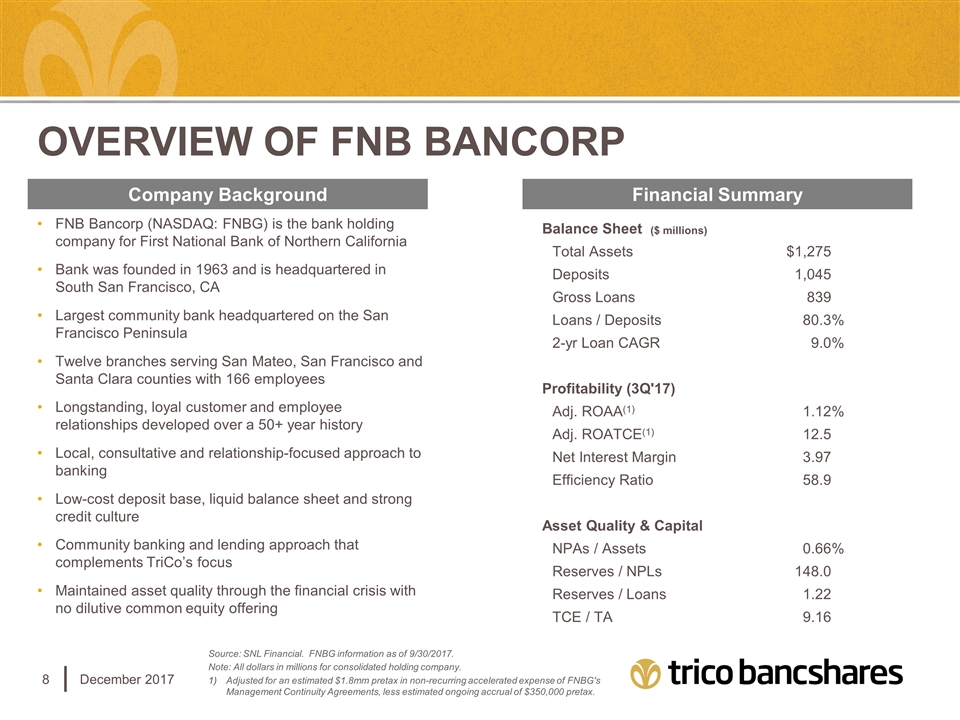
Overview of fnb Bancorp December 2017 FNB Bancorp (NASDAQ: FNBG) is the bank holding company for First National Bank of Northern California Bank was founded in 1963 and is headquartered in South San Francisco, CA Largest community bank headquartered on the San Francisco Peninsula Twelve branches serving San Mateo, San Francisco and Santa Clara counties with 166 employees Longstanding, loyal customer and employee relationships developed over a 50+ year history Local, consultative and relationship-focused approach to banking Low-cost deposit base, liquid balance sheet and strong credit culture Community banking and lending approach that complements TriCo’s focus Maintained asset quality through the financial crisis with no dilutive common equity offering Company Background Financial Summary Source: SNL Financial. FNBG information as of 9/30/2017. Note: All dollars in millions for consolidated holding company. Adjusted for an estimated $1.8mm pretax in non-recurring accelerated expense of FNBG's Management Continuity Agreements, less estimated ongoing accrual of $350,000 pretax. Balance Sheet ($ millions) Total Assets $1,275 Deposits 1,045 Gross Loans 839 Loans / Deposits 80.3 % 2-yr Loan CAGR 9.0 % Profitability (3Q'17) Adj. ROAA(1) 1.12 % Adj. ROATCE(1) 12.5 Net Interest Margin 3.97 Efficiency Ratio 58.9 Asset Quality & Capital NPAs / Assets 0.66 % Reserves / NPLs 148.0 Reserves / Loans 1.22 TCE / TA 9.16
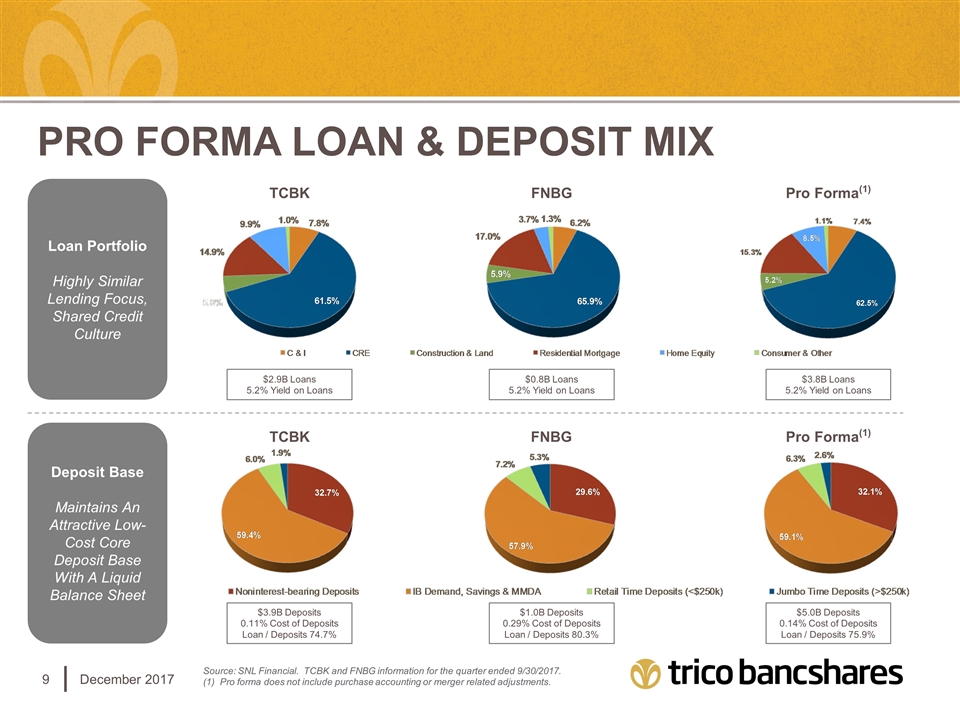
December 2017 Source: SNL Financial. TCBK and FNBG information for the quarter ended 9/30/2017. (1) Pro forma does not include purchase accounting or merger related adjustments. Pro forma loan & Deposit Mix Loan Portfolio Highly Similar Lending Focus, Shared Credit Culture Deposit Base Maintains An Attractive Low-Cost Core Deposit Base With A Liquid Balance Sheet TCBK FNBG Pro Forma(1) TCBK FNBG Pro Forma(1) $3.9B Deposits 0.11% Cost of Deposits Loan / Deposits 74.7% $1.0B Deposits 0.29% Cost of Deposits Loan / Deposits 80.3% $5.0B Deposits 0.14% Cost of Deposits Loan / Deposits 75.9% $2.9B Loans 5.2% Yield on Loans $0.8B Loans 5.2% Yield on Loans $3.8B Loans 5.2% Yield on Loans
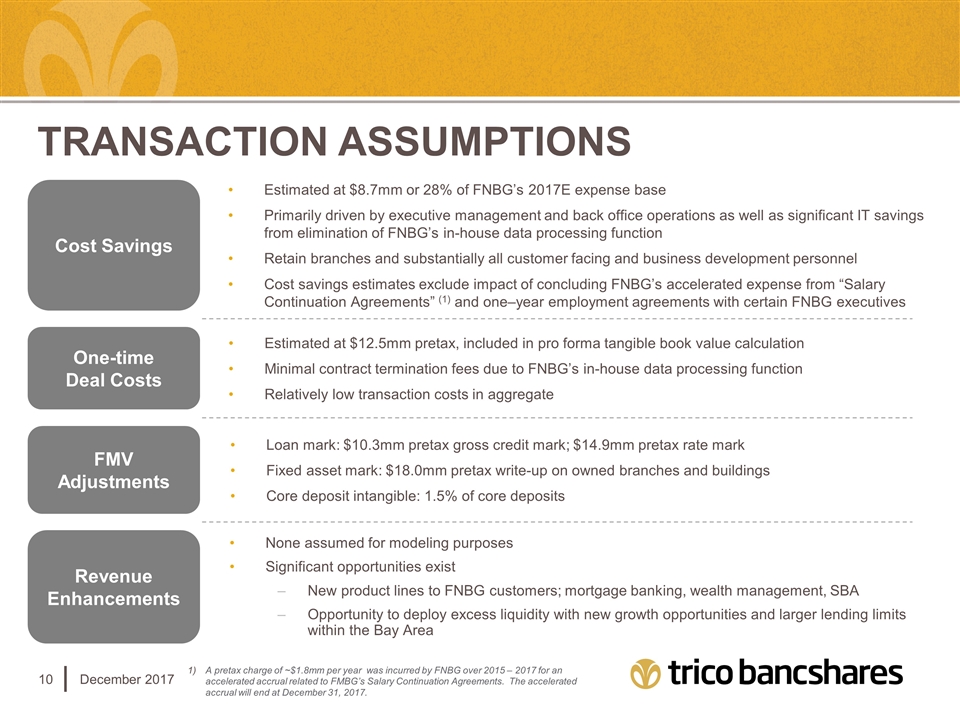
Transaction assumptions December 2017 Cost Savings Estimated at $8.7mm or 28% of FNBG’s 2017E expense base Primarily driven by executive management and back office operations as well as significant IT savings from elimination of FNBG’s in-house data processing function Retain branches and substantially all customer facing and business development personnel Cost savings estimates exclude impact of concluding FNBG’s accelerated expense from “Salary Continuation Agreements” (1) and one–year employment agreements with certain FNBG executives One-time Deal Costs Estimated at $12.5mm pretax, included in pro forma tangible book value calculation Minimal contract termination fees due to FNBG’s in-house data processing function Relatively low transaction costs in aggregate FMV Adjustments Loan mark: $10.3mm pretax gross credit mark; $14.9mm pretax rate mark Fixed asset mark: $18.0mm pretax write-up on owned branches and buildings Core deposit intangible: 1.5% of core deposits Revenue Enhancements None assumed for modeling purposes Significant opportunities exist New product lines to FNBG customers; mortgage banking, wealth management, SBA Opportunity to deploy excess liquidity with new growth opportunities and larger lending limits within the Bay Area A pretax charge of ~$1.8mm per year was incurred by FNBG over 2015 – 2017 for an accelerated accrual related to FMBG’s Salary Continuation Agreements. The accelerated accrual will end at December 31, 2017.
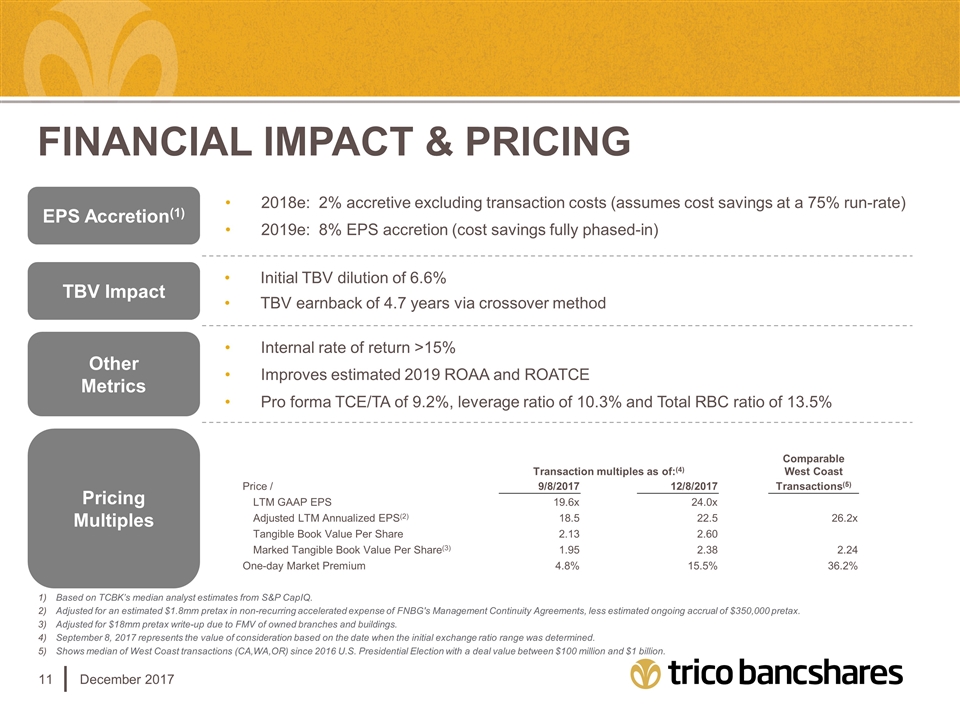
financial impact & Pricing December 2017 EPS Accretion(1) 2018e: 2% accretive excluding transaction costs (assumes cost savings at a 75% run-rate) 2019e: 8% EPS accretion (cost savings fully phased-in) TBV Impact Initial TBV dilution of 6.6% TBV earnback of 4.7 years via crossover method Other Metrics Internal rate of return >15% Improves estimated 2019 ROAA and ROATCE Pro forma TCE/TA of 9.2%, leverage ratio of 10.3% and Total RBC ratio of 13.5% Pricing Multiples Based on TCBK’s median analyst estimates from S&P CapIQ. Adjusted for an estimated $1.8mm pretax in non-recurring accelerated expense of FNBG's Management Continuity Agreements, less estimated ongoing accrual of $350,000 pretax. Adjusted for $18mm pretax write-up due to FMV of owned branches and buildings. September 8, 2017 represents the value of consideration based on the date when the initial exchange ratio range was determined. Shows median of West Coast transactions (CA,WA,OR) since 2016 U.S. Presidential Election with a deal value between $100 million and $1 billion. Transaction multiples as of:(4) Comparable West Coast Price / 9/8/2017 12/8/2017 Transactions(5) LTM GAAP EPS 19.6x 24.0x Adjusted LTM Annualized EPS(2) 18.5 22.5 26.2x Tangible Book Value Per Share 2.13 2.60 Marked Tangible Book Value Per Share(3) 1.95 2.38 2.24 One-day Market Premium 4.8% 15.5% 36.2%
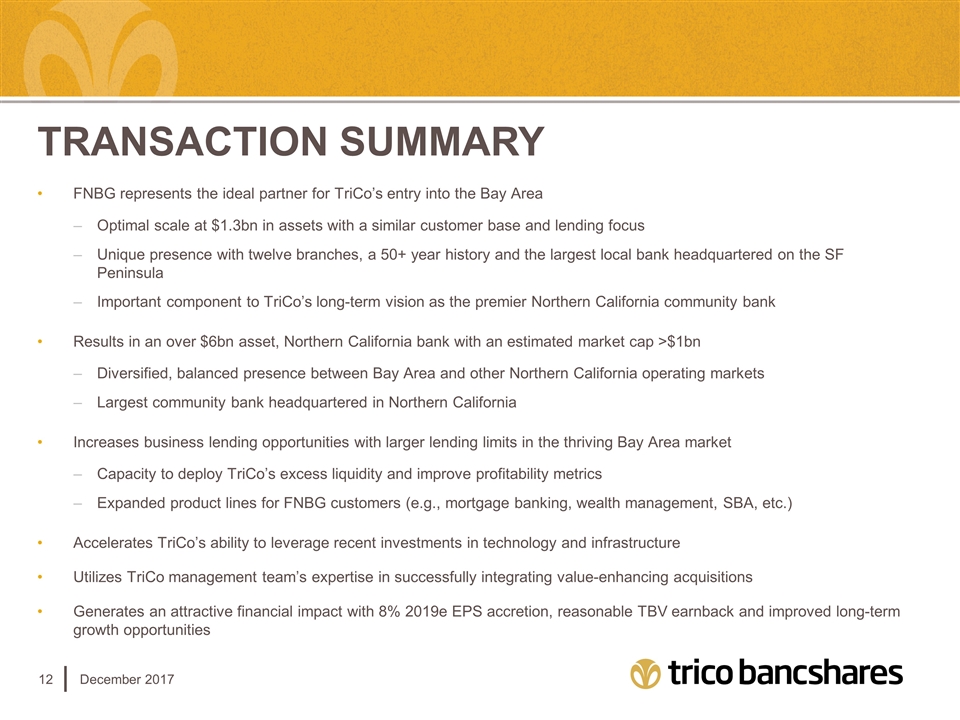
Transaction summary December 2017 FNBG represents the ideal partner for TriCo’s entry into the Bay Area Optimal scale at $1.3bn in assets with a similar customer base and lending focus Unique presence with twelve branches, a 50+ year history and the largest local bank headquartered on the SF Peninsula Important component to TriCo’s long-term vision as the premier Northern California community bank Results in an over $6bn asset, Northern California bank with an estimated market cap >$1bn Diversified, balanced presence between Bay Area and other Northern California operating markets Largest community bank headquartered in Northern California Increases business lending opportunities with larger lending limits in the thriving Bay Area market Capacity to deploy TriCo’s excess liquidity and improve profitability metrics Expanded product lines for FNBG customers (e.g., mortgage banking, wealth management, SBA, etc.) Accelerates TriCo’s ability to leverage recent investments in technology and infrastructure Utilizes TriCo management team’s expertise in successfully integrating value-enhancing acquisitions Generates an attractive financial impact with 8% 2019e EPS accretion, reasonable TBV earnback and improved long-term growth opportunities
APPENDIX December 2017
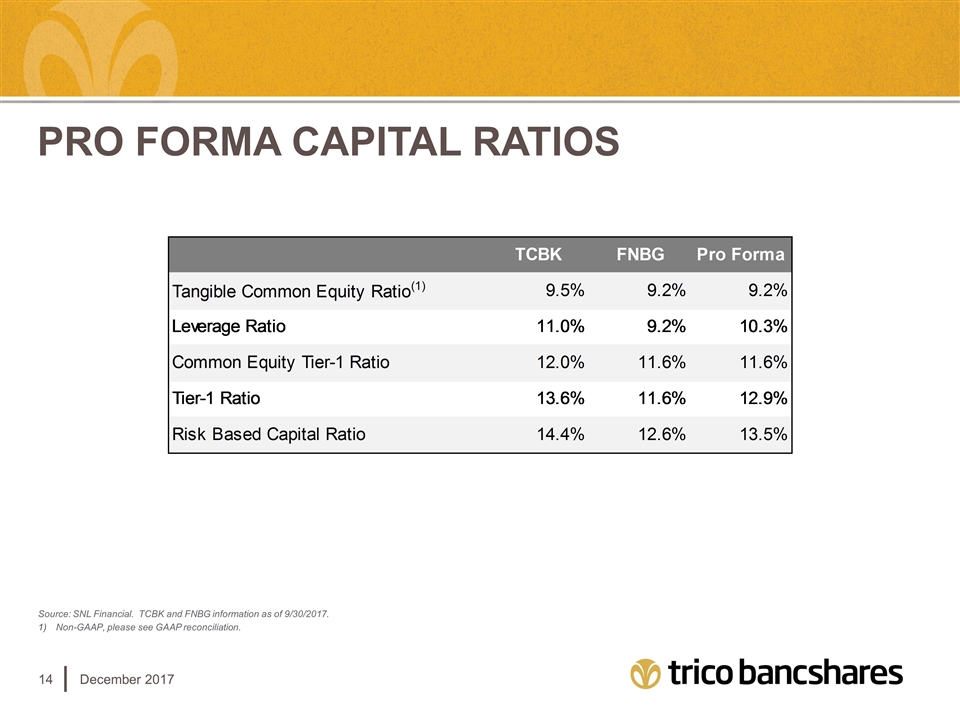
PRO FORMA CAPITAL RATIOS December 2017 Source: SNL Financial. TCBK and FNBG information as of 9/30/2017. Non-GAAP, please see GAAP reconciliation.
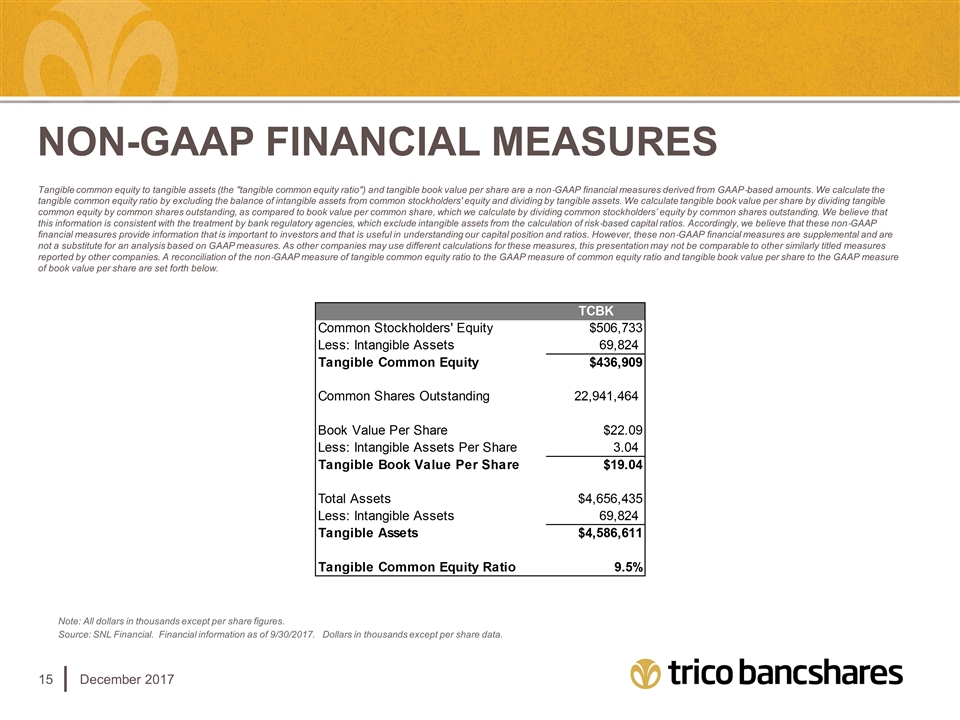
NON-GAAP FINANCIAL MEASURES December 2017 Tangible common equity to tangible assets (the "tangible common equity ratio") and tangible book value per share are a non‐GAAP financial measures derived from GAAP‐based amounts. We calculate the tangible common equity ratio by excluding the balance of intangible assets from common stockholders' equity and dividing by tangible assets. We calculate tangible book value per share by dividing tangible common equity by common shares outstanding, as compared to book value per common share, which we calculate by dividing common stockholders’ equity by common shares outstanding. We believe that this information is consistent with the treatment by bank regulatory agencies, which exclude intangible assets from the calculation of risk‐based capital ratios. Accordingly, we believe that these non‐GAAP financial measures provide information that is important to investors and that is useful in understanding our capital position and ratios. However, these non‐GAAP financial measures are supplemental and are not a substitute for an analysis based on GAAP measures. As other companies may use different calculations for these measures, this presentation may not be comparable to other similarly titled measures reported by other companies. A reconciliation of the non‐GAAP measure of tangible common equity ratio to the GAAP measure of common equity ratio and tangible book value per share to the GAAP measure of book value per share are set forth below. Note: All dollars in thousands except per share figures. Source: SNL Financial. Financial information as of 9/30/2017. Dollars in thousands except per share data.
