Attached files
| file | filename |
|---|---|
| EX-99.1 - PRESS RELEASE - B&S RATE INCREASE - CONNECTICUT WATER SERVICE INC / CT | exhibit991-bsrateincreasex.htm |
| EX-10.1 - RSU AGREEMENT - 2014 PSP - CONNECTICUT WATER SERVICE INC / CT | exhibit101-cwcrestrictedst.htm |
| 8-K - CTWS FORM 8-K 12-12-2017 - CONNECTICUT WATER SERVICE INC / CT | ctwsform8-k12122017.htm |

Connecticut Water Service, Inc.
NASDAQ: CTWS
3rd Annual Investor/Analyst Presentation
December 13, 2017
NASDAQ: CTWS www.ctwater.com 2
Forward-Looking Statements
Except for the historical statements and discussions, some statements contained in this
presentation constitute “forward-looking statements” within the meaning of Section 27A of the
Securities Act of 1933 and Section 21E of the Securities Exchange Act of 1934. These forward-
looking statements are based on current expectations and rely on a number of assumptions
concerning future events, and are subject to a number of uncertainties and other factors, many
of which are outside our control, that could cause actual results to differ materially from such
statements.
These forward-looking statements speak only as of the date of this presentation. Connecticut
Water does not assume any obligation to update or revise any forward-looking statement made
in this presentation or that may, from time to time, be made by or on behalf of the Company.
Neither this presentation nor any verbal communication shall constitute an invitation or
inducement to any person to subscribe for or otherwise acquire any Connecticut Water
securities.
For further information regarding risks and uncertainties associated with Connecticut Water’s
business, please refer to Connecticut Water’s annual, quarterly and periodic SEC filings which can
be found on the investor relations page of the Company’s website www.ctwater.com and at
www.sec.gov.
NASDAQ: CTWS www.ctwater.com 3
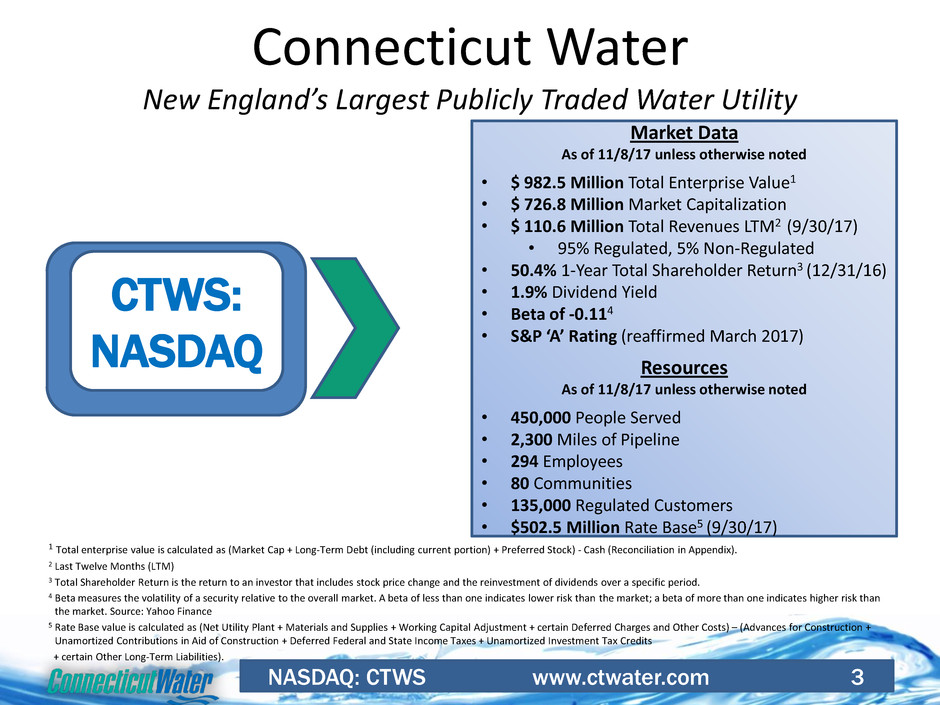
Connecticut Water
New England’s Largest Publicly Traded Water Utility
Market Data
As of 11/8/17 unless otherwise noted
• $ 982.5 Million Total Enterprise Value1
• $ 726.8 Million Market Capitalization
• $ 110.6 Million Total Revenues LTM2 (9/30/17)
• 95% Regulated, 5% Non-Regulated
• 50.4% 1-Year Total Shareholder Return3 (12/31/16)
• 1.9% Dividend Yield
• Beta of -0.114
• S&P ‘A’ Rating (reaffirmed March 2017)
Resources
As of 11/8/17 unless otherwise noted
• 450,000 People Served
• 2,300 Miles of Pipeline
• 294 Employees
• 80 Communities
• 135,000 Regulated Customers
• $502.5 Million Rate Base5 (9/30/17)
CTWS:
NASDAQ
1 Total enterprise value is calculated as (Market Cap + Long-Term Debt (including current portion) + Preferred Stock) - Cash (Reconciliation in Appendix).
2 Last Twelve Months (LTM)
3 Total Shareholder Return is the return to an investor that includes stock price change and the reinvestment of dividends over a specific period.
4 Beta measures the volatility of a security relative to the overall market. A beta of less than one indicates lower risk than the market; a beta of more than one indicates higher risk than
the market. Source: Yahoo Finance
5 Rate Base value is calculated as (Net Utility Plant + Materials and Supplies + Working Capital Adjustment + certain Deferred Charges and Other Costs) – (Advances for Construction +
Unamortized Contributions in Aid of Construction + Deferred Federal and State Income Taxes + Unamortized Investment Tax Credits
+ certain Other Long-Term Liabilities).

NASDAQ: CTWS www.ctwater.com 4
Connecticut Water Value Proposition
• Regionally focused, regulated water utilities (96% regulated earnings LTM as of 9/30/17)
• Maine acquisitions provide diversified, multi-state utility base and greater business scale
• Constructive regulatory environment with attractive investment recovery mechanisms
Diversified,
Regulated
Utility Business
Conservative growth strategy focused on utility infrastructure investment
Proven track record executing accretive acquisitions
Complementary, low-risk, non-regulated utility services business
Focus on maintaining a strong balance sheet and liquidity
“A” credit rating from S&P (as of March 2017)
Balanced approach to financing growth and prudent operating cost management
Consistently raised dividend payments for 48 consecutive years
High-quality, well-maintained asset system
Experienced management team with an average of 18 years utility experience
≥ 85% customer satisfaction distinction in each of the last 16 years
(GreatBlue – Independent Research Firm)
Low Risk,
Regulated
Growth Plan
Strong
Financial
Profile
Operational
Excellence

• CapEx investment in water utility infrastructure and
earning a return “of and on” that investment
• Constructive regulatory relations with state commissions
to align customer and shareholder interests
• Prudent acquisitions of other water systems
• Supplement regulated earnings with low risk, core water
utility services where a competitive advantage exists
Our Growth Strategy
NASDAQ: CTWS www.ctwater.com 5

NASDAQ: CTWS www.ctwater.com 6
Our Building Blocks
Environment Shareholders/Growth
Customers Employees
Passionate about stewardship and the value of water
Protect and manage water and watershed for
sustainability to serve current and future generations
Harness power of WRA to reduce carbon footprint
and resource consumption
Business is water service – not selling water
Reducing lost water in our systems is an executive
compensation metric
Leverage regulatory compact
Infrastructure investment and earning a return “of
and on” investment
Low risk, supplemental non-regulated earnings
Maintain constructive regulatory relationships
Deliver acquisitions that deliver shareholder value
Provide high-quality water
Responsive and courteous service
High level of community engagement
Deliver world-class service
Customer satisfaction is a compensation metric for all
employees
Passionate employees delivering a life sustaining
service
Values-based, team-oriented approach
Employee satisfaction is executive compensation
metric
Safe and secure workplace
Invest in education and leadership development for
our water professionals

NASDAQ: CTWS www.ctwater.com 7
Regulated Business
• 96% of net income attributable to regulated
operations (LTM as of 9/30/17)
• Core regulated subsidiaries:
– Connecticut Water Company (CWC)
– Maine Water Company (MWC)
– Heritage Village Water Company (HVWC)
– Avon Water Company (AWC)
• 135,000 utility customers (~90% residential)
• 2,300 miles of pipe
• 250 active wells / 25 surface water supplies
• Safe, dependable yield = 185 million gallons/day
• 80% safe yield from surface water supplies
• Rate Base $502.5MM as of 9/30/17
– $439.7MM in Connecticut
– $62.8MM in Maine
• 294 employees
Connecticut Presence
Maine Presence

NASDAQ: CTWS www.ctwater.com 8
Rockville Water Treatment Facility
• ‘Generational’ Investment in Rockville Water
Treatment Facility
– $35MM project replaced
1970 facility
– Capacity to meet current and
future needs
– State-of-the-art treatment
– Increased operational efficiency
and environmental benefits
• Designed mirroring LEED1 standards
• Energy and water efficient treatment
1 Leadership in Energy and Environmental Design

NASDAQ: CTWS www.ctwater.com 9
1 After tax return in Connecticut
Regulated Model Earnings Growth
CapEX Drives Earnings
Invest in Water Plant $120.00
Capitalize 50% with Debt $60.00
Capitalize 50% with Equity
(1 share of CTWS)
$60.00
9.75% 1 Regulatory Return on Equity
(per new share of CTWS)
$5.85
2016 Earnings per Share $2.12

NASDAQ: CTWS www.ctwater.com 10
Constructive Regulatory Environment
Connecticut Maine
Infrastructure Surcharge
Program
Single Tariff
Revenue Decoupling *
6-Month Rate Case
Streamlined Rate Case
* A water revenue adjustment mechanism law in Maine became available to regulated water utilities in Maine on October 15, 2015. Maine
Water is currently precluded from seeking new rates outside of the Biddeford and Saco division due to various agreements with the MPUC, but
is evaluating how and when this new mechanism can be implemented in the future.

NASDAQ: CTWS www.ctwater.com 11
CTWS Acquisition Track Record
Opportunity for Growth
• Industry pacing customer growth rate of more than 45%, primarily
through our Maine acquisitions
• 60+ total water system acquisitions in 25 years
– over 40 in the past 10 years
• Over 800 separate community water
systems and over 300 wastewater
operations in Connecticut and
Maine alone

NASDAQ: CTWS www.ctwater.com 12
Recently Completed Acquisitions
• Avon Water Company
– Closed on July 1, 2017
– $39.1MM enterprise value
– 4,800 water customers
– Leadership retained
(local – well respected)
• Heritage Village Water Company
– Closed on February 27, 2017
– $21.5MM enterprise value
– 4,700 water customers
– 3,000 wastewater customers

NASDAQ: CTWS www.ctwater.com 13
Maine Acquisitions
Aqua Maine
– Closed January 1, 2012
– $53.5MM enterprise value (100% cash consideration)
– 16,000 Maine customers
– Retained highly regarded local management team
• Biddeford and Saco Water Company
– Closed December 10, 2012
– $19.8MM enterprise value (stock-for-stock consideration)
– 15,500 Maine customers
– Merged into Maine Water in 2014
– November 2014 rate case settled through Stipulation Agreement in March 2015
• 76.5% of revenue increase requested was approved
– June 2017 rate application filed requesting $1.57MM revenue increase
• December 2017 decision approves $1.56MM revenue increase effective 12/1/17
• Rate Base of Maine acquisitions was $62.8MM as of 9/30/17

NASDAQ: CTWS www.ctwater.com 14
• Long-term water provider for UConn and
surrounding area
– Acquired ~300 off-campus customers
– Supplemental source of supply for
growing University
– 50 year agreement to supply UConn
– Enables Mansfield’s growth plans
• Pipeline construction completed and in service
• Locks in expanded service area
Territory Acquisition

NASDAQ: CTWS www.ctwater.com 15
Connecticut Water Service, Inc.
Committed to ESG and Sustainability
Social
Governance
Environmental
• A ‘Day of Service’ for employees launched
in 2016
• H2O Hardship Assistance Program serving
customers with financial challenges
• Active Employee Safety Committee
o CT Construction Industry Association
- Safety Award - 14 straight years
o Workplace Violence Prevention
Program
• Water Drop Watcher
Program, educating
> 1,000 school age
children about water
conservation and the
water cycle
• Partnering with Coastal
Mountain Land Trust to
preserve 1,400 acres and
create recreation
opportunities in Maine
• CT Fleet miles reduced
> 25% since 2008
• Since 2001 >1,000 acres
of Connecticut land
protected as open space
• Employees are keeping
our watersheds pristine
by removing tons of trash
from our watersheds
>1800 lbs. per effort
• All Employees participate in training on ethics,
conduct and cyber security
• CTWS Board of Directors recognized for
exceeding gender parity
• Transparency in executive and employee
compensation

NASDAQ: CTWS www.ctwater.com 16
2016 Corporate Sustainability Report
• Conducting our business
in a way that respects the
natural environment
• Values service to
customers, communities,
employees and
shareholders
• Available for viewing and
download at
http://ir.ctwater.com

FINANCIAL OVERVIEW

NASDAQ: CTWS www.ctwater.com 18
Financial Management
• Maintain continuing improvement to operating margin
• Balanced capital structure
• Use tools provided by legislation
– Maximize rate base in rates (WICA/WISC)
– Conservation adjustment
• Drive down borrowing costs

NASDAQ: CTWS www.ctwater.com 19
$3.4
$10.1
$13.2 $14.0 $13.4 $13.7
$21.4 $23.4 $21.0 $22.2 $23.0
$16.2
$18.7 $19.9
$27.6 $26.2
$22.9
$24.7
$32.7
$45.0
$47.8
$66.3
$55.41
$66.2
$0
$18
$36
$54
$72
2006 2007 2008 2009 2010 2011 2012 2013 2014 2015 2016 2017B 2018B
Infrastructure Investment Drives
Rate Base Growth
• Attractive, near-term
regulated growth
opportunities through
investment in core
infrastructure
• Strategy to balance
investment and rate recovery
time
Capital Expenditures / WICA & WISC Expenditures
($ in millions)
Annual WICA/WISC Total CapEx
10 Year
CAGR 15%
5 Year
CAGR 24%
2017 and 2018 are Budgeted
1 2017 does not include the Heritage Village Water
or Avon Water acquisitions

NASDAQ: CTWS www.ctwater.com 20
2018 Planned Capital Spending
2018 Planned Capital Spending
WICA/WISC
$23.0MM
Treatment
15.8MM
Non-WICA/WISC
Water Mains
$2.4MM
IT
$6.6MM Other
1
$11.8MM
Facilities
$2.6MM
1 Examples include: well development, dam replacement,
water tank replacements
• More than $225MM
of identified
infrastructure
investment (2018 –
2020)
• ‘Generational’ Spend
on Biddeford Water
Treatment Facility
– In service since 1884

NASDAQ: CTWS www.ctwater.com 21
Infrastructure Recovery Mechanisms
Connecticut (WICA) Maine (WISC)
Water Infrastructure and Conservation
Adjustment
1st used in 2009
Eligibility – Infrastructure replacement,
meters, hydrants, conservation
equipment
5% annual cap
10% maximum adjustment
$16.9MM expenditures in 2016
1.56% increase effective 10/1/17
Current cumulative surcharge 9.81%
Water Infrastructure Charge
1st used in 2014
Eligibility – Virtually all capital
investment
Annual Cap 6% to 10% depending on size
of water system
10% to 20% maximum adjustment
depending on size of water system
$4.1MM expenditures in 2016
Surcharge varies by water system
Average WISC is 6.97%

NASDAQ: CTWS www.ctwater.com 22
Repair Tax Facts - CTWS
• Adopted by CTWS
– In Connecticut for 2012
– In Maine for 2014
– Required “flow-through”
tax treatment in both states
• What it means
– Vast majority of annual investment in infrastructure
replacement is immediately deductible for tax purposes
– The same investment grows rate base as it always has

NASDAQ: CTWS www.ctwater.com 23
Repair Tax Facts - CTWS
• It is NOT temporary. Our annual commitment to
replacing 1% - 2% of our pipe will continue to generate
deductions that significantly lower or eliminate
annual tax expense. Single digit effective tax rate
expected to be the norm.
• Closes rate differential with municipalities
• Utility Operating Margin vastly improved
due to a lower portion of each dollar
collected required to support Operating
Costs

NASDAQ: CTWS www.ctwater.com 24
Utility Operating Margin
Efficiency Measure
22.5% 22.8% 22.0% 22.0%
23.6%
24.4%
25.0%
27.7%
28.6%
29.3%
5%
10%
15%
20%
25%
30%
2007 2008 2009 2010 2011 2012 2013 2014 2015 2016
Utility Operating Income as a percentage of Operating Revenue

NASDAQ: CTWS www.ctwater.com 25
High Quality Earnings
$11.3
$13.6
$18.2
$21.3
$22.8
$23.4 $23.9
$10
$15
$20
$25
2011 2012 2013 2014 2015 2016 LTM
Net Income
$1.31
$1.55
$1.68
$1.95
$2.07 $2.12 $2.10
$1.25
$1.50
$1.75
$2.00
$2.25
2011 2012 2013 2014 2015 2016 LTM
Earnings Per Share
(in millions)
5 Year
CAGR 16%
5 Year
CAGR 10%
1 Last twelve months as of 9/30/17
1
1
NASDAQ: CTWS www.ctwater.com 26
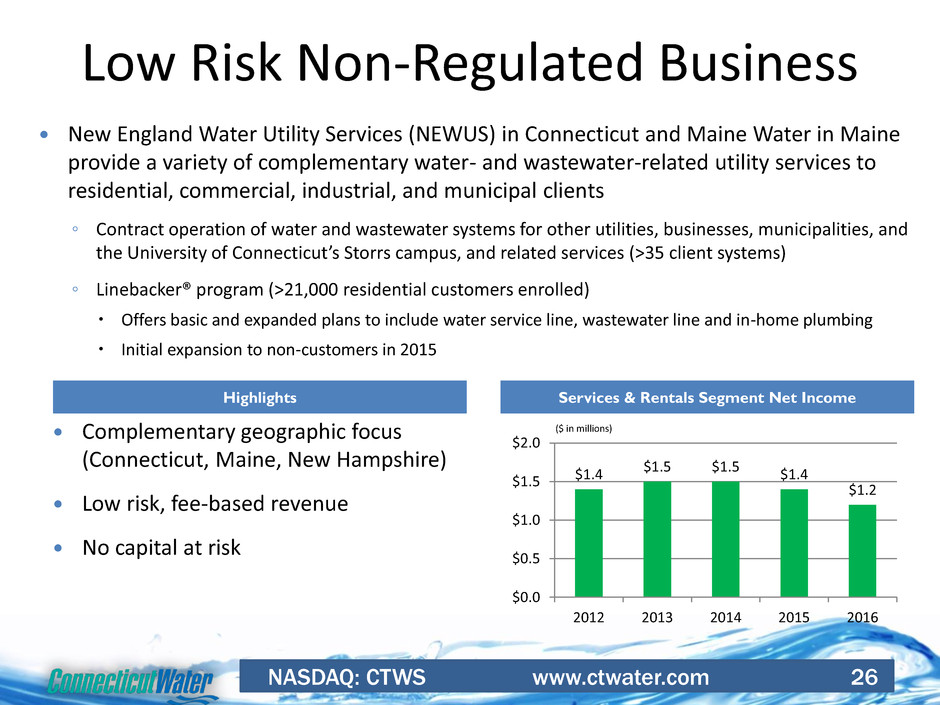
New England Water Utility Services (NEWUS) in Connecticut and Maine Water in Maine
provide a variety of complementary water- and wastewater-related utility services to
residential, commercial, industrial, and municipal clients
◦ Contract operation of water and wastewater systems for other utilities, businesses, municipalities, and
the University of Connecticut’s Storrs campus, and related services (>35 client systems)
◦ Linebacker® program (>21,000 residential customers enrolled)
Offers basic and expanded plans to include water service line, wastewater line and in-home plumbing
Initial expansion to non-customers in 2015
Low Risk Non-Regulated Business
Services & Rentals Segment Net Income
($ in millions)
Highlights
Complementary geographic focus
(Connecticut, Maine, New Hampshire)
Low risk, fee-based revenue
No capital at risk
$1.4 $1.5 $1.5 $1.4
$1.2
$0.0
$0.5
$1.0
$1.5
$2.0
2012 2013 2014 2015 2016
NASDAQ: CTWS www.ctwater.com 27
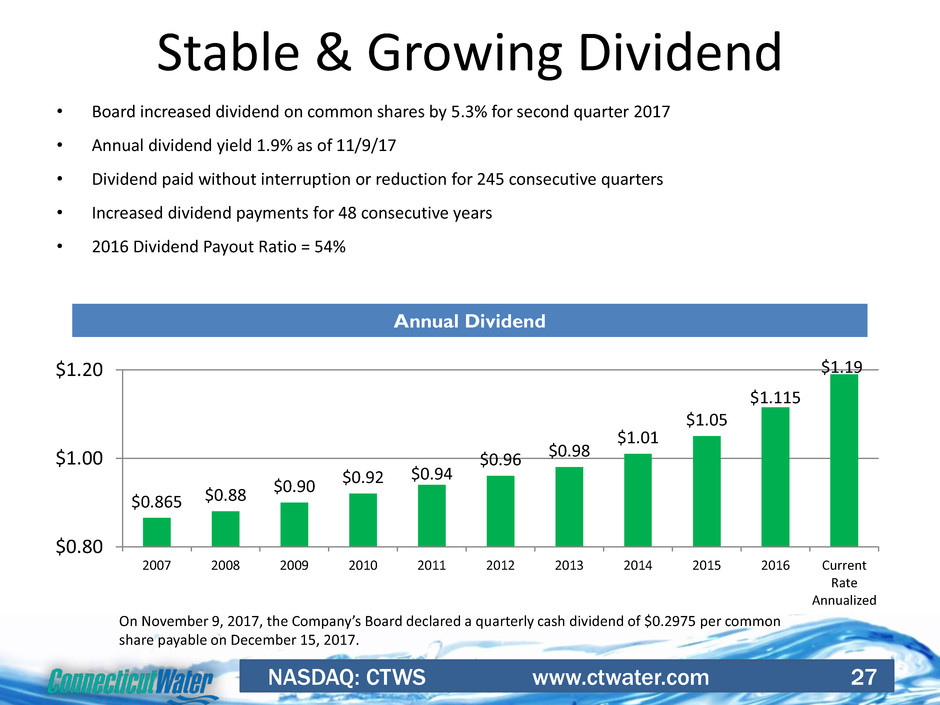
Stable & Growing Dividend
• Board increased dividend on common shares by 5.3% for second quarter 2017
• Annual dividend yield 1.9% as of 11/9/17
• Dividend paid without interruption or reduction for 245 consecutive quarters
• Increased dividend payments for 48 consecutive years
• 2016 Dividend Payout Ratio = 54%
Annual Dividend
$0.865 $0.88
$0.90 $0.92
$0.94
$0.96 $0.98
$1.01
$1.05
$1.115
$1.19
$0.80
$1.00
$1.20
2007 2008 2009 2010 2011 2012 2013 2014 2015 2016 Current
Rate
Annualized
On November 9, 2017, the Company’s Board declared a quarterly cash dividend of $0.2975 per common
share payable on December 15, 2017.

NASDAQ: CTWS www.ctwater.com 28
Performance
18.6%
25.8%
18.6%
0%
10%
20%
30%
1 year 3 year 5 year
Average Annual 1, 3 & 5-Year
Total Shareholder Return @ 11/30/17

NASDAQ: CTWS www.ctwater.com 29
Water, the basic ingredient of Life…

NASDAQ: CTWS www.ctwater.com 31
Our Vision… Serving Our Customers,
Shareholders and Employees at World
Class Levels
Appendix

NASDAQ: CTWS www.ctwater.com 32
Selected Financial Data
Nine Months Ended September 30, 2017
(In thousands except per share amounts)
Operating Revenues $82,162
Other Water Activities Revenues 1,096
Real Estate Revenues 212
Service and Rentals Revenues 3,745
Total Revenues $87,215
Operating Expenses $54,279
Other Utility Income, Net of Taxes $619
Total Utility Operating Income $28,502
Gain on Property Transactions, Net of Taxes $33
Non-Water Sales Earnings (Services and Rentals), Net of Taxes $842
Net Income $23,202
Net Income Applicable to Common Shareholders $23,173
Basic Earnings Per Average Common Share $2.03
Diluted Earnings Per Average Common Share $1.99
Basic Weighted Average Common Shares Outstanding 11,436
Diluted Weighted Average Common Shares Outstanding 11,661
Book Value Per Share $24.39

NASDAQ: CTWS www.ctwater.com 33
Condensed Balance Sheet
As of September 30, 2017
(In thousands)
ASSETS
Net Utility Plant $683,738
Current Assets 47,149
Other Assets 208,489
Total Assets $939,376
CAPITALIZATION AND LIABILITIES
Shareholders’ Equity $294,405
Preferred Stock 772
Long-Term Debt 255,193
Current Liabilities 39,835
Other Liabilities and Deferred Credits 349,171
Total Capitalization and Liabilities $939,376

NASDAQ: CTWS www.ctwater.com 34
Reconciliation of Enterprise Value
Market Capitalization 11/8/17 (Nasdaq) $726,819,000
+ Long-Term Debt (CTWS Form 10-Q filed (11/8/17) 255,193,000
+ Current Portion of Long-Term Debt (CTWS Form 10-Q filed 11/8/17) 7,950,000
+ Preferred Stock (CTWS Form 10-Q filed 11/8/17) 772,000
- Cash/Cash Equivalents (CTWS Form 10-Q filed 11/8/17) - 8,274,000
Enterprise Value $982,460,000
Connecticut Water’s annual, quarterly and periodic SEC filings which can be found on the investor
relations page of the Company’s website www.ctwater.com and at www.sec.gov under ticker
symbol CTWS
NASDAQ: CTWS www.ctwater.com 35
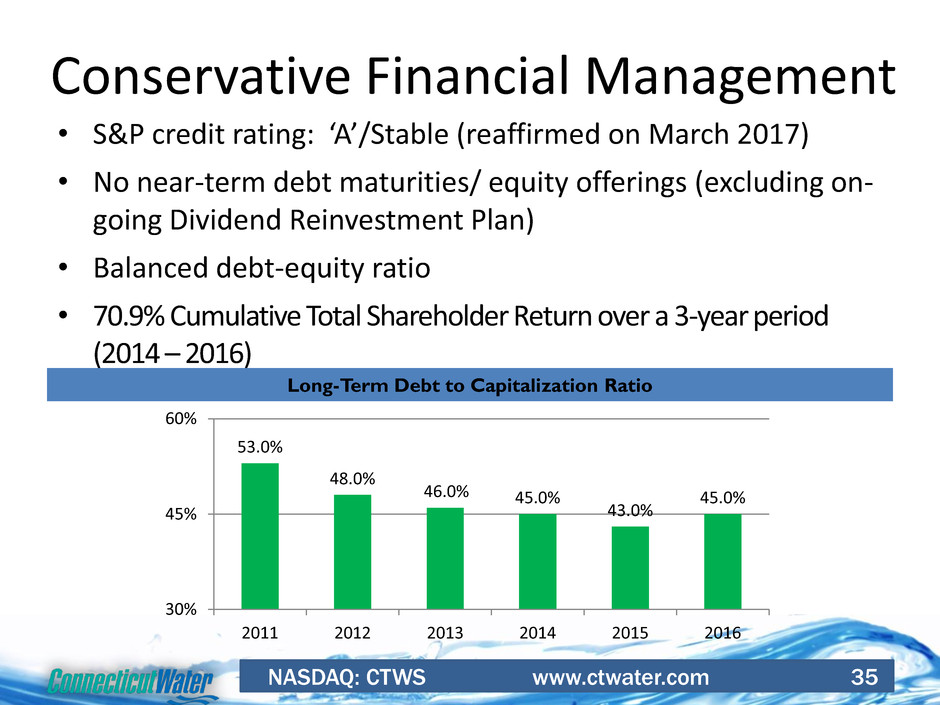
Conservative Financial Management
• S&P credit rating: ‘A’/Stable (reaffirmed on March 2017)
• No near-term debt maturities/ equity offerings (excluding on-
going Dividend Reinvestment Plan)
• Balanced debt-equity ratio
• 70.9% Cumulative Total Shareholder Return over a 3-year period
(2014 – 2016)
Long-Term Debt to Capitalization Ratio
53.0%
48.0%
46.0% 45.0%
43.0%
45.0%
30%
45%
60%
2011 2012 2013 2014 2015 2016

NASDAQ: CTWS www.ctwater.com 36
CTWS Creates Shareholder Value
Strong Core Business plus
Best-in-Class Tools for Success
Strong Predictable Revenue
(WRA)
Minimal Regulatory Lag
(WICA, WISC)
Effective Expense Management

NASDAQ: CTWS www.ctwater.com 37
• National Management Innovation Award for Customer
Protection Program
– Protects customers from utility worker imposters
• Invest and maintain infrastructure to deliver high-quality
water and reliable service
• Assistance Programs for low income/hardship
• Responsive and Courteous Service
• Leverage technology to drive
convenience and efficiency
• Customer Satisfaction!
– World-Class 16 straight years
Customer Strategy
NASDAQ: CTWS www.ctwater.com 38
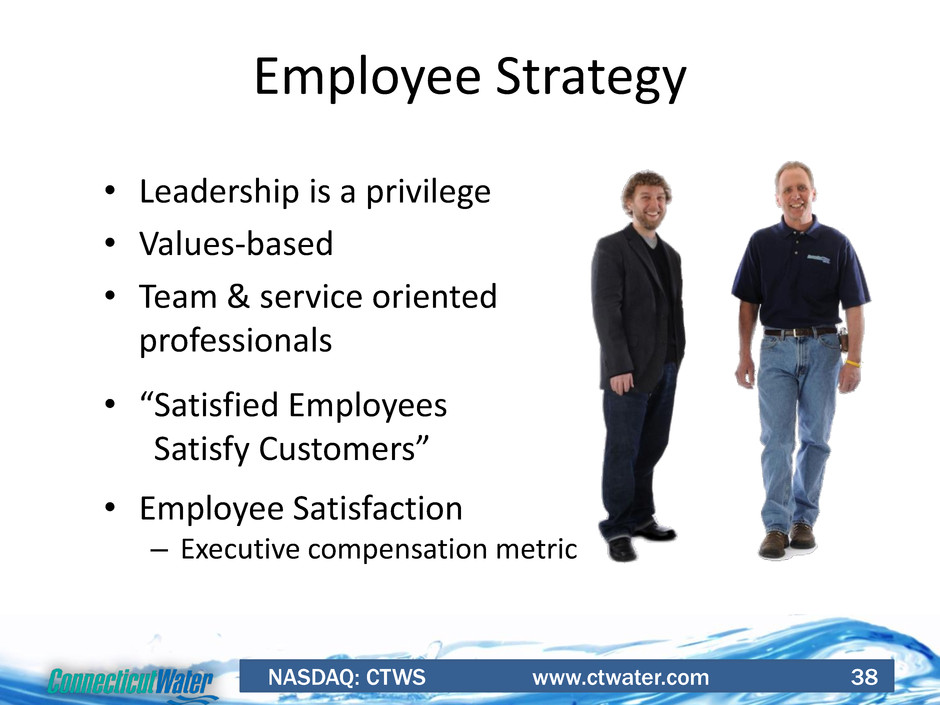
• Leadership is a privilege
• Values-based
• Team & service oriented
professionals
• “Satisfied Employees
Satisfy Customers”
• Employee Satisfaction
– Executive compensation metric
Employee Strategy

NASDAQ: CTWS www.ctwater.com 39
Environmental Strategy
• Leverage CT’s Water Revenue
Adjustment (WRA) to promote water
conservation
• Donate/sell unneeded land as
protected open space
• Replace aging pipe, valves and pumps
to conserve natural resources
• Aggressively manage energy usage
• Invest in and protect watershed lands

NASDAQ: CTWS www.ctwater.com 40
Repair Tax Facts - CTWS
• Cash flow improvement allows for increased capital
investment with less reliance on financing
• We are replacing Operating Expense
with Capital Expense (Virtually tripling
from 2011 to 2016)
• Customers and Regulators will
realize the benefits in the form of
manageable increases despite level
of capital investment

NASDAQ: CTWS www.ctwater.com 41
6-month regulatory timeline
Water Infrastructure and
Conservation Adjustment (WICA)
Expanded in 2013
Water Revenue Adjustment enacted
in 2013
Single Tariff
Allowed ROE: 9.75% to 10.1%
Constructive Regulatory Environments
Streamlined rate approach
Virtually all cases “Settled”
Water Infrastructure Surcharge
(WISC)
Nearly all plant eligible
Water Revenue Adjustment enacted
in 20151
Allowed ROE = 9.5% to 10%
CT Public Utilities Regulatory Authority ME Public Utilities Commission
1 A water revenue adjustment law in Maine became effective October 15, 2015. With rate stay outs in most of its regulatory divisions as part of the
repair tax dockets, Maine Water is now evaluating how and when this new mechanism can be implemented.
J. Betkoski, PURA Vice Chair, „NARUC‟
Water Committee
M. Vannoy, MPUC Chair, „NARUC‟
Water Committee
