Attached files
| file | filename |
|---|---|
| 8-K - 8-K - STATE BANK FINANCIAL CORP | stbz-20171211x8k.htm |

State Bank Financial Corporation
Investor Presentation
December 2017

2
Cautionary Note Regarding Forward-Looking
Statements
This presentation contains forward-looking statements within the meaning of the federal securities laws. These forward-looking statements, which are based on certain
assumptions and describe our future plans, strategies, and expectations, can generally be identified by the use of the words “will,” “expect,” “should,” “anticipate,” “forward
vision,” “may,” “opportunity,” “assume,” and “project,” as well as similar expressions. These forward-looking statements include, but are not limited to, statements regarding
our focus on improving efficiency, the expected future impact of the AloStar Bank of Commerce (“AloStar”) acquisition, including expected cost savings and the timing thereof,
our ability to achieve our target burden and target efficiency ratios, and other statements about expected developments or events, our future financial performance, and the
execution of our strategic goals including our ability to execute on growth opportunities in our markets. Forward-looking statements are not guarantees of future performance
and are subject to risks, uncertainties and assumptions (“risk factors”) that are difficult to predict with regard to timing, extent, likelihood and degree. Therefore, actual results
and outcomes may materially differ from what may be expressed or forecasted in such forward-looking statements. We undertake no obligation to update, amend or clarify
forward-looking statements, whether as a result of new information, future events or otherwise. Risk factors include, without limitation, the following:
• negative reactions to our recent or future acquisitions of each bank’s customers, employees, and counterparties or difficulties related to the transition of services;
• the integration of AloStar’s business into ours and the conversion of AloStar’s operating systems and procedures may take longer than anticipated or may be more costly than
anticipated or have unanticipated adverse results related to AloStar’s or our existing businesses;
• the transaction with AloStar may be more expensive to complete and the anticipated benefits, including anticipated cost savings and strategic gains, may be significantly
harder or take longer than expected or may not be achieved in the entirety or at all as a result of unexpected factors or events;
• our ability to achieve anticipated results from the transactions with AloStar, NBG Bancorp, and S Bankshares will depend on the state of the economic and financial markets
going forward;
• economic conditions (both generally and in our markets) may be less favorable than expected, which could result in, among other things, a deterioration in credit quality, a
reduction in demand for credit and a decline in real estate values;
• a general decline in the real estate and lending markets, particularly in our market areas, could negatively affect our financial results;
• risk associated with income taxes including the potential for adverse adjustments and the inability to fully realize deferred tax benefits;
• increased cybersecurity risk, including potential network breaches, business disruptions, or financial losses;
• restrictions or conditions imposed by our regulators on our operations may make it more difficult for us to achieve our goals;
• legislative or regulatory changes, including changes in accounting standards and compliance requirements, may adversely affect us;
• competitive pressures among depository and other financial institutions may increase significantly;
• changes in the interest rate environment may reduce margins or the volumes or values of the loans we make or have acquired;
• other financial institutions have greater financial resources and may be able to develop or acquire products that enable them to compete more successfully than we can;
• our ability to attract and retain key personnel can be affected by the increased competition for experienced employees in the banking industry;
• adverse changes may occur in the bond and equity markets;
• war or terrorist activities may cause deterioration in the economy or cause instability in credit markets; and
• economic, governmental, or other factors may prevent the projected population, residential, and commercial growth in the markets in which we operate.
In addition, risk factors include, but are not limited to, the risk factors described in Item 1A, Risk Factors, in our Annual Report on Form 10-K for the most recently ended fiscal
year. These and other risk factors are representative of the risk factors that may emerge and could cause a difference between an ultimate actual outcome and a forward-
looking statement.

3
Headquartered in Atlanta, Georgia
State Bank operates 32 full-service banking
offices and 6 mortgage origination offices in 7 of
the 8 largest MSAs in Georgia
Completed merger with AloStar Bank of
Commerce on September 30, 2017
AloStar adds scalable asset-generating
lines of business and loan portfolio
diversification while efficiently leveraging
excess capital
Atlanta
Macon
Warner
Robins
Augusta
Savannah
Athens
Gainesville
State Bank Financial Corporation Profile
Source: SNL Financial
Note: Financial metrics as of 9/30/17; dividend yield and market cap as of 11/14/17
STBZ Profile
Total Assets $5.1 billion TCE Ratio 10.8%
Total Loans $3.6 billion Cost of Funds .38%
Total Deposits $4.2 billion Dividend Yield 1.97%
Total Equity $643 million Market Cap $1.1 billion
Key Metrics
4
Investment Thesis
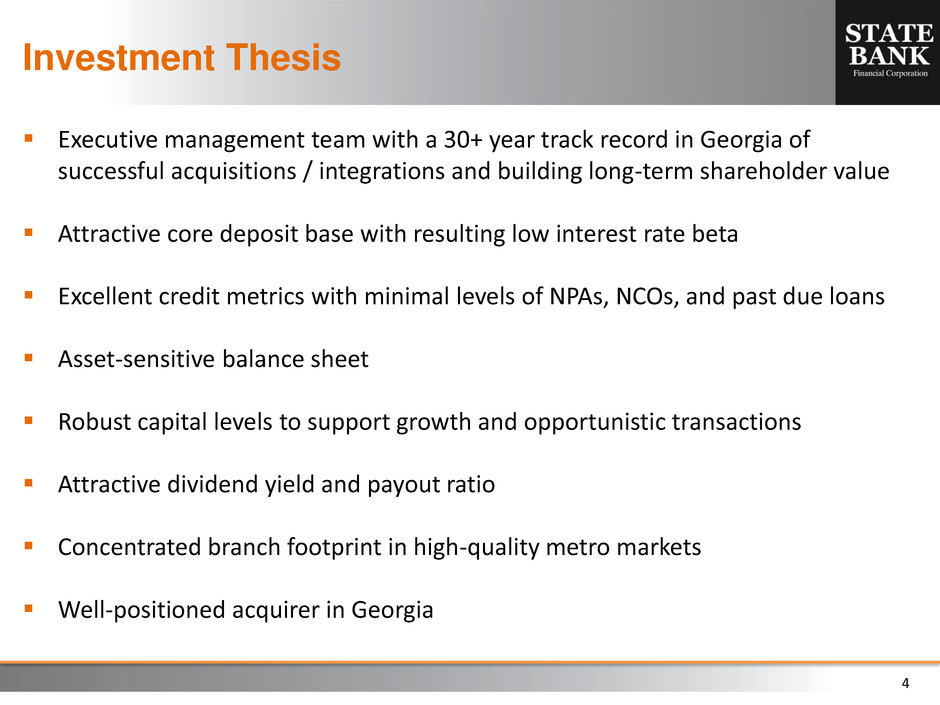
Executive management team with a 30+ year track record in Georgia of
successful acquisitions / integrations and building long-term shareholder value
Attractive core deposit base with resulting low interest rate beta
Excellent credit metrics with minimal levels of NPAs, NCOs, and past due loans
Asset-sensitive balance sheet
Robust capital levels to support growth and opportunistic transactions
Attractive dividend yield and payout ratio
Concentrated branch footprint in high-quality metro markets
Well-positioned acquirer in Georgia
5
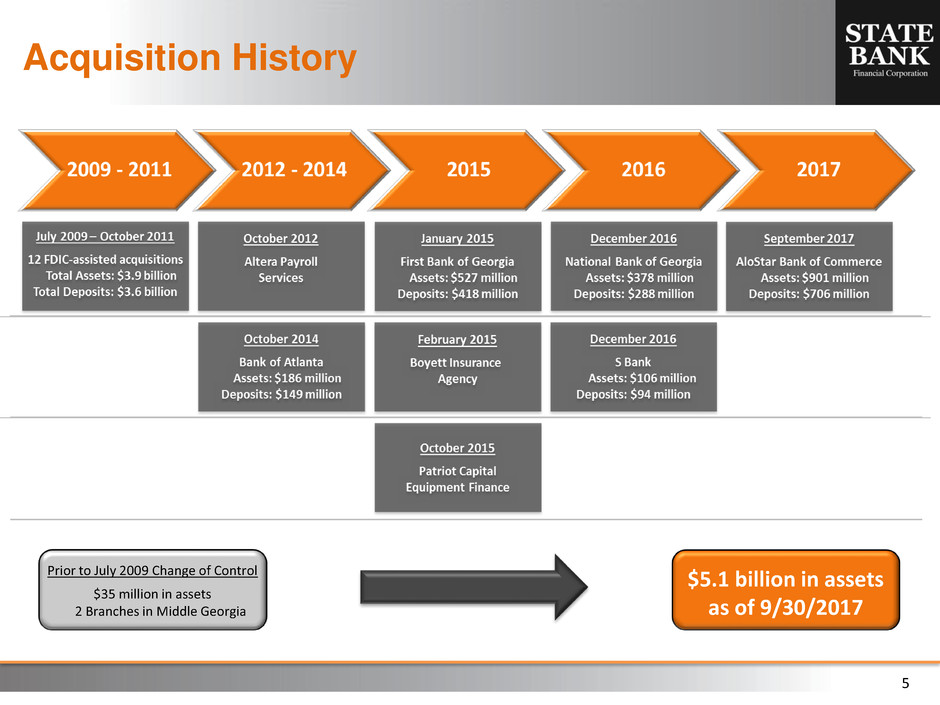
Acquisition History
Prior to July 2009 Change of Control
$35 million in assets
2 Branches in Middle Georgia
$5.1 billion in assets
as of 9/30/2017
6
Strategic Rationale for AloStar Transaction
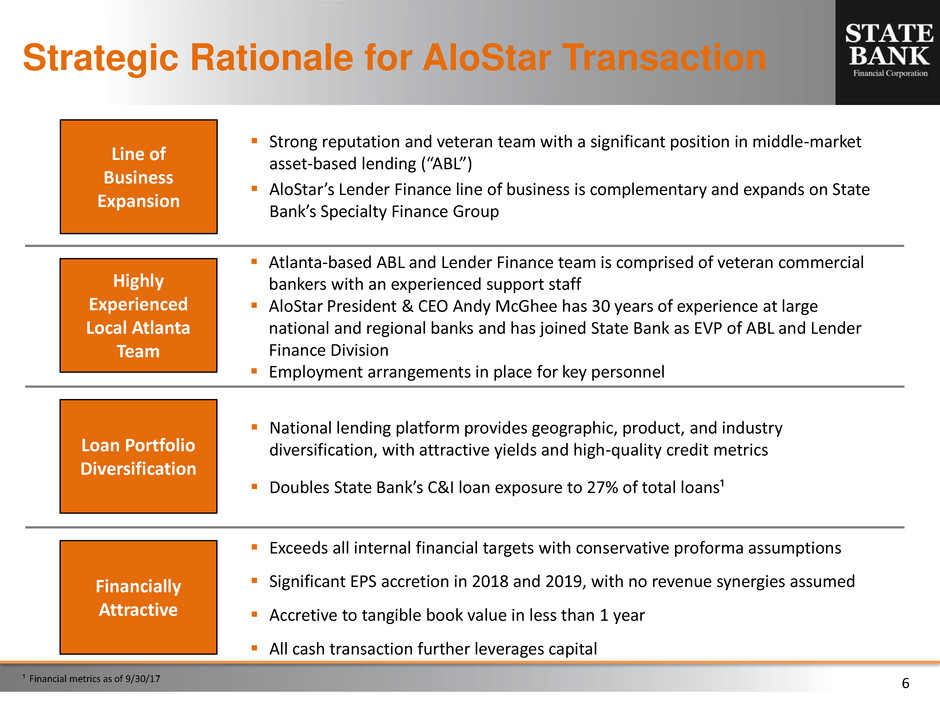
Financially
Attractive
Highly
Experienced
Local Atlanta
Team
Exceeds all internal financial targets with conservative proforma assumptions
Significant EPS accretion in 2018 and 2019, with no revenue synergies assumed
Accretive to tangible book value in less than 1 year
All cash transaction further leverages capital
Atlanta-based ABL and Lender Finance team is comprised of veteran commercial
bankers with an experienced support staff
AloStar President & CEO Andy McGhee has 30 years of experience at large
national and regional banks and has joined State Bank as EVP of ABL and Lender
Finance Division
Employment arrangements in place for key personnel
Line of
Business
Expansion
Strong reputation and veteran team with a significant position in middle-market
asset-based lending (“ABL”)
AloStar’s Lender Finance line of business is complementary and expands on State
Bank’s Specialty Finance Group
Loan Portfolio
Diversification
National lending platform provides geographic, product, and industry
diversification, with attractive yields and high-quality credit metrics
Doubles State Bank’s C&I loan exposure to 27% of total loans¹
¹ Financial metrics as of 9/30/17

7
Strong Core Deposit Base with
Significant Opportunity for Growth
1 Region represents individual or combined MSAs; Savannah region includes Savannah and Hinesville MSAs and Tattnall County, GA 2 Excludes new branch opened on December 4, 2017
Atlanta – less than 1% market share of $163 billion in deposits; over 75% of the market is
dominated by large regional and national competitors
Savannah – new market where State Bank executive management has significant in-market
experience
Significant
Growth
Opportunities
Leading
Market Share
Top 10
Market Share
Augusta – remain well-positioned to take advantage of recent market disruption
Athens / Gainesville – strong local leadership team; opportunity to leverage State Bank’s
existing treasury and payroll capabilities in these new markets
Macon / Warner Robins – mature franchise with #1 market share since 2005 (including
predecessor bank)
2
Source: SNL Financial; FDIC deposit data as of June 30, 2017
3 Acquired in our acquisition of AloStar Bank of Commerce on September 30, 2017. Deposit data reflects deposits held by AloStar as of June 30,2017
($ in 000)
Region1 Deposits
% of
Deposits
Deposits /
Branch
# of Full
Service
Branches
Market
Share Deposits
Deposits /
Branch
Atlanta $1,271,128 30% $211,855 6 0.8% $163,045,564 $135,532
M c n / Warner Robins 1,356,873 32% 113,073 12 25.3% 5,370,409 59,671
Augusta 452,256 11% 64,608 7 5.5% 8,288,294 67,385
Athens / Gainesville 345,229 8% 172,615 2 4.2% 8,123,418 84,619
Savannah 88,574 2% 22,144 4 1.1% 7,978,201 68,778
Al Star 703,912 17% 703,912 N/A N/A N/A N/A
STBZ Total Region
3

8
Grow Commercial
Relationships by Targeting
Net Funding Segments
Provide Best In-Class Client
Experience
Scale Efficient Asset-
Generating Lines of
Business
Foster a Culture of
Efficiency
Maintain Focus on
Noninterest Income
Strategic Outlook
Management Depth
Disciplined and
Experienced Acquirer
Balance Sheet Strength
Strong Credit Quality
Metrics
Shareholder Focused
Management Team with
Significant Insider
Ownership
Solid Foundation Built on
Proven Performance
Forward Vision
9
Diversified Lines of Business
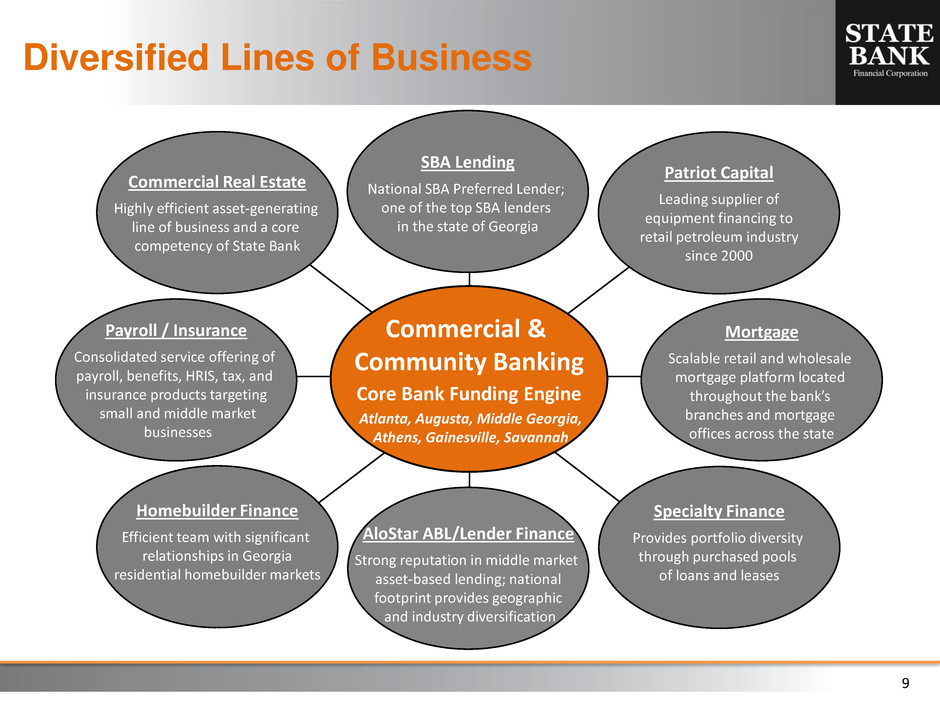
Mortgage
Scalable retail and wholesale
mortgage platform located
throughout the bank’s
branches and mortgage
offices across the state
Patriot Capital
Leading supplier of
equipment financing to
retail petroleum industry
since 2000
SBA Lending
National SBA Preferred Lender;
one of the top SBA lenders
in the state of Georgia
Specialty Finance
Provides portfolio diversity
through purchased pools
of loans and leases
Payroll / Insurance
Consolidated service offering of
payroll, benefits, HRIS, tax, and
insurance products targeting
small and middle market
businesses
Commercial Real Estate
Highly efficient asset-generating
line of business and a core
competency of State Bank
Homebuilder Finance
Efficient team with significant
relationships in Georgia
residential homebuilder markets
Commercial &
Community Banking
Core Bank Funding Engine
Atlanta, Augusta, Middle Georgia,
Athens, Gainesville, Savannah
AloStar ABL/Lender Finance
Strong reputation in middle market
asset-based lending; national
footprint provides geographic
and industry diversification

10
3Q 2017 Financial Results
11
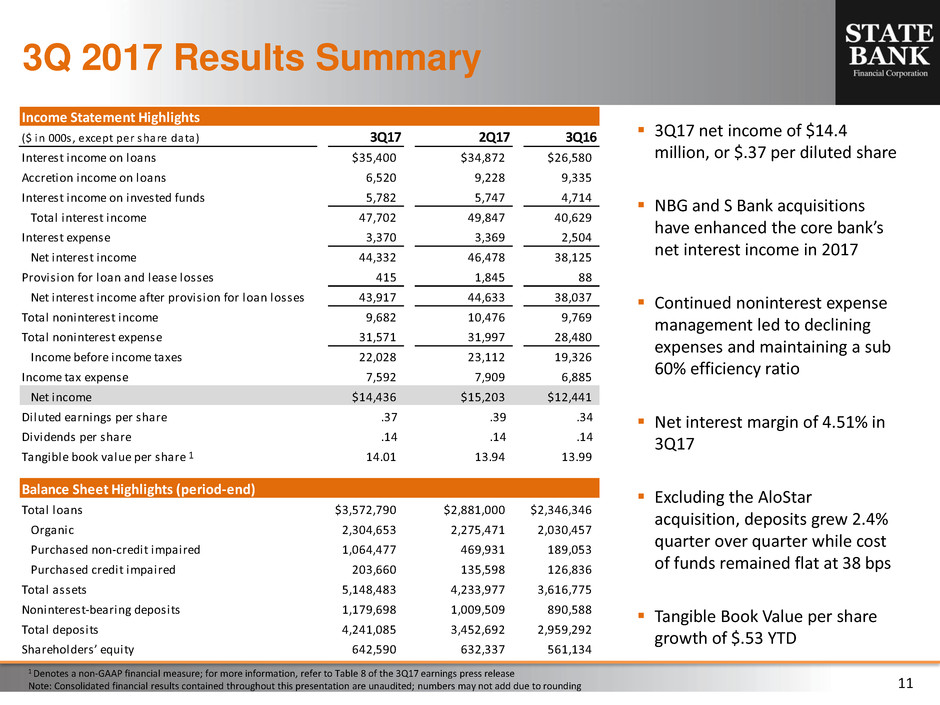
Income Statement Highlights
($ in 000s , except per share data) 3Q17 2Q17 3Q16
Interest income on loans $35,400 $34,872 $26,580
Accretion income on loans 6,520 9,228 9,335
Interest income on invested funds 5,782 5,747 4,714
Total interest income 47,702 49,847 40,629
Interest expense 3,370 3,369 2,504
Net interest income 44,332 46,478 38,125
Provision for loan and lease losses 415 1,845 88
Net interest income after provision for loan losses 43,917 44,633 38,037
Total noninterest income 9,682 10,476 9,769
Total noninterest expense 31,571 31,997 28,480
Income before income taxes 22,028 23,112 19,326
Income tax expense 7,592 7,909 6,885
Net income $14,436 $15,203 $12,441
Diluted earnings per share .37 .39 .34
Dividends per share .14 .14 .14
Tangible book value per share 14.01 13.94 13.99
Balance Sheet Highlights (period-end)
Total loans $3,572,790 $2,881,000 $2,346,346
Organic 2,304,653 2,275,471 2,030,457
Purchased non-credit impaired 1,064,477 469,931 189,053
Purchased credit impaired 203,660 135,598 126,836
Total assets 5,148,483 4,233,977 3,616,775
Noninterest-bearing deposits 1,179,698 1,009,509 890,588
Total deposits 4,241,085 3,452,692 2,959,292
Shareholders’ equity 642,590 632,337 561,134
3Q 2017 Results Summary
1 Denotes a non-GAAP financial measure; for more information, refer to Table 8 of the 3Q17 earnings press release
Note: Consolidated financial results contained throughout this presentation are unaudited; numbers may not add due to rounding
3Q17 net income of $14.4
million, or $.37 per diluted share
NBG and S Bank acquisitions
have enhanced the core bank’s
net interest income in 2017
Continued noninterest expense
management led to declining
expenses and maintaining a sub
60% efficiency ratio
Net interest margin of 4.51% in
3Q17
Excluding the AloStar
acquisition, deposits grew 2.4%
quarter over quarter while cost
of funds remained flat at 38 bps
Tangible Book Value per share
growth of $.53 YTD
1
12
Revenue Trends – Interest Income
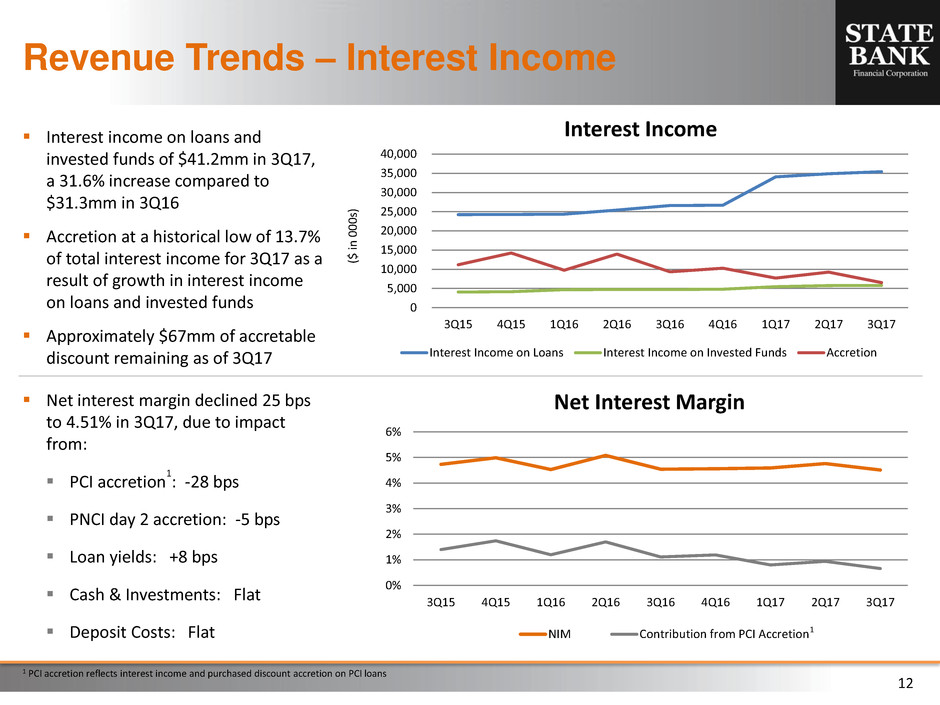
Interest income on loans and
invested funds of $41.2mm in 3Q17,
a 31.6% increase compared to
$31.3mm in 3Q16
Accretion at a historical low of 13.7%
of total interest income for 3Q17 as a
result of growth in interest income
on loans and invested funds
Approximately $67mm of accretable
discount remaining as of 3Q17
($ i
n
000
s)
Net interest margin declined 25 bps
to 4.51% in 3Q17, due to impact
from:
PCI accretion
1
: -28 bps
PNCI day 2 accretion: -5 bps
Loan yields: +8 bps
Cash & Investments: Flat
Deposit Costs: Flat 1
1 PCI accretion reflects interest income and purchased discount accretion on PCI loans
0
5,000
10,000
15,000
20,000
25,000
30,000
35,000
40,000
3Q15 4Q15 1Q16 2Q16 3Q16 4Q16 1Q17 2Q17 3Q17
Interest Income
Interest Income on Loans Interest Income on Invested Funds Accretion
0%
1%
2%
3%
4%
5%
6%
3Q15 4Q15 1Q16 2Q16 3Q16 4Q16 1Q17 2Q17 3Q17
Net Interest Margin
NIM Contribution from PCI Accretion
13
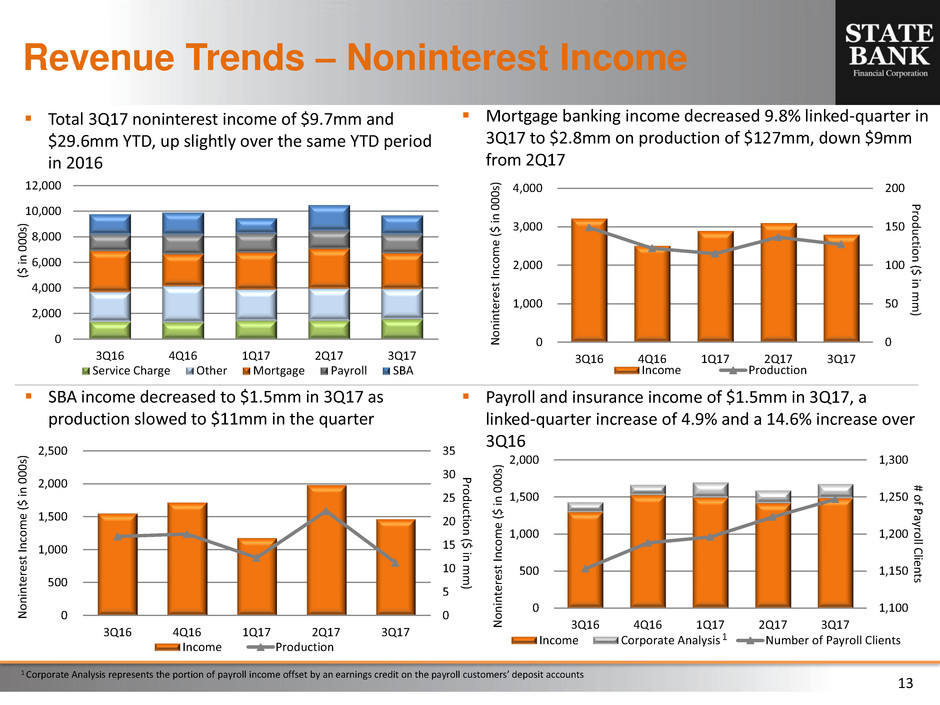
SBA income decreased to $1.5mm in 3Q17 as
production slowed to $11mm in the quarter
Payroll and insurance income of $1.5mm in 3Q17, a
linked-quarter increase of 4.9% and a 14.6% increase over
3Q16
Revenue Trends – Noninterest Income
Mortgage banking income decreased 9.8% linked-quarter in
3Q17 to $2.8mm on production of $127mm, down $9mm
from 2Q17
Total 3Q17 noninterest income of $9.7mm and
$29.6mm YTD, up slightly over the same YTD period
in 2016
($ i
n
000
s)
0
2,000
4,000
6,000
8,000
10,000
12,000
3Q16 4Q16 1Q17 2Q17 3Q17
Service Charge Other Mortgage Payroll SBA
0
50
100
150
200
0
1,000
2,000
3,000
4,000
3Q16 4Q16 1Q17 2Q17 3Q17
Pr
o
d
u
cti
o
n
($
in
m
m
)
N
o
n
in
ter
es
t
In
com
e
($ i
n
000
s)
Income Production
0
5
10
15
20
25
30
35
0
500
1,000
1,500
2,000
2,500
3Q16 4Q16 1Q17 2Q17 3Q17
Pr
o
d
u
cti
o
n
($
in
m
m
)
N
o
n
in
ter
es
t
In
com
e
($ i
n
000
s)
Income Production
1,100
1,150
1,200
1,250
1,300
0
500
1,000
1,500
2,000
3Q16 4Q16 1Q17 2Q17 3Q17
# o
f P
ayro
ll C
lien
ts
N
o
n
in
ter
es
t
In
com
e
($ i
n
000
s)
Income Corporate Analysis Number of Payroll Clients1
1 Corporate Analysis represents the portion of payroll income offset by an earnings credit on the payroll customers’ deposit accounts
14
Focused on Improving Efficiency
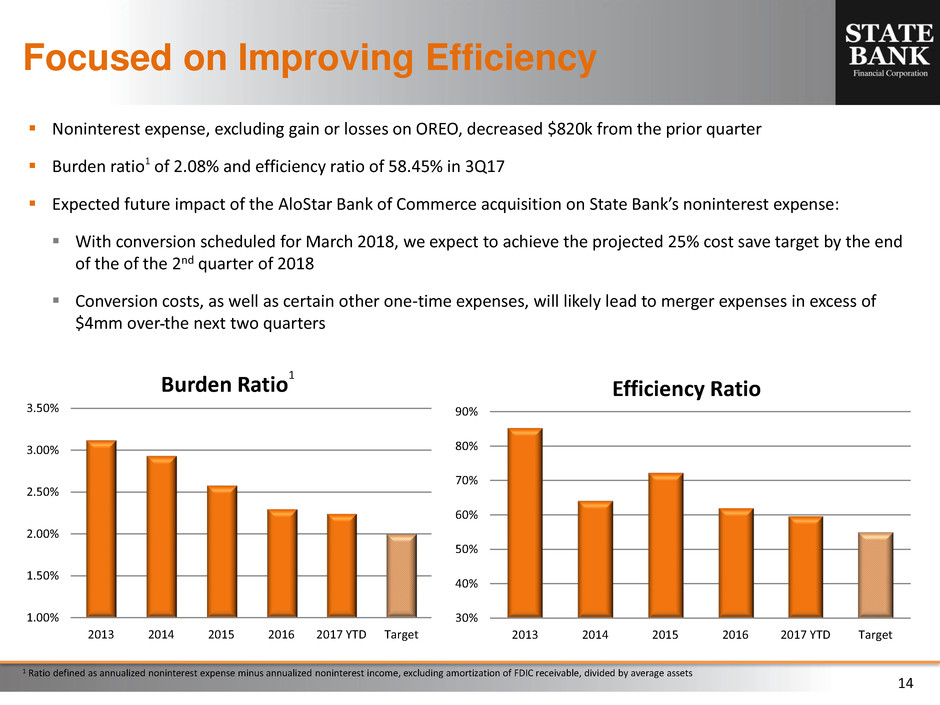
Noninterest expense, excluding gain or losses on OREO, decreased $820k from the prior quarter
Burden ratio1 of 2.08% and efficiency ratio of 58.45% in 3Q17
Expected future impact of the AloStar Bank of Commerce acquisition on State Bank’s noninterest expense:
With conversion scheduled for March 2018, we expect to achieve the projected 25% cost save target by the end
of the of the 2nd quarter of 2018
Conversion costs, as well as certain other one-time expenses, will likely lead to merger expenses in excess of
$4mm over the next two quarters
1 Ratio defined as annualized noninterest expense minus annualized noninterest income, excluding amortization of FDIC receivable, divided by average assets
1.00%
1.50%
2.00%
2.50%
3.00%
3.50%
2013 2014 2015 2016 2017 YTD Target
Burden Ratio
1
30%
40%
50%
60%
70%
80%
90%
2013 2014 2015 2016 2017 YTD Target
Efficiency Ratio

15
Core Deposit Funding
Average noninterest-bearing
deposits increased $32mm in 3Q17
and represent 29.2% of average
total deposits
Low cost of funds of 38 bps as of
3Q17 is up just 4 bps since 3Q16, as
compared to the 75 bps rise in the
Fed Funds target over the same
period
Cost of interest-bearing transaction
accounts of 13 bps has remained
relatively steady since 3Q14
($ i
n
m
m
)
.00%
.10%
.20%
.30%
.40%
.50%
0
200
400
600
800
1,000
1,200
3Q14 4Q14 1Q15 2Q15 3Q15 4Q15 1Q16 2Q16 3Q16 4Q16 1Q17 2Q17 3Q17
Average Transaction Deposits
Interest- Bearing Non-Interest Bearing Cost of Funds Cost of IB Transaction Accts
Deposit Region
($ in mm)
2013 % 2014 % 2015 % 2016 % 2017 YTD %
Atlanta 798 38% 869 40% 1,080 39% 1,134 39% 1,140 33%
Middle Georgia 1,309 62% 1,297 60% 1,271 46% 1,337 46% 1,393 41%
Au usta - - - - 422 15% 422 15% 449 13%
Athens / Gainesville - - - - - - - - - - 354 10%
Greater Savannah - - - - - - - - - - 89 3%
Total Average Deposits $2,107 $2,166 $2,773 $2,893 $3,425
AloStar Deposits as of Period-End 3Q17 $706

16
Loan Portfolio
To
ta
l L
o
an
s
($
in
m
m
)
1 New loan fundings include new loans funded and net loan advances on existing commitments
2 3rd quarter 2017 loan balances include AloStar’s loan portfolio net of the fair value mark
1
New loan originations in
excess of $420mm in 3Q17; in
line with the trailing eight
quarter average
Acquisition of AloStar
materially impacts State
Bank’s loan portfolio as
Organic & PNCI loans grew
$624mm in 3Q17, including a
$529mm, or 47.9%, increase
in non CRE loans
N
ew
Lo
an
Fu
n
d
in
gs ($ i
n
m
m
)
Loan Composition (period-end)
($ in mm)
2013 2014 2015 2016 3Q172
Construction, land & land development $251 $313 $501 $551 $491
Other commercial real estate 550 636 736 964 1,150
Total commercial real estate 802 949 1,236 1,516 1,641
Residential real estate 67 135 210 289 288
Owner-occupied real estate 175 212 281 372 387
C&I and Leases 71 123 267 435 989
Consumer 9 9 21 42 64
Total Organic & PNCI Loans 1,123 1,428 2,015 2,654 3,369
PCI Loans 257 206 146 161 204
Total Loans $1,381 $1,635 $2,160 $2,815 $3,573
0
125
250
375
500
0
500
1,000
1,500
2,000
2,500
3,000
3,500
4,000
3Q14 4Q14 1Q15 2Q15 3Q15 4Q15 1Q16 2Q16 3Q16 4Q16 1Q17 2Q17 3Q17
Total Loan Portfolio
Organic PNCI PCI New Loan Fundings
17
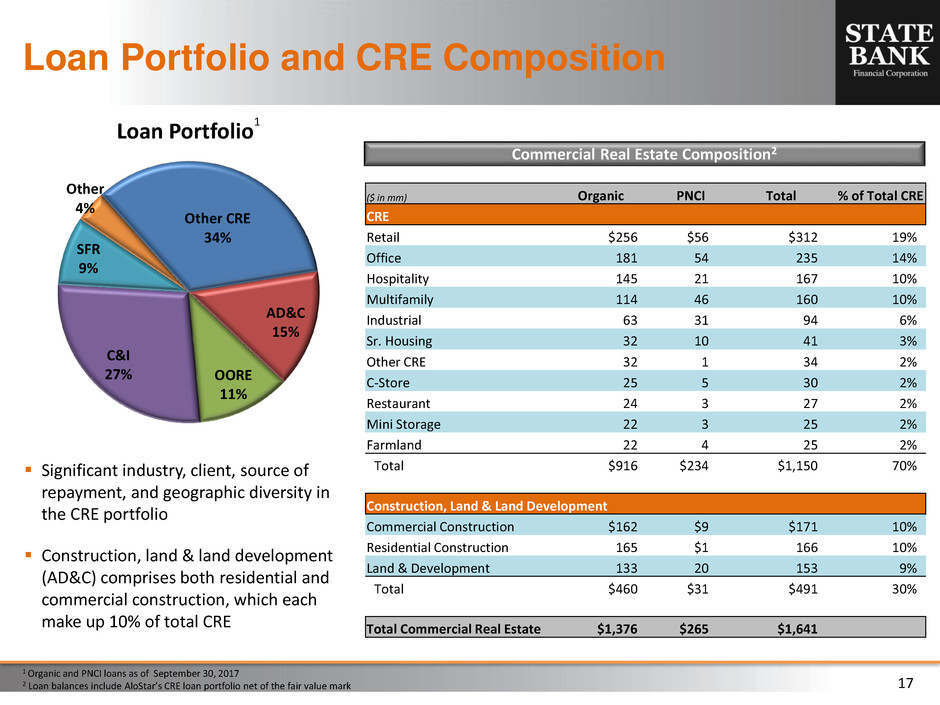
Loan Portfolio and CRE Composition
1 Organic and PNCI loans as of September 30, 2017
2 Loan balances include AloStar’s CRE loan portfolio net of the fair value mark
Commercial Real Estate Composition2
Significant industry, client, source of
repayment, and geographic diversity in
the CRE portfolio
Construction, land & land development
(AD&C) comprises both residential and
commercial construction, which each
make up 10% of total CRE
($ in mm) Organic PNCI Total % of Total CRE
CRE
Retail $256 $56 $312 19%
Office 181 54 235 14%
Hospitality 145 21 167 10%
Multifamily 114 46 160 10%
Industrial 63 31 94 6%
Sr. Housing 32 10 41 3%
Other CRE 32 1 34 2%
C-Store 25 5 30 2%
Restaurant 24 3 27 2%
Mini Storage 22 3 25 2%
Farmland 22 4 25 2%
Total $916 $234 $1,150 70%
Construction, Land & Land Development
Commercial Construction $162 $9 $171 10%
Residential Construction 165 $1 166 10%
Land & Development 133 20 153 9%
Total $460 $31 $491 30%
Total Commercial Real Estate $1,376 $265 $1,641
Other CRE
34%
AD&C
15%
OORE
11%
C&I
27%
SFR
9%
Other
4%
Loan Portfolio
1

18
PCI loans decreased $9.5mm
quarter over quarter excluding the
impact of the AloStar acquisition
Over 90% of PCI loans are current
as of 3Q17
OREO balances of $1.3mm as of
3Q17, down from $2.4mm at 2Q17
and $10.6mm at 3Q16
Asset Quality
($ i
n
m
m
)
Total organic NPAs of $5.5mm at
3Q17, up from last quarter but in line
with historical levels, representing
just .24% of organic loans and OREO
Past due organic loans remain low at
.12% at 3Q17
Annualized net charge-offs were
.14% in 3Q17
Allowance for organic loans is .99%
0
5
10
15
20
0
50
100
150
200
250
3Q16 4Q16 1Q17 2Q17 3Q17
OR
EO
($ i
n
m
m
)
PCI
Lo
an
s ($
in
m
m
)
PCI Loans & OREO
PCI Loans OREO
0.00%
0.25%
0.50%
0.75%
1.00%
0
5
10
15
20
3Q16 4Q16 1Q17 2Q17 3Q17
Nonperforming Loans
Organic PNCI NPLs / Organic Loans
