Attached files
| file | filename |
|---|---|
| 8-K - FORM 8-K - KBS Real Estate Investment Trust II, Inc. | kbsrii8k.htm |

KBS REIT II
Revaluation
December 11, 2017
Granite Tower
Denver, CO
Exhibit 99.1

Forward-Looking Statements
The information contained herein should be read in conjunction with, and is qualified by, the information in KBS Real Estate
Investment Trust II’s (“KBS REIT II”) Annual Report on Form 10-K for the year ended December 31, 2016, filed with the Securities and
Commission Exchange (the “SEC”) on March 13, 2017 (the “Annual Report”), and in KBS REIT II’s Quarterly Report on Form 10-Q for
the quarter ended September 30, 2017 (the “Quarterly Report”), filed with the SEC on November 14, 2017, including the “Risk
Factors” contained in the Annual Report. For a full description of the limitations, methodologies and assumptions used to value KBS
REIT II’s assets and liabilities in connection with the calculation of KBS REIT II’s estimated value per share, see KBS REIT II’s Current
Report on Form 8-K, filed with the SEC on December 11, 2017.
Forward-Looking Statements
Certain statements contained herein may be deemed to be forward-looking statements within the meaning of the Federal Private
Securities Litigation Reform Act of 1995. KBS REIT II intends that such forward-looking statements be subject to the safe harbors
created by Section 21E of the Securities Exchange Act of 1934, as amended. These statements include statements regarding the
intent, belief or current expectations of KBS REIT II and members of its management team, as well as the assumptions on which such
statements are based, and generally are identified by the use of words such as “may,” “will,” “seeks,” “anticipates,” “believes,”
“estimates,” “expects,” “plans,” “intends,” “should” or similar expressions. Readers are cautioned not to place undue reliance on
these forward-looking statements, which speak only as of the date they are made. KBS REIT II undertakes no obligation to update or
revise forward-looking statements to reflect changed assumptions, the occurrence of unanticipated events or changes to future
operating results over time, unless required by law. Such statements are subject to known and unknown risks and uncertainties
which could cause actual results to differ materially from those contemplated by such forward-looking statements. KBS REIT II makes
no representation or warranty (express or implied) about the accuracy of any such forward-looking statements. These statements are
based on a number of assumptions involving the judgment of management. The appraisal methodology for KBS REIT II’s real estate
properties assumes the properties realize the projected net operating income and expected exit cap rates and that investors would
be willing to invest in such properties at yields equal to the expected discount rates. Though the appraisals of the real estate
properties, with respect to CBRE, Inc., an independent, third-party real estate valuation firm (“CBRE”) that performed the appraisals
of the real estate properties, and the valuation estimates used in calculating the estimated value per share, with respect to KBS REIT
II and KBS Capital Advisors LLC, KBS REIT II’s external advisor (the “Advisor”), are the respective party’s best estimates as of
September 30, 2017 or December 8, 2017, as applicable, KBS REIT II can give no assurance in this regard. Even small changes to these
assumptions could result in significant differences in the appraised values of KBS REIT II’s real estate properties and the estimated
value per share. The forward-looking statements also depend on factors such as: future economic, competitive and market
conditions; KBS REIT II’s ability to maintain occupancy levels and rental rates at its real estate properties; the borrower under KBS
REIT II’s loan investment continuing to make required payments under the loan documents; and other risks identified in Part I, Item
IA of the Annual Report as filed with the SEC. Actual events may cause the value and returns on KBS REIT II’s investments to be less
than that used for purposes of KBS REIT II’s estimated value per share.
2
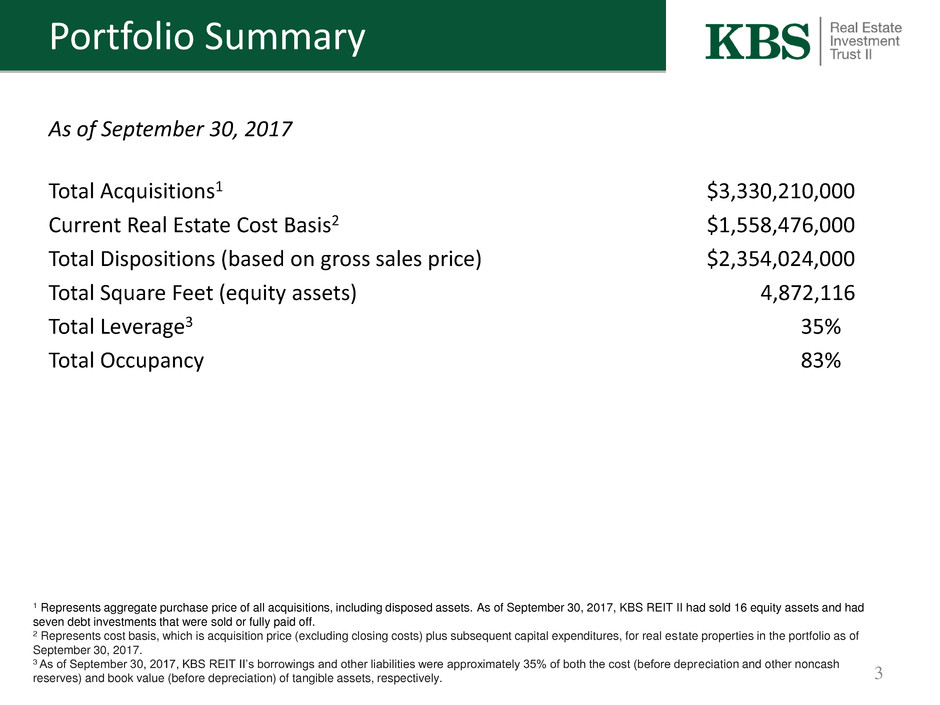
Portfolio Summary
As of September 30, 2017
Total Acquisitions1 $3,330,210,000
Current Real Estate Cost Basis2 $1,558,476,000
Total Dispositions (based on gross sales price) $2,354,024,000
Total Square Feet (equity assets) 4,872,116
Total Leverage3 35%
Total Occupancy 83%
3
1 Represents aggregate purchase price of all acquisitions, including disposed assets. As of September 30, 2017, KBS REIT II had sold 16 equity assets and had
seven debt investments that were sold or fully paid off.
2 Represents cost basis, which is acquisition price (excluding closing costs) plus subsequent capital expenditures, for real estate properties in the portfolio as of
September 30, 2017.
3 As of September 30, 2017, KBS REIT II’s borrowings and other liabilities were approximately 35% of both the cost (before depreciation and other noncash
reserves) and book value (before depreciation) of tangible assets, respectively.
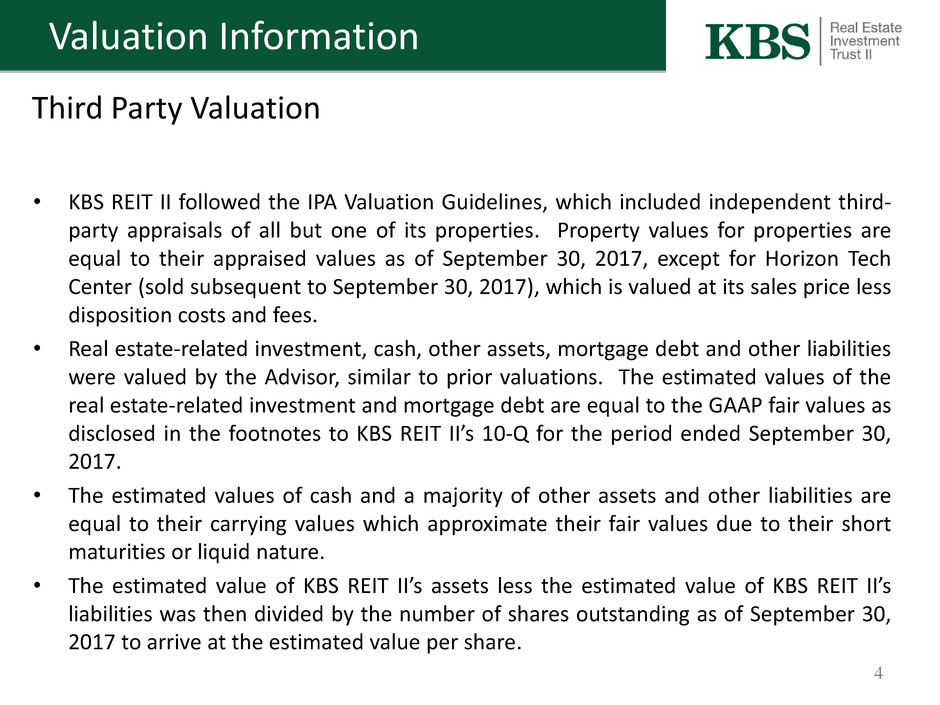
• KBS REIT II followed the IPA Valuation Guidelines, which included independent third-
party appraisals of all but one of its properties. Property values for properties are
equal to their appraised values as of September 30, 2017, except for Horizon Tech
Center (sold subsequent to September 30, 2017), which is valued at its sales price less
disposition costs and fees.
• Real estate-related investment, cash, other assets, mortgage debt and other liabilities
were valued by the Advisor, similar to prior valuations. The estimated values of the
real estate-related investment and mortgage debt are equal to the GAAP fair values as
disclosed in the footnotes to KBS REIT II’s 10-Q for the period ended September 30,
2017.
• The estimated values of cash and a majority of other assets and other liabilities are
equal to their carrying values which approximate their fair values due to their short
maturities or liquid nature.
• The estimated value of KBS REIT II’s assets less the estimated value of KBS REIT II’s
liabilities was then divided by the number of shares outstanding as of September 30,
2017 to arrive at the estimated value per share.
Valuation Information
4
Third Party Valuation
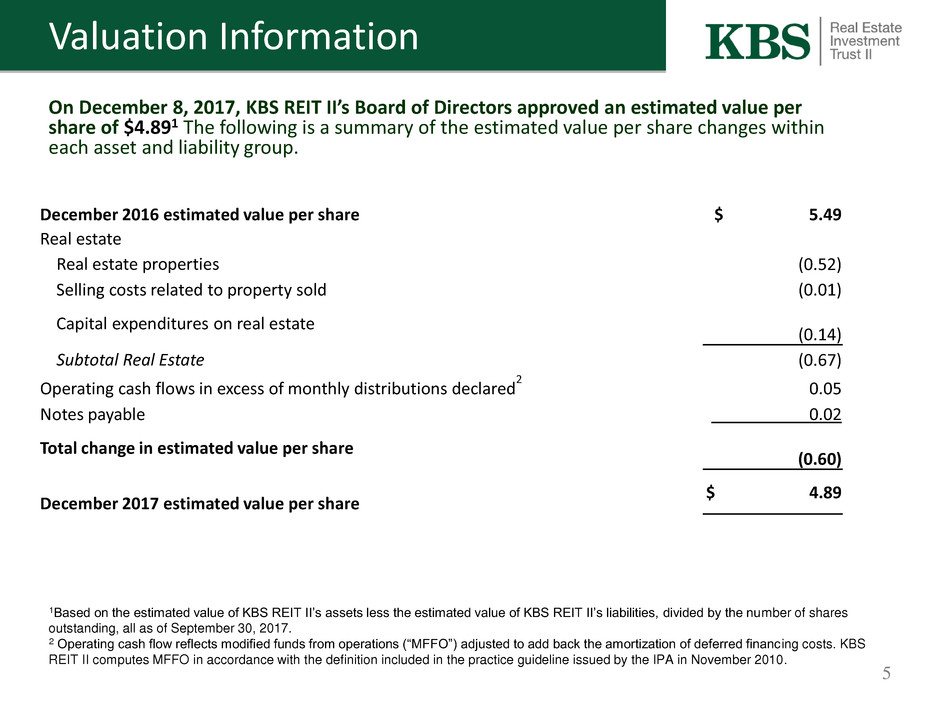
December 2016 estimated value per share $ 5.49
Real estate
Real estate properties (0.52)
Selling costs related to property sold (0.01)
Capital expenditures on real estate
(0.14)
Subtotal Real Estate (0.67)
Operating cash flows in excess of monthly distributions declared
2
0.05
Notes payable 0.02
Total change in estimated value per share
(0.60)
December 2017 estimated value per share
$ 4.89
On December 8, 2017, KBS REIT II’s Board of Directors approved an estimated value per
share of $4.891 The following is a summary of the estimated value per share changes within
each asset and liability group.
Valuation Information
5
1Based on the estimated value of KBS REIT II’s assets less the estimated value of KBS REIT II’s liabilities, divided by the number of shares
outstanding, all as of September 30, 2017.
2 Operating cash flow reflects modified funds from operations (“MFFO”) adjusted to add back the amortization of deferred financing costs. KBS
REIT II computes MFFO in accordance with the definition included in the practice guideline issued by the IPA in November 2010.

Offering Price: $10.00
Valuation History:
– December 20111 $10.11
– December 20122 $10.29
– December 20133 $10.29
– September 20144 (after deducting special distribution of $4.50 from $10.55) $6.05
– December 20145 $5.86
– December 20156 $5.62
– December 20167 $5.49
– December 20178 $4.89
6
1 Data as of 9/30/11. See KBS REIT II’s Current Report on Form 8-K filed with the SEC on December 21, 2011.
2 Data as of 9/30/12. See KBS REIT II’s Current Report on Form 8-K filed with the SEC on December 19, 2012.
3 Data as of 9/30/13, with the exception of real estate appraised as of November 30, 2013. See KBS REIT II’s Current Report on Form 8-K filed with the SEC on
December 19, 2013.
4 Data as of 6/30/14. See KBS REIT II’s Current Report on Form 8-K filed with the SEC on September 23, 2014.
5 Data as of 9/30/14. See KBS REIT II’s Current Report on Form 8-K filed with the SEC on December 4, 2014.
6 Data as of 9/30/15. See KBS REIT II’s Current Report on Form 8-K filed with the SEC on December 9, 2015.
7 Data as of 9/30/16. See KBS REIT II’s Current Report on Form 8-K filed with the SEC on December 15, 2016.
8 Data as of 9/30/17. See KBS REIT II’s Current Report on Form 8-K filed with the SEC on December 11, 2017.
Valuation Information
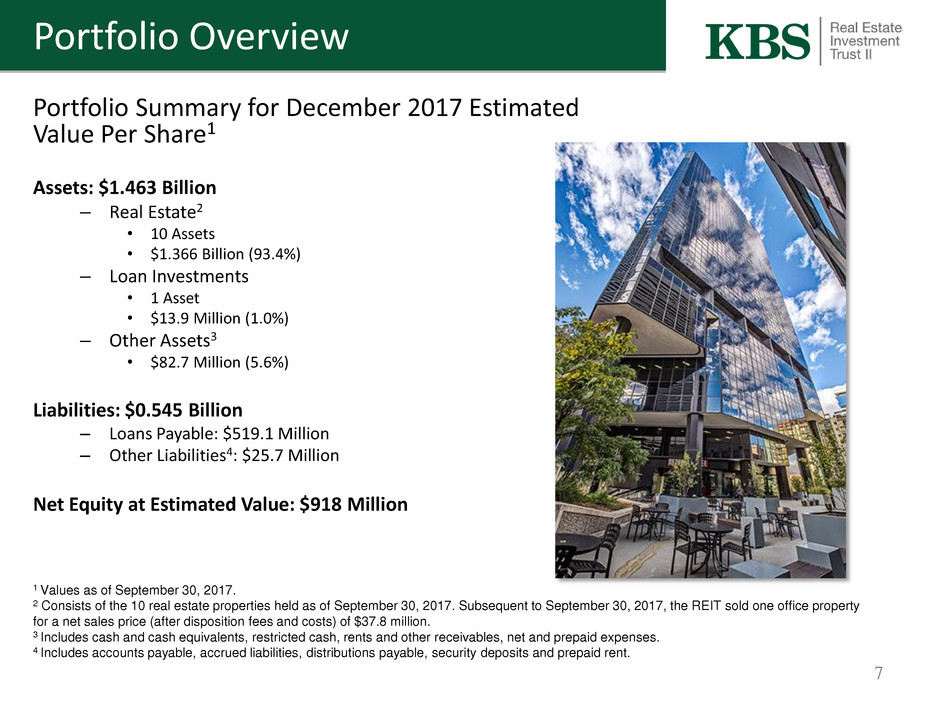
Portfolio Overview
Portfolio Summary for December 2017 Estimated
Value Per Share1
Assets: $1.463 Billion
– Real Estate2
• 10 Assets
• $1.366 Billion (93.4%)
– Loan Investments
• 1 Asset
• $13.9 Million (1.0%)
– Other Assets3
• $82.7 Million (5.6%)
Liabilities: $0.545 Billion
– Loans Payable: $519.1 Million
– Other Liabilities4: $25.7 Million
Net Equity at Estimated Value: $918 Million
7
1 Values as of September 30, 2017.
2 Consists of the 10 real estate properties held as of September 30, 2017. Subsequent to September 30, 2017, the REIT sold one office property
for a net sales price (after disposition fees and costs) of $37.8 million.
3 Includes cash and cash equivalents, restricted cash, rents and other receivables, net and prepaid expenses.
4 Includes accounts payable, accrued liabilities, distributions payable, security deposits and prepaid rent.

Union Bank
8
The September 30, 2017 appraised value represents a $52.5
million, or 17.4%, decrease vs. the appraised value as of
September 30, 2016. The REIT marketed the asset for sale
throughout 2017 and the majority of the offers were well
below the 2016 appraised value, primarily due to the
following:
• Significant unpredictability of the future for the
property’s largest tenant, Union Bank (342,712 sf).
• Developers are concerned about over development of
multi-family in downtown, so have been unwilling to
attribute any value to the development opportunity at
the property.
• There are multiple large blocks of space available in
downtown LA, so net absorption has been lower than
expected even though rental rates are still strong.
• The pool of buyers for a large office building and a
multifamily development site is limited.
Significant Real Estate Value Changes
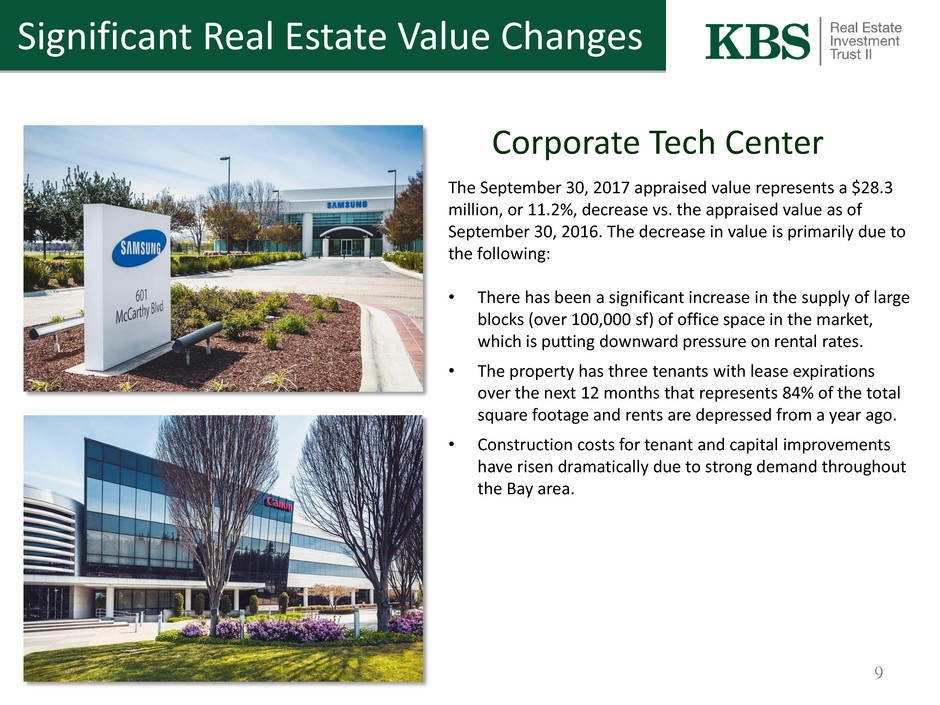
Corporate Tech Center
9
The September 30, 2017 appraised value represents a $28.3
million, or 11.2%, decrease vs. the appraised value as of
September 30, 2016. The decrease in value is primarily due to
the following:
• There has been a significant increase in the supply of large
blocks (over 100,000 sf) of office space in the market,
which is putting downward pressure on rental rates.
• The property has three tenants with lease expirations
over the next 12 months that represents 84% of the total
square footage and rents are depressed from a year ago.
• Construction costs for tenant and capital improvements
have risen dramatically due to strong demand throughout
the Bay area.
Significant Real Estate Value Changes
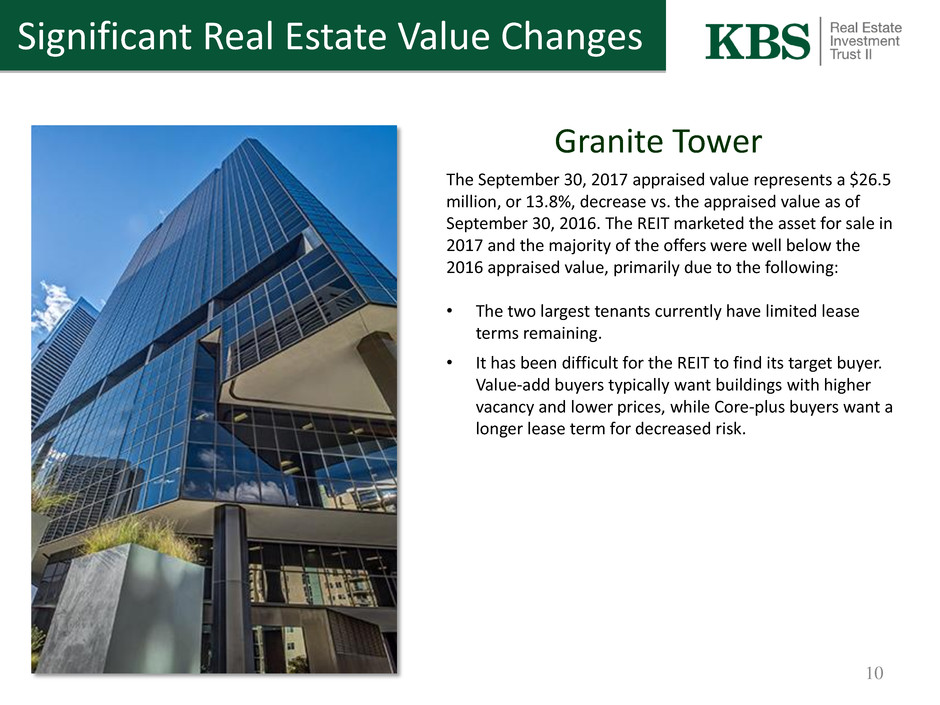
Granite Tower
Significant Real Estate Value Changes
10
The September 30, 2017 appraised value represents a $26.5
million, or 13.8%, decrease vs. the appraised value as of
September 30, 2016. The REIT marketed the asset for sale in
2017 and the majority of the offers were well below the
2016 appraised value, primarily due to the following:
• The two largest tenants currently have limited lease
terms remaining.
• It has been difficult for the REIT to find its target buyer.
Value-add buyers typically want buildings with higher
vacancy and lower prices, while Core-plus buyers want a
longer lease term for decreased risk.

Gateway Corporate Center
• Acquired on January 26, 2011, for $47.4 million
plus closing costs
• Two-building, three-story office park with
234,907 rentable square feet
• Sold on June 14, 2017, for $47.1 million net of
concessions and credits (cost basis at time of
sale was $51.8 million)
• The operating cash flow generated from the
property during the hold period was $14.9
million
Disposition
11
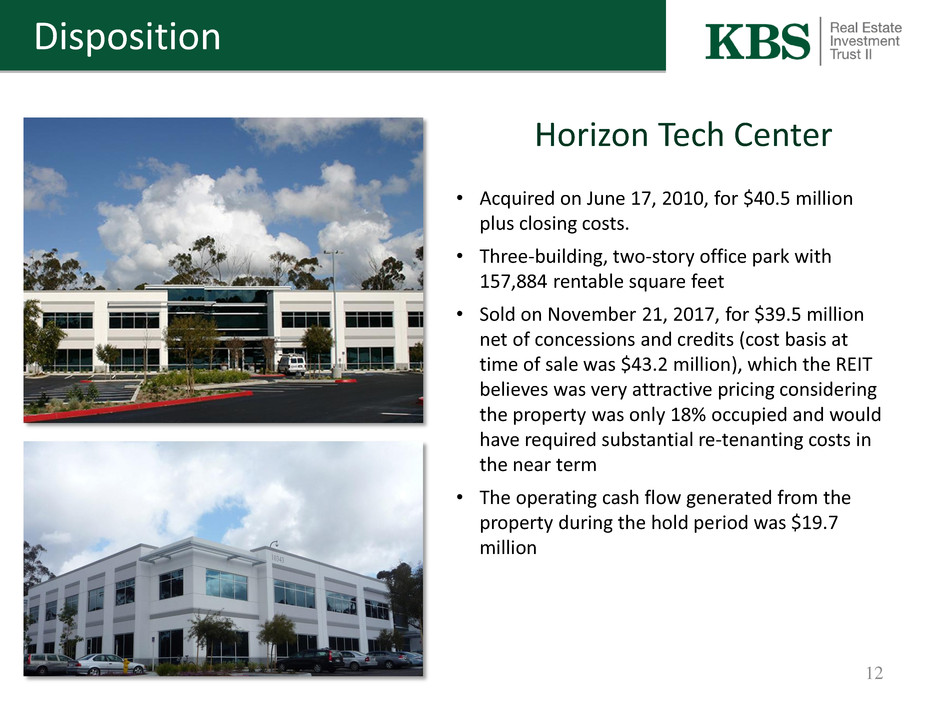
Horizon Tech Center
• Acquired on June 17, 2010, for $40.5 million
plus closing costs.
• Three-building, two-story office park with
157,884 rentable square feet
• Sold on November 21, 2017, for $39.5 million
net of concessions and credits (cost basis at
time of sale was $43.2 million), which the REIT
believes was very attractive pricing considering
the property was only 18% occupied and would
have required substantial re-tenanting costs in
the near term
• The operating cash flow generated from the
property during the hold period was $19.7
million
Disposition
12

1 Includes acquisition price, acquisition costs, capital expenditures and leasing commissions.
Asset
Acquisition
Date
Purchase Price Cost Basis
1
Sale Date Net Sale Price
SOLD as of September 30, 2017
Hartman II 4/7/2010 $10,800,000 $11,113,000 6/28/2012 $12,650,000
Mountain View Corp. Center 7/30/2008 $30,000,000 $33,316,000 5/15/2014 $25,417,000
Dallas Cowboys Dist. Center 7/8/2010 $19,000,000 $19,273,000 6/11/2014 $22,250,000
601 Tower at Carlson Center 2/3/2011 $54,403,000 $60,405,000 6/11/2014 $74,946,000
Plano Business Park 3/15/2010 $16,750,000 $18,229,000 6/16/2014 $23,297,000
Metropolitan Center 12/16/2011 $104,900,000 $108,075,000 6/27/2014 $108,458,000
300 North LaSalle 7/29/2010 $655,000,000 $663,847,000 7/7/2014 $849,604,000
Torrey Reserve West 9/9/2010 $27,300,000 $29,489,000 7/10/2014 $39,150,000
Two Westlake Park 2/25/2011 $80,500,000 $94,759,000 7/25/2014 $119,899,000
CityPlace Tower 4/6/2011 $126,500,000 $130,996,000 8/21/2014 $149,878,000
I-81 Industrial 2/16/2011 $90,000,000 $92,900,000 11/18/2014 $103,871,000
Crescent VIII 5/26/2010 $12,500,000 $14,500,000 11/20/2014 $16,438,000
One Main Place 2/5/2010 $57,000,000 $64,500,000 12/24/2014 $84,424,000
National City Tower 12/17/2010 $115,000,000 $124,600,000 2/13/2015 $124,000,000
350 E Plumeria 12/18/2008 $35,775,000 $38,123,000 5/17/2016 $42,336,000
Gateway Corporate Center 1/26/2011 $47,407,000 $51,835,000 6/14/2017 $47,100,000
Horizon Tech Center 6/17/2010 $40,500,000 $43,151,000 11/21/2017 $39,451,000
TOTAL $1,523,335,000 $1,599,111,000 $1,883,169,000
Disposition History
13
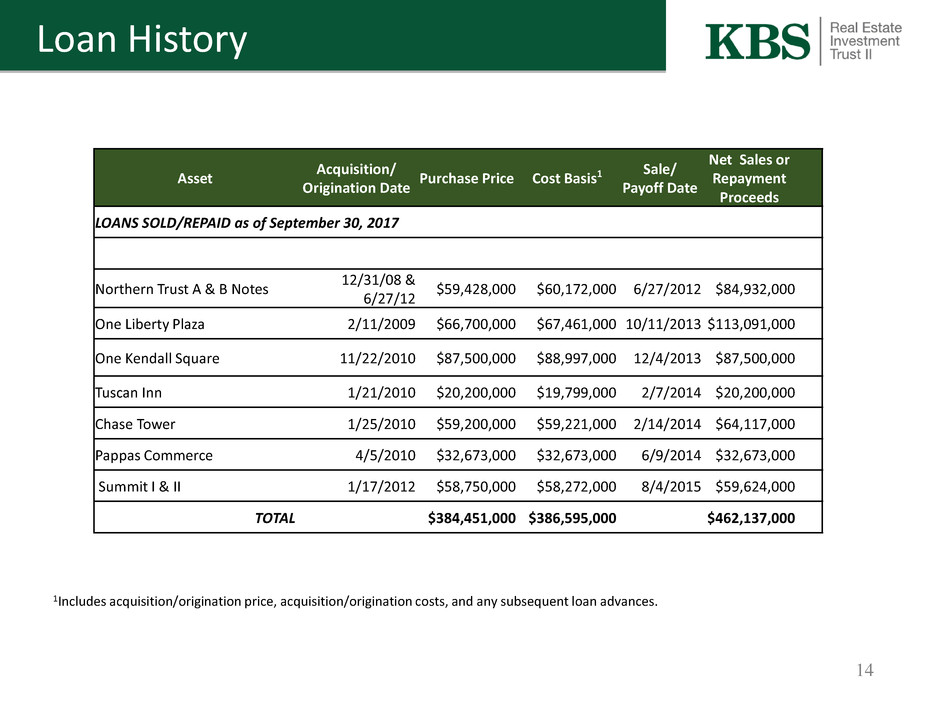
Loan History
14
1Includes acquisition/origination price, acquisition/origination costs, and any subsequent loan advances.
Asset
Acquisition/
Origination Date
Purchase Price Cost Basis1
Sale/
Payoff Date
Net Sales or
Repayment
Proceeds
LOANS SOLD/REPAID as of September 30, 2017
Northern Trust A & B Notes
12/31/08 &
6/27/12
$59,428,000 $60,172,000 6/27/2012 $84,932,000
One Liberty Plaza 2/11/2009 $66,700,000 $67,461,000 10/11/2013 $113,091,000
One Kendall Square 11/22/2010 $87,500,000 $88,997,000 12/4/2013 $87,500,000
Tuscan Inn 1/21/2010 $20,200,000 $19,799,000 2/7/2014 $20,200,000
Chase Tower 1/25/2010 $59,200,000 $59,221,000 2/14/2014 $64,117,000
Pappas Commerce 4/5/2010 $32,673,000 $32,673,000 6/9/2014 $32,673,000
Summit I & II 1/17/2012 $58,750,000 $58,272,000 8/4/2015 $59,624,000
TOTAL $384,451,000 $386,595,000 $462,137,000
15
Distribution Information
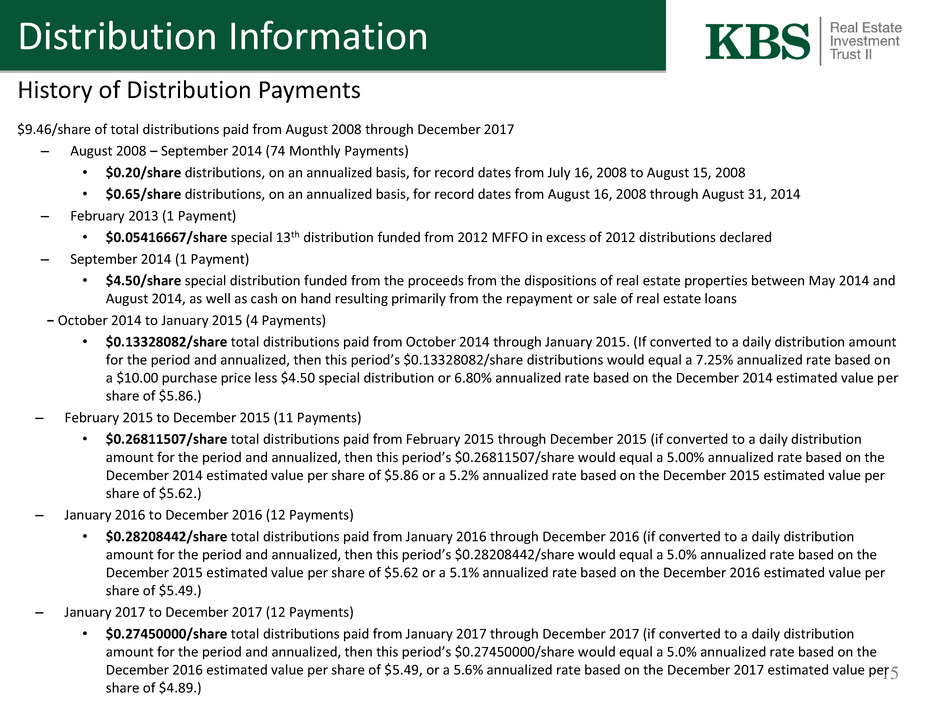
History of Distribution Payments
$9.46/share of total distributions paid from August 2008 through December 2017
– August 2008 – September 2014 (74 Monthly Payments)
• $0.20/share distributions, on an annualized basis, for record dates from July 16, 2008 to August 15, 2008
• $0.65/share distributions, on an annualized basis, for record dates from August 16, 2008 through August 31, 2014
– February 2013 (1 Payment)
• $0.05416667/share special 13th distribution funded from 2012 MFFO in excess of 2012 distributions declared
– September 2014 (1 Payment)
• $4.50/share special distribution funded from the proceeds from the dispositions of real estate properties between May 2014 and
August 2014, as well as cash on hand resulting primarily from the repayment or sale of real estate loans
− October 2014 to January 2015 (4 Payments)
• $0.13328082/share total distributions paid from October 2014 through January 2015. (If converted to a daily distribution amount
for the period and annualized, then this period’s $0.13328082/share distributions would equal a 7.25% annualized rate based on
a $10.00 purchase price less $4.50 special distribution or 6.80% annualized rate based on the December 2014 estimated value per
share of $5.86.)
– February 2015 to December 2015 (11 Payments)
• $0.26811507/share total distributions paid from February 2015 through December 2015 (if converted to a daily distribution
amount for the period and annualized, then this period’s $0.26811507/share would equal a 5.00% annualized rate based on the
December 2014 estimated value per share of $5.86 or a 5.2% annualized rate based on the December 2015 estimated value per
share of $5.62.)
– January 2016 to December 2016 (12 Payments)
• $0.28208442/share total distributions paid from January 2016 through December 2016 (if converted to a daily distribution
amount for the period and annualized, then this period’s $0.28208442/share would equal a 5.0% annualized rate based on the
December 2015 estimated value per share of $5.62 or a 5.1% annualized rate based on the December 2016 estimated value per
share of $5.49.)
– January 2017 to December 2017 (12 Payments)
• $0.27450000/share total distributions paid from January 2017 through December 2017 (if converted to a daily distribution
amount for the period and annualized, then this period’s $0.27450000/share would equal a 5.0% annualized rate based on the
December 2016 estimated value per share of $5.49, or a 5.6% annualized rate based on the December 2017 estimated value per
share of $4.89.)

16
Stockholder Performance
KBS REIT II is providing this estimated value per share to assist broker-dealers that participated in its initial public offering in meeting their
FINRA customer account statement reporting obligations. The valuation was performed in accordance with the provisions of and also to
comply with the IPA Valuation Guidelines. As with any valuation methodology, the methodologies used are based upon a number of
estimates and assumptions that may not be accurate or complete. Different parties with different assumptions and estimates could
derive a different estimated value per share, and this difference could be significant. The estimated value per share is not audited and
does not represent the fair value of KBS REIT II’s assets less the fair value of KBS REIT II’s liabilities according to GAAP. With respect to the
estimated value per share, KBS REIT II can give no assurance that:
• a stockholder would be able to resell his or her shares at this estimated value per share;
• a stockholder would ultimately realize distributions per share equal to KBS REIT II’s estimated value per share upon liquidation of KBS
REIT II’s assets and settlement of its liabilities or a sale of KBS REIT II;
• KBS REIT II’s shares of common stock would trade at the estimated value per share on a national securities exchange;
• an independent third-party appraiser or other third-party valuation firm would agree with KBS REIT II’s estimated value per share; or
• the methodology used to calculate KBS REIT II’s estimated value per share would be acceptable to FINRA or for compliance with ERISA
reporting requirements.
Further, the estimated value per share as of December 8, 2017 is based on the estimated value of KBS REIT II’s assets less the estimated
value of KBS REIT II’s liabilities divided by the number of shares outstanding, all as of September 30, 2017. The value of KBS REIT II’s
shares will fluctuate over time in response to developments related to individual assets in KBS REIT II’s portfolio and the management of
those assets, in response to the real estate and finance markets and due to other factors. The estimated value per share does not reflect
a discount for the fact that KBS REIT II is externally managed, nor does it reflect a real estate portfolio premium/discount versus the sum
of the individual property values. The estimated value per share does not take into account estimated disposition costs and fees for real
estate properties that are not under contract to sell, debt prepayment penalties that could apply upon the prepayment of certain of KBS
REIT II’s debt obligations or the impact of restrictions on the assumption of debt. KBS REIT II has generally incurred disposition costs and
fees related to the sale of each real estate property since inception of 1.7% to 4.4% of the gross sales price less concessions and credits,
with the weighted average being approximately 2.3%. If this range of disposition costs and fees was applied to the estimated value of KBS
REIT II’s real estate properties, which does not include these costs and fees in the appraised values, the resulting impact on the estimated
value per share would be a decrease of $0.12 to $0.31 per share. KBS REIT II currently expects to utilize the Advisor and/or an
independent valuation firm to update the estimated value per share no later than December 2018.

Stockholder Performance
17
$4.89 $9.46 $14.35
Hypothetical Performance of Early and Late Investors
$10.00 Share Price, All Distributions Received in Cash
Estimated Value Per Share
As of December 8, 2017
Cumulative Cash Distributions
Received through
December 8, 2017
Sum of Estimated Value Per Share as of
December 8, 2017
and Cumulative Cash Distributions
Received through December 8, 2017
Late Investor: Invested at Close of Public Offering (December 31, 2010)
Early Investor: Invested at Escrow Break (June 24, 2008)
$4.89 $7.90 $12.79
The last column above would increase by $1.28 to $15.63 for early DRIP
investors and $0.48 to $13.27 for late DRIP investors.1
1Values per share are based on number of shares originally purchased, and assume full participation in dividend
reinvestment plan for life of investment and no share redemptions.

Stockholder Performance
18
Hypothetical Performance of Early and Late Investors
$10.00 Share Price, All Distributions Received in Cash
For information about the estimated value per share for 12/11, 12/12, 12/13, 9/14, 12/14, 12/15, 12/16 and 12/17 see slide 6. “Cumulative Distributions” for
an early cash investor assumes all distributions received in cash and no share redemptions and reflect the cash payment amounts (all distributions paid since
inception) per share for a hypothetical investor who invested on or before escrow break and consequently has received all distributions paid by the REIT.
“Cumulative distributions” for a late cash investor assumes all distributions received in cash and no share redemptions, and reflect the cash payment
amounts (all distributions paid since investment) per share for a hypothetical investor who invested on December 31, 2010, the day offers in primary offering
ended. The “offering price” of $10.00 reflects the price most investors paid to purchase shares in the primary initial public offering.
$2.16 $2.81
$3.51
$8.50 $8.60 $8.90 $9.18 $9.46
$10.11
$10.29
$10.29
$6.05 $5.86 $5.62 $5.49 $4.89$10.00
$12.27
$13.10
$13.80
$14.55 $14.46 $14.52 $14.67 $14.35
Offering
Price
2011 2012 2013 Sept. 2014 Dec. 2014 Dec. 2015 Dec. 2016 Dec. 2017
Breakdown of Early Cash Investor Value
Cumulative Distributions Share Price
$0.65 $1.30
$1.95
6.94 $7.04 $7.34 $7.62
$7.90
$10.11
$10.29
$10.29
$6.05 $5.86 $5.62 $5.49 $4.89
$10.00
$10.76
$11.59
$12.24
$12.99 $12.90 $12.96 $13.11 $12.79
Offering
Price
2011 2012 2013 Sept.
2014
Dec. 2014Dec. 2015Dec. 2016Dec. 2017
Breakdown of Late Cash Investor Value
Cumulative Distributions Share Price

19
2018 Goals and Objectives
• Continue to strategically sell assets and consider special
distributions to stockholders
• Negotiate lease renewals or new leases that facilitate the
sales process and enhance property stability for prospective
buyers
• Complete capital projects, such as renovations or amenity
enhancements, to attract quality buyers
• Finalize strategic alternatives assessment and course of action

Thank you!
KBS Capital Markets Group LLC
Member FINRA & SIPC
800 Newport Center Drive, Suite 700
Newport Beach, CA 92660
(866) 527-4264
www.kbs-cmg.com
20
