Attached files
| file | filename |
|---|---|
| EX-99.1 - EX-99.1 - American Water Works Company, Inc. | d507444dex991.htm |
| 8-K - FORM 8-K - American Water Works Company, Inc. | d507444d8k.htm |
 American Water 2018 Guidance Conference Call
NYSE: AWK Exhibit 99.2 |
 NYSE: AWK www.amwater.com 2 Forward-Looking Statements Ed Vallejo Vice President, Investor Relations |
 NYSE: AWK December 2017 www.amwater.com 3 Forward-Looking Statements and Other Information Certain statements in this presentation including, without limitation, 2017 and 2018 earnings guidance, projected long-term earnings
growth, the outcome of new and pending acquisition activity, O&M
efficiency ratio targets, estimated revenues from rate cases and other government agency authorizations, the level of future capital expenditures and rate base growth, future dividend growth, estimates regarding the company’s projected financial condition and net operating loss position,
and the outcome and impact of proposed tax reform legislation, are
forward-looking statements within the meaning of the safe harbor provisions of the Private Securities Litigation Reform Act of 1995 and the Federal securities laws. In some cases, these forward-looking statements can be identified by words with prospective meanings such as “intend,”
“plan,” “estimate,” “believe,” “anticipate,” “expect,” “predict,” “project,” “propose,” “assume,” “forecast,” “likely,”
“outlook,” “future,” “pending,” “goal,” “objective,” “potential,” “continue,” “seek to,” “may,” “can,” “will,” “should”
and “could” and or the negative of such terms or other
variations or similar expressions. These forward-looking statements are predictions based on American Water’s current expectations and assumptions regarding future events. They are not guarantees or assurances of any outcomes, financial results of levels of
activity, performance or achievements, and readers are cautioned
not to place undue reliance upon them. The forward-looking statements are subject to a number of estimates and assumptions, and known and unknown risks, uncertainties and other factors. Actual results may differ materially from those discussed in the forward-looking statements
included in this press release as a result of the factors discussed
in the Company’s Annual Report on Form 10-K for the year ended Dec. 31, 2016, and subsequent filings with the SEC, and because of factors such as: the decisions of governmental and regulatory bodies, including decisions to raise or lower rates; the timeliness and outcome of regulatory
commissions’ actions concerning rates, capital structure,
authorized return on equity, capital investment, permitting, and other decisions;
changes in laws, governmental regulations and policies, including environmental, health and safety, water quality, and public utility and tax regulations and policies, and impacts resulting from U.S., state and local elections; potential
costs and liabilities of American Water for environmental laws and
similar matters resulting from, among other things, water and wastewater service provided to customers, including, for example, water management solutions focused on customers in the natural gas exploration and production market; the outcome of litigation and similar government
actions, including matters related to the Freedom Industries
chemical spill in West Virginia, and the preliminarily approved global class action settlement related to this chemical spill; weather conditions and events, climate change patterns, and natural disasters, including drought or abnormally high rainfall, strong winds, coastal and intercoastal
flooding, earthquakes, landslides, hurricanes, tornadoes,
wildfires, electrical storms and solar flares; changes in customer demand for,
and patterns of use of, water, such as may result from conservation efforts; its ability to appropriately maintain current infrastructure, including its operational and information technology (“IT”) systems, and manage the expansion of
its business; its ability to obtain permits and other approvals for
projects; changes in its capital requirements; its ability to control operating expenses and to achieve efficiencies in its operations; the intentional or unintentional acts of a third party, including contamination of its water supplies or water provided to its customers; exposure or infiltration of its
critical infrastructure, operational technology and IT systems,
including the disclosure of sensitive or confidential information contained therein, through physical or cyber-attacks or other disruptions; its ability to obtain adequate and cost-effective supplies of chemicals, electricity, fuel, water and other raw materials that are needed for its operations; its ability
to successfully meet growth projections and capitalize on growth
opportunities, including its ability to, among other things, acquire and integrate water and wastewater systems into its regulated operations and enter into contracts and other agreements with, or otherwise obtain, new customers in its Market-based Businesses; cost overruns relating to
improvements in or the expansion of its operations; its ability to
maintain safe work sites; risks and uncertainties associated with contracting with the U.S. government, including ongoing compliance with applicable government procurement and security regulations; changes in general economic, political, business and financial market conditions; access
to sufficient capital on satisfactory terms and when and as needed
to support operations and capital expenditures; fluctuations in interest rates; restrictive covenants in or changes to the credit ratings on its current or future debt that could increase its financing costs or funding requirements or affect its ability to borrow, make payments on
debt or pay dividends; fluctuations in the value of
benefit plan assets and liabilities that could increase its financing costs and
funding requirements; changes in Federal or state income, general and other tax laws, including tax reform, the availability of tax credits and tax abatement programs, and the ability to utilize its U.S. and state net operating loss
carryforwards; migration of customers into or out of its service
territories; the use by municipalities of the power of eminent domain or other authority to condemn its systems; difficulty in obtaining, or the inability to obtain, insurance at acceptable rates and on acceptable terms and conditions; its ability to retain and attract qualified employees; labor
actions including work stoppages and strikes; the incurrence of
impairment charges related to American Water’s goodwill or
other assets; civil disturbances, terrorist threats or acts, or public apprehension about future disturbances or terrorist threats or acts; and the impact of new accounting standards or changes to existing standards.
These forward-looking statements are qualified by, and should be read
together with, the risks and uncertainties set forth above and the
risk factors included in the company’s annual and quarterly
SEC filings, and readers should refer to such risks, uncertainties and risk factors in evaluating such forward-looking statements. Any forward-looking statements speak only as of the date of this press release. The company does not have or undertake any obligation or intention to update
or revise any forward-looking statement, whether as a result of new information, future events, changed circumstances or otherwise, except as otherwise required by the Federal securities laws.
Furthermore, it may not be possible to assess the impact of any
such factor on the company’s businesses, either viewed independently or together, or the extent to which any factor, or combination of factors, may cause results to differ materially from those contained in any forward-looking statement. The foregoing factors should not be construed as
exhaustive. |
 NYSE: AWK www.amwater.com 4 Strategy Overview Susan Story President and Chief Executive Officer |
 NYSE: AWK December 2017 www.amwater.com 5 Headlines from Today’s Call Maintaining 7 – 10%* five-year EPS CAGR, affirming narrowed 2017 adjusted EPS range, and setting 2018 EPS Guidance at $3.22 - $3.32 Investing an expected $8.0 - $8.6 billion over the next 5 years with continuing focus on customer affordability Reinforcing that our market-based businesses provide growth, strategic value and positive cash flow Delivering a more regulated business mix and risk profile Expecting to grow our dividend at high end of the long-term 7 – 10%* adjusted EPS growth * Anchored off of 2016 Adjusted EPS (a non-GAAP measure). 2018-2022 Plan |
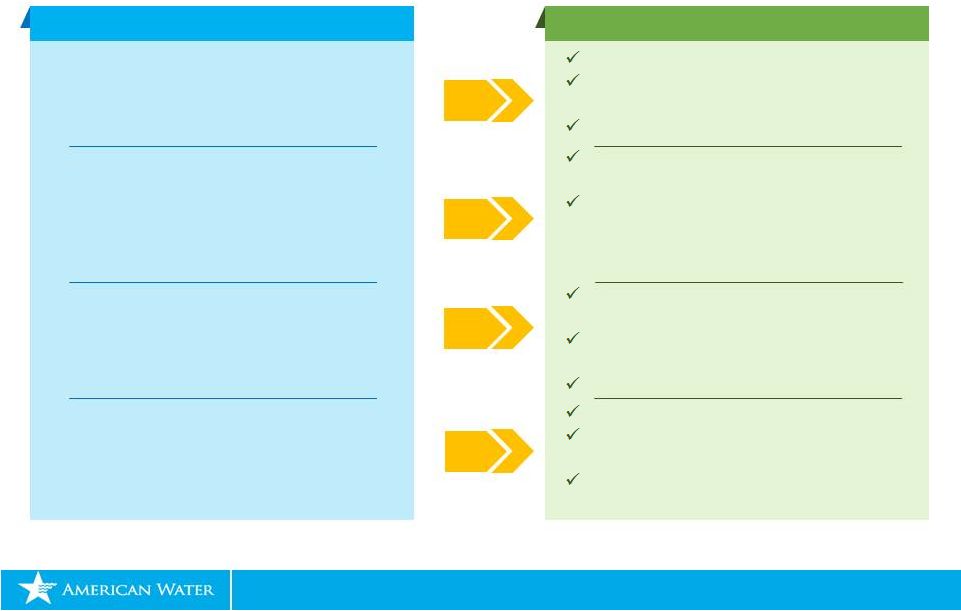
 NYSE: AWK December 2017 www.amwater.com 6 As Things Change… The More Things Change…the More Our Story Works! • Interest Rates: A New Normal? • Tax Reform- What’s In and Out? • Infrastructure Replacement – Show Me the Federal Funding! Our Story Works… Continued Investment Continued Growth plus Strong Dividend Growth More investment without affecting customer bills Business model that works under any scenario • Water Quality Concerns – Is my Water Safe? Industry leader in water R&D Dedicated scientists to emerging contaminants Largest national investor in water projects • Regulatory Imperatives – Striking a Balance Leader in finding ways to balance investment, service, and affordability • Higher Customer Expectations – I Want “What” I Want, “When” and “How” I Want It! Working toward “Amazon-like” customer experience Industry leading water quality • Technology Breakthroughs – A Better World Operational and capital efficiency focus Integrated workforce planning initiatives |
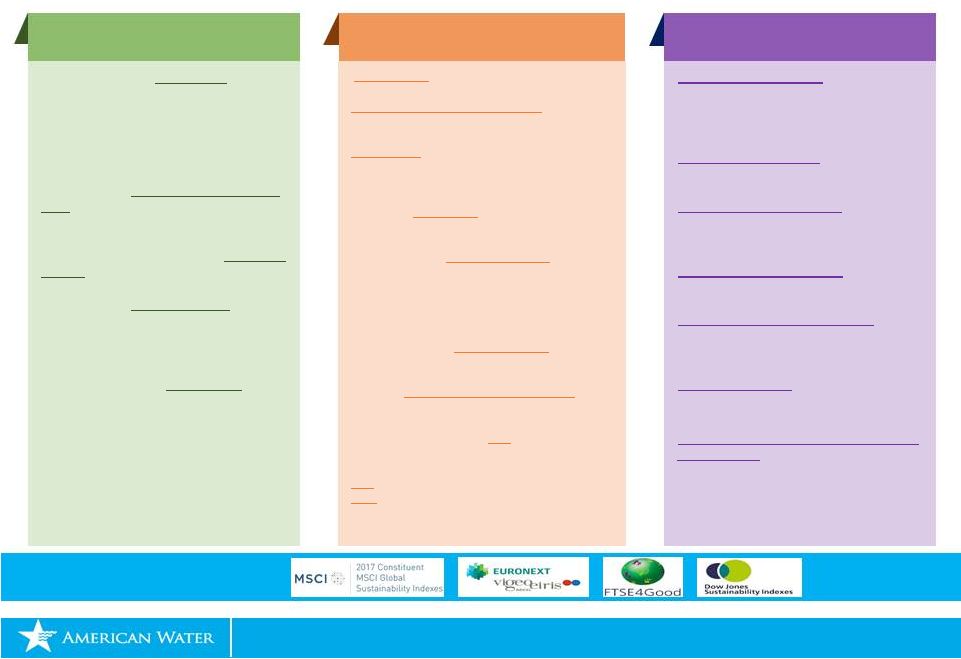 NYSE: AWK December 2017 Our Company is a Perfect Fit for ESG Investors www.amwater.com 7 AWK Members of: Environmental •Investing five-year $7.2 billion regulated
cap ex over 5 years to: address aging
infrastructure; reduce/eliminate leaks;
improve cyber/physical security; and
increase resiliency of critical assets to
climate variability
•Setting goal of reducing GHG
emissions 40% by 2025 from 2007 baseline, after achieving 25% reduction through 2017 •Reducing annual water use by 3.5 billion
gallons through conservation •Recycling over 2 billion gallons water
annually and producing reuse water at
more than 39 facilities
•Prioritizing R&D efforts in water quality
and technology with 15
scientists dedicated to research
Social Responsibility
• 60,000 hours of
annual employee safety training •Top Quartile Customer Satisfaction
in the water
industry •$387 million annual spend w/ Tier 1 Diverse
Suppliers; Supply Chain dedicated to Human
Rights •More than 4,000 hours of company-sponsored community service annually by employees •Donating around $750,000 annually to
communities we serve from company-funded
American Water Charitable Foundation
•Ensuring a diverse, inclusive culture
characterized by respect and dignity of every
employee through “tone at the
top” and
required training
•Frequent employee engagement
surveys with
formalized employee action teams
•As of November 1, 2017,
48% of workforce is in
jobs represented by unions
•88%
of diverse job candidate pools in 2016 with
62% of transfers/promotions filled by minority, female, veteran or disabled individuals Governance •Achieving gender parity: highest number of female board members among S&P 500 companies in 2016; currently at 57% female •Ensuring independence: board is led by an independent, non-executive chair •Refreshing board a priority:
average director tenure is 7.2 years as of November 30, 2017 •Engaging board sufficiently:
board met 13 times in 2016 •Educating and developing board:
formal director education program with dedicated funding •Engaging investors: robust program for management and board leadership •Executive and director stock ownership
requirements:
align with long-term
interests of our stockholders
|
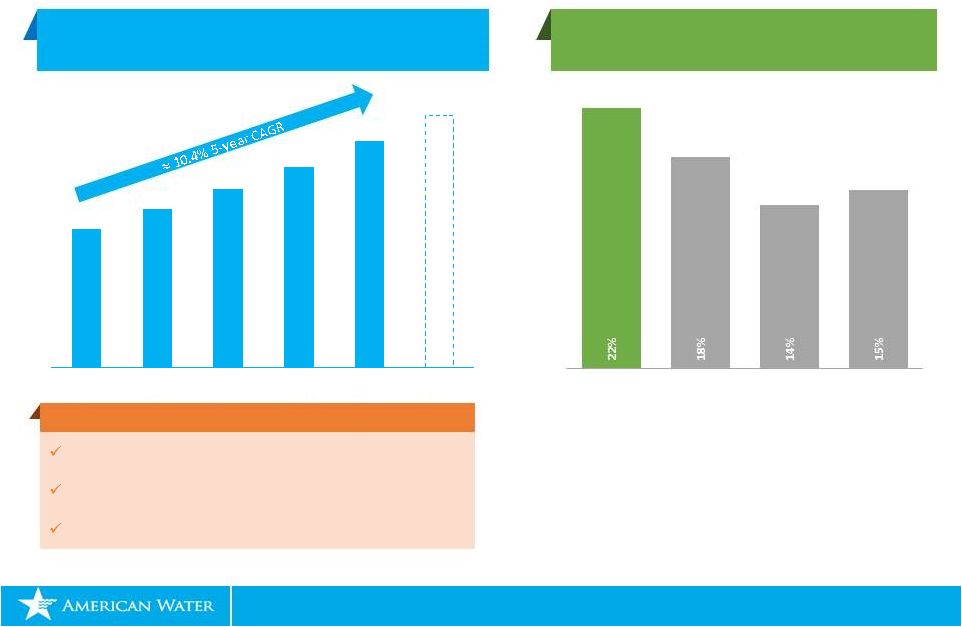
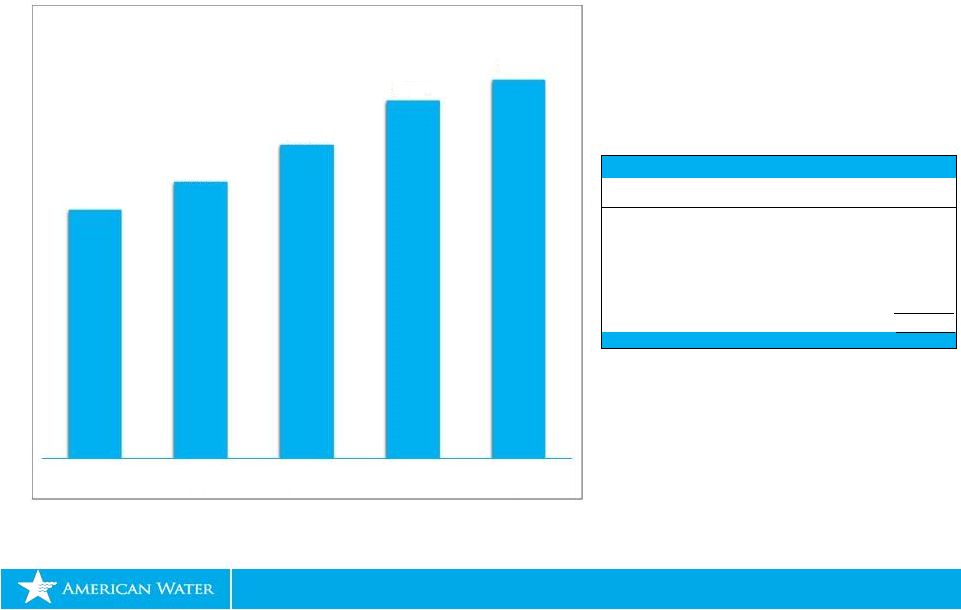
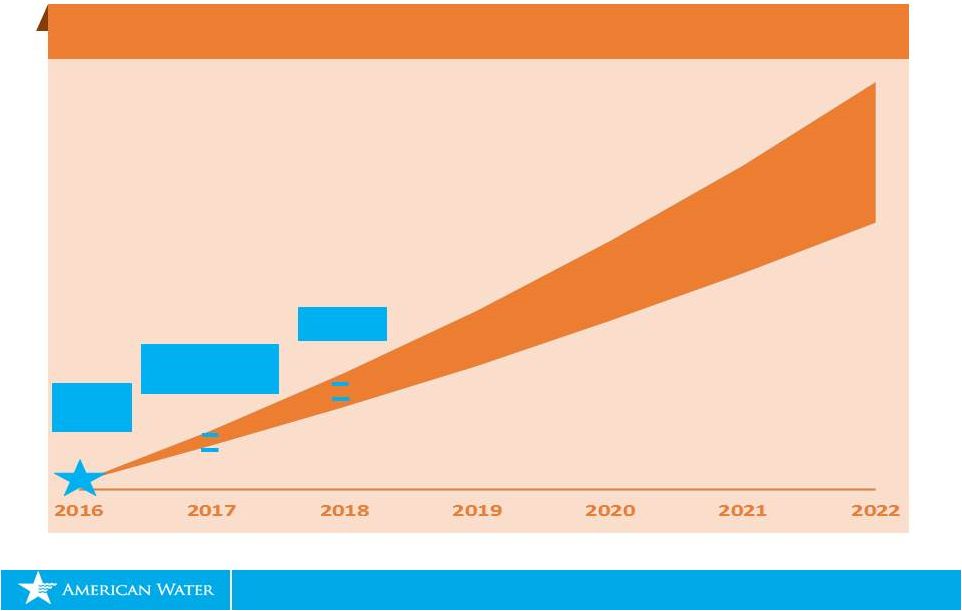 NYSE: AWK December 2017 American Water will Continue to be a High Growth Utility www.amwater.com 8 Long Term Adjusted Earnings Per Share Growth CAGR Target of 7-10%** continues through 2022 $3.32 $3.22 $2.84 2018 Guidance $3.06 $3.00 2017 Adjusted Guidance (GAAP Guidance $3.05 – 3.11)* 7-10%** CAGR Range * Adjusted EPS is a Non-GAAP measure. Please see appendix for reconciliation and further information.
** Anchored off of 2016 Adjusted EPS (a non-GAAP measure).
2016 Adjusted
EPS (GAAP EPS $2.62)* |
 NYSE: AWK www.amwater.com 9 The Regulated Business Walter Lynch Chief Operating Officer |
 NYSE: AWK December 2017 www.amwater.com 10 Our Story Works… Our Regulated Story Works…and We Execute on Our Strategies! • Continued Infrastructure Investment • Drive Legislation & Regulation to Enable Acquisitions • Leader in Balancing Investment, Service, and Affordability We Execute… $7.2 Billion Five Year Regulated Capital Plan $1.3 Billion increase to better serve customers, address emerging contaminants and climate variability, while keeping customer bill increase to ~3.2% Provides Competitive advantage Expands wastewater footprint where we serve water $0.6 - $1.2 Billion for Regulated Acquisitions New 32.0%* O&M Efficiency Target by 2022 Working Towards “Amazon-like” experience Customer focused technology • Industry Leader in Water Quality 15 R&D scientists (includes 8 PhDs) Growing partnership in emerging contaminants Source water monitoring *Non-GAAP measure. O&M Efficiency Ratio = Adjusted Regulated O&M Expenses (O&M Expenses is most comparable GAAP
measure) / Adjusted Regulated Operating Revenues (Operating Revenues is most comparable GAAP measure). This calculation assumes purchased water revenues approximate purchased water expenses. A reconciliation to a most comparable forward-looking GAAP measure is not available without unreasonable effort. |
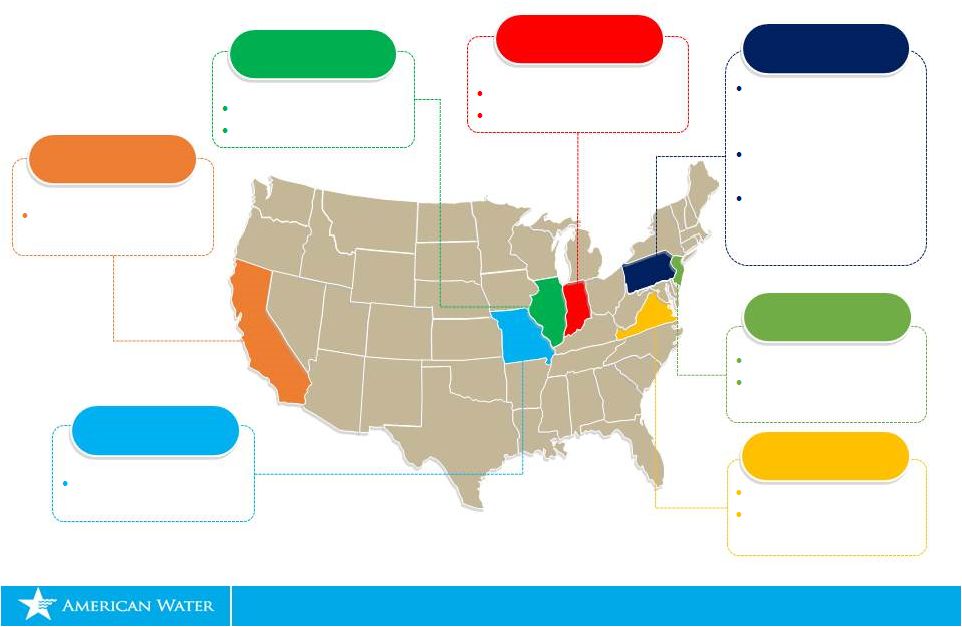
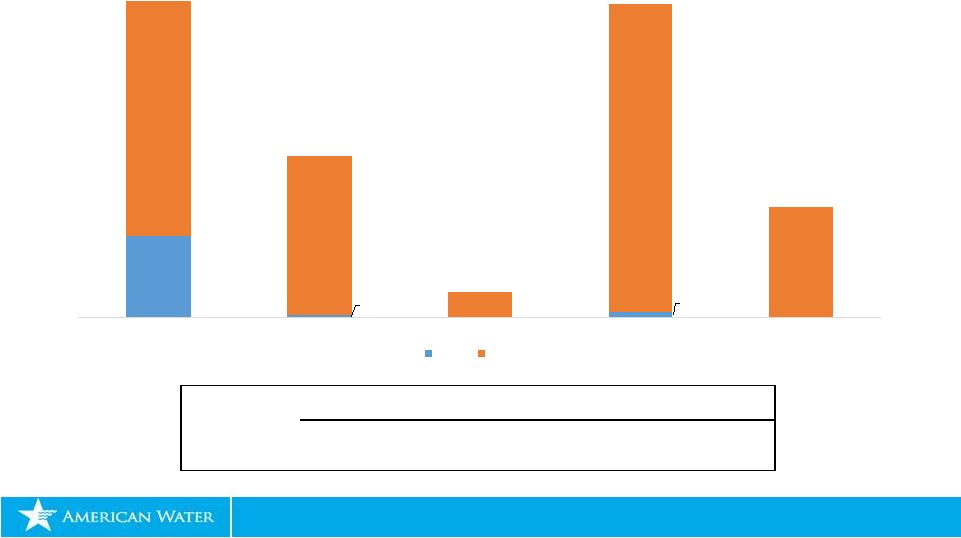
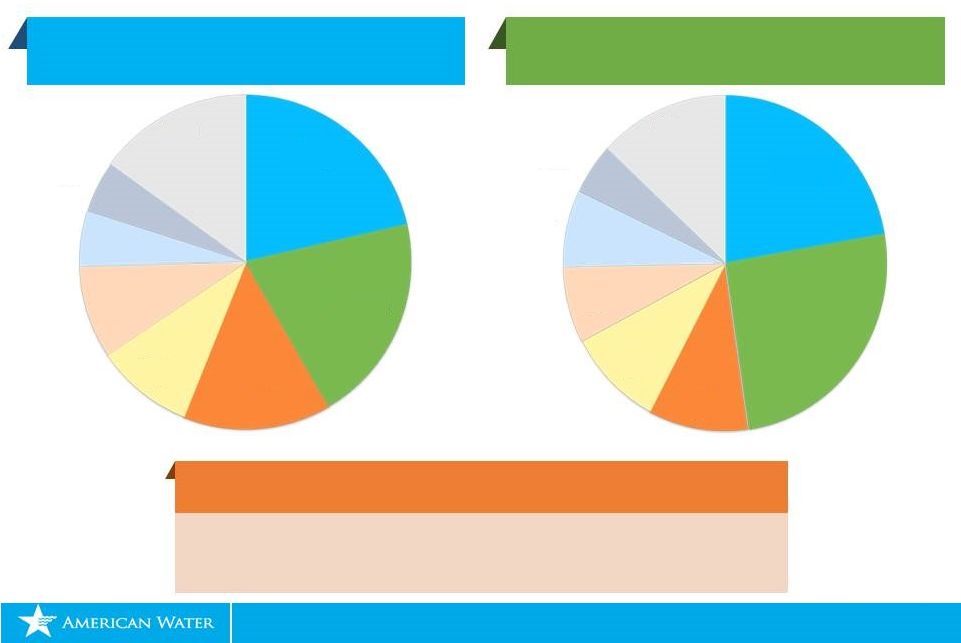 NYSE: AWK December 2017 The Leading Investor Owned Water Utility Company www.amwater.com 11 • 16 Regulated States • 3.3 Million Total Customer Connections Our Regulated Footprint • 1,600 Communities Served • 1 Billion Gallons of Water Treated and Delivered Daily Total Customer Connections As of December 31, 2016 (in Thousands) 2016 Regulated Revenues (in Millions) Pennsylvania, 709 New Jersey, 671 Missouri, 476 Illinois, 315 Indiana, 300 California, 176 West Virginia, 168 Other, 497 Pennsylvania, $639 New Jersey, $730 Missouri, $288 Illinois, $275 Indiana, $212 California, $211 West Virginia, $142 Other, $374 |
 NYSE: AWK December 2017 U.S. Water & Wastewater Infrastructure Faces Multi-Decade Investment Needs www.amwater.com 12 2018-2022 Plan |
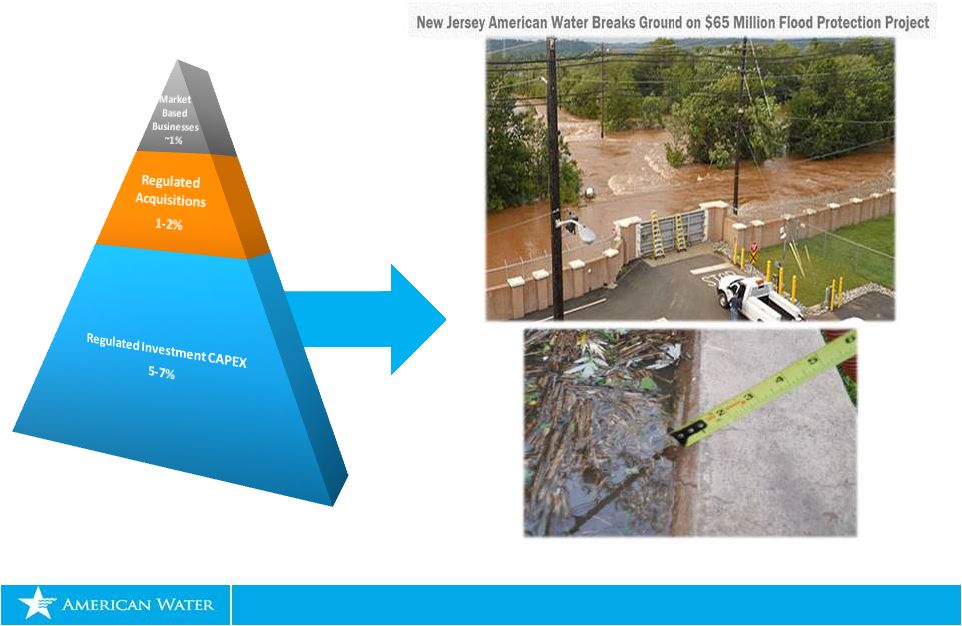
 NYSE: AWK December 2017 www.amwater.com 13 Regulated Investment: $8.0 - $8.6 Billion of Investments from 2018 – 2022; $7.2 Billion for Regulated Systems 2018-2022 Capital Expenditure by Category (In $ Billions) Why the Additional $1.3 Billion of Infrastructure Spend $8.0 - $8.6 Regulated System Investments Regulated Acquisition Strategic Capital $0.2 $0.6 - $1.2 $7.2 Continue addressing water and wastewater infrastructure challenges Increasing water quality complexities with emerging contaminants Resiliency and climate variability Source water protection Continued Smooth Deployment of Capital |
 NYSE: AWK December 2017 O&M Efficiency Target 32.0%* by 2022 Supply Chain Cost Management www.amwater.com 14 Regulated Investment: Leveraging Our Competencies for Customer Benefits * Non-GAAP measure. O&M Efficiency Ratio = Adjusted Regulated O&M Expenses (O&M Expenses is most comparable GAAP
measure) / Adjusted Regulated Operating Revenues (Operating Revenues is most comparable GAAP measure). This calculation assumes purchased water revenues approximate purchased water expenses. A reconciliation to a most
comparable forward-looking GAAP measure is not available without unreasonable effort. Capital Efficiency Technology Value Engineering National Purchasing Power Opportunity to Increase Capex and Minimize Customer Bill Increases |
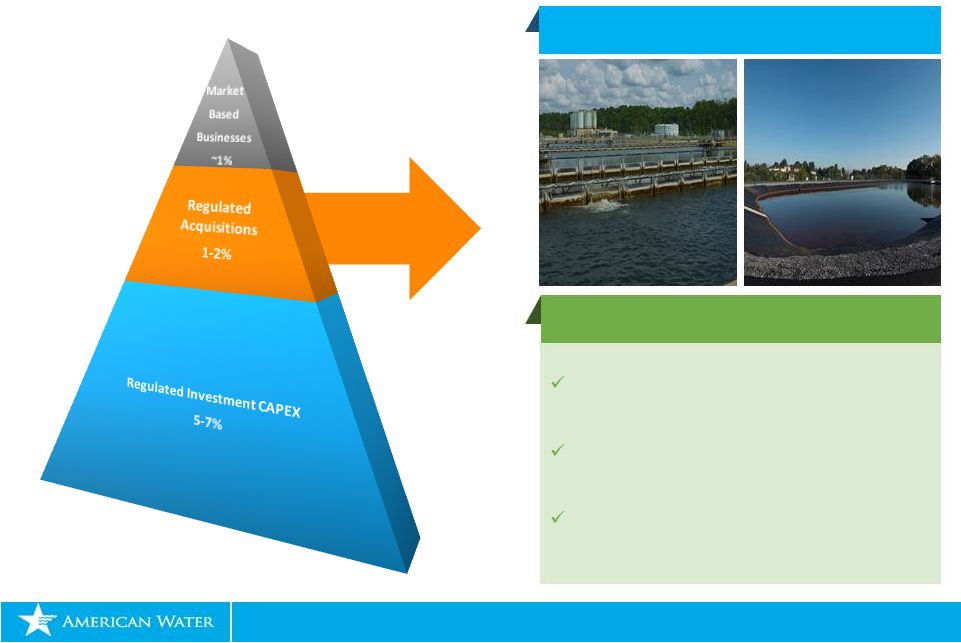 NYSE: AWK December 2017 www.amwater.com 15 Regulated Acquisitions: Highly Fragmented Water Industry Creates Opportunity Water Investor Owned 16% Public & Other 84% Wastewater Investor Owned 2% Public & Other 98% Industry Opportunity American Water Footprint Ideal Fit for Industry Consolidation Opportunities Target 5k – 30k Customer Connections Per Acquisition Wastewater Focus (Customer Connections Mix – 95% Water & 5% Wasterwater) 2018-2022 Plan |
 NYSE: AWK December 2017 Regulated Acquisitions: State Legislation that Enables with Water & Wastewater System Consolidation www.amwater.com 16 California 1997 Fair Market Value New Jersey 2015 & 2017 Fair Market Value Water Quality Accountability Act Pennsylvania 2012 & 2016 Water & Wastewater Revenue Requirement Consolidation Fair Market Value & Post Acquisition Deferral Clarifying Combined Stormwater Systems as Wastewater Missouri 2013 Fair Market Value Illinois 2013 Fair Market Value Post Acquisition Deferrals Indiana 2015 & 2016 Fair Market Value Fair Market Value Expansion Virginia 2017 Water Rate Consolidation Wastewater Rate Consolidation |
 NYSE: AWK December 2017 www.amwater.com 17 Selected Upcoming Acquisition Opportunities Regulated Acquisitions: Adding Customers Through Acquisitions and Organic Growth Over 330,000 Customer Connection Opportunities in Development Customer Additions from Organic Growth and Closed Acquisitions 2014 – 2017 (with McKeesport close by year end)* Approximate Customers Target A 30,000 Target B 30,000 Target C 23,200 Target D 20,800 Target E 20,100 Target F 16,500 Target G 14,500 *2017 Organic growth through September 30, 2017 of 10,400 plus an estimated 1,100 additional customers per month for the last 3 months of 2017 ** The McKeesport, PA acquisition, represents 22,000 customers, due to bulk contracts. Connections to the system will be
approximately 11,000 We also have ~
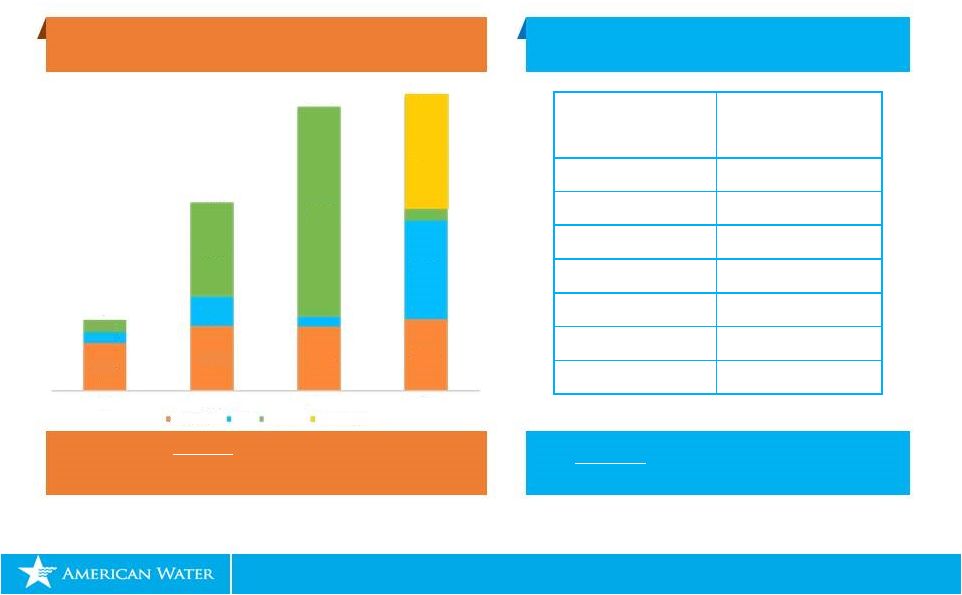
23,500 pending customer acquisitions with McKeesport close by year end (45,500 without McKeesport close by year end) ** 9,279 12,571 12,546 13,891 2,100 5,700 1,866 19,159 2,400 18,200 40,329 2,156 22,000 13,779 36,471 54,741 57,206 2014 2015 2016 2017 Organic Growth Water Wastewater McKeesport close |
 NYSE: AWK www.amwater.com 18 Our Financial Plan Linda Sullivan Chief Financial Officer |
 NYSE: AWK December 2017 www.amwater.com 19 Our Story Works… Our Story Works…and We Deliver on Our Strategies! • A Business Model that Works • A More Regulated Risk Profile We Deliver… Affirm 2017 Adjusted EPS Guidance* Strong 2018 EPS Guidance Continued 7 – 10%** Long Term EPS CAGR Regulated: $8.0-$8.6 billion needed investment drives more regulated business mix while keeping average customer bill increase to ~3.2% Market-based: strong portfolio growth, capital light and cash flow positive • A Strong Balance Sheet Strong Cash Flow Plan assumes no new equity under normal operating conditions • Tax Reform Under Review Lower tax rates could benefit our customers • A Top Quartile Dividend Grower Five consecutive years with ~10% growth Expect to grow dividend at top of long term adjusted EPS growth** Target payout ratio 50-60% of earnings * Adjusted EPS is a Non-GAAP measure. Please see appendix for reconciliation and further
information. **
Anchored off of 2016 Adjusted EPS (a non-GAAP measure). |
 NYSE: AWK December 2017 www.amwater.com 20 Long Term Adjusted Earnings Per Share Growth CAGR Target of 7-10%** continues through 2022 American Water Continues to be a High Growth Utility $3.32 $3.22 $2.84 2018 Guidance Earnings Guidance and Anchor Affirm 2017 EPS Guidance range GAAP: $3.05 - $3.11 Adjusted: $3.00 - 3.06* 2018 EPS Guidance $3.22 - $3.32 8% growth over midpoint of 2017 adjusted guidance** Continue Long Term Adjusted EPS CAGR of 7 – 10%** Anchor moved to 2016 Adjusted EPS* $3.06 $3.00 7-10%** CAGR Range 2017 Adjusted Guidance (GAAP Guidance $3.05 – 3.11)* 2016 Adjusted EPS (GAAP EPS $2.62)* * Adjusted EPS is a Non-GAAP measure. Please see appendix for reconciliation and further information.
** Anchored off of 2016 Adjusted EPS (a non-GAAP measure).
2016 2017 2018 2019 2020 2021 2022 |
 NYSE: AWK December 2017 Our 2018 Guidance and Major Variables Included in the Range www.amwater.com 21 *Revised 2017 EPS GAAP guidance $3.05-$3.11. Adjusted 2017 EPS guidance is a non-GAAP measure.
Please see appendix for reconciliation and further information. 2018 Guidance Major Variables 2018 Guidance $3.22 - $3.32 EPS $3.00 - $3.06 $3.22 - $3.32 $0.18 - $0.20 $0.02 - $0.04 $0.02 2017 Adjusted Guidance (Non-GAAP Measure)* Regulated Businesses Market-based Businesses Parent & Other 2018 Guidance ($0.01) ($0.02) ($0.03) ($0.07) $0.01 $0.02 $0.03 $0.07 Keystone AWE Regulated Weather |
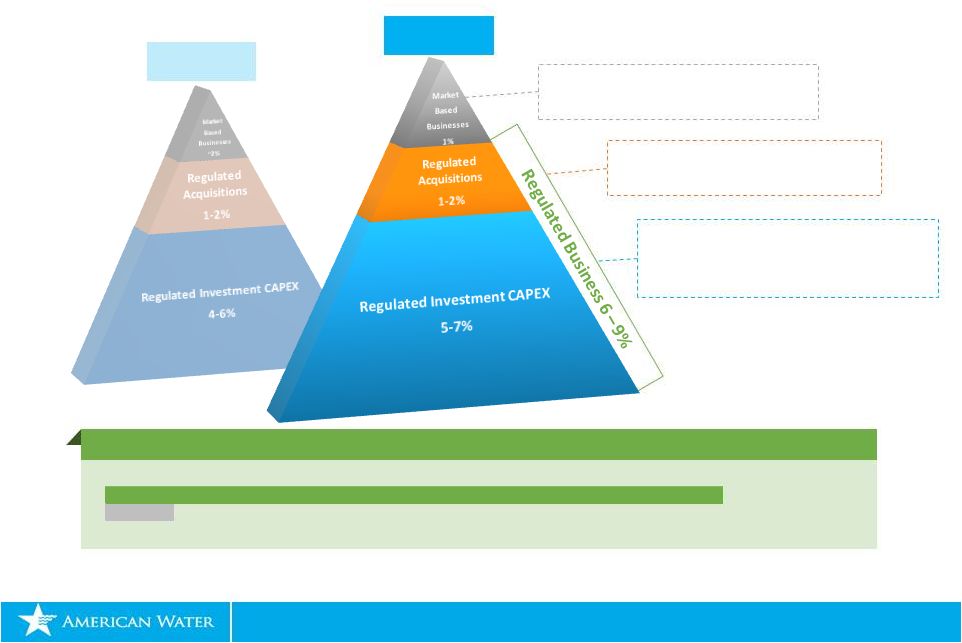 NYSE: AWK December 2017 2022 Estimated Earnings Contribution Ratio 4 Regulated 90% Market-based 10% Needed Infrastructure Investment Transitions us to an Even More Regulated Risk Profile www.amwater.com 22 1 Anchored off of 2015 EPS. 2 Anchored off of 2016 Adjusted EPS (a non-GAAP measure). 3 Based on 2018 – 2022 plan and anchored off of 2016 business line results. 4 Approximate. Excludes parent and other. 2017-2021 Plan 7 – 10% CAGR¹ 2018-2022 Plan 7 – 10% CAGR² Continued strong growth at stand-alone CAGR of 15.5%³ Customer additions remain at ~30-60k per year Increase of $1.3 billion in needed capital to better serve our customers and keep bills affordable |
 NYSE: AWK December 2017 www.amwater.com 23 Increased Capital Expenditures Drives Stronger Rate Base Growth Enhanced Regulated Risk Characteristics Rate Base CAGR Based on $8.0 - $8.6 Billion Capital Plan 5 – 6% 6.5 – 7.5% Highlights Capital increase to better serve customers results in ~100 basis point increase in rate base CAGR Target O&M efficiency ratio of 32.0%* by 2022 helps keep customer bills affordable * Non-GAAP measure. O&M Efficiency Ratio = Adjusted Regulated O&M Expenses (O&M Expenses is most comparable GAAP
measure) / Adjusted Regulated Operating Revenues (Operating Revenues is most comparable GAAP measure). This calculation assumes purchased water revenues approximate purchased water expenses. A reconciliation to a most
comparable forward-looking GAAP measure is not available without unreasonable effort. 2017 - 2021 Plan 2018 - 2022 Plan Economy of Scale Regulatory Diversity Decades of Capital Needs Mechanisms Accelerate Investment Recovery Low Volatility of Capital Deployment Enabling Legislation |
 NYSE: AWK December 2017 www.amwater.com 24 Market-Based Businesses Continue to Provide Strategic Value Managed Portfolio Risk Complementary water and wastewater services Leverage core competencies Capital light, cash positive Competitive culture Market-Based Risk Characteristics Military Services Group Homeowners Services Group Keystone Three
Primary Businesses Highlights 15.5%* Stand Alone Growth CAGR Cash Flow Positive Businesses Help to Support Growth Leverage Size and Scale * Based on 2018 – 2022 plan and anchored off of 2016 business line results. |
 NYSE: AWK December 2017 www.amwater.com 25 Long Term Plan Utilizes Strong Balance Sheet Cash Flow from Operations Debt to Total Capital $8.0 to $8.6 Billion CapEx Range* *Includes both fixed rate and short term debt. E denotes estimated. Cash Flow Remains Strong Federal NOL of $1.2 billion is projected by the end of 2017 Federal NOL position continues through 2021 assuming no tax reform Maintain Strong Balance Sheet Utilize balance sheet No significant debt maturities over next five years Leverage increase to a range of 59% - 60% by 2022 $0.0 $0.5 $1.0 $1.5 2016 A 2017 E 2018 E 2019 E 2020 E 2021E 2022 E 58% 59% - 60% As of 9/30/2017 2022 E |
 NYSE: AWK December 2017 Tax Reform Remains Uncertain www.amwater.com 26 House Bill Tax Rate • 20% corporate tax rate in 2018 • Normalization of excess deferred taxes for regulated businesses Interest Deductibility/ Accelerated Depreciation • Potential interest expense deduction limits 30% EBITDA test • Carve out for regulated utilities Senate Bill Tax Rate • 20% corporate tax rate in 2019 • Normalization of excess deferred taxes for regulated businesses Interest Deductibility/ Accelerated Depreciation • Potential interest expense deduction limits 30% EBIT test • Carve out for regulated utilities Potential Impacts Tax Rate • Benefits regulated customers • Lowers cash flow and FFO/Debt • Increases MBB earnings; military contracts true-up • Increases loss at parent • Deferred taxes re-measured Regulated normalized Rate Base increased MBB/Parent impacts earnings • Accelerates timing of becoming cash taxpayer Interest Deductibility/ Accelerated Depreciation • Regulated carve out keeps interest deduction, does not allow accelerated depreciation • Parent interest uncertain |
 NYSE: AWK December 2017 www.amwater.com 27 $1.09 $1.21 $1.33 $1.47 $1.62 2013 2014 2015 2016 2017 2018 E A Top Leader in Dividend Growth and Total Shareholder Return Five Consecutive Years of ~10% Dividend Growth 1 1 The dividend normally paid in 1Q 2013 was actually accelerated and paid in late December 2012 to allow
shareholders to take advantage of 2012 dividend tax rates. For the purposes of
this presentation, this $0.25 dividend has been deducted from
2012 and added to 2013 to show the more normal dividend trend.
2 Subject to approval by the Board of Directors 3 Anchored off of 2016 Adjusted EPS (a non-GAAP measure) 4 As of 11-01-2017 end date. Source: Bloomberg 5 Bloomberg custom portfolio weighted by market cap. Water Peers: AWR, CTWS, CWCO, CWT, MSEX, SJW, WTR,
YORW Expect 2018 Dividend to grow at top end of long term EPS growth CAGR for fifth consecutive year Targeted Long Term Dividend Growth CAGR at top end of 7- 10% long term adjusted EPS growth³ Target payout ratio 50-60% of earnings Annualized 5-Year Total Shareholder Return 4 AWK Water Peers DJUA S&P 500 5 2 Highlights |
 NYSE: AWK www.amwater.com 28 Wrap Up Susan Story President and Chief Executive Officer |
 NYSE: AWK December 2017 www.amwater.com 29 American Water Continues to be a High Growth Utility - Today’s Key Takeaways Maintaining 7 – 10%* five-year EPS CAGR, affirming narrowed 2017 adjusted EPS range, and setting 2018 EPS Guidance at $3.22 - $3.32 Investing an expected $8.0 - $8.6 billion over the next 5 years with continuing focus on customer affordability Reinforcing that our market-based businesses provide growth, strategic value and positive cash flow Delivering a more regulated business mix and risk profile Expecting to grow our dividend at high end of the long-term 7 – 10%* adjusted EPS growth * Anchored off of 2016 Adjusted EPS (a non-GAAP measure). 2018-2022 Plan |
 NYSE: AWK www.amwater.com 30 “American Water - your calm in the middle of the storms.” |
 NYSE: AWK December 2017 31 Q & A Session |
 NYSE: AWK www.amwater.com 32 Investor Relations Contacts Ed Vallejo Vice President, Investor Relations edward.vallejo@amwater.com Ralph Jedlicka Director, Investor Relations ralph.jedlicka@amwater.com Upcoming Events: February 21, 2018 Q4 and Year-End 2017 Earnings Call December 11, 2018 2018 Analyst Day, New HQ in Camden, NJ |
 Appendix NYSE: AWK |
 NYSE: AWK December 2017 www.amwater.com 34 Non-GAAP Financial Information This presentation includes adjusted earnings per diluted common share (“Adjusted EPS”) both as 2017 non-GAAP earnings
guidance and as the 2016 EPS
compound annual growth rate anchor, which constitute “non-GAAP financial
measures” under SEC rules. These non-GAAP financial measures are derived from American Water’s consolidated financial information but are not presented in its financial statements prepared in accordance with
GAAP. Adjusted EPS as 2017 non-GAAP earnings guidance is defined
as 2017 GAAP earnings per diluted common share (“GAAP EPS”), excluding the impact in the third quarter of 2017 of (1) the insurance settlement related to the Freedom Industries chemical spill and (2) the early extinguishment of debt
at the parent company. Adjusted EPS as the 2016 EPS compound
annual growth rate anchor is defined as 2016 GAAP EPS, excluding the impact in the third quarter of 2016 of the binding agreement in principle to settle claims related to the Freedom Industries chemical spill. Adjusted EPS supplements
American Water’s GAAP disclosures and should not be considered
as an alternative to the GAAP measure. Management believes that the
presentation of these non-GAAP financial measures are useful to American Water’s investors because they provide an indication of its baseline performance excluding items that are not considered by management to be reflective of ongoing operating results.
Although management uses these non-GAAP financial measures
internally to evaluate American Water’s results of operations, management does not intend results excluding the adjustments to represent results as defined by GAAP, and the reader should not consider them as indicators of performance.
These items are derived from American Water’s consolidated
financial information but are not presented in its financial statements prepared in accordance with GAAP. The company’s definitions of Adjusted EPS may not be comparable to the same or similar measures used by other companies, and,
accordingly, these non-GAAP financial measures may have
significant limitations on their use. This presentation also
includes regulated O&M efficiency ratios, both historical and forward-looking, which excludes from their calculation for each period presented one or more items, including estimated purchased water revenues and purchased water expenses, the impact of certain
activities related to the Freedom Industries chemical spill, and
the allocable portion of non-O&M support services costs, mainly depreciation and general taxes. These O&M efficiency ratios constitute “non-GAAP financial measures” under SEC rules. These ratios are derived from
American Water’s consolidated financial information but are
not presented in its financial statements prepared in accordance with GAAP. These non-GAAP financial measures supplement and should be read in conjunction with American Water’s GAAP disclosures and should not be considered an alternative to
GAAP measures. Management believes that the presentation of
regulated O&M efficiency ratios is useful to investors because it provides a means of evaluating American Water’s operating performance without giving effect to items that are not reflective of management’s ability to increase
efficiency of American Water’s regulated operations. In
preparing operating plans, budgets and forecasts, and in assessing historical and future performance, management relies, in part, on trends in American Water’s historical results and predictions of future results, exclusive of these items. American Water’s
definition of these ratios may not be comparable to the same or
similar measures used by other companies, and, accordingly, these non-GAAP financial measures may have significant limitations on their use. American Water is unable to present a reconciliation of adjustments to the components of its
forward-looking O&M efficiency ratio without unreasonable
effort because management cannot reliably predict the nature, amount or probable significance of all the adjustments for future periods; however, these adjustments may, individually or in the aggregate, cause the non-GAAP financial measure
component of the forward-looking ratio to differ significantly
from its most directly comparable GAAP financial measure. Set forth
in this appendix are tables that reconcile Adjusted EPS as 2017 non-GAAP earnings guidance and as the 2016 EPS compound annual growth rate anchor, each to GAAP EPS, and each of the components of its historical O&M efficiency ratios to its most directly comparable GAAP
financial measure. |
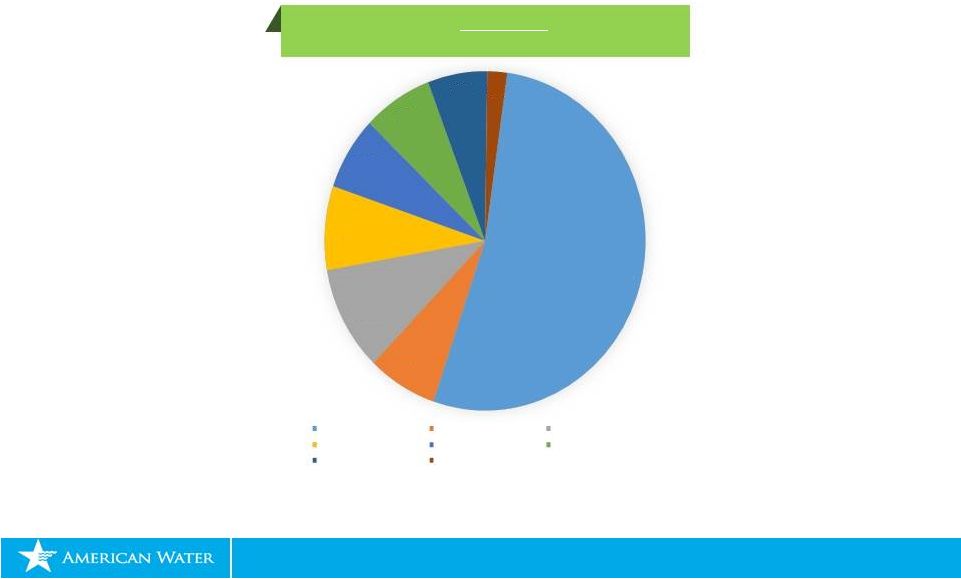 NYSE: AWK December 2017 www.amwater.com 35 Our Regulated Infrastructure Investment Five-Year Plan 2018 – 2022 Regulated System Investment by Purpose of the $7.2 Billion 53% 7% 10% 8% 7% 7% 6% 2% Asset Renewal Asset Renewal-Lead Service Lines Organic Growth Regulatory compliance Reliability/Quality of Service Efficiency Operational Support Other |
 NYSE: AWK December 2017 www.amwater.com 36 Our Five-Year Debt Maturity Schedule $225 $152 $24 $295 $105 $77 $2 $5 2018 2019 2020 2021 2022 Parent Regulated $302 $154 $300 Next 5 years 2018-2022 Outstanding ($ in millions) Avg Remaining Life (years) Weighted Avg Interest Rate Parent $85 1.2 5.63% Regulated $800 2.5 5.89% Total $885 2.4 5.87% |
 NYSE: AWK December 2017 www.amwater.com 37 Rate Filings Awaiting Final Order Rate Cases Filed Company Docket / Case Number Date Filed Revenue Increase ROE Requested Rate Base California Case No. A.16-07-002 7/1/2016 $32 (a) NA $494 Missouri Case No. WR-2017-0285 6/30/2017 $84 (b) 10.80% $1,345 New Jersey Case No. WR-17090985 9/15/2017 $129 10.80% $3,025 $245 $4,864 Infrastructure Charges Filed New Jersey (DSIC) 10/13/2017 $4 $29 Virgina (WWISC) 10/31/2017 $1 $9 Tennessee (QIIP, EDI, SEC) 11/7/2017 $2 $12 $7 $97 Rate Case and Infrastructue Settlements awaiting Regulatory Approval West Virginia (DSIC) 6/15/2017 $3 (c) $3 Total Awaiting Final Order: $255 (a) For this final application, Test Year 2018 revenue requirement request is $35 million. This excludes the step rate and
attrition rate increase for 2019 and 2020 of $9 million and $8
million, respectively. The total revenue requirement request for the three year rate case cycle is $51 million. On October 10, 2016, the Company filed an update to our final
general rate case application adjusting the request to $32 million of
additional annualized revenues. It also includes increases in the escalation year 2019 and the attrition year 2020 of $9 million and $8 million, respectively. (b) The requested increase is $89 million, which includes the original $5 million from the pending ISRS. This amount is a requested
increase of $69 million over the prior authorized revenues, which
is the difference between the filed for $369 million revenue requirement and the previously authorized $295 million revenue requirement, less original $5 million of pending ISRS.
(c) On October 11, 2017, our West Virginia subsidiary filed a settlement
agreement with the Public Service Commission (PSC) of West Virginia, whereby all parties to the proceeding have agreed to an infrastructure surcharge that would generate $3 million in additional annualized revenues, pending approval by
the PSC. |
 NYSE: AWK December 2017 www.amwater.com 38 Regulated Utilities: Rate Base & Authorized Return on Equity Authorized Rate Base* $439,448 $883,386 $841,915 (b) $405,704 (b) $1,132,843 (b) Authorized ROE 9.99% (a) 9.79% 9.75% 9.70% (e) 9.75% (e) Authorized Equity 53.00% (a) 49.80% 41.55% (c) 47.36% (d) 50.04% (d) Effective Date of Rate Case 1/1/2015 (a) 1/1/2017 1/29/2015 8/28/2016 7/20 & 7/22/2016 Authorized Rate Base* $2,386,790 $275,463 $3,162,597 (b) $155,747 $529,212 Authorized ROE 9.75% 9.10% 10.00% (e) 9.25% 9.75% Authorized Equity 52.00% 46.00% 53.75% (d) 46.09% 45.84% Effective Date of Rate Case 9/21/2015 6/1/2017 1/1/2018 5/24/2017 (f) 2/25/2016 *Rate Base stated in $000s Notes: a) CA received D.15-04-007 on April 9, 2015. The decision, addressing the revenue requirement, is retroactive to
1/1/2015. CA has a separate Cost of Capital case which sets
the rate of return outside of a general rate proceeding and is still under the decision issued July 12, 2012. The next Cost of Capital application, A.17-04-003 was filed April 3, 2017 with a projected effective date in 2018.
b) The Rate Base listed is the Company's view of the Rate Base allowed in the
case, the Rate Base was not disclosed in the Order or the
applicable settlement agreement.
c) Regulatory capital structure includes cost-free items or tax credit
balances at the overall rate of return which lowers the equity percentage as an alternative to the common practice of deducting such items from rate base. d) The equity ratio listed is the Company's view of the equity ratio allowed in the case, the actual equity ratio was not disclosed in
the Order or the applicable settlement agreement.
e) The ROE listed is the Company's view of the ROE allowed in the case, the ROE
was not disclosed in the Order or the applicable settlement
agreement. f) Interim rates were effective April 1, 2016 and
received final Order May 24, 2017. Last Rate Case Awarded -
Largest Regulated Subsidiaries |
 NYSE: AWK December 2017 How American Water Grows Earnings: Rate of Return Regulation in the United States www.amwater.com 39 Prudent Investment Drives Need for Rate Cases Operating Expenses Taxes, Depr & Amortization WACC Establish Rate Base Allowed Return Allowed Return Revenue Requirement Step 2 Step 1 + + x = = American Water has experience in securing appropriate rates of return and
promoting constructive regulatory frameworks
|
    NYSE: AWK December 2017 www.amwater.com 40 How O&M Efficiency Translates to Investment Growth Saving $1 in opex vs investing $7 in capital at allowed ROE, keeps customer bills neutral and can create $0.35 in
sustainable earnings
a) Revenue Requirement
1.00 $
1.00 $
Expenses O&M 0.96 - $
Depreciation - 0.18 $
2 Interest Expense - 0.17 $
3 Property & General Taxes 0.04 1 0.08 $
4 b) Total Expenses 1.00 0.43 $
c) Operating Income (=a-b)
- 0.57 $
d) Federal & State Income Taxes
- 0.22 $
5 e) Net Income to Shareholder (=c-d) - $
0.35 $
6 1 Assumes 4% taxes on revenue (gross receipts e.g.) 2 Assumes 2.5% depreciation expense 3 Assumes 50.2% debt financing at 4.9% 4 Assumes property taxes on invested capital of 0.5% and revenue taxes of 4% 5 Assumes effective income tax rate of 39.2% 6 Assumes authorized ROE of 9.9% on 49.8% equity Expense Savings Invested Capital $1 > $7 |
 NYSE: AWK December 2017 www.amwater.com 41 Rate Base Calculation * * An approximation of rate base, which includes Net Utility Plant not yet included in rate base pending rate case
filings/outcomes $8,958
$9,398 $9,987 $10,694 $11,023 FY 2013 FY 2014 FY 2015 FY 2016 As of 9/30/2017 As of 9/30/2017 $15,451 279 1,264 2,862 23 $4,428 TOTAL $11,023 Rate Base Net Deferred income taxes Deferred investment tax credits Sub Total Less Advances for Construction CIAC – Contributions in Aid of Construction Estimated Rate Base * Net Utility Plant ($ in millions) |
 NYSE: AWK December 2017 www.amwater.com 42 Reconciliation Tables: 2016 Earnings per Share & 2017 Guidance Range Full Year 2016 Diluted earnings per share (GAAP): Net income attributable to common stockholders $ 2.62 Non-GAAP adjustments: Impact of Freedom Industries Binding Global Agreement in Principle 0.36 Income tax impact (0.14) Net non-GAAP adjustment 0.22 Total net non-GAAP adjustments 0.22 Adjusted diluted earnings per share (non-GAAP) $ 2.84 Earnings per Share 2017 Adjusted EPS Guidance Range Low End High End Per Diluted Share: Narrowed earnings guidance range (GAAP) 3.05 $ 3.11 $ Non-GAAP adjustments: Impact of Freedom Industries settlement activities (0.12) (0.12) Income tax impact 0.05 0.05 Net non-GAAP adjustment (0.07) (0.07) Early debt extinguishment at the parent company 0.03 0.03 Income tax impact (0.01) (0.01) Net non-GAAP adjustment 0.02 0.02 Total net non-GAAP adjustments (0.05) (0.05) Narrowed adjusted earnings guidance range (non-GAAP) 3.00 3.06 $ $ $ $ |
 December 2017
NYSE: AWK www.amwater.com 43 Closed and Pending Acquisitions as of November 30, 2017 * State No. of Acquisitions Water Customers Wastewater Customers Total Customers California 2 1,764 - 1,764 Indiana 1 1,300 - 1,300 Iowa 1 718 - 718 Illinois 3 700 120 820 Missouri 3 500 434 934 New Jersey 1 11,212 - 11,212 New York 5 360 - 360 West Virginia 1 215 - 215 Total 17 16,769 554 17,323 2017 Closed Acquisitions State No. of Acquisitions Water Customers Wastewater Customers Total Customers California 4 8,629 - 8,629 Illinois 5 2,448 2,306 4,754 Indiana 2 6,165 - 6,165 Kentucky 1 610 - 610 Pennsylvania 3 - 25,062 25,062 Missouri 4 176 192 368 Total 19 18,028 27,560 45,588 Pending Acquisitions *This includes the McKeesport, PA acquisition, which represents 22,000 customers, due to bulk
contracts. Connections to the system will be approximately 11,000. |