Attached files
| file | filename |
|---|---|
| EX-24 - EXHIBIT 24 - LEE ENTERPRISES, Inc | lee2017ex24poa09242017.htm |
| EX-32 - EXHIBIT 32 - LEE ENTERPRISES, Inc | lee2017ex329242017.htm |
| EX-31.2 - EXHIBIT 31.2 - LEE ENTERPRISES, Inc | lee2017ex3129242017.htm |
| EX-31.1 - EXHIBIT 31.1 - LEE ENTERPRISES, Inc | lee2017ex3119242017.htm |
| EX-23 - EXHIBIT 23 - LEE ENTERPRISES, Inc | lee2017ex231kpmgconsent092.htm |
| EX-21 - EXHIBIT 21 - LEE ENTERPRISES, Inc | lee2017ex21subsidiaries092.htm |
| EX-10.32 - EXHIBIT 10.32 - LEE ENTERPRISES, Inc | a1032formofindemnification.htm |
UNITED STATES SECURITIES AND EXCHANGE COMMISSION
Washington, D.C. 20549
FORM 10-K
[X] ANNUAL REPORT PURSUANT TO SECTION 13 OR 15(d) OF THE
SECURITIES EXCHANGE ACT OF 1934
For The Fiscal Year Ended September 24, 2017
OR
[ ] TRANSITION REPORT PURSUANT TO SECTION 13 OR 15(d) OF THE
SECURITIES EXCHANGE ACT OF 1934
Commission File Number 1-6227
LEE ENTERPRISES, INCORPORATED
(Exact name of Registrant as specified in its Charter)
Delaware | 42-0823980 |
(State of incorporation) | (I.R.S. Employer Identification No.) |
201 N. Harrison Street, Suite 600, Davenport, Iowa 52801
(Address of principal executive offices)
(563) 383-2100
Registrant's telephone number, including area code
Title of Each Class | Name of Each Exchange On Which Registered |
Securities registered pursuant to Section 12(b) of the Act: | |
Common Stock - $0.01 par value | New York Stock Exchange |
Preferred Share Purchase Rights | New York Stock Exchange |
Indicate by check mark if the Registrant is a well-known seasoned issuer, as defined in Rule 405 of the Securities Act. Yes [ ] No [X]
Indicate by check mark if the Registrant is not required to file reports pursuant to Section 13 or Section 15(d) of the Act. Yes [ ] No [X]
Indicate by check mark whether the Registrant (1) has filed all reports required to be filed by Section 13 or 15(d) of the Securities Exchange Act of 1934 during the preceding 12 months (or for such shorter period that the Registrant was required to file such reports), and (2) has been subject to such filing requirements for the past 90 days. Yes [X] No [ ]
Indicate by check mark whether the Registrant has submitted electronically and posted on its corporate Web site, if any, every Interactive Data File required to be submitted and posted pursuant to Rule 405 of Regulation S-T (§232.405 of this Chapter) during the preceding 12 months (or such shorter period that the Registrant was required to submit and post such files). Yes [X] No [ ]
Indicate by check mark if disclosure of delinquent filers pursuant to Item 405 of Regulation S-K (S 229.405 of this Chapter) is not contained herein, and will not be contained, to the best of Registrant's knowledge, in definitive proxy or information statements incorporated by reference in Part III of this Form 10-K or any amendment to this Form 10-K. [X]
Indicate by check mark whether the Registrant is a large accelerated filer, an accelerated filer, a non-accelerated filer, smaller reporting company, or an emerging growth company. See the definitions of “large accelerated filer," "accelerated filer," "smaller reporting company,” and "emerging growth company" in Rule 12b-2 of the Exchange Act.
Large accelerated filer [ ] Accelerated filer [X] Non-accelerated filer (Do not check if a smaller reporting company) [ ] Smaller Reporting Company [ ] Emerging growth company [ ]
If an emerging growth company, indicate by check mark if the Registrant has elected not to use the extended transition period for complying with any new or revised financial accounting standards provided pursuant to Section 13(a) of the Exchange Act. [ ]
Indicate by check mark whether the Registrant is a shell company (as defined in Rule 12b-2 of the Act). Yes [ ] No [X]
State the aggregate market value of the voting and non-voting common equity held by non-affiliates computed by reference to the price at which the common equity was last sold, or the average bid and asked price of such common equity, as of the last business day of the Registrant's most recently completed second fiscal quarter. Based on the closing price of the Registrant's Common Stock on the New York Stock Exchange on March 31, 2017, such aggregate market value is approximately $136,159,000. For purposes of the foregoing calculation only, as required, the Registrant has included in the shares owned by affiliates the beneficial ownership of Common Stock of officers and directors of the Registrant and members of their families, and such inclusion shall not be construed as an admission that any such person is an affiliate for any purpose.
Indicate the number of shares outstanding of each of the Registrant's classes of common stock, as of November 30, 2017. Common Stock, $0.01 par value, 56,707,972 shares.
DOCUMENTS INCORPORATED BY REFERENCE
Portions of the Lee Enterprises, Incorporated Definitive Proxy Statement to be filed in January 2018 are incorporated by reference in Part III of this Form 10-K.
TABLE OF CONTENTS | PAGE | ||
Part I | |||
Item 1 | |||
Item 1A | |||
Item 1B | |||
Item 2 | |||
Item 3 | |||
Item 4 | Mine Safety Disclosures | ||
Part II | |||
Item 5 | |||
Item 6 | |||
Item 7 | |||
Item 7A | |||
Item 8 | |||
Item 9 | |||
Item 9A | |||
Item 9B | |||
Part III | |||
Item 10 | |||
Item 11 | |||
Item 12 | |||
Item 13 | |||
Item 14 | Principal Accounting Fees and Services | ||
Part IV | |||
Item 15 | |||
References to “we”, “our”, “us” and the like throughout this document refer to Lee Enterprises, Incorporated and subsidiaries (the "Company"). References to "2017", "2016", "2015" and the like refer to the fiscal years ended the last Sunday in September.
FORWARD-LOOKING STATEMENTS
The Private Securities Litigation Reform Act of 1995 provides a “safe harbor” for forward-looking statements. This annual report ("Annual Report") contains information that may be deemed forward-looking that is based largely on our current expectations, and is subject to certain risks, trends and uncertainties that could cause actual results to differ materially from those anticipated. Among such risks, trends and other uncertainties, which in some instances are beyond our control, are:
•Our ability to generate cash flows and maintain liquidity sufficient to service our debt;
•Our ability to comply with the financial covenants in our credit facilities;
•Our ability to refinance our debt as it comes due;
•Our ability to manage declining print revenue;
•That the warrants issued in our refinancing will not be exercised;
•The impact and duration of adverse conditions in certain aspects of the economy affecting our business;
•Change in advertising and subscription demand;
•Changes in technology that impact our ability to deliver digital advertising;
•Potential changes in newsprint, other commodities and energy costs;
•Interest rates;
•Labor costs;
•Legislative and regulatory rulings;
•Our ability to achieve planned expense reductions;
•Our ability to maintain employee and customer relationships;
•Our ability to manage increased capital costs;
•Our ability to maintain our listing status on the NYSE;
•Competition; and
•Other risks detailed from time to time in our publicly filed documents, including this Annual Report and
particularly in "Risk Factors", Part I, Item 1A herein.
Any statements that are not statements of historical fact (including statements containing the words “may”, “will”, “would”, “could”, “believes”, “expects”, “anticipates”, “intends”, “plans”, “projects”, “considers” and similar expressions) generally should be considered forward-looking statements. Readers are cautioned not to place undue reliance on such forward-looking statements, which are made as of the date of this Annual Report. We do not undertake to publicly update or revise our forward-looking statements, except as required by law.
PART I
ITEM 1. BUSINESS
Lee Enterprises, Incorporated is a leading provider of high quality, trusted, local news and information, and a major platform for advertising in the markets we serve. We are located primarily in the Midwest, Mountain West and West regions of the United States, and our 50 markets (including TNI Partners ("TNI") and Madison Newspapers, Inc. ("MNI")), across 22 states are principally mid-sized or small. Our printed newspapers reach more than 800,000 households daily and more than 1.2 million on Sunday, with estimated readership totaling three million. Our web and mobile sites are the number one digital source of local news in most of our markets, reaching more than 25 million unique visitors each month.
Our products include:
• | 47 daily and 34 Sunday newspapers; all with related digital operations; and |
• | Nearly 300 weekly newspapers and classified and niche publications, most with related digital operations. |
We also operate TownNews.com, through our 82.5% owned subsidiary INN Partners, L.C. ("TownNews.com"). TownNews.com provides digital infrastructure and digital publishing services for nearly 1,600 daily and weekly newspapers as well as universities, television stations, niche publications, and Lee Enterprises properties.
1
Our markets have established retail bases. Most are regional shopping hubs, and we are located in four state capitals. Six of our top ten markets, by revenue, include major universities, and seven are home to major corporate headquarters. We believe that operating the dominate provider of local news, information and advertising in these markets - combined with our ability to distribute our content across print and digital platforms - enables us to better execute our strategy.
We generate revenue primarily through print and digital advertising, subscriptions to our publications and digital services, primarily through TownNews.com. Our operations also provide commercial printing, distribution of third party publications and marketing services.
Advertising and marketing services - Approximately 58% of our 2017 revenue was derived from advertising and marketing services. We provide advertising and marketing solutions using a multi-platform sales approach that maximizes audience reach for our customers by offering multiple print and digital advertising platforms and products including: print and digital display advertising, desktop, mobile, tablet and other specialty print products.
The following broadly define major categories of advertising and marketing services revenue:
Retail advertising is print or digital revenue earned from sales of display advertising in the publication, or from preprinted advertising inserted in the publication, from local, regional and national businesses with local retail operations.
Classified advertising is revenue from the sale of advertising space, or from separate publications, consisting primarily of advertising categories, such as employment, automotive, real estate, legal notices, obituaries and other merchandise. Classified publications offer advertisers a cost-effective, local advertising vehicle and can be particularly effective in larger markets with higher media fragmentation.
National advertising is revenue earned from the sale of print or digital display advertising space, or from preprinted advertising inserted in the publication, from national accounts that do not have a local retailer representing the account in the market.
Digital advertising consists of display, banner, behavioral targeting, search, rich media, directories, classified or other advertising on websites or mobile applications that are integrated with our print publications, or on third party websites accessed through the extended audience network. Digital advertising is reported in combination with print advertising in the retail, classified and national categories.
Niche publications are specialty publications, such as lifestyle, business, health or home improvement publications that contain advertising.
Marketing services is comprised of a suite of custom digital marketing services that include: Search Engine Optimization, Search Engine Management, web and mobile production, social media services and reputation monitoring and management. Our marketing services also include media buying in audience extension networks (outside of those owned and operated by the Company) such as Centro DSP, Google Ad Exchange and Facebook.
The advertising environment is influenced by the state of the overall economy, including consumer confidence, retail sales, unemployment rates, inflation, energy prices and consumer interest rates. Our enterprises are primarily located in midsize and small markets. Historically our markets have been more stable than major metropolitan markets because our focus is on local, rather than national, advertising. More than eighty percent of our advertising revenue is derived from local and regional businesses. We believe that local advertising tends to be less sensitive to economic cycles than national advertising because local businesses generally have fewer effective advertising channels through which they may reach their customers.
Subscription - Approximately 34% of our 2017 revenue was derived from subscriptions to our printed and digital products. Subscription revenue is earned primarily from our full access subscription model, which provides subscribers print and digital access to our leading local news, information and advertising content for one price. Digital only options are also available to subscribers.
Our operating costs are primarily compensation, newsprint and delivery. Over the past several years we have adjusted our business model to create operational efficiencies and significantly reduce our cost structure.
2
We have centralized or regionalized most back office functions including the design of our newspapers. The centralized design centers have enabled us to more cost effectively design and layout the newspaper. The centralized design centers - combined with a common content management system across all of our daily newspaper markets - has created additional operating efficiencies and cost savings. We have templated designs for our printed and digital editions, and we have created a national news desk that shares high quality content across all of our markets, including national news, regional news and other special sections content. We believe we will continue to create additional operational efficiencies and continue to transform our business model.
Several of our businesses operate in geographic groups of publications, or “clusters,” which provide operational efficiencies, extend sales penetration and provide broader audiences for advertisers through consolidation of sales forces and back office management of operations such as: finance, human resources, subscription management, and the production of the publications. A table under the caption “Daily Newspapers and Markets” in Item 1, included herein, identifies those groups of our newspapers operating in clusters.
We do not face significant daily print competition; however, our newspapers, classified and specialty publications, and digital products do compete with other forms of traditional media including: newspapers having national or regional distribution, magazines, radio, cable and satellite television, outdoor media, other classified and specialty publications, direct mail, directories, and national, regional and local advertising websites and content providers. Competition for advertising is based on audience size and composition, subscription levels, readership demographics, distribution and display mechanisms, price and advertiser results. We believe we capture a substantial share of the total advertising dollars spent in each of our markets. We also compete for circulation and readership against other news and information outlets.
The number of competitors in any given market varies, however all of the forms of competition noted above exist to some degree in our markets, including those listed in the table under the caption “Daily Newspapers and Markets” in Item 1, included herein.
Lee Enterprises, Incorporated was founded in 1890, incorporated in 1950, and listed on the New York Stock Exchange ("NYSE") in 1978.
We experienced significant net losses in 2008, 2009, 2011, 2012 and 2013 primarily due to non-cash charges for impairment of intangible and other assets and reorganization costs, and as a result, we have negative equity of $91.2 million. Our ability to operate as a going concern is dependent on our ability to repay, refinance or amend our debt agreements as they become due, and remain in compliance with debt covenants. We are in compliance with our debt covenants at September 24, 2017. The information included herein should be evaluated in that context. See Item 1A, “Risk Factors”, and Notes 3 and 4 of the Notes to Consolidated Financial Statements, included herein, for additional information.
STRATEGIC INITIATIVES
We are focused on several strategic initiatives:
Comprehensive Local News That Drives Frequency And Engagement
We drive frequency and engagement with our products by delivering valuable, intensely local, original news and information that in many cases, we believe, our audiences cannot otherwise readily obtain. Our large and talented news and editorial staff provide constant, real-time local news with significant breadth, depth and reliability. Our full access platform provides our subscribers with breaking news throughout the day on our digital platforms as well as in depth daily print and digital news and information.
We believe the strength of our local brands is the result of the quality and size of our news gathering staff. This allows us to provide the most comprehensive coverage of local news in our markets. In most of our markets, we are the leading source of print and digital news and information. As the consumption of news on digital devices has expanded, we have moved quickly to develop applications that address audience and digital advertising demands for mobile and tablet advertising platforms. As new digital technologies emerge, we expect to move rapidly to make our content available through them and monetize the audience accessing our content.
We are focused on continually improving the functionality and design of all our news platforms, providing greater depth of coverage and increasing reader engagement. We are providing our journalists with tools to give them real-time
3
information about audience engagement on our digital platforms. This helps inform their decisions on both presentation and coverage.
We believe our journalists are at the forefront of gathering and producing news and information about their local community. We seek to grow our digital audience by engaging our readers with news and information that we believe stirs public awareness, advances ideas, inspires vision, creates debate and provokes action. Through our news leadership we strive to contribute to community betterment, promote education, foster commerce and help improve the quality of life in our markets.
Accelerate And Expand Digital Revenue Growth
Our digital businesses have experienced rapid growth since 2010. Digital advertising grew 8.0% and reached 28.0% of total advertising and marketing services revenue for the year ending September 24, 2017. We are growing digital revenue by offering an expansive array of digital products including video: behavioral targeting, audience retargeting, banner ads, social networking, and digital couponing.
We provide digital marketing services to small and midsized businesses ("SMBs"), including search engine marketing ("SEM"), social media, audience extension, business profiles, and website hosting and design. Amplified Local ("Amplified Local"), our marketing business aimed at the smaller SMBs, offers small business solutions including: search engine optimization (“SEO”), local online marketing, social media marketing, video advertising and web site design. Amplified Local seeks to help small businesses maximize the return on marketing dollars by increasing audience reach, expanding brands, and enhancing their web presence. We believe that these innovative solutions will continue to drive meaningful new opportunities for us to grow our digital marketing revenue. We also continue to expand our array of digital products to address advertisers evolving needs, react to competition while seeking to increase our share of advertising and marketing services spending from existing customers .
Digital national revenue grew 6.0% in 2017, driven by our sweeps program and improved inventory management and pricing. Mobile advertising increased 2.0%, and digital retail advertising, which represents more than 60% of total digital advertising, increased 9.4% in 2017.
We believe TownNews.com represents a powerful opportunity for us to drive additional digital revenue. In 2017, digital services revenue, which is primarily TownNews.com, totaled more than $14 million. Since 2011, the compounded annual growth rate of TownNews.com revenue has been 9%.
We are a member of the Local Media Consortium (the “Consortium”). The Consortium partners with companies like Google, Yahoo! and other technology companies and service providers to increase the potential share of new revenue and audience-building programs available to consortium members, as well as improve the quality of information and advertising services available from, Consortium members. The Consortium currently includes more than 1,600 local newspapers and hundreds of local broadcast outlets in the United States.
In 2017, no single advertiser accounted for more than 3% of advertising revenue and our top 10 advertisers represented 9.4% of advertising revenue.
Our local sales forces are one of our core strengths and are larger than any local competitor, and we believe they are the most highly trained and proficient sales force in our markets. We have strong relationships with businesses in our markets and offer a wide array of products to deliver the advertisers' message. Eighty percent of our advertising revenue now comes from local and regional businesses, and our sales executives pitch the power of our audiences directly to these local decision makers.
To address the evolving needs of local advertisers we changed the way we sell local advertising to maximize our opportunities with small and medium-sized businesses. Local, controllable advertising accounts - those in which our local sales teams have direct contact with the advertising decision makers - are the core of our business. To address the needs of and better serve these local advertisers we developed the Edison Project, which is directly aimed at these local advertisers.
With Edison, we completely restructured our local sales teams and simplified advertising packages, providing advertisers with an expanded robust digital presence, increased frequency in print products, and longer advertising commitments.
4
Our Big Pitch initiative targets larger, local accounts such as a large local hardware store or regional hospital group. We pair creative advertising campaigns with our broad suite of products, both digital and print. Because of the success of this program we've added creative resources and accelerated the number of pitches developed and made, providing greater creativity, faster speed to market, and more pitches closed.
In fiscal year 2017, we introduced Digital Connect, a digital services package aimed at growing digital revenue from local businesses. Digital Connect provides local businesses a turn-key package for expanding their digital presence through enhanced search engine management. Digital Connect has been the fastest growing digital category this fiscal year 2017 and is expected to be a significant contributor to our digital revenue growth in 2018.
Grow Audience Revenue And Engagement
Based on independent audience research conducted on our behalf, for the period January 2016 to January 2017, we reached 74% of all adults over the course of a seven-day period in 11 selected markets, which include most of our largest strategic business units. Forty six percent of the adults in these markets read our newspapers in print, with 19% being both newspaper readers and visitors to our digital platforms. Another 16% were digital users exclusively. The remaining 12%primarily used our newspapers to obtain advertising and other information.
As media access and delivery vehicles continue to evolve, our audiences are evolving and increasingly moving from one delivery platform to another throughout the day and accessing our content in print, on desktops and laptops, and on mobile devices. We seek to grow our audience and engagement on whatever platform they choose by, among other things, continually improving content and presentation to maximize the unique and evolving capabilities of each platform. We have a large and growing digital audience for our products. Unique visitors to our digital sites averaged 25.3 million per month in 2017, while page views totaled 244.2 million per month in 2017.
To serve our readers across all delivery platforms, we implemented a full access subscription model, which is now in place in substantially all of our markets. Full access provides subscribers complete access to our print and digital products available in their market for a single subscription rate. We also sell digital only subscriptions.
Transforming Our Business And Managing Our Costs
We are transforming our business model and reducing our costs to maintain our margins and operating cash flows. We have consolidated or regionalized many common functions; consolidated or selectively outsourced printing and ad production; discontinued unprofitable publications; reduced newsprint volume significantly; and continually seek to improve the efficiencies and reduce costs of our operation with additional consolidation and outsourcing. We have reduced personnel while protecting our strengths in news, sales and digital products. In 2017, on a same property basis we reduced cash costs(1) excluding workforce adjustments 7.7%. We continue to implement cost efficiencies while investing in revenue drivers.
Generate Strong Adjusted EBITDA(1) With A Commitment To Reduce Our Debt
Throughout the last economic downturn and ongoing recovery - at a time of unprecedented transition for our industry - we have posted strong adjusted EBITDA and consistent margins. We anticipate modest capital expenditures and pension contributions, and we expect to continue to significantly reduce our debt each year.
The principal amount of debt was reduced by $68.8 million in 2017 and totaled $548.4 million as of September 24, 2017. Since 2005, we have reduced debt by more than $1 billion and we expect to continue to significantly reduce our debt in 2018. As a result of our debt reductions, interest expense was reduced by $6.7 million in 2017 compared to 2016, providing additional free cash flow for debt service and other corporate uses such as the June 30, 2017 acquisition of the Dispatch-Argus serving Moline and Rock Island, IL ("Dispatch-Argus") for $7.2 million.
(1) See "Non-GAAP Financial Measures: in Item 7, included herein, for additional information.
5
PULITZER
In 2005, we acquired Pulitzer Inc. (“Pulitzer”). We currently publish 9 daily newspapers that were acquired from Pulitzer and more than 60 weekly newspapers and specialty publications. Pulitzer also includes our 50% interest in TNI, as discussed more fully below.
Pulitzer newspapers largest operations include Bloomington, IL and St. Louis, Missouri, where its subsidiary, St. Louis Post-Dispatch LLC (“PD LLC”), publishes the St. Louis Post-Dispatch, our only major daily newspaper which serves the greater St. Louis metropolitan area. St. Louis newspaper operations also include a variety of specialty publications, and supports its related digital products as well as the Suburban Journals of Greater St. Louis, a group of weekly newspapers and niche publications that focus on separate communities within the metropolitan area.
The 2005 acquisition was financed primarily with debt. The second lien term loan lenders have a first lien on Pulitzer assets. Excess cash flow from Pulitzer, as defined in the Second Lien Loan Agreement, and cash flow from Pulitzer asset sales are used to pay down the second lien term loan at par. On August 28, 2016 we sold substantially all of the assets of our Provo, Utah newspaper operations, a former Pulitzer newspaper, and proceeds from the sale were used to pay down the second lien term loan.
TNI Partners
In conjunction with the Pulitzer acquisition we obtained a 50% interest in TNI, the Tucson, Arizona newspaper partnership. TNI, acting as agent for our subsidiary, Star Publishing Company (“Star Publishing”) and Citizen Publishing Company (“Citizen”), the owner of the remaining 50%, a subsidiary of Gannett Co., Inc., (“Gannett”). TNI was responsible for printing, delivery, advertising and subscription activities of the Arizona Daily Star and the Tucson Citizen. In May 2009, Citizen discontinued print publication of the Tucson Citizen and in 2014 stopped publishing its digital product.
TNI collects all receipts and income and pays substantially all operating expenses incident to the partnership's operations and publication of the newspaper and other media. Under the amended and restated operating agreement between Star Publishing and Citizen, the Arizona Daily Star remains the separate property of Star Publishing. Results of TNI are accounted for using the equity method. Income or loss of TNI (before income taxes) is allocated equally to Star Publishing and Citizen. TNI makes weekly distributions to Star Publishing and Citizen of all available cash.
The TNI agency agreement (“Agency Agreement”), has governed the operation since 1940. The Agency Agreement expires in 2040, but contains an option, which may be exercised by either party, to renew the agreement for successive periods of 25 years each. Star Publishing and Citizen also have a reciprocal right of first refusal to acquire the 50% interest in TNI owned by Citizen and Star Publishing, respectively, under certain circumstances. Both the Company and Citizen incur certain administrative costs and capital expenditures that are reported by their individual companies.
MADISON NEWSPAPERS
We own 50% of the capital stock of MNI and 8.7% of the common stock of The Capital Times Company (“TCT”). TCT owns 50% of the capital stock of MNI. MNI publishes daily and Sunday newspapers, and other publications in Madison, Wisconsin, and other Wisconsin locations, and supports their related digital products. MNI conducts business under the trade name Capital Newspapers. We have a contract to furnish the editorial and news content for the Wisconsin State Journal, which is published by MNI, and periodically provide other services to MNI for a fee. Results of MNI are accounted for using the equity method. Net income or loss of MNI (after income taxes) is allocated equally to the Company and TCT. MNI makes quarterly dividend payments to the Company and TCT.
AUDIENCES
Based on independent research, we estimate that, in an average week, our newspapers and digital products reach approximately 74% of adults in our larger markets. We also measure use of our daily newspapers for advertising, sports scores and entertainment listings ("print users").
6
Audience reach is summarized as follows:
All Adults | ||||||||||
(Percent, Past Seven Days) | 2017 | 2016 | 2015 | 2014 | 2013 | |||||
Print only | 27.1 | 26.8 | 31.3 | 33.1 | 36.9 | |||||
Print and digital | 19.0 | 19.3 | 19.3 | 20.0 | 17.8 | |||||
Digital only | 15.5 | 16.6 | 12.5 | 12.1 | 10.5 | |||||
Total readership | 61.6 | 62.7 | 63.1 | 65.2 | 65.2 | |||||
Print users | 12.4 | 11.6 | 12.8 | 13.0 | 13.9 | |||||
Total reach | 74.0 | 74.3 | 75.9 | 78.2 | 79.1 | |||||
Total print reach | 58.5 | 57.7 | 63.4 | 66.1 | 68.6 | |||||
Total digital reach | 34.5 | 35.9 | 31.8 | 32.1 | 28.3 | |||||
Age 18-29 | ||||||||||
(Percent, Past Seven Days) | 2017 | 2016 | 2015 | 2014 | 2013 | |||||
Print only | 14.8 | 15.3 | 19.5 | 20.3 | 30.7 | |||||
Print and digital | 15.5 | 16.2 | 20.2 | 18.3 | 15.6 | |||||
Digital only | 19.6 | 23.4 | 12.7 | 15.3 | 10.5 | |||||
Total readership | 49.9 | 54.9 | 52.4 | 53.9 | 56.8 | |||||
Print users | 13.9 | 11.2 | 19.5 | 19.5 | 22.0 | |||||
Total reach | 63.8 | 66.1 | 71.9 | 73.4 | 78.8 | |||||
Total print reach | 44.2 | 42.7 | 59.2 | 58.1 | 68.3 | |||||
Total digital reach | 35.1 | 39.6 | 32.9 | 33.6 | 26.1 | |||||
Source: | Lee Enterprises Audience Report, Thoroughbred Research. January 2013-2017. |
Markets: | 11 largest markets in 2013-2017. |
Margin of Error: | Total sample +/- 0.9%, Total digital sample +/- 1.1% |
After advertising, subscriptions and single copy sales are our largest source of revenue. For the 13 weeks ended September 2017, our daily circulation units, which include TNI and MNI, as measured by the Alliance for Audited Media ("AAM") were 0.8 million and Sunday circulation units were 1.2 million.
Growth in audiences can, over time, also positively impact advertising revenue. Our strategies to grow audiences include continuous improvement of content and promotional efforts to expand our audience. Content can include focus on local news, features, scope of coverage, accuracy, presentation, writing style, tone and type style. Promotional efforts include advertising, contests and other initiatives to increase awareness of our products. Customer service can also influence print subscriptions. The continued improvement of mobile and tablet applications has positively impacted our digital audiences.
We have historically experienced higher retention of customers using credit cards or automatic bank account withdrawals, ("EZ pay") as the form of subscription payment. Accordingly we focus our enterprises on increasing the number of EZ pay subscribers. Other initiatives vary from location to location and are determined principally by our centralized consumer sales and marketing group in collaboration with local management. Competition for subscriptions is generally based on the content, journalistic quality and price of the publication.
Audience competition exists in all markets, from unpaid print and digital products, but is most significant in markets with competing local daily newspapers. These markets tend to be near major metropolitan areas, where the size of the population may be sufficient to support more than one daily newspaper.
Our subscription sales channels continue to evolve through an emphasis on targeted telemarketing, direct mail and email to acquire new subscribers and retain current subscribers.
7
DAILY NEWSPAPERS AND MARKETS
The Company, TNI and MNI publish the following daily newspapers and maintain the following primary digital sites:
Average Units (1) | ||||||||
Newspaper | Primary Website | Location | Daily (2) | Sunday | ||||
St. Louis Post-Dispatch (3) | stltoday.com | St. Louis, MO | 101,336 | 368,569 | ||||
Arizona Daily Star (5) (3) | azstarnet.com | Tucson, AZ | 49,915 | 100,886 | ||||
Capital Newspapers (4) | ||||||||
Wisconsin State Journal | madison.com | Madison, WI | 57,833 | 74,190 | ||||
Daily Citizen | wiscnews.com/bdc | Beaver Dam, WI | 5,458 | — | ||||
Portage Daily Register | wiscnews.com/pdr | Portage, WI | 2,775 | — | ||||
Baraboo News Republic | wiscnews.com/bnr | Baraboo, WI | 2,449 | — | ||||
The Times | nwitimes.com | Munster, Valparaiso, and Crown Point, IN | 58,081 | 68,087 | ||||
Quad Cities Group | ||||||||
Quad-City Times | qctimes.com | Davenport & Muscatine, IA | 34,180 | 34,141 | ||||
Dispatch-Argus | qconline.com | Moline, IL | 23,887 | 26,360 | ||||
Central Illinois Newspaper Group | ||||||||
The Pantagraph (3) | pantagraph.com | Bloomington, IL | 24,807 | 27,458 | ||||
Herald & Review | herald-review.com | Decatur & Mattoon/Charleston, IL | 25,845 | 22,038 | ||||
Lincoln Group | ||||||||
Lincoln Journal Star | journalstar.com | Lincoln, NE | 40,011 | 46,838 | ||||
Columbus Telegram | columbustelegram.com | Columbus, NE | 4,037 | (6) | — | |||
Fremont Tribune | fremonttribune.com | Fremont, NE | 3,111 | (6) | — | |||
Beatrice Daily Sun | beatricedailysun.com | Beatrice, NE | 3,184 | (6) | — | |||
River Valley Newspaper Group | ||||||||
La Crosse Tribune | lacrossetribune.com | La Crosse, WI | 18,782 | 23,583 | ||||
Winona Daily News | winonadailynews.com | Winona, MN | 5,583 | 6,241 | ||||
The Chippewa Herald | chippewa.com | Chippewa Falls, WI | 2,959 | (6) | — | |||
The Courier | wcfcourier.com | Waterloo and Cedar Falls, IA | 32,463 | 29,646 | ||||
Billings Gazette | billingsgazette.com | Billings, MT | 24,781 | 27,672 | ||||
Sioux City Journal | siouxcityjournal.com | Sioux City, IA | 20,917 | 23,052 | ||||
The Bismarck Tribune | bismarcktribune.com | Bismarck, ND | 18,854 | 22,683 | ||||
The Post-Star | poststar.com | Glens Falls, NY | 16,818 | 21,121 | ||||
Missoula Group | ||||||||
Missoulian | missoulian.com | Missoula, MT | 15,474 | 19,004 | ||||
Ravalli Republic | ravallinews.com | Hamilton, MT | 1,933 | (6) | 1,860 | (6) | ||
Helena/Butte Group | ||||||||
Independent Record | helenair.com | Helena, MT | 10,306 | 10,928 | ||||
The Montana Standard | mtstandard.com | Butte, MT | 8,416 | 8,569 | ||||
Rapid City Journal | rapidcityjournal.com | Rapid City, SD | 15,608 | 19,322 | ||||
The Journal Times | journaltimes.com | Racine, WI | 16,518 | 18,927 | ||||
The Southern Illinoisan | thesouthern.com | Carbondale, IL | 12,029 | 18,378 | ||||
Mid-Valley News Group | ||||||||
Albany Democrat-Herald | democratherald.com | Albany, OR | 8,380 | 8,776 | ||||
Corvallis Gazette-Times | gazettetimes.com | Corvallis, OR | 6,936 | 7,187 | ||||
Casper Star-Tribune | trib.com | Casper, WY | 15,101 | 15,493 | ||||
8
Average Units (1) | ||||||||
Newspaper | Primary Website | Location | Daily (2) | Sunday | ||||
Magic Valley Group | ||||||||
The Times-News | magicvalley.com | Twin Falls, ID | 14,455 | 12,797 | ||||
Elko Daily Free Press | elkodaily.com | Elko, NV | 3,218 | — | ||||
Globe Gazette | globegazette.com | Mason City, IA | 9,668 | 11,995 | ||||
Santa Maria Times (3) | santamariatimes.com | Santa Maria, CA | 7,784 | 11,971 | ||||
The Daily News | tdn.com | Longview, WA | 13,498 | 11,194 | ||||
Napa Valley Register (3) | napavalleyregister.com | Napa, CA | 8,519 | 8,881 | ||||
Arizona Daily Sun (3) | azdailysun.com | Flagstaff, AZ | 6,411 | (6) | 7,687 | |||
The Citizen | auburnpub.com | Auburn, NY | 5,620 | 7,148 | ||||
The Times and Democrat | thetandd.com | Orangeburg, SC | 6,460 | 6,995 | ||||
The Sentinel | cumberlink.com | Carlisle, PA | 6,780 | (6) | — | |||
The World (3) | theworldlink.com | Coos Bay, OR | 4,473 | — | ||||
The Sentinel (3) | hanfordsentinel.com | Hanford, CA | 4,575 | — | ||||
The Ledger Independent | maysville-online.com | Maysville, KY | 3,773 | — | ||||
Daily Journal (3) | dailyjournalonline.com | Park Hills, MO | 3,654 | (6) | — | |||
787,655 | 1,129,677 | |||||||
(1) | Source: AAM: September 2017 Quarterly Executive Summary Data Report, unless otherwise noted. |
(2) | Not all newspapers are published Monday through Saturday |
(3) | Owned by Pulitzer, Inc. |
(4) | Owned by MNI. |
(5) | Owned by Star Publishing and published through TNI. |
(6) | Source: Company statistics. |
NEWSPRINT
The raw material of newspapers, and our other print publications, is newsprint. We purchase newsprint from U.S. and Canadian producers. We believe we will continue to receive a supply of newsprint adequate for our needs and consider our relationships with newsprint producers to be good. Newsprint purchase prices can be volatile and fluctuate based upon factors that include foreign currency exchange rates and both foreign and domestic production capacity and consumption. Price fluctuations can effect our results of operations. We have not entered into derivative contracts for newsprint. For the quantitative impacts of these fluctuations, see Item 7A, “Quantitative and Qualitative Disclosures about Market Risk”, included herein.
9
EXECUTIVE TEAM
The following table lists our current executive team members:
Name | Age | Service With The Company | Named To Current Position | Current Position |
Mary E. Junck | 70 | June 1999 | February 2016 | Executive Chairman |
Kevin D. Mowbray | 55 | September 1986 | February 2016 | President and Chief Executive Officer |
Nathan E. Bekke | 48 | January 1992 | February 2015 | Vice President - Consumer Sales and Marketing |
Paul M. Farrell | 62 | October 2013 | October 2015 | Vice President - Sales |
Robert P. Fleck | 55 | May 2016 | May 2016 | Vice President - Sales and Marketing |
Suzanna M. Frank | 47 | December 2003 | March 2008 | Vice President - Audience |
Astrid J. Garcia | 67 | December 2006 | December 2013 | Vice President - Human Resources and Legal |
James A. Green | 51 | March 2013 | March 2013 | Vice President - Digital |
Michael R. Gulledge | 57 | October 1982 | October 2015 | Vice President - Advertising Sales Leadership |
John M. Humenik | 54 | December 1998 | February 2015 | Vice President - News |
Ronald A. Mayo | 56 | May 2015 | June 2015 | Vice President - Chief Financial Officer and Treasurer |
Michele Fennelly White | 55 | June 1994 | June 2011 | Vice President - Information Technology and Chief Information Officer |
Mary E. Junck was elected Executive Chairman in February 2016. From 2002 - February 2106 she served as President and Chief Executive Officer. She was elected to the Board of Directors of the Company in 1999.
Kevin D. Mowbray was elected President and Chief Executive Officer in February 2016. From April 2015 - February 2016 he was Executive Vice President and Chief Operating Officer. From May 2013 to April 2015 he served as Vice President and Chief Operating Officer. From 2004 to May 2013 he served as a Vice President - Publishing and was Publisher of the St. Louis Post-Dispatch from 2006 until May 2013. He was elected to the Board of Directors of the Company in February 2016.
Nathan E. Bekke was appointed Vice President - Consumer Sales and Marketing in February 2015. From 2003 to February 2015, he served as Publisher of the Casper Star-Tribune.
Paul M. Farrell was appointed Vice President - Sales in October 2015. From October 2013 to October 2015, he served as Vice President - Digital Sales. From September 2012 to October 2013, he served as Publisher of the Connecticut Media Group of Hearst Media Services. From May 2007 to August 2012, he served as Vice President - Sales and Marketing of the Company.
Robert P. Fleck was appointed Vice President - Sales and Marketing in May 2016 and named Publisher of the LaCrosse Tribune in 2017. Prior to joining the Company, he was with The Tribune Company. His 24-year career with Tribune included Executive Vice President of Tribune Publishing Company; General Manager and Senior Vice President for TRIBUNE365; and Senior Vice President of the Chicago Tribune Media Group.
Suzanna M. Frank was appointed Vice President - Audience in March 2008. From 2003 to March 2008 she served as Director of Research and Marketing of the Company.
10
Astrid J. Garcia was appointed Vice President - Human Resources and Legal in December 2013. From 2006 to November 2013 she served as Vice President of Human Resources, Labor Relations and Operations of the St. Louis Post-Dispatch.
James A. Green was appointed Vice President - Digital in March 2013. From June 2011 to March 2013, he served as Executive Vice President and General Manager of Travidia, Inc., a developer of newspaper digital shopping media and marketing programs. From 2004 to June 2011 he served as Chief Marketing Officer of Travidia, Inc.
Michael R. Gulledge was elected Vice President - Sales and Marketing in September 2012 and named Publisher of the Billings Gazette in 2000. From 2005 to September 2012 he served as a Vice President - Publishing.
John M. Humenik was appointed Vice President - News in February 2015. He is also president and publisher of the Wisconsin State Journal and president of Madison Newspapers Inc., a position he has held since 2013. He was publisher and editor of the Arizona Daily Star from 2005 to 2010 and additionally served as president of Tucson Newspapers Inc. until 2013.
Ronald A. Mayo was elected Vice President, Chief Financial Officer and Treasurer in June 2015. Prior to joining the Company, he was Chief Financial Officer of Halifax Media Group from July 2014 to January 2015 and previously served as Vice President and Chief Financial Officer of MediaNews Group, Inc., for 12 years.
Michele Fennelly White was appointed Vice President - Information Technology and Chief Information Officer in June 2011. From 1999 to June 2011, she served as Director of Technical Support.
Ms. Junck and Messrs. Mowbray, Farrell, Green, Gulledge, and Mayo have been designated by the Board of Directors as executive officers for US Securities and Exchange Commission ("SEC") reporting purposes.
EMPLOYEES
At September 24, 2017, we had approximately 3,555 employees, including approximately 927 part-time employees, exclusive of TNI and MNI. Full-time equivalent employees in 2017 totaled approximately 3,626. We consider our relationships with our employees to be good.
Bargaining units represent 344, or 69%, of the total employees of the St. Louis Post-Dispatch, which has six contracts with bargaining units with expiration dates through September 2018.
Approximately 34 employees in three additional locations are represented by collective bargaining units.
CORPORATE GOVERNANCE AND PUBLIC INFORMATION
We have a long history of sound corporate governance practices. Our Board of Directors has a lead independent director, and has had one for many years. Currently, six of nine members of our Board of Directors are independent, as are all members of the Board's Audit, Executive Compensation and Nominating and Corporate Governance committees. The Audit Committee approves all services to be provided by our independent registered public accounting firm and its affiliates.
At www.lee.net, one may access a wide variety of information, including news releases, SEC filings, financial statistics, annual reports, investor presentations, governance documents, newspaper profiles and digital links. We make available via our website all filings made by the Company under the Securities Exchange Act of 1934 (the "Exchange Act"), including Forms 10-K, 10-Q and 8-K, and related amendments, as soon as reasonably practicable after they are filed with, or furnished to, the SEC. All such filings are available free of charge. The content of any website referred to in this Annual Report is not incorporated by reference unless expressly noted.
ITEM 1A. RISK FACTORS
Risk exists that our past results may not be indicative of future results. In addition, a number of other factors (those identified elsewhere in this document) may cause actual results to differ materially from expectations. Potential investors should carefully consider the following risks and other information in this Annual Report in evaluating us and our common stock. See also, “Forward-Looking Statements”, included herein.
11
ECONOMIC CONDITIONS
Our operations rely on the local economies in which we serve, and we are also susceptible to general economic downturns, which have had and could continue to have a material and adverse impact on our operating results
It is difficult to estimate the level of economic growth or contraction as current and future conditions in the economy have an inherent degree of uncertainty. Adverse changes may occur to our business as a result of weak global economic conditions, declining oil prices, wavering consumer confidence, unemployment, declines in stock markets, contraction of credit availability, changes in interest rates, declines in real estate values, or other factors affecting economic conditions in general. These changes may negatively affect the sales of our products, increase exposure to losses from bad debts, increase the cost and decrease the availability of financing, or increase costs associated with publishing and distributing our publications.
OPERATING REVENUE
Our operating revenue may be materially adversely affected if we do not successfully respond to the shift in newspaper readership and advertising expenditures away from traditional print media
A significant portion of our revenue is derived from advertising. The demand for advertising is sensitive to the overall level of economic strength, both locally and nationally. Our revenues are sensitive to economic trends and uncertainties as well as discretionary spending by advertisers and subscribers. Changes in advertising and circulation revenue could have a material effect on our results of operations.
Operating revenue in most print categories has decreased since 2007 and may decrease further in the future. Such decreases may not be offset by growth in advertising in other categories, such as digital revenue which has been rising since 2010. Historically, newspaper publishing has been viewed as a cost-effective method of delivering various forms of advertising. There can be no guarantee that this historical perception will guide future decisions on the part of advertisers. Web sites and applications for mobile devices distributing news and other content continue to gain popularity. As a result, audience attention and advertising spending are shifting and may continue to shift from traditional print media to digital media including those owned by the Company. As media audiences increasingly move to consume news and information digitally, we expect that advertisers will allocate greater portions of their future budgets to digital media advertising, which can offer more measurable returns than traditional print media. If our efforts to adapt to evolving technological developments in the media industry are unsuccessful, or if we fail to correctly anticipate shifts in audience demand and digital media trends, we may be unable to provide the services, media and content that audiences and potential audiences in our markets prefer and we may be unable to provide the returns on ad spending that our advertisers seek. This increased competition and shift to the digital consumption of news and information has had, and may continue to have, an adverse effect on our business and financial results. Significant capital investment may be required to respond to this shift.The digital media industry has greater competitive challenges than print because barriers to entry can be low and geographic location is less relevant.
Technological developments also pose additional challenges that could adversely affect our revenue and competitive position. New delivery platforms may lead to pricing restrictions and the loss of a direct relationship with consumers. We may also be adversely affected if the use of technology developed to block the display of advertising on websites and other digital platforms proliferates.
The rates we charge for advertising are, in part, related to the size of the audience of our publications and digital products. There is significant competition for readers and viewers from other media. Our business may be adversely affected to the extent individuals decide to obtain news, entertainment, classified listings and local shopping information from digital or other media, to the exclusion of our outlets for such information.
Retail Advertising
Many advertisers, including major retail store chains, automobile dealers, banks and telecommunications companies, have experienced significant merger and acquisition activity over the last several years, and some have gone out of business or closed stores. Changes in the economy and consumer shopping habits, in particular, in the brick and mortar retail sector along with the increasing use of online consumer shopping, has driven a change in advertising spending and retailers approach to advertising and marketing their goods and services.
12
Classified Advertising
Classified print and digital advertising for employment, automotive and real estate have been significantly reduced by changing trends in how our audiences access and use our products and the increase in digital/classified advertising competitors.
Subscription Revenue
Advertising and subscription revenue is affected by readership of our print publications and digital products. Although our combined print and digital audience is relatively stable, print subscription volumes have been declining for several years, reflecting general trends in the newspaper industry, including consumer migration toward digital media platforms for accessing news and information. The Company has increased its subscription rate and the possibility exists that future subscription price increases may be difficult to realize or maintain and as a result subscription sales may decline, and price decreases may be necessary to retain or grow subscription volume. We believe we are maintaining our share of audience in our local markets through digital audience growth and strong print newspaper readership.
As audience attention increasingly migrate to digital media, print circulation of our newspapers may be adversely affected, which may decrease subscription revenue and accelerate declines in print advertising. We face increasing competition from digital news sources which can impact subscription revenue and audience growth. This competition has increased as a result of the continued development of new digital media technologies. To maintain our subscription base, we may be required to incur additional costs that we may not be able to recover through subscription and advertising revenue. We may not be able to achieve a profitable balance between subscription levels and advertising revenue. In addition, if we are not successful in growing our digital businesses, including digital subscription revenue, to offset declines in revenue from our print products, our business, financial condition and prospects will be adversely affected.
Our ability to retain a subscriber base with all access pricing depends on market acceptance, consumer habits, cost, an adequate digital infrastructure, terms of delivery platforms and other factors. The metered paywall model and/or subscription price increases may result in fewer page views or unique visitors to our digital platforms if viewers are unwilling to pay to gain access to our digital content after reaching the maximum number of free articles in a month. Stagnation, or a decline in digital traffic levels, will adversely affect our advertiser base, advertising rates and result in a decline in digital revenue.
See "Audiences” in Item 1, included herein, for additional information on the risks associated with subscription revenue.
If we are not successful in growing our digital business, our business, financial condition, results of operations and prospects could be adversely affected
The future revenue performance of our digital business depends to a significant degree upon the growth development and management of our subscriber and advertising audiences. The growth of our digital business over the long term depends on various factors, including, among other things, the ability to:
• | Continue to increase digital audiences; |
• | Attract advertisers to our digital platforms; |
• | Tailor our products to efficiently and effectively deliver content and advertising on mobile devices; |
• | Maintain or increase the advertising rates on our digital platforms; |
• |
• | Exploit new and existing technologies to distinguish our products and services from those of competitors and develop new content, products and services; |
• | Invest funds and resources in digital opportunities; |
• | Partner with, or use services from, providers that can assist us in effectively growing our digital business; and |
13
• | Create digital content and platforms that attracts and engages audiences in our markets. |
We expect that our digital business will continue to increase as a percentage of our total revenue. In 2017, total digital revenue (including revenue from advertising and marketing services and digital services, mainly TownNews.com) comprised 18.7% of total revenue, as compared to 16.4% in 2016. As our digital business becomes a greater portion of our overall business, we will face a number of increased risks from managing our digital operations, including, but not limited, to the following:
• | Continuing training of our sales force to more effectively sell digital only advertising, combined digital and print advertising packages versus our historical print advertising business; |
• | Attracting and retaining employees with skill sets and the knowledge base needed to successfully operate our digital business; and |
• | Managing the transition to a digital business from a historically print-focused business, including reducing the physical printing and distribution infrastructure cost associated with the print business. |
We rely on revenue from printing and distribution of third-party publications and digital services that may be subject to many of the same business and industry risks facing us
We generate a portion of our revenue from printing and distributing third-party publications, and our relationships with these third parties are generally pursuant to short-term contracts. Typically, these third parties are operating in the same industry and a similar geographical location as us. In addition, digital services revenue is derived primarily from third-party businesses in the same industry as us. As a result, revenue from these third parties is subject to the same macroeconomic and industry trends affecting our operations. If their businesses are adversely affected by these trends, our associated revenue would be adversely affected.
OPERATING EXPENSES
We may not be able to reduce future expenses to offset potential revenue declines
We reduced cash costs(1) of our operations (compensation, newsprint and ink, other operating expenses and workforce adjustments) significantly since 2011. Such expense reductions are not expected to impact our ability to deliver advertising, news or other content to our customers. As a result of the significant cost reductions to date, future cost reductions may not be as significant. Compensation and newspaper distribution account for 63% of our cash costs excluding workforce adjustments.
Newsprint comprises approximately 6% of our cash costs excluding workforce adjustments. See “Newsprint” in Item 1, and “Commodities” in Item 7A, included herein, for additional information on the risks associated with changes in newsprint costs.
The technological developments and changes we need to make to our business successful, may require significant capital investments. We may be limited in our ability to invest funds and resources in digital products, services or opportunities, and we may incur costs of research and development in building and maintaining the necessary and continually evolving technology infrastructure. As a result, our digital business could suffer if we are unable to make these investments.
(1) See Non-GAAP Financial Measures: in Item 7, included herein, for additional information.
We may incur additional non-cash impairment charges
We have significant amounts of goodwill and identified intangible assets. Since 2007 we have recorded impairment charges totaling almost $1.3 billion to reflect the reduced value of these assets. Should general economic, market or business conditions decline, and cause a negative impact on our stock price or projected future cash flows, we may need to record additional impairment charges in the future. Such charges would not impact our cash flows or debt covenant compliance. See “Critical Accounting Policies” in Item 7, included herein, for additional information on the risks associated with such assets.
14
Sustained increases in costs of employee health and welfare benefits may reduce our profitability
In recent years, we experienced significant increases in the cost of employee medical benefits because of economic factors beyond our control, including increases in health care costs. At least some of these factors may continue to put upward pressure on the cost of providing medical benefits. Although we have actively sought to control increases in these costs, there can be no assurance that we will succeed in limiting cost increases, and continued upward pressure could reduce the profitability of our businesses.
Sustained increases in funding requirements of our pension and postretirement obligations may reduce the cash available for our business
Pension liabilities, net of plan assets, totaled $43.5 million at September 24, 2017. The Company expects to make pension contributions of $4.9 million in 2018. At September 24, 2017 the assets of one of our postretirement medical plans exceeded plan liabilities by $11.0 million.
Our pension and postretirement plans invest in a variety of equity and debt securities. Future volatility and disruption in the securities markets could cause declines in the asset values of our pension and postretirement plans. In addition, a decrease in the discount rates or changes to mortality estimates and other assumptions used to determine the liability could increase the benefit obligation of the plans. Unfavorable changes to the plan assets and/or the benefit obligations could increase the level of required contributions above what is currently estimated, which could reduce the cash available for our business and debt service. Legislation passed in 2012, 2014 and 2015 temporarily reduced funding requirements for our pension plans, but those payments will eventually need to be restored unless discount rates and/or plan assets increase.
We expect to be subject to withdrawal liability in connection with one multiemployer pension plan and may be subject to additional withdrawal liabilities in connection with other multiemployer pension plans, which may reduce the cash available for our business
Pursuant to our collective bargaining obligations, we contribute to three multiemployer pension plans on behalf of certain of our employees. Based on the most recent communications from the plans’ administrators, two of these plans are currently in “critical” status, as that term is used in relation to such plans under the Pension Protection Act of 2006. For plans that are in critical status, benefit reductions may apply and/or we could be required to make additional contributions.
One of our enterprise's bargaining units withdrew from representation, and as a result we are subject to a claim from the multiemployer pension plan for a withdrawal liability. The amount of such liability will be dependent on actions taken, or not taken, by the pension plan, as well as the future investment performance and funding status of the pension plan. The withdrawal liability is expected to be funded over a 20 year period.
If, we were to withdraw from one of the remaining plans or trigger a partial withdrawal due to declines in contribution base units, and the plan had unfunded vested benefits at the time of our withdrawal or partial withdrawal, we could incur a significant plan withdrawal liability, which could reduce the cash available for our business.
CAPITAL
We may have insufficient earnings or liquidity to meet our future debt obligations
We have $548.4 million of debt outstanding as of September 24, 2017, as discussed more fully below (and certain capitalized terms used below defined) in Item 7,"Liquidity" and Note 4 of the Notes to Consolidated Financial Statements, included herein. Since February 2009, we have satisfied substantially all principal and interest payments due under our debt facilities with our cash flows and asset sales.
As of September 24, 2017, our debt consists of the following:
• | $400,000,000 aggregate principal amount of 9.5% Senior Secured Notes (the “Notes”) due March 2022, pursuant to an Indenture dated as of March 31, 2014 (the “Indenture”), of which $385,000,000 is currently outstanding as of September 24, 2017; |
15
• | $250,000,000 first lien term loan (the "1st Lien Term Loan") due March 2019 and $40,000,000 revolving facility (the "Revolving Facility") under a First Lien Credit Agreement dated as of March 31, 2014 (together, the “1st Lien Credit Facility”), of which $45,145,000 is outstanding at September 24, 2017; and |
• | $150,000,000 12.0% second lien term loan under a Second Lien Loan Agreement dated as of March 31, 2014 (the “2nd Lien Term Loan”) due December 2022, of which $118,240,000 is outstanding at September 24, 2017. |
The ability to make payments on our indebtedness will depend on our ability to generate cash flows from operations in the future. Cash generated from future asset sales could serve as an additional source of debt repayment. Our ability, to a certain extent, is subject to general economic, financial, competitive, business, legislative, regulatory and other factors that are beyond our control.
At September 24, 2017, after consideration of letters of credit, we have approximately $33,818,000 available for future use under our Revolving Facility. Including cash, our liquidity at September 24, 2017 totals $44,439,000. This liquidity amount excludes any future cash flows. Our adjusted EBITDA has been strong and has exceeded $144 million in each year from 2011 through 2017, but there can be no assurance that such results will continue. We expect all interest and principal payments due in the next twelve months will be satisfied by our cash flows and certain asset sales, which will allow us to maintain an adequate level of liquidity.
At September 24, 2017, the principal amount of our outstanding debt totals $548,385,000. At September 24, 2017 and September 25, 2016 our debt, net of cash, is 3.7 times and 3.9 times our adjusted EBITDA, respectively.
Final maturities of our debt are March 2019 through December 2022. As a result, we believe refinancing risk has been substantially reduced for the next several years.
There are numerous potential consequences under the Notes, 1st Lien Credit Facility, 2nd Lien Term Loan, if an event of default, as defined, occurs and is not remedied. Many of those consequences are beyond our control. The occurrence of one or more events of default would give rise to the right of the applicable lenders to exercise their remedies under the Notes, 1st Lien Credit Facility, 2nd Lien Term Loan, respectively, including, without limitation, the right to accelerate the repayment of all outstanding debt and take actions authorized in such circumstances under applicable collateral security documents.
Our ability to operate as a going concern is dependent on our ability to remain in compliance with debt covenants and to refinance or amend our debt agreements as they become due, if necessary. The Notes, 1st Lien Credit Facility and 2nd Lien Term Loan have only limited affirmative covenants with which we are required to maintain compliance. We are in compliance with our debt covenants at September 24, 2017.
The Notes, 1st Lien Credit Facility and 2nd Lien Term Loan each contain restrictive covenants that limit our ability to grow our business or return capital to our stockholders
The Notes, 1st Lien Credit Facility and 2nd Lien Term Loan each contain various restrictions, covenants and representations and warranties. If we fail to comply with any of these covenants or breach these representations or warranties in any material respect, such noncompliance would constitute a default, and the lenders could elect to declare all amounts outstanding under the agreements related thereto to be immediately due and payable and enforce their respective interests against collateral pledged under such agreements.
The covenants and restrictions generally limit or restrict our ability to, among other things:
•incur or guarantee additional debt;
•make certain investments, loans or acquisitions;
•transfer or sell assets; and
•make certain restricted payments, including repurchases of outstanding common stock and dividends.
The restrictions described above may interfere with our ability to obtain new or additional financing or engage in other business activities, which may significantly limit or harm our results of operations, financial condition and liquidity.
16
A decrease in our stock price may limit the ability to trade our stock or for the Company to raise equity capital
Under the NYSE listing standards, if our common stock fails to maintain an adequate per share price and our total market capitalization falls below $50.0 million, our common stock could be removed from the NYSE and traded in the over the counter market. In July 2011, the NYSE notified us that our common stock did not meet the NYSE continued listing standards due to the failure to maintain an adequate share price. Under the NYSE rules, our common stock was allowed to continue to be listed during a cure period. In February 2012, after completing our debt refinancing, the NYSE notified us that we were again in compliance with the minimum closing price standard. In January 2013, the NYSE notified us that we had returned to full compliance with all continued listing standards. However, there can be no assurance that we will continue to be able to meet these listing standards, and the removal of our common stock from the NYSE could adversely affect our ability to raise equity capital.
OTHER
Cybersecurity risks could harm our ability to operate effectively and our reputation
In the 13-weeks ended September 24, 2017, 19.2% of our revenue was obtained from digital sources, including advertising and one of our businesses, TownNews.com, that provides digital infrastructure and digital publishing services for us and other companies.
We use technology in substantially all aspects of our business operations. Such uses give rise to cybersecurity risks, including the misappropriation of personally identifiable information that we store and manage and disabling or taking over of our websites. We have preventive systems and processes in place to protect against the risk of cyber incidents. However, the techniques used to obtain unauthorized access and to disable systems and websites change frequently and may be difficult to detect for long periods of time. There can be no assurance that we, or the security systems we implement, will protect against all of these rapidly changing risks. Prolonged system outages or a cyber incident that goes undetected could reduce our print and/or digital revenue, increase our operating costs, disrupt our operations, harm our reputation, lead to legal exposure to customers and employees as well as subject us to liability under laws and regulations that protect our customers and employees personal data. We maintain insurance coverage against certain of such risks, but cannot guarantee that such coverage will be applicable or sufficient with respect to any given incident.
We may not be able to protect our intellectual property rights, which may adversely affect our business
Our business depends on our intellectual property, including our valuable brands and content. We believe our proprietary trademarks and other intellectual property rights are important to our continued success and our competitive position.
Unauthorized parties may attempt to copy or otherwise obtain and use our content or infringe upon, dilute, reproduce, misappropriate or otherwise violate our intellectual property. There can be no assurance that the steps we have taken to protect our proprietary rights will be successful in any given case.
ITEM 1B. UNRESOLVED STAFF COMMENTS
None.
ITEM 2. PROPERTIES
Our executive offices are located in leased facilities at 201 North Harrison Street, Suite 600, Davenport, Iowa. The initial lease term expires April 30, 2019.
All of our principal printing facilities are owned, except Madison, Wisconsin (which is owned by MNI), Tucson (which is jointly owned by Star Publishing and Citizen), St. Louis (as described below) and leased land for the Helena, Montana plant. All facilities are well maintained, in good condition, suitable for existing office and publishing operations, as applicable, and adequately equipped. With the exception of St. Louis, none of our facilities is individually significant to our business.
17
Information related to St. Louis facilities at September 24, 2017 is as follows:
(Square Feet) | Owned | Leased | ||
PD LLC | 649,000 | 1,700 | ||
Suburban Journals | 9,000 | 4,300 | ||
More than 40% of our daily newspapers, as well as many of our nearly 300 other publications, are printed at either another one of our print locations or outsourced to a third party, to enhance operating efficiency. We are continuing to evaluate additional insourcing and outsourcing opportunities in order to more effectively manage our operating and capital costs.
Our newspapers and other publications have formal or informal backup arrangements for printing in the event of a disruption in production capability.
ITEM 3. LEGAL PROCEEDINGS
We are involved in a variety of legal actions that arise in the normal course of business. Insurance coverage mitigates potential loss for certain of these matters. While we are unable to predict the ultimate outcome of these legal actions, it is our opinion that the disposition of these matters will not have a material adverse effect on our Consolidated Financial Statements, taken as a whole.
ITEM 4. MINE SAFETY DISCLOSURES
Not applicable.
PART II
ITEM 5. MARKET FOR THE REGISTRANT'S COMMON EQUITY,
RELATED STOCKHOLDER MATTERS AND ISSUER PURCHASES OF EQUITY SECURITIES
Our Common Stock is listed on the NYSE. In March 2011, in accordance with sunset provisions established in 1986, we effected conversion of all outstanding shares of Class B Common Stock to Common Stock. The table below includes the high and low prices of Common Stock for each calendar quarter during the past three years and the closing price at the end of each quarter.
Quarter Ended | |||||||||||
(Dollars) | December | March | June | September | |||||||
2017 | |||||||||||
High | 3.76 | 3.30 | 3.10 | 2.40 | |||||||
Low | 2.40 | 2.40 | 1.75 | 1.80 | |||||||
Closing | 2.90 | 2.60 | 1.90 | 2.20 | |||||||
2016 | |||||||||||
High | 2.54 | 2.20 | 2.43 | 3.92 | |||||||
Low | 1.43 | 1.15 | 1.69 | 1.74 | |||||||
Closing | 1.68 | 1.80 | 1.91 | 3.75 | |||||||
2015 | |||||||||||
High | 3.93 | 3.73 | 3.55 | 3.40 | |||||||
Low | 3.07 | 2.74 | 2.78 | 1.36 | |||||||
Closing | 3.68 | 3.17 | 3.33 | 2.08 | |||||||
At September 24, 2017, we had 6,095 registered holders of record of our Common Stock.
18
Our debt agreements generally limit our ability to pay dividends and repurchase Common Stock unless in each case no default has occurred and we have satisfied certain financial measurements. See Note 4 of the Notes to Consolidated Financial Statements, included herein.
PERFORMANCE PRESENTATION
The following graph compares the percentage change in the cumulative total return of the Company, the Standard & Poor's ("S&P") 500 Stock Index, and a peer group index, in each case for the five years ended September 30, 2017 (with September 30, 2012 as the measurement point). Total return is measured by dividing (a) the sum of (i) the cumulative amount of dividends declared for the measurement period, assuming dividend reinvestment and (ii) the difference between the issuer's share price at the end and the beginning of the measurement period, by (b) the share price at the beginning of the measurement period.
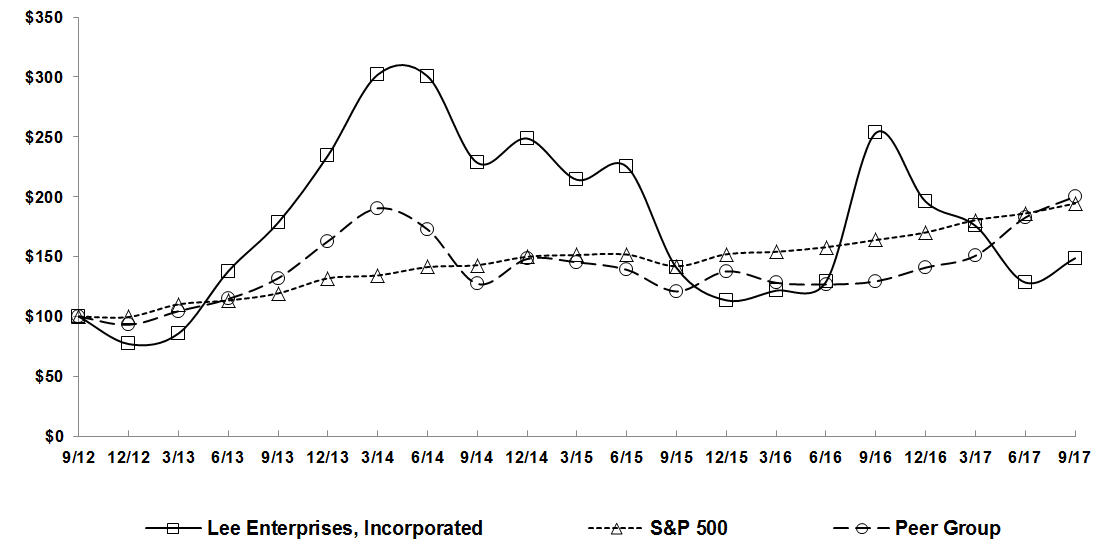
Copyright© 2017 Standard & Poor's, a division of S&P Global. All rights reserved.
The value of $100 invested on September 30, 2012 in stock of the Company, the Peer Group Index and in the S&P 500 Stock Index, including reinvestment of dividends, is summarized in the table below.
September 30 | |||||||||||||||||
(Dollars) | 2012 | 2013 | 2014 | 2015 | 2016 | 2017 | |||||||||||
Lee Enterprises, Incorporated | 100.00 | 178.38 | 228.38 | 140.54 | 253.38 | 148.65 | |||||||||||
Peer Group Index | 100.00 | 131.94 | 127.30 | 120.95 | 129.33 | 200.09 | |||||||||||
S&P 500 Stock Index | 100.00 | 119.34 | 142.89 | 142.02 | 163.93 | 194.44 | |||||||||||
The S&P 500 Stock Index includes 500 U.S. companies in the industrial, transportation, utilities and financial sectors and is weighted by market capitalization. The New Peer Group Index is comprised of three U.S. publicly traded companies with significant newspaper publishing operations (excluding the Company) and is weighted by market capitalization. The Peer Group Index includes A.H. Belo Corp., The McClatchy Company and The New York Times Company.
19
ITEM 6. SELECTED FINANCIAL DATA
Selected financial data is as follows:
(Thousands of Dollars and Shares, Except Per Common Share Data) | 2017 | 2016 | 2015 | 2014 | 2013 | |||||||||
OPERATING RESULTS (1) | ||||||||||||||
Operating revenue | 566,943 | 614,364 | 648,543 | 660,877 | 677,774 | |||||||||
Operating expenses, excluding depreciation, amortization, and impairment of intangible and other assets | 441,873 | 476,413 | 501,760 | 505,822 | 517,047 | |||||||||
Depreciation and amortization | 41,282 | 43,441 | 45,563 | 48,511 | 55,527 | |||||||||
Loss (gain) on sales of assets, net | (3,667 | ) | (3,139 | ) | 106 | (1,338 | ) | 110 | ||||||
Impairment of intangible and other assets (1) | 2,517 | 2,185 | — | 2,980 | 171,094 | |||||||||
Equity in earnings of associated companies | 7,609 | 8,533 | 8,254 | 8,297 | 8,685 | |||||||||
Operating income (loss) | 92,547 | 103,997 | 109,368 | 113,199 | (57,319 | ) | ||||||||
Interest expense | (57,573 | ) | (64,233 | ) | (72,409 | ) | (79,724 | ) | (89,447 | ) | ||||
Debt financing and administration costs | (4,818 | ) | (5,947 | ) | (5,433 | ) | (22,927 | ) | (646 | ) | ||||
Gain on insurance settlement | — | 30,646 | — | — | — | |||||||||
Other, net | 10,060 | (6,268 | ) | 6,386 | 3,413 | 8,189 | ||||||||
Income (loss) from continuing operations | 28,605 | 36,019 | 24,318 | 7,671 | (76,478 | ) | ||||||||
Discontinued operations, net of income taxes | — | — | — | — | (1,246 | ) | ||||||||
Net income (loss) | 28,605 | 36,019 | 24,318 | 7,671 | (77,724 | ) | ||||||||
Income (loss) attributable to Lee Enterprises, Incorporated | 27,481 | 34,961 | 23,316 | 6,795 | (78,317 | ) | ||||||||
Income (loss) from continuing operations attributable to Lee Enterprises, Incorporated | 27,481 | 34,961 | 23,316 | 6,795 | (77,071 | ) | ||||||||
Basic: | ||||||||||||||
Continuing operations | 0.51 | 0.66 | 0.44 | 0.13 | (1.49 | ) | ||||||||
Discontinued operations | — | — | — | — | (0.02 | ) | ||||||||
0.51 | 0.66 | 0.44 | 0.13 | (1.51 | ) | |||||||||
Diluted: | ||||||||||||||
Continuing operations | 0.50 | 0.64 | 0.43 | 0.13 | (1.49 | ) | ||||||||
Discontinued operations | — | — | — | — | (0.02 | ) | ||||||||
0.50 | 0.64 | 0.43 | 0.13 | (1.51 | ) | |||||||||
Weighted average common shares: | ||||||||||||||
Basic | 53,990 | 53,198 | 52,640 | 52,273 | 51,833 | |||||||||
Diluted | 55,392 | 54,224 | 53,931 | 53,736 | 51,833 | |||||||||
Total assets | 620,850 | 662,855 | 747,825 | 811,275 | 827,705 | |||||||||
Debt, including current maturities (2) | 548,385 | 617,167 | 725,872 | 804,750 | 847,500 | |||||||||
Debt, net of cash and restricted cash (2) | 537,764 | 600,183 | 714,738 | 787,605 | 829,938 | |||||||||
Stockholders' deficit | (92,235 | ) | (128,485 | ) | (159,393 | ) | (178,253 | ) | (170,350 | ) | ||||
20
(1 | ) | The Company recorded pretax, non-cash impairment charges to reduce the carrying value of assets as follows: |
(Thousands of Dollars) | 2017 | 2016 | 2015 | 2014 | 2013 | |||||||||
Continuing operations: | ||||||||||||||
Goodwill | — | — | — | — | — | |||||||||
Non-amortized intangible assets | 2,035 | 818 | — | 1,936 | 1,567 | |||||||||
Amortizable intangible assets | — | — | — | — | 169,041 | |||||||||
Property, equipment and other assets | 482 | 1,367 | — | 1,044 | 486 | |||||||||
2,517 | 2,185 | — | 2,980 | 171,094 | ||||||||||
(2 | ) | Principal amount of debt, excluding fair value adjustments. See Note 4 of the Notes to Consolidated Financial Statements, included herein. | |
ITEM 7. MANAGEMENT'S DISCUSSION AND ANALYSIS OF
FINANCIAL CONDITION AND RESULTS OF OPERATIONS
The following discussion includes comments and analysis relating to our results of operations and financial condition as of September 24, 2017 and for 2017, 2016 and 2015. This discussion should be read in conjunction with the Consolidated Financial Statements and related Notes thereto, included herein.
NON-GAAP FINANCIAL MEASURES
We use non-GAAP financial performance measures for purposes of evaluating our performance and liquidity. We believe that each of the non-GAAP measures presented provides useful information to investors by allowing them to view our businesses through the eyes of our management and Board of Directors, facilitating comparison of results across historical periods, and providing a focus on the underlying ongoing operating performance and liquidity of our businesses. The non-GAAP financial measures we use are as follows:
Adjusted EBITDA is a non-GAAP financial performance measure that enhances a financial statement user's overall understanding of the operating performance of the Company. The measure isolates unusual, infrequent or non-cash transactions from the continuing operating performance of the business. This allows users to easily compare operating performance among various fiscal periods and understand how management measures the performance of the business. This measure also provides users with a benchmark that can be used when forecasting future operating performance of the Company that excludes unusual, nonrecurring or one time transactions. Adjusted EBITDA is also a component of the calculation used by stockholders and analysts to determine the value of our business when using the market approach, which applies a market multiple to financial metrics. It is also a measure used to calculate the leverage ratio of the Company, which is a key financial ratio monitored and used by the Company and its investors. Adjusted EBITDA is defined as net income (loss), plus nonoperating expenses (income), net, income tax expense (benefit), depreciation, amortization, loss (gain) on sale of assets, impairment charges, workforce adjustment costs, stock compensation and our 50% share of EBITDA from TNI and MNI, minus equity in earnings of TNI and MNI and curtailment gains.
Adjusted Income (Loss) and Adjusted Earnings (Loss) Per Common Share are non-GAAP financial performance measures that we believe offer a useful metric to evaluate overall performance of the Company by providing financial statement users the operating performance of the Company on a per share basis excluding the impact of changes in the warrant valuation as well as unusual and infrequent transactions. It is defined as income (loss) attributable to Lee Enterprises, Incorporated and diluted earnings (loss) per common share adjusted to exclude the impact of the warrant valuation and the insurance settlement.
Cash Costs is a non-GAAP financial performance measure of operating expenses that are settled in cash and is useful to investors in understanding the components of the Company’s cash operating costs. Generally, the Company provides forward-looking guidance of Cash Costs, which can be used by financial statement users to assess the Company's ability to manage and control its operating cost structure. Cash Costs is defined as compensation, newsprint and ink, other operating expenses and workforce adjustments and other. Depreciation, amortization, impairment charges, other non-cash operating expenses and other expenses are excluded. Cash Costs are also presented excluding workforce adjustments, which are paid in cash.
21
We also present revenue and certain operating expense trends on a Same Property basis which excludes results from the acquisition of the Dispatch-Argus and a small weekly publication acquired in 2017 as well as the operating results of the Daily Herald in Provo, UT, which was sold in August 2016. Same Property results are useful to investors in understanding the revenue and operating expense trends excluding the impact of changes due to operations no longer owned by the Company or operations that were recently acquired.
A table reconciling adjusted EBITDA to net income (loss), the most directly comparable measure under GAAP, is set forth below under the caption "Reconciliation of Non-GAAP Financial Measures".
Reconciliations of adjusted income (loss) and adjusted earnings per diluted common share to income (loss) attributable to Lee Enterprises, Incorporated and earnings (loss) per diluted common share, respectively, the most directly comparable measures under GAAP, are set forth in Item 7, included herein, under the caption “Overall Results”.
The subtotals of operating expenses representing cash costs can be found in tables in Item 7, included herein, under the captions “2017 vs. 2016” and “2016 vs. 2015”.
RECONCILIATION OF NON-GAAP FINANCIAL MEASURES
(UNAUDITED)
The table below reconciles the non-GAAP financial performance measure of adjusted EBITDA to net income, the most directly comparable GAAP measure:
(Thousands of Dollars) | 2017 | 2016 | 2015 | |||
Net Income | 28,605 | 36,019 | 24,318 | |||
Adjusted to exclude | ||||||
Income tax expense | 11,611 | 22,176 | 13,594 | |||
Non-operating expenses, net | 52,331 | 45,802 | 71,456 | |||
Equity in earnings of TNI and MNI | (7,609 | ) | (8,533 | ) | (8,254 | ) |
Loss (gain) on sale of assets, net | (3,667 | ) | (3,139 | ) | 106 | |
Impairment of intangible and other assets | 2,517 | 2,185 | — | |||
Depreciation and amortization | 41,282 | 43,441 | 45,563 | |||
Workforce adjustments and other | 7,523 | 1,825 | 3,304 | |||
Stock compensation | 2,088 | 2,306 | 1,971 | |||
Add: | ||||||
Ownership share of TNI and MNI EBITDA (50%) | 9,927 | 11,705 | 11,246 | |||
Adjusted EBITDA | 144,608 | 153,787 | 163,304 | |||
CRITICAL ACCOUNTING POLICIES
Our discussion and analysis of operations and financial condition are based upon our Consolidated Financial Statements, which have been prepared in accordance with Generally Accepted Accounting Principles ("GAAP"). The preparation of these financial statements requires us to make estimates and judgments that affect the reported amounts of assets, liabilities, revenue and expenses, and related disclosure of contingent assets and liabilities. We evaluate our estimates on an on-going basis.
We base our estimates on historical experience and on various other assumptions that are believed to be reasonable under the circumstances, the results of which form the basis for making judgments about the carrying values of assets and liabilities that are not readily apparent from other sources. Actual results may differ from these estimates under different assumptions or conditions. Additional information follows with regard to certain of the most critical of our accounting policies.
Intangible Assets, Other Than Goodwill
In assessing the recoverability of non-amortized intangible assets, we annually assess qualitative factors affecting
22
our business to determine if the probability of a goodwill impairment is more likely than not. Our assessment includes reviewing internal and external factors affecting our business, such as revenue projections and other industry or market considerations. This assessment is made as of the first day of our fourth fiscal quarter of each year.
We analyze non-amortized intangible assets for impairment more frequently if impairment indicators are present. Such indicators of impairment include, but are not limited to, changes in business climate and operating or cash flow losses related to such assets.
Should we determine that a non-amortized intangible asset impairment is more likely than not, we make a determination of the individual asset's fair value. Fair value is determined using the relief from royalty method, which estimates fair value based upon appropriate royalties of future revenue discounted to their present value. The impairment amount, if any, is calculated based on the excess of the carrying amount over the fair value of such asset.
We review our amortizable intangible assets for impairment when indicators of impairment are present. We assess recoverability of these assets by comparing the estimated undiscounted cash flows associated with the asset group with their carrying amount. The impairment amount, if any, is calculated based on the excess of the carrying amount over the fair value of those asset groups.
The required valuation methodology and underlying financial information that are used to determine fair value require significant judgments to be made by us and represent a Level 3 fair value measurement. These judgments include, but are not limited to, long term projections of future financial performance and the selection of appropriate discount rates used to determine the present value of future cash flows. Changes in such estimates or the application of alternative assumptions could produce significantly different results.
We also periodically evaluate our determination of the useful lives of amortizable intangible assets. Any resulting changes in the useful lives of such intangible assets will not impact our cash flows. However, a decrease in the useful lives of such intangible assets would increase future amortization expense and decrease future reported operating results and earnings per common share.
In 2017 and 2016, due to continuing revenue declines, we recorded non-cash charges to reduce the carrying value of non-amortized intangible assets. We also recorded pretax, non-cash charges to reduce the carrying value of property, equipment and other assets in 2017 and 2016. We recorded deferred income tax benefits related to these charges.
A summary of impairment charges is included in the table below:
(Thousands of Dollars) | 2017 | 2016 | 2015 | |||||
Continuing operations: | ||||||||
Non-amortized intangible assets | 2,035 | 818 | — | |||||
Property, equipment and other assets | 482 | 1,367 | — | |||||
2,517 | 2,185 | — | ||||||
Future decreases in our market value, or significant differences in revenue, expenses or cash flows from estimates used to determine fair value, could result in additional impairment charges in the future.
Pension, Postretirement and Postemployment Benefit Plans
We evaluate our liability for pension, postretirement and postemployment benefit plans based upon computations made by consulting actuaries, incorporating estimates and actuarial assumptions of future plan service costs, future interest costs on projected benefit obligations, rates of compensation increases, when applicable, employee turnover rates, anticipated mortality rates, expected investment returns on plan assets, asset allocation assumptions of plan assets, and other factors. If we used different estimates and assumptions regarding these plans, the funded status of the plans could vary significantly, resulting in recognition of different amounts of expense over future periods.
Increases in market interest rates, which may impact plan assumptions, generally result in lower service costs for current employees, higher interest expense and lower liabilities. Actual returns on plan assets that are lower than
23
the plan assumptions will generally result in decreases in a plan's funded status and may necessitate additional contributions.
Income Taxes
Deferred income taxes are provided using the asset and liability method, whereby deferred income tax assets are recognized for deductible temporary differences and loss carryforwards and deferred income tax liabilities are recognized for taxable temporary differences. Temporary differences are the difference between the reported amounts of assets and liabilities and their tax basis. We currently have recorded valuation allowances that we will maintain until, in our opinion, it is more likely than not that some portion or all of the deferred tax assets will be realized. Deferred income tax assets and liabilities are adjusted for the effects of changes in tax laws and rates on the date of enactment. Our income tax expense recorded in the future may be increased or decreased to the extent our valuation allowances change. An increase in the valuation allowance could result in additional income tax expense, while a decrease in the valuation allowance could result in a reduction to income tax expense, in such period and could have a significant impact on our future earnings.
We recognize the effect of income tax positions only if those positions are more likely than not of being sustained. Recognized income tax positions are measured at the largest amount that is greater than 50% likely of being realized. Changes in recognition or measurement are reflected in the period in which the change in judgment occurs. We record interest and penalties related to unrecognized tax benefits as a component of income tax expense. Changes in accounting for uncertain tax positions can result in additional variability in our effective income tax rate.
Our current and deferred income tax provisions are calculated based on estimates and assumptions that could differ from the actual results reflected in income tax returns filed during the subsequent year. These estimates are reviewed and adjusted, if needed, throughout the year. Adjustments between our estimates and the actual results of filed returns are recorded when identified.
We file income tax returns with the Internal Revenue Service (“IRS”) and various state tax jurisdictions. From time to time, we are subject to routine audits by those agencies, and those audits may result in proposed adjustments. We have considered the alternative interpretations that may be assumed by the various taxing agencies, believe our positions taken regarding our filings are valid, and that adequate tax liabilities have been recorded to resolve such matters. However, the actual outcome cannot be determined with certainty and the difference could be material, either positively or negatively, to the Consolidated Statements of Income and Comprehensive Income in the periods in which such matters are ultimately determined. See "Changes in Laws and Regulations."
Revenue Recognition
Advertising revenue is recorded when advertisements are placed in the publication or on the related digital platform. Subscription revenue is recorded over the print or digital subscription term as the product is delivered or made available or as newspapers are individually sold. Other revenue is recognized when the related product or service has been delivered. Unearned revenue arises in the ordinary course of business from advance subscription payments for print or digital products or advance payments for advertising.
Uninsured Risks
We are self-insured for health care, workers compensation and certain long-term disability costs of our employees, subject to stop loss insurance, which limits exposure to large claims. We accrue our estimated health care costs in the period in which such costs are incurred, including an estimate of incurred but not reported claims. Other risks are insured and carry deductible losses of varying amounts.
Our accrued reserves for health care and workers compensation claims are based upon estimates of the remaining liability for retained losses made by consulting actuaries. The amount of workers compensation reserve has been determined based upon historical patterns of incurred and paid loss development factors from the insurance industry.
An increasing frequency of large claims, deterioration in overall claim experience or changes in federal or state laws affecting our liability for such claims could increase the volatility of expenses for such self-insured risks.
24
IMPACT OF RECENTLY ISSUED ACCOUNTING STANDARDS
In March 2017, the Financial Accounting Standards Board ("FASB") issued a new standard to improve the presentation of pension and postretirement benefit expense. The new standard requires that the service cost component of pension and postretirement benefits expense is recognized as compensation expense, while the remaining components of the expense are presented outside of operating income. The current presentation includes all components of the expense as Compensation in our Consolidated Statements of Income and Comprehensive Income. The adoption of the new standard is required in 2019. Based on 2017 results, the adoption of this standard will reduce operating income by $6,574,000, which includes the impact of a $3,741,000 curtailment gain, however net income will remain unchanged.
In August 2016, the Financial Accounting Standards Board ("FASB") issued a new standard to conform the presentation in the statement of cash flows for certain transactions, including cash distributions from equity method investments, among others. The adoption of the new standard is required in 2019. The adoption of this standard may reclassify certain cash receipts within the Consolidated Statements of Cash Flows.
In March 2016, the FASB issued a new standard that makes improvements to the accounting for employee share-based payments. The new standard simplifies several aspects of the accounting for employee share-based payment transactions, including the accounting for income taxes and statutory tax withholding requirements, as well as classification in the statement of cash flows. The adoption of the new standard is required in 2018. We do not believe the impact from the adoption of this standard to have a material impact on the Consolidated Financial Statements.
In February 2016, the FASB issued a new standard for the accounting treatment of leases. The new standard is based on the principle that entities should recognize assets and liabilities arising from leases. The new standard does not significantly change the lessees’ recognition, measurement and presentation of expenses and cash flows from the previous accounting standard. Leases are classified as finance or operating. The new standards primary change is the requirement for entities to recognize a lease liability for payments and a right of use asset representing the right to use the leased asset during the term on operating lease arrangements. Lessees are permitted to make an accounting policy election to not recognize the asset and liability for leases with a term of twelve months or less. Lessors’ accounting under the new standard is largely unchanged from the previous accounting standard. In addition, the new standard expands the disclosure requirements of lease arrangements. Lessees and lessors will use a modified retrospective transition approach, which includes a number of practical expedients.
We currently anticipate adopting the new lease standard in the first quarter of fiscal year 2020. To date we have made progress in our assessment of the new lease standard. We are currently evaluating the provisions of the updated guidance and assessing the impact on our Consolidated Financial Statements.
In May 2014, the FASB issued new accounting requirements for the recognition of revenue from contracts with customers. The new requirements include additional disclosure about the nature, amount, timing and uncertainty of revenue and cash flows arising from customer contracts, including significant judgments and changes in judgments and assets recognized from costs incurred to obtain or fulfill a contract. In April and May 2016, the FASB also issued clarifying updates to the new standard specifically to address certain core principles including the identification of performance obligations, licensing guidance, the assessment of the collectability criterion, the presentation of taxes collected from customers, noncash considerations, contract modifications, and completed contracts at transition. The adoption of these requirements is required in 2019.
We currently anticipate adopting the new revenue recognition standard using the modified retrospective approach in the fiscal year beginning October 1, 2018. This approach consists of recognizing the cumulative effect of initially applying the standard as an adjustment to opening retained earnings.
During 2017, we established a project team to identify potential differences that would result from the application of this standard. We are in the process of reviewing our customer contracts, identifying contractual provisions that may result in a change in the timing or the amount of revenue recognized and assessing the enhanced disclosure requirements of the new guidance. Based on our evaluation, we expect to adopt the requirements of the new standard in the first quarter of 2019 and anticipate using the modified retrospective transition method.
25
CONTINUING OPERATIONS
2017 vs. 2016
Operating results, as reported in the Consolidated Financial Statements, are summarized below:
(Thousands of Dollars and Shares, Except Per Share Data) | 2017 | 2016 | Percent Change | Same Property | ||||||
Advertising and marketing services revenue: | ||||||||||
Retail | 212,737 | 238,641 | (10.9 | ) | (10.0 | ) | ||||
Classified | 88,429 | 101,077 | (12.5 | ) | (12.2 | ) | ||||
National | 20,049 | 22,114 | (9.3 | ) | (8.6 | ) | ||||
Niche publications and other | 10,145 | 11,631 | (12.8 | ) | (13.9 | ) | ||||
Total advertising and marketing services revenue | 331,360 | 373,463 | (11.3 | ) | (10.6 | ) | ||||
Subscription | 191,922 | 194,002 | (1.1 | ) | (0.6 | ) | ||||
Digital services | 14,008 | 14,240 | (1.6 | ) | (1.3 | ) | ||||
Commercial printing | 9,742 | 12,269 | (20.6 | ) | (20.0 | ) | ||||
Other | 19,911 | 20,390 | (2.3 | ) | (2.3 | ) | ||||
Total operating revenue | 566,943 | 614,364 | (7.7 | ) | (7.1 | ) | ||||
Compensation | 209,692 | 229,752 | (8.7 | ) | (8.4 | ) | ||||
Newsprint and ink | 24,904 | 26,110 | (4.6 | ) | (4.7 | ) | ||||
Other operating expenses | 199,754 | 218,726 | (8.7 | ) | (7.4 | ) | ||||
Workforce adjustments and other | 7,523 | 1,825 | NM | NM | ||||||
Cash costs | 441,873 | 476,413 | (7.3 | ) | (6.5 | ) | ||||
125,070 | 137,951 | (9.3 | ) | (9.4 | ) | |||||
Depreciation | 16,026 | 17,291 | (7.3 | ) | ||||||
Amortization | 25,256 | 26,150 | (3.4 | ) | ||||||
Gain on sales of assets, net | (3,667 | ) | (3,139 | ) | 16.8 | |||||
Impairment of intangible and other assets | 2,517 | 2,185 | 15.2 | |||||||
Equity in earnings of associated companies | 7,609 | 8,533 | (10.8 | ) | ||||||
Operating income | 92,547 | 103,997 | (11.0 | ) | ||||||
Non-operating expense, net | (52,331 | ) | (45,802 | ) | 14.3 | |||||
Income before income taxes | 40,216 | 58,195 | (30.9 | ) | ||||||
Income tax expense | 11,611 | 22,176 | (47.6 | ) | ||||||
Net income | 28,605 | 36,019 | (20.6 | ) | ||||||
Net income attributable to non-controlling interests | (1,124 | ) | (1,058 | ) | 6.2 | |||||
Income attributable to Lee Enterprises, Incorporated | 27,481 | 34,961 | (21.4 | ) | ||||||
Other comprehensive income (loss), net | 6,710 | (6,503 | ) | NM | ||||||
Comprehensive income (loss) attributable to Lee Enterprises, Incorporated | 34,191 | 28,458 | 20.1 | |||||||
Earnings per common share: | ||||||||||
Basic | 0.51 | 0.66 | (22.7 | ) | ||||||
Diluted | 0.50 | 0.64 | (21.9 | ) | ||||||
All of the revenue and operating expense trends discussed below are on a Same Property basis, unless otherwise noted, to reflect the impact of the acquisitions of the Dispatch-Argus and a small weekly publication in 2017 as well as the sale of the Daily Herald in Provo, UT in 2016.
Advertising and Marketing Services Revenue
In 2017, advertising and marketing services revenue decreased $39,062,000, or 10.6%, compared to 2016. Retail advertising decreased 10.0%. The decrease in retail advertising revenue is due to continued softness in print advertising demand resulting in reduced advertising volume primarily from large retail, big box stores and classifieds. Digital retail advertising on a stand-alone basis increased 9.4%, partially offsetting print declines.
26
Classified revenue decreased $12,157,000, or 12.2%, in 2017 as we continue to experience a reduction in print advertising from automotive, employment and real estate in most of our markets which combined, declined 18.3%. While other classified revenue, which includes obituaries and legal notices, declined $1,435,000, or 3.5%, in 2017. Digital classified revenue on a stand-alone basis increased 5.8%.
National advertising decreased $1,869,000, or 8.6%. Digital national advertising on a stand-alone basis increased 6.0%.
Niche publications and other decreased $1,610,000, or 13.9%, in 2017. Declines were primarily due to elimination of products that do not meet our profit margin standards.
On a stand-alone basis, digital advertising included in advertising marketing services revenue increased 8.0% to $91,947,000, in 2017, representing 28.0% of total advertising and marketing services revenue. Total digital revenue including TownNews.com and all other digital business totaled $105,954,000 in 2017, an increase of 6.7% over 2016. TownNews.com generates the majority of its revenue from content management services at our properties as well as 1,600 other newspapers and other media operations. Print advertising, including preprints and print marketing services revenue, decreased 16.2%.
Subscription and Other Revenue
Subscription revenue decreased $1,083,000, or 0.6%, in 2017. Selective price increases mostly offset paid subscription revenue declines from reduced volume.
Our average daily newspaper circulation, including TNI, MNI and digital subscribers, totaled 0.8 million in 2017. Sunday circulation totaled 1.2 million.
Digital services revenue decreased $189,000, or 1.3%, due to a decrease in online surveys revenue, offset by revenue growth at TownNews.com. Commercial printing revenue decreased $2,420,000, or 20.0%, in 2017 Period due to decreased volume from several of our existing customers.
In 2017, our mobile, tablet, desktop and app sites, including TNI and MNI, attracted an average of 25.4 million unique visitors per month, with 227.2 million monthly page views, a 5.7% increase compared to 2016. Increased audience engagement is driving a higher number pages viewed per user session in 2017. Research in our larger markets indicates we are maintaining our share of audience in our markets through the combination of digital audience growth and strong print newspaper readership.
Operating Expenses
Operating expenses on a GAAP basis decreased 7.1% in 2017. Excluding workforce adjustments, cash costs decreased $36,004,000 or, 7.7%, in 2017.
Compensation expense decreased $19,064,000, or 8.4%, in 2017, driven by a decline of 8.5% in average full time equivalent employees and lower self-insured medical costs.
Newsprint and ink costs decreased $1,226,000, or 4.7%, in 2017, as a result of a 12.2% reduction in newsprint volume partially offset by higher prices. See Item 7A, “Commodities”, included herein, for further discussion and analysis of the impact of newsprint on our business.
Other operating expenses decreased $15,714,000, or 7.4%, in 2017. Other operating expenses include all operating costs not considered to be compensation, newsprint, depreciation, amortization, or workforce adjustments and other. The largest components of these costs include delivery, postage, outsourced printing, digital cost of goods sold and facility expenses. Cost reductions were primarily related to lower subscriber delivery cost from low print distribution volumes and a decrease in postage costs, as a result of a reduction in direct mail advertising volumes.
Workforce adjustment an other costs totaled $7,523,000 and $1,825,000 in 2017 and 2016, respectively. The 2017 includes a $2,600,000 expense to record an estimate of a partial withdrawal liability from one of our multiemployer pension plans.
27
Results of Operations
On a GAAP basis, depreciation expense decreased $1,265,000, or 7.3%, and amortization expense decreased $894,000, or 3.4%, in 2017. Sales of operating assets and other, net totaled $3,667,000 in 2017 and included a $3,741,000 curtailment gain from the elimination of an unfunded employee benefit plan. Sales of operating assets in 2016 resulted in a net gain of $3,139,000, including the gain on the sale of the Provo Daily Herald.
In 2017, we recorded $2,517,000 of non-cash impairment charges compared to $2,185,000 in 2016.
Equity in earnings of TNI and MNI decreased $924,000 in 2017.
The factors noted above resulted in operating income of $92,547,000 in 2017 compared to $103,997,000 in 2016.
Nonoperating Income and Expenses
Interest expense decreased $6,660,000, or 10.4%, to $57,573,000 in 2017 due to lower debt balances. Our weighted average cost of debt, excluding amortization of debt financing cost, increased to 9.9% in 2017 compared to 9.7% in 2016, as the majority of our debt repayments in 2017 were made on the 1st Lien Term Loan, our lowest cost debt.
In 2016, we recognized a $30,646,000 gain on an insurance settlement. The settlement represents our share of a subrogation recovery arising from the settlement of claims for damages suffered as a result of a 2009 loss at one of our production facilities.
We recognized $4,818,000 of debt financing and administrative costs in 2017 compared to $5,947,000 in 2016 related to our 2014 refinancing, the majority of which was amortization. We also recognized a $1,250,000 gain on extinguishment of debt in 2016.
As more fully discussed in Note 4 of the Notes to the Consolidated Financial Statements, included herein, we recorded a liability for the Warrants, issued in connection with the Warrant Agreement. We remeasure the liability to fair value each reporting period, with changes reported in other non-operating income (expenses). Due to the fluctuation in the price of our Common Stock the estimated fair value of the warrant liability can change each period. We recorded non-operating income of $10,181,000 in 2017 and non-operating expenses of $7,519,000, in 2016.
Overall Results
We recognized income tax expense of $11,611,000, resulting in an effective tax rate of 28.9% in 2017 compared to 38.1% in 2016. The impact of the mark-to-market adjustment for our warrants has no related tax expense or benefit. See Note 10 of the Notes to the Consolidated Financial Statements, included herein, for a discussion of the differences between the expected federal income tax rate to the actual tax rates.
28
As a result of the factors noted above, income attributable to Lee Enterprises, Incorporated totaled $27,481,000 in 2017 compared to $34,961,000 in 2016. We recorded earnings per diluted common share of $0.50 in 2017 and $0.64 in 2016. Excluding the warrants fair value adjustment and the gain on insurance settlement, as detailed in the table below, diluted earnings per common share, as adjusted, were $0.31 in 2017, compared to $0.42 in 2016. Per share amounts may not add due to rounding.
2017 | 2016 | |||||||
(Thousands of Dollars, Except Per Share Data) | Amount | Per Share | Amount | Per Share | ||||
Income attributable to Lee Enterprises, Incorporated, as reported | 27,481 | 0.50 | 34,961 | 0.64 | ||||
Adjustments: | ||||||||
Warrants fair value adjustment | (10,181 | ) | 7,519 | |||||
Gain on insurance settlement | — | (30,646 | ) | |||||
(10,181 | ) | (23,127 | ) | |||||
Income tax effect of adjustments, net | — | 10,726 | ||||||
(10,181 | ) | (0.18 | ) | (12,401 | ) | (0.23 | ) | |
Income attributable to Lee Enterprises, Incorporated, as adjusted | 17,300 | 0.31 | 22,560 | 0.42 | ||||
29
2016 vs. 2015
Operating results, as reported in the Consolidated Financial Statements, are summarized below:
(Thousands of Dollars and Shares, Except Per Share Data) | 2016 | 2015 | Percent Change | |||||
Advertising and marketing services revenue: | ||||||||
Retail | 238,641 | 262,079 | (8.9 | ) | ||||
Classified | 101,077 | 116,480 | (13.2 | ) | ||||
National | 22,114 | 22,422 | (1.4 | ) | ||||
Niche publications and other | 11,631 | 11,118 | 4.6 | |||||
Total advertising and marketing services revenue | 373,463 | 412,099 | (9.4 | ) | ||||
Subscription | 194,002 | 194,474 | (0.2 | ) | ||||
Digital services | 14,240 | 12,522 | 13.7 | |||||
Commercial printing | 12,269 | 11,875 | 3.3 | |||||
Other | 20,390 | 17,573 | 16.0 | |||||
Total operating revenue | 614,364 | 648,543 | (5.3 | ) | ||||
Compensation | 229,752 | 239,028 | (3.9 | ) | ||||
Newsprint and ink | 26,110 | 30,263 | (13.7 | ) | ||||
Other operating expenses | 218,726 | 229,165 | (4.6 | ) | ||||
Workforce adjustments | 1,825 | 3,304 | (44.8 | ) | ||||
Cash costs | 476,413 | 501,760 | (5.1 | ) | ||||
137,951 | 146,783 | (6.0 | ) | |||||
Depreciation | 17,291 | 18,418 | (6.1 | ) | ||||
Amortization | 26,150 | 27,145 | (3.7 | ) | ||||
Loss (gain) on sales of assets, net | (3,139 | ) | 106 | NM | ||||
Impairment of intangible and other assets | 2,185 | — | NM | |||||
Equity in earnings of associated companies | 8,533 | 8,254 | 3.4 | |||||
Operating income | 103,997 | 109,368 | (4.9 | ) | ||||
Non-operating expense, net | (45,802 | ) | (71,456 | ) | (35.9 | ) | ||
Income from continuing operations before income taxes | 58,195 | 37,912 | 53.5 | |||||
Income tax expense | 22,176 | 13,594 | 63.1 | |||||
Net income | 36,019 | 24,318 | 48.1 | |||||
Net income attributable to non-controlling interests | (1,058 | ) | (1,002 | ) | 5.6 | |||
Income attributable to Lee Enterprises, Incorporated | 34,961 | 23,316 | 49.9 | |||||
Other comprehensive loss, net | (6,503 | ) | (6,445 | ) | 0.9 | |||
Comprehensive income attributable to Lee Enterprises, Incorporated | 28,458 | 16,871 | 68.7 | |||||
Earnings per common share: | ||||||||
Basic | 0.66 | 0.44 | 50.0 | |||||
Diluted | 0.64 | 0.43 | 48.8 | |||||
Advertising and Marketing Services Revenue
In 2016 advertising and marketing services revenue decreased $38,636,000, or 9.4%, compared to 2015. Retail advertising decreased 8.9%. The decrease in retail advertising revenue is due to reduced print advertising volume primarily from large retail, big box stores and classifieds. Digital retail advertising on a stand-alone basis increased 8.9%, partially offsetting print declines.
Classified revenue decreased $15,403,000, or 13.2% in 2016 as we continued to experience a reduction in print advertising from automotive, employment and real estate in most of our markets. Digital classified revenue on a stand-alone basis decreased 4.3%.
30
National advertising decreased $308,000 or 1.4%. Digital national advertising on a stand-alone basis increased 20.4% due to improved management of available ad positions offered on the national advertising exchanges and improved pricing. Revenue in niche publications and other increased $513,000, or 4.6%.
On a stand-alone basis, digital advertising included in advertising and marketing services revenue increased 5.6%, to $86,279,000 in 2016, representing 23.1% of total advertising and marketing services revenue. Mobile advertising revenue, which is included in digital advertising, increased 19.6% in 2016. Total digital revenue, including TownNews.com and all other digital business totaled $100,519,000 in 2016, an increase of 6.6% from a year ago. TownNews.com generates the majority of its revenue from content management services at our properties as well as 1,600 other newspapers and other media operations. Print advertising, including preprints and print marketing services revenue decreased 13.1%.
Subscription and Other Revenue
Subscription revenue decreased $472,000, or 0.2% in 2016. Subscription revenue was virtually flat as price increases and the addition of premium content days with higher single day pricing almost completely offset revenue declines from print subscription unit losses.
Our average daily newspaper circulation, including TNI, MNI and digital subscribers, totaled 0.9 million in 2017. Sunday circulation totaled 1.3 million.
Digital services revenue increased $1,718,000, or 13.7%, in 2016, largely due to TownNews.com. Commercial printing revenue increased $394,000, or 3.3% in 2016, due to new customers offset by decreased volume for existing customers at several of our large markets. Other revenue increased $2,817,000, or 16.0% in 2016, due to an increase in revenue for delivery of third party newspapers.
Our mobile, tablet, desktop and app sites, including TNI and MNI, attracted an average of 26.0 million unique visitors per month, with 218.8 million page views. Research in our larger markets indicates we are maintaining our share of audience in our markets through the combination of digital audience growth and strong print newspaper readership.
Operating Expenses
Operating expenses decreased 5.2% in 2016. Excluding workforce adjustments, cash costs decreased $23,868,000, or 4.8% in 2016.
Compensation expense decreased $9,276,000, or 3.9%, in 2016, driven by a decline of 7.9% in average full-time equivalent employees. Costs associated with our self-insured medical plan increased $4.0 million in 2016 due to higher claims costs compared to 2015, offsetting some of the costs due to the reduction in full-time equivalent employees.
Newsprint and ink costs decreased $4,153,000, or 13.7%, in 2016, primarily as a result of reduction in newsprint volume of 10.7%. See Item 7A, “Commodities”, included herein, for further discussion and analysis of the impact of newsprint on our business.
Other operating expenses decreased $10,439,000, or 4.6%, in 2016. Other operating expenses include all operating costs not considered to be compensation, newsprint, depreciation, amortization, or workforce adjustments and other. The largest components of these costs included delivery, postage, outsourced printing, digital cost of good sold, facility expenses among others. Cost reduction were primarily related to lower subscriber delivery cost from declines in print volumes and a decrease in postage costs, as a result to a reduction in direct mail advertising volumes.
Workforce adjustment costs totaled $1,825,000 and $3,304,000 in 2016 and 2015, respectively.
Results of Operations
Depreciation expense decreased $1,127,000, or 6.1%, and amortization expense decreased $995,000, or 3.7%, in 2016. Sales of operating assets including the sale of the Provo Daily Herald in August 2016, resulted in a net gain of $3,139,000 in 2016 compared to a net loss of $106,000 in 2015.
In 2016, we recorded $2,185,000 of non-cash impairment charges.
31
Equity in earnings in associated companies decreased $279,000 in 2016.
The factors noted above resulted in operating income of $103,997,000 in 2016 compared to $109,368,000 in 2015
Nonoperating Income and Expenses
Interest expense decreased $8,176,000, or 11.3%, to $64,233,000 in 2016 due to lower debt balances.
In 2016, we recognized a $30,646,000 gain on an insurance settlement. The settlement represents our share of a subrogation recovery arising from the settlement of claims for damages suffered as a result of a 2009 loss at one of our production facilities.
We recognized $5,947,000 of debt financing and administrative costs in 2016 compared to $5,433,000 in 2015, related to our 2014 refinancing. We also recognized $1,250,000 gain on extinguishment of debt in 2016.
Due to the fluctuation in the price of our Common Stock, we recorded non-operating expenses of $7,519,000 in 2016 and non-operating income of $6,568,000 in 2015 related to the change in fair value of the warrants.
Overall Results
We recognized income tax expense at 38.1% of income before income taxes in 2016 and 35.9% in 2015. See Note 10 of the Notes to the Consolidated Financial Statements, included herein, for a discussion of the difference between the expected federal income tax rate and the actual tax rates.
As a result of the factors noted above, income attributable to Lee Enterprises, Incorporated totaled $34,961,000 in 2016 compared to $23,316,000 in 2015. We recorded earnings per diluted common share of $0.64 in 2016 and $0.43 in 2015. Excluding the warrants fair value adjustment and the gain on the insurance settlement, as detailed in the table below, diluted earnings per common share, as adjusted, were $0.42 in 2016, compared to $0.31 in 2015. Per share amounts may not add due to rounding.
2016 | 2015 | |||||||
(Thousands of Dollars, Except Per Share Data) | Amount | Per Share | Amount | Per Share | ||||
Income attributable to Lee Enterprises, Incorporated, as reported | 34,961 | 0.64 | 23,316 | 0.43 | ||||
Adjustments: | ||||||||
Warrants fair value adjustment | 7,519 | (6,568 | ) | |||||
Gain on insurance settlement | (30,646 | ) | — | |||||
(23,127 | ) | (6,568 | ) | |||||
Income tax effect of adjustments, net | 10,726 | |||||||
(12,401 | ) | (0.23 | ) | (6,568 | ) | (0.12 | ) | |
Income attributable to Lee Enterprises, Incorporated, as adjusted | 22,560 | 0.42 | 16,748 | 0.31 | ||||
32
LIQUIDITY AND CAPITAL RESOURCES
Operating Activities
Cash provided by operating activities totaled $72,281,000 in 2017 compared to $79,190,000 in 2016 due to a decline in net income to $28,605,000 in 2017 from $36,019,000 in 2016. The decline in net income is primarily the result of continued softening of the print advertising environment partially offset by lower operating expenses and a decline in pension contributions.
Cash provided by operating activities totaled $79,190,000 in 2016 compared to $74,476,000 in 2015. The increase in cash flows in 2016 is due to an increase in net income of $36,019,000 in 2016 from $24,318,000 in 2015 as well as changes in operating assets and liabilities.
Pension liabilities, net of plan assets, totaled $43.5 million as of September 24, 2017. Contributions to pension plans are expected to total $4,940,000 in 2018.
Investing Activities
Cash required for investing activities totaled $9,455,000 in 2017 and cash provided by investing activities totaled $34,508,000 in 2016. The change in cash flows from investing activities is primarily related to a $30,646,000 insurance settlement in 2016. Proceeds from sales of assets totaled $2,582,000 and $9,878,000 in 2017 and 2016, respectively, and in 2017, $7,450,000 was used to acquire businesses. Capital spending totaled $4,078,000 and $7,091,000 in 2017 and 2016, respectively.
Cash provided by investing activities totaled $34,508,000 in 2016 and cash required for investing activities totaled $208,000 in 2015. The change in cash flows from investing activities is mainly due to a $30,646,000 insurance settlement in 2016. Proceeds from sales of assets totaled $9,878,000 in 2016 and $8,871,000 in 2015, respectively. Capital spending totaled $7,091,000 and $9,707,000 in 2016 and 2015, respectively.
We anticipate that funds necessary for capital expenditures, which are expected to total up to $10,000,000 in 2018, and other requirements, will be available from internally generated funds, or available under our Revolving Facility.
Financing Activities
Cash required for financing activities totaled $69,189,000 in 2017, $107,848,000 in 2016 and $79,838,000 in 2015. Debt reduction accounted for the majority of the usage of funds in all years.
Debt is summarized as follows:
Interest Rates (%) | |||||
(Thousands of Dollars) | September 24 2017 | September 25 2016 | September 24 2017 | ||
Revolving Facility | — | — | 6.7 | ||
1st Lien Term Loan | 45,145 | 101,304 | 7.5 | ||
Notes | 385,000 | 385,000 | 9.5 | ||
2nd Lien Term Loan | 118,240 | 130,863 | 12.0 | ||
548,385 | 617,167 | ||||
Less current maturities of long-term debt | 30,182 | 25,070 | |||
Total long-term debt | 496,379 | 565,826 | |||
At September 24, 2017, our weighted average cost of debt, excluding amortization of debt financing costs, is 9.9%.
At September 24, 2017, aggregate minimum required maturities of debt excluding amounts required to be paid from future excess cash flow computations total $30,182,000 in 2018, $20,145,000 in 2019, zero in 2020, zero in 2021, $385,000,000 in 2022 and $113,058,000 thereafter.
33
In addition to mandatory paydowns, the 1st and 2nd lien term loans require excess cash flow payments based on calculations defined in the credit agreements. See Note 4 of the Notes to the Consolidated Financial Statements.
Liquidity
At September 24, 2017, after consideration of letters of credit, we have approximately $33,818,000 available for future use under our Revolving Facility. Including cash, our liquidity at September 24, 2017 totals $44,439,000. This liquidity amount excludes any future cash flows. We expect all interest and principal payments due in the next twelve months will be satisfied by our cash flows, which will allow us to maintain an adequate level of liquidity. The Warrants, if and when exercised, would provide additional liquidity in an amount up to $25,140,000.
At September 24, 2017, the principal amount of our outstanding debt totals $548,385,000. For the last twelve months ending September 24, 2017, the principal amount of our debt, net of cash, is 3.7 times our adjusted EBITDA, compared to a ratio of 3.9 times at September 25, 2016.
The 2014 Refinancing significantly extended our debt maturity profile with final maturity of the majority of our debt in 2022. As a result, refinancing risk has been substantially reduced for the next several years.
There are numerous potential consequences under the Notes, 1st Lien Credit Facility, 2nd Lien Term Loan, if an event of default, as defined, occurs and is not remedied. Many of those consequences are beyond our control. The occurrence of one or more events of default would give rise to the right of the applicable lender(s) to exercise their remedies under the Notes, 1st Lien Credit Facility, 2nd Lien Term Loan, respectively, including, without limitation, the right to accelerate all outstanding debt and take actions authorized in such circumstances under applicable collateral security documents.
Our ability to operate as a going concern is dependent on our ability to remain in compliance with debt covenants and repay, refinance or amend our debt agreements as they become due, or earlier if liquidity is available. The Notes, 1st Lien Credit Facility and 2nd Lien Term Loan have only limited affirmative covenants with which we are required to maintain compliance. We are in compliance with our debt covenants at September 24, 2017.
In February 2017 our filing of a replacement Form S-3 registration statement ("Shelf") with the SEC, was declared effective and expires February 2020, maintaining an effective shelf is required under our credit agreements. The Shelf registration gives us the flexibility to issue and publicly distribute various types of securities, including preferred stock, common stock, warrants, secured or unsecured debt securities, purchase contracts and units consisting of any combination of such securities, from time to time, in one or more offerings, up to an aggregate amount of $750,000,000. SEC issuer eligibility rules require us to have a public float of at least $75,000,000 in order to use the Shelf. Subject to maintenance of the minimum level of equity market float and the conditions of our existing debt agreements, the Shelf may enable us to sell securities quickly and efficiently when market conditions are favorable or financing needs arise. Under our existing debt agreements, net proceeds from the sale of any securities may be used generally to reduce debt.
Other Matters
Cash and cash equivalents decreased $6,363,000 in 2017, increased $5,850,000 in 2016 and decreased $5,570,000 in 2015.
SEASONALITY
Our largest source of publishing revenue, retail advertising, is seasonal and tends to fluctuate with retail sales in markets served. Historically, retail advertising is higher in the December and June quarters. Advertising and marketing services revenue is lowest in the March quarter.
Quarterly results of operations are summarized in Note 16 of the Notes to Consolidated Financial Statements, included herein.
INFLATION
Price increases (or decreases) for our products are implemented when deemed appropriate by us. We continuously evaluate price increases, productivity improvements, sourcing efficiencies and other cost reductions to mitigate the impact of inflation.
34
CHANGES IN LAWS AND REGULATIONS
Energy Costs
Energy costs can be volatile, and may increase in the future as a result of carbon emissions and other regulations being developed by the United States Environmental Protection Agency.
Health Care Costs
The Affordable Care Act was enacted into law in 2010.
We expect the requirements under the Affordable Care Act will continue to evolve. Our future health care costs are expected to increase based on analysis published by the United States Department of Health and Human Services, input from independent advisors and our understanding of the current provisions of the Affordable Care Act, such as:
•Certain preventive services provided without additional charge to employees;
•Automatic enrollment of new employees;
•Higher maximum age for dependent coverage;
•Elimination of lifetime benefit caps; and
•Free choice vouchers for certain lower income employees.
We do not expect the Affordable Care Act will have a significant impact on our postretirement medical benefit obligation liability.
Pension Plans
In 2012, the Surface Transportation Extension Act of 2012 (“STEA”) was signed into law. STEA provides for changes in the determination of discount rates that result in a near-term reduction in minimum funding requirements for our defined benefit pension plans. STEA will also result in an increase in future premiums to be paid to the Pension Benefit Guarantee Corporation ("PBGC").
In 2014, the Highway and Transportation Funding Act ("HATFA") was signed into law. HATFA generally extends the relief offered under STEA and further increases premiums to be paid to the PBGC.
Income Taxes
Certain states in which we operate periodically consider changes to their corporate income tax rates. Until such changes are enacted, the impact of such changes cannot be determined.
Wage Laws
The United States and various state and local governments are considering increasing their respective minimum wage rates. Most of our employees earn an amount in excess of the current United States or state minimum wage rates. However, until changes to such rates are enacted, the impact of the changes cannot be determined.
35
CONTRACTUAL OBLIGATIONS
The following table summarizes our significant contractual obligations at September 24, 2017:
(Thousands of Dollars) | Payments (or Commitments) Due (Years) | |||||||||||||
Nature of Obligation | Total | Less Than 1 | 1-3 | 3-5 | More Than 5 | |||||||||
Debt (Principal Amount) (1) | 548,385 | 30,182 | 20,145 | 385,000 | 113,058 | |||||||||
Interest expense (2)(3) | 233,396 | 52,840 | 151,577 | 27,283 | 1,696 | |||||||||
Operating lease obligations | 10,304 | 2,976 | 2,607 | 1,223 | 3,498 | |||||||||
Capital expenditure commitments | 503 | 503 | — | — | — | |||||||||
792,588 | 86,501 | 174,329 | 413,506 | 118,252 | ||||||||||
(1) | Maturities of long-term debt are limited to mandatory payments and, accordingly, exclude excess cash flow, asset sale and other payments under the 1st Lien Credit Facility, Notes and the 2nd Lien Term Loan. While excess cash flow payments are based on actual performance, we expect to make voluntary and excess cash flow payments on the 1st and 2nd lien term loans currently outstanding, in the next five years. See Note 5 of the Notes to the Consolidated Financial Statements, included herein. |
(2) | Interest expense includes an estimate of interest expense for the Notes, 1st Lien Credit Facility, and 2nd Lien Term Loan until their maturities in March 2022, March 2019, and December 2022, respectively. Interest expense under the Notes is estimated using the 9.5% contractual rate applied to the outstanding balance as reduced by future contractual maturities of such debt. Interest expense under the 1st Lien Term Loan is estimated based on the one month LIBOR at September 24, 2017 of 1.24% as increased by our applicable margin of 6.25% applied to the outstanding balance, as reduced by future contractual maturities of such debt. Interest expense under the Revolving Facility is estimated based on the one month LIBOR at September 24, 2017 of 1.24% as increased by our applicable margin of 5.5% applied to the outstanding balance, as reduced by future contractual maturities of such debt. Interest expense under the 2nd Lien Term Loan is estimated using the 12.0% contractual rate applied to the outstanding balance during each period. Changes in interest rates in excess of current LIBOR levels, use of borrowing rates not based on LIBOR, use of interest rate hedging instruments, and/or principal payments in excess of contractual maturities or based on other requirements of the Notes, 1st Lien Credit Facility or 2nd Lien Term Loan could significantly change this estimate. See Note 5 of the Notes to Consolidated Financial Statements, included herein. |
(3) | Interest expense excludes non-cash present value adjustments and amortization of debt financing costs previously paid. See Note 5 of the Notes to Consolidated Financial Statements, included herein. |
The table above excludes future cash requirements for pension, postretirement and postemployment obligations. The periods in which these obligations will be settled in cash are not readily determinable and are subject to numerous future events and assumptions. See Notes 5 and 6 of the Notes to the Consolidated Financial Statements, included herein.
The contractual obligations above exclude unrecognized tax benefits to be recorded in accordance with FASB ASC Topic 740, Income Taxes. We are unable to reasonably estimate the ultimate amount or timing of cash settlements with the respective taxing authorities for such matters. A substantial amount of our deferred income tax liabilities will not result in future cash payments. See Note 10 of the Notes to the Consolidated Financial Statements, included herein.
ITEM 7A. QUANTITATIVE AND QUALITATIVE DISCLOSURES ABOUT MARKET RISK
We are exposed to market risk stemming from changes in interest rates and commodity prices. Changes in these factors could cause fluctuations in earnings and cash flows. In the normal course of business, exposure to certain of these market risks is managed as described below.
INTEREST RATES ON DEBT
Our debt structure, which is predominantly fixed rate, significantly reduces the potential financial impact of future increases in interest rates. At September 24, 2017, 8.2% of the principal amount of our debt is subject to floating interest rates. Our primary exposure is to LIBOR. A 100 basis point increase to LIBOR would, in excess of LIBOR minimums discussed more fully below, decrease income before income taxes on an annualized basis by approximately $451,000 based on $45,145,000 of floating rate debt outstanding at September 24, 2017.
Our debt under the 1st Lien Term Loan is subject to minimum LIBOR interest rate levels of 1.0%. Current LIBOR rates are in excess of the minimum and any future increases in LIBOR will affect our interest rates.
We regularly evaluate alternatives to hedge our interest rate risk, but have no hedging instruments in place.
36
COMMODITIES
Continuous declining demand for newsprint from printed publishing caused North American newsprint producers to permanently remove production capacity, approaching 1 million metric tonnes per year, in the second half of 2017 leading to tightening supply and price increases. Similar production capacity reductions have also taken place outside of North America. Currently, total U.S. based production capacity can only supply approximately one third of the current U.S. based newsprint demand with Canadian producers suppling the balance.
In addition to the capacity reductions one U.S. based newsprint and specialty high bright groundwood producer has filed an uncoated groundwood paper anti-dumping complaint requesting countervailing duty rates be applied to Canadian producers' imports into the U.S. The trade case has been reviewed by the U.S. International Trade Commission and has now moved to Department of Commerce to determine if antidumping and countervailing duties should be applied to sales by Canadian newsprint and uncoated groundwood producers to U.S. customers. A decision, which may or may not include tariffs, is scheduled to be made before mid-year 2018.
Capacity closures and a slightly weakening U.S. dollar have led to several price increases announcements with implementation across the December Quarter 2017 and into the beginning of 2018. Continued downward demand trends could stabilize upward price pressure on newsprint. However, the final decision on the anti-dumping and countervailing duty case has the potential to further increase prices, even with declining newsprint demand trends.
Our long term supply strategy continues to align the Company with those cost effective suppliers most likely to continue producing and supplying newsprint to the North American market and geographically aligned with our print locations.
A $10 per tonne price increase for 30 pound newsprint would result in an annualized reduction in income before taxes of approximately $365,000 based on anticipated consumption in 2018, excluding consumption of TNI and MNI and the impact of LIFO accounting. Such prices may also decrease. We manage significant newsprint inventories, which will temporarily mitigate the impact of any future price increases or decreases.
SENSITIVITY TO CHANGES IN VALUE
At September 24, 2017, the fair value of floating rate debt, which consists primarily of our 1st Lien Term Loan, is $45,145,000, based on an average of private market price quotations. Our fixed rate debt consists of $385,000,000 principal amount of the Notes and $118,240,000 principal amount under the 2nd Lien Term Loan. At September 24, 2017, based on an average of private market price quotations, the fair values were $397,513,000 and $121,787,000 for the Notes and 2nd Lien Term Loan, respectively.
ITEM 8. FINANCIAL STATEMENTS AND SUPPLEMENTARY DATA
Information with respect to this Item is included herein under the caption “Consolidated Financial Statements”.
ITEM 9. CHANGES IN AND DISAGREEMENTS WITH ACCOUNTANTS
ON ACCOUNTING AND FINANCIAL DISCLOSURE
Information with respect to this Item is included in our Proxy Statement to be filed in January 2017, which is incorporated herein by reference, under the caption “Relationship with Independent Registered Public Accounting Firm”.
ITEM 9A. CONTROLS AND PROCEDURES
EVALUATION OF DISCLOSURE CONTROLS AND PROCEDURES
Under the supervision and with the participation of our senior management, including our chief executive officer and chief financial officer, we conducted an evaluation of the effectiveness of the design and operation of our disclosure controls and procedures, as defined in Rules 13a-15(e) and 15d-15(e) under the Exchange Act, as of September 24, 2017, the end of the period covered by this Annual Report (the “Evaluation Date”). Based on this evaluation, our chief executive officer and chief financial officer concluded as of the Evaluation Date that our disclosure controls and procedures were effective such that the information relating to the Company, including our consolidated subsidiaries, required to be disclosed in our SEC reports (i) is recorded, processed, summarized and reported within the time periods specified in SEC rules and forms, and (ii) is accumulated and communicated to our management, including our chief executive officer and chief financial officer, as appropriate to allow timely decisions regarding required disclosure.
37
MANAGEMENT'S REPORT ON INTERNAL CONTROL OVER FINANCIAL REPORTING
The Company's management is responsible for establishing and maintaining adequate internal control over financial reporting as such term is defined in Rule 13a-15(f) of the Exchange Act. Any internal control system, no matter how well designed, has inherent limitations and may not prevent or detect misstatements. Accordingly, even those systems determined to be effective can provide only reasonable assurance with respect to financial statement preparation and presentation.
Under the supervision and with the participation of our senior management, including our chief executive officer and chief financial officer, we assessed the effectiveness of our internal control over financial reporting as of the Evaluation Date, using the criteria set forth in the Internal Control-Integrated Framework (2013) issued by the Committee of Sponsoring Organizations of the Treadway Commission. Based on this assessment, management has concluded that our internal control over financial reporting is effective as of the Evaluation Date.
Our independent registered public accounting firm, KPMG LLP, has issued a report on the Company's internal control over financial reporting. KPMG’s report on the audit of internal control over financial reporting appears in this Annual Report.
CHANGES IN INTERNAL CONTROL OVER FINANCIAL REPORTING
There have been no changes in our internal control over financial reporting that occurred during the 13 weeks ended September 24, 2017 that have materially affected or are reasonably likely to materially affect our internal control over financial reporting.
38
REPORT OF INDEPENDENT REGISTERED PUBLIC ACCOUNTING FIRM
The Board of Directors and Stockholders
Lee Enterprises, Incorporated:
We have audited Lee Enterprises, Incorporated and subsidiaries’ (the Company) internal control over financial reporting as of September 24, 2017, based on criteria established in Internal Control - Integrated Framework (2013) issued by the Committee of Sponsoring Organizations of the Treadway Commission (COSO). The Company’s management is responsible for maintaining effective internal control over financial reporting and for its assessment of the effectiveness of internal control over financial reporting, included in the accompanying Management’s Report on Internal Control over Financial Reporting. Our responsibility is to express an opinion on the Company’s internal control over financial reporting based on our audit.
We conducted our audit in accordance with the standards of the Public Company Accounting Oversight Board (United States). Those standards require that we plan and perform the audit to obtain reasonable assurance about whether effective internal control over financial reporting was maintained in all material respects. Our audit included obtaining an understanding of internal control over financial reporting, assessing the risk that a material weakness exists, and testing and evaluating the design and operating effectiveness of internal control based on the assessed risk. Our audit also included performing such other procedures as we considered necessary in the circumstances. We believe that our audit provides a reasonable basis for our opinion.
A company’s internal control over financial reporting is a process designed to provide reasonable assurance regarding the reliability of financial reporting and the preparation of financial statements for external purposes in accordance with generally accepted accounting principles. A company’s internal control over financial reporting includes those policies and procedures that (1) pertain to the maintenance of records that, in reasonable detail, accurately and fairly reflect the transactions and dispositions of the assets of the company; (2) provide reasonable assurance that transactions are recorded as necessary to permit preparation of financial statements in accordance with generally accepted accounting principles, and that receipts and expenditures of the company are being made only in accordance with authorizations of management and directors of the company; and (3) provide reasonable assurance regarding prevention or timely detection of unauthorized acquisition, use, or disposition of the company’s assets that could have a material effect on the financial statements.
Because of its inherent limitations, internal control over financial reporting may not prevent or detect misstatements. Also, projections of any evaluation of effectiveness to future periods are subject to the risk that controls may become inadequate because of changes in conditions, or that the degree of compliance with the policies or procedures may deteriorate.
In our opinion, Lee Enterprises, Incorporated and subsidiaries maintained, in all material respects, effective internal control over financial reporting as of September 24, 2017, based on criteria establish in Internal Control - Integrated Framework (2013) issued by the Committee of Sponsoring Organizations of the Treadway Commission (COSO).
We also have audited, in accordance with the standards of the Public Company Accounting Oversight Board (United States), the consolidated balance sheets of Lee Enterprises, Incorporated and subsidiaries as of September 24, 2017 and September 25, 2016, and the related consolidated statements of income and comprehensive income, stockholders’ equity (deficit), and cash flows for each of the 52-week periods ended September 24, 2017, September 25, 2016, and September 27, 2015, and our report dated December 8, 2017 expressed an unqualified opinion on those consolidated financial statements.
/s/ KPMG LLP
Chicago, Illinois
December 8, 2017
39
ITEM 9B. OTHER INFORMATION
None.
PART III
ITEM 10. DIRECTORS, EXECUTIVE OFFICERS AND CORPORATE GOVERNANCE
Information with respect to this Item, except for certain information related to our executive officers included under the caption “Executive Team” in Part I of this Annual Report, is included in our Proxy Statement to be filed in January 2018, which is incorporated herein by reference, under the captions “Proposal 1 - Election of Directors” and “Section 16(a) Beneficial Ownership Reporting Compliance”. Our executive officers are those elected officers whose names and certain information are set forth under the caption “Executive Team” in Part 1 of this Annual Report.
We have a Code of Business Conduct and Ethics ("Code") that applies to all of our employees, including our principal executive officer, and principal financial and accounting officer. The Code is monitored by the Audit Committee of our Board of Directors and is annually affirmed by our directors and executive officers. We maintain a corporate governance page on our website which includes the Code. The corporate governance page can be found at www.lee.net by clicking on “Governance” under the "About" tab. A copy of the Code will also be provided without charge to any stockholder who requests it. Any future amendment to, or waiver granted by us from, a provision of the Code will be posted on our website.
ITEM 11. EXECUTIVE COMPENSATION
Information with respect to this Item is included in our Proxy Statement to be filed in January 2018, which is incorporated herein by reference, under the captions, “Compensation of Non-Employee Directors”, “Executive Compensation” and “Compensation Discussion and Analysis”; provided, however, that the subsection entitled “Executive Compensation - Executive Compensation Committee Report” shall not be deemed to be incorporated by reference.
ITEM 12. SECURITY OWNERSHIP OF CERTAIN BENEFICIAL OWNERS AND MANAGEMENT
AND RELATED STOCKHOLDER MATTERS
Information with respect to this Item is included in our Proxy Statement to be filed in January 2018, which is incorporated herein by reference, under the captions “Voting Securities and Principal Holders Thereof” and “Equity Compensation Plan Information”.
ITEM 13. CERTAIN RELATIONSHIPS AND RELATED TRANSACTIONS
AND DIRECTOR INDEPENDENCE
Information with respect to this Item is included in our Proxy Statement to be filed in January 2018, which is incorporated herein by reference, under the caption “Directors' Meetings and Committees of the Board of Directors”.
ITEM 14. PRINCIPAL ACCOUNTING FEES AND SERVICES
Information with respect to this Item is included in our Proxy Statement to be filed in January 2018, which is incorporated herein by reference, under the caption “Relationship with Independent Registered Public Accounting Firm”.
40
PART IV
ITEM 15. EXHIBITS AND FINANCIAL STATEMENT SCHEDULES
The following documents are filed as part of this Annual Report:
FINANCIAL STATEMENTS
Consolidated Statements of Income and Comprehensive Income - Years ended September 24, 2017, September 25, 2016 and September 28, 2015
Consolidated Balance Sheets - September 24, 2017 and September 25, 2016
Consolidated Statements of Stockholders' Equity (Deficit) - Years ended September 24, 2017, September 25, 2016 and September 28, 2015
Consolidated Statements of Cash Flows - Years ended September 24, 2017, September 25, 2016 and September 28, 2015
Notes to Consolidated Financial Statements
Report of Independent Registered Public Accounting Firm
FINANCIAL STATEMENT SCHEDULES
All schedules have been omitted as they are not required, not applicable, not deemed material or because the information is included in the Notes to Consolidated Financial Statements, included herein.
EXHIBITS
See Exhibit Index, included herein.
41
CONSOLIDATED FINANCIAL STATEMENTS | PAGE |
42
CONSOLIDATED STATEMENTS OF INCOME AND COMPREHENSIVE INCOME
(Thousands of Dollars, Except Per Common Share Data) | 2017 | 2016 | 2015 | |||||
Operating revenue: | ||||||||
Advertising and marketing services | 331,360 | 373,463 | 412,099 | |||||
Subscription | 191,922 | 194,002 | 194,474 | |||||
Other | 43,661 | 46,899 | 41,970 | |||||
Total operating revenue | 566,943 | 614,364 | 648,543 | |||||
Operating expenses: | ||||||||
Compensation | 209,692 | 229,752 | 239,028 | |||||
Newsprint and ink | 24,904 | 26,110 | 30,263 | |||||
Other operating expenses | 199,754 | 218,726 | 229,165 | |||||
Depreciation | 16,026 | 17,291 | 18,418 | |||||
Amortization of intangible assets | 25,256 | 26,150 | 27,145 | |||||
Impairment of intangible and other assets | 2,517 | 2,185 | — | |||||
Loss (gain) on sales of assets and other, net | (3,667 | ) | (3,139 | ) | 106 | |||
Workforce adjustments and other | 7,523 | 1,825 | 3,304 | |||||
Total operating expenses | 482,005 | 518,900 | 547,429 | |||||
Equity in earnings of associated companies | 7,609 | 8,533 | 8,254 | |||||
Operating income | 92,547 | 103,997 | 109,368 | |||||
Non-operating income (expense): | ||||||||
Gain on insurance settlement | — | 30,646 | — | |||||
Interest expense | (57,573 | ) | (64,233 | ) | (72,409 | ) | ||
Debt financing and administrative costs | (4,818 | ) | (5,947 | ) | (5,433 | ) | ||
Other, net | 10,060 | (6,268 | ) | 6,386 | ||||
Total non-operating expense, net | (52,331 | ) | (45,802 | ) | (71,456 | ) | ||
Income before income taxes | 40,216 | 58,195 | 37,912 | |||||
Income tax expense | 11,611 | 22,176 | 13,594 | |||||
Net income | 28,605 | 36,019 | 24,318 | |||||
Net income attributable to non-controlling interests | (1,124 | ) | (1,058 | ) | (1,002 | ) | ||
Income attributable to Lee Enterprises, Incorporated | 27,481 | 34,961 | 23,316 | |||||
Other comprehensive income (loss), net of income taxes | 6,710 | (6,503 | ) | (6,445 | ) | |||
Comprehensive income attributable to Lee Enterprises, Incorporated | 34,191 | 28,458 | 16,871 | |||||
Earnings per common share: | ||||||||
Basic: | 0.51 | 0.66 | 0.44 | |||||
Diluted: | 0.50 | 0.64 | 0.43 | |||||
The accompanying Notes are an integral part of the Consolidated Financial Statements.
43
CONSOLIDATED BALANCE SHEETS
(Thousands of Dollars) | September 24 2017 | September 25 2016 | |||
ASSETS | |||||
Current assets: | |||||
Cash and cash equivalents | 10,621 | 16,984 | |||
Accounts receivable, less allowance for doubtful accounts: | |||||
2017 $4,796; 2016 $4,327 | 49,469 | 51,334 | |||
Inventories | 3,616 | 4,252 | |||
Other | 4,132 | 4,683 | |||
Total current assets | 67,838 | 77,253 | |||
Investments: | |||||
Associated companies | 29,181 | 29,716 | |||
Other | 9,949 | 9,488 | |||
Total investments | 39,130 | 39,204 | |||
Property and equipment: | |||||
Land and improvements | 20,424 | 21,028 | |||
Buildings and improvements | 172,138 | 174,164 | |||
Equipment | 278,880 | 279,770 | |||
Construction in process | 752 | 823 | |||
472,194 | 475,785 | ||||
Less accumulated depreciation | 357,998 | 347,223 | |||
Property and equipment, net | 114,196 | 128,562 | |||
Goodwill | 246,426 | 243,729 | |||
Other intangible assets, net | 136,302 | 158,354 | |||
Medical plan assets, net | 15,392 | 14,063 | |||
Other | 1,566 | 1,690 | |||
Total assets | 620,850 | 662,855 | |||
The accompanying Notes are an integral part of the Consolidated Financial Statements.
44
(Thousands of Dollars and Shares, Except Per Share Data) | September 24 2017 | September 25 2016 | |||
LIABILITIES AND STOCKHOLDERS' EQUITY | |||||
Current liabilities: | |||||
Current maturities of long-term debt | 30,182 | 25,070 | |||
Accounts payable | 17,027 | 18,143 | |||
Compensation and other accrued liabilities | 22,423 | 23,884 | |||
Accrued interest | 1,512 | 2,895 | |||
Income taxes payable | 183 | 665 | |||
Unearned revenue | 26,881 | 28,361 | |||
Total current liabilities | 98,208 | 99,018 | |||
Long-term debt, net of current maturities | 496,379 | 565,826 | |||
Pension obligations | 43,537 | 55,148 | |||
Postretirement and postemployment benefit obligations | 5,004 | 10,717 | |||
Deferred income taxes | 53,397 | 38,308 | |||
Income taxes payable | 5,497 | 5,016 | |||
Warrants and other | 10,041 | 16,363 | |||
Total liabilities | 712,063 | 790,396 | |||
Equity (deficit): | |||||
Stockholders' equity (deficit): | |||||
Serial convertible preferred stock, no par value; authorized 500 shares; none issued | — | — | |||
Common Stock, authorized 120,000 shares; issued and outstanding: | 567 | 558 | |||
September 24, 2017; 56,712 shares; $0.01 par value | |||||
September 25, 2016; 55,771 shares; $0.01 par value | |||||
Class B Common Stock, $2 par value; authorized 30,000 shares; none issued | — | — | |||
Additional paid-in capital | 251,790 | 249,740 | |||
Accumulated deficit | (328,524 | ) | (356,005 | ) | |
Accumulated other comprehensive loss | (16,068 | ) | (22,778 | ) | |
Total stockholders' deficit | (92,235 | ) | (128,485 | ) | |
Non-controlling interests | 1,022 | 944 | |||
Total deficit | (91,213 | ) | (127,541 | ) | |
Total liabilities and deficit | 620,850 | 662,855 | |||
The accompanying Notes are an integral part of the Consolidated Financial Statements.
45
CONSOLIDATED STATEMENTS OF STOCKHOLDERS' EQUITY (DEFICIT)
Amount | Shares | ||||||||||||||||
(Thousands of Dollars and Shares) | 2017 | 2016 | 2015 | 2017 | 2016 | 2015 | |||||||||||
Common Stock: | |||||||||||||||||
Balance, beginning of year | 558 | 547 | 537 | 55,771 | 54,679 | 53,747 | |||||||||||
Shares issued | 9 | 11 | 10 | 941 | 1,092 | 932 | |||||||||||
Balance, end of year | 567 | 558 | 547 | 56,712 | 55,771 | 54,679 | |||||||||||
Additional paid-in capital: | |||||||||||||||||
Balance, beginning of year | 249,740 | 247,302 | 245,323 | ||||||||||||||
Stock compensation | 2,088 | 2,306 | 1,971 | ||||||||||||||
Shares issued (redeemed) | (38 | ) | 132 | 8 | |||||||||||||
Balance, end of year | 251,790 | 249,740 | 247,302 | ||||||||||||||
Accumulated deficit: | |||||||||||||||||
Balance, beginning of year | (356,005 | ) | (390,966 | ) | (414,282 | ) | |||||||||||
Net income | 28,605 | 36,019 | 24,318 | ||||||||||||||
Net income attributable to non-controlling interests | (1,124 | ) | (1,058 | ) | (1,002 | ) | |||||||||||
Balance, end of year | (328,524 | ) | (356,005 | ) | (390,966 | ) | |||||||||||
Accumulated other comprehensive income (loss): | |||||||||||||||||
Balance, beginning of year | (22,778 | ) | (16,276 | ) | (9,831 | ) | |||||||||||
Change in pension and postretirement benefits | 11,439 | (11,001 | ) | (10,973 | ) | ||||||||||||
Deferred income taxes, net | (4,729 | ) | 4,499 | 4,528 | |||||||||||||
Balance, end of year | (16,068 | ) | (22,778 | ) | (16,276 | ) | |||||||||||
Total stockholders' deficit | (92,235 | ) | (128,485 | ) | (159,393 | ) | 56,712 | 55,771 | 54,679 | ||||||||
The accompanying Notes are an integral part of the Consolidated Financial Statements.
46
CONSOLIDATED STATEMENTS OF CASH FLOWS
(Thousands of Dollars) | 2017 | 2016 | 2015 | |||||
Cash provided by operating activities: | ||||||||
Net income | 28,605 | 36,019 | 24,318 | |||||
Adjustments to reconcile income to net cash provided by operating activities: | ||||||||
Depreciation and amortization | 41,282 | 43,441 | 45,563 | |||||
Net (gain) loss on sales of assets | (3,667 | ) | (3,139 | ) | 106 | |||
Insurance settlement | — | (30,646 | ) | — | ||||
Impairment of intangible and other assets | 2,517 | 2,185 | — | |||||
Distributions greater than earnings of MNI | 546 | 3,777 | 2,084 | |||||
Stock compensation expense | 2,088 | 2,306 | 1,971 | |||||
Deferred income tax expense | 10,360 | 20,669 | 12,764 | |||||
Debt financing and administrative costs | 4,818 | 5,947 | 5,433 | |||||
Gain on extinguishment of debt | — | (1,250 | ) | — | ||||
Pension contributions | — | (4,604 | ) | (3,577 | ) | |||
Changes in operating assets and liabilities: | ||||||||
Decrease in receivables | 2,854 | 6,933 | 3,444 | |||||
Decrease in inventories and other | 687 | 617 | 3,122 | |||||
Decrease in accounts payable, compensation and other accrued liabilities and unearned revenue | (6,393 | ) | (8,327 | ) | (9,587 | ) | ||
Decrease in pension, postretirement and postemployment benefit obligations | (3,473 | ) | (4,757 | ) | (3,627 | ) | ||
Change in income taxes receivable or payable | (1 | ) | 1,238 | (34 | ) | |||
Other, net | (7,942 | ) | 8,781 | (7,504 | ) | |||
Net cash provided by operating activities | 72,281 | 79,190 | 74,476 | |||||
Cash provided by (required for) investing activities: | ||||||||
Purchases of property and equipment | (4,078 | ) | (7,091 | ) | (9,707 | ) | ||
Decrease in restricted cash | — | — | 441 | |||||
Insurance settlement | — | 30,646 | — | |||||
Proceeds from sales of assets | 2,582 | 9,878 | 8,871 | |||||
Acquisitions | (7,450 | ) | — | — | ||||
Distributions greater (less) than earnings of TNI | (11 | ) | 1,575 | 637 | ||||
Other, net | (498 | ) | (500 | ) | (450 | ) | ||
Net cash provided by (required for) investing activities | (9,455 | ) | 34,508 | (208 | ) | |||
Cash provided by (required for) financing activities: | ||||||||
Proceeds from long-term debt | 5,000 | 5,000 | 5,000 | |||||
Payments on long-term debt | (73,782 | ) | (112,455 | ) | (83,878 | ) | ||
Debt financing and administrative costs paid | (373 | ) | (422 | ) | (733 | ) | ||
Common stock transactions, net | (34 | ) | 29 | (227 | ) | |||
Net cash required for financing activities | (69,189 | ) | (107,848 | ) | (79,838 | ) | ||
Net increase (decrease) in cash and cash equivalents | (6,363 | ) | 5,850 | (5,570 | ) | |||
Cash and cash equivalents: | ||||||||
Beginning of year | 16,984 | 11,134 | 16,704 | |||||
End of year | 10,621 | 16,984 | 11,134 | |||||
The accompanying Notes are an integral part of the Consolidated Financial Statements.
47
NOTES TO CONSOLIDATED FINANCIAL STATEMENTS
References to "we", "our", "us" and the like throughout the Consolidated Financial Statements refer to Lee Enterprises, Incorporated and subsidiaries (the "Company"). References to "2017", "2016", "2015" and the like refer to the fiscal years ended the last Sunday in September.
Lee Enterprises, Incorporated is a leading provider of high quality, trusted, local news and information, and a major platform for advertising in the markets we serve. We are located primarily in the Midwest, Mountain West and West regions of the United States, and our 50 markets (including TNI Partners ("TNI") and Madison Newspapers ("MNI")), across 22 states are principally mid-sized or small. We currently operate in a single operating segment.
1. SIGNIFICANT ACCOUNTING POLICIES
Basis of Presentation
The Consolidated Financial Statements include our accounts and those of our subsidiaries, all of which are wholly-owned, except for our 50% interest in TNI, 50% interest in MNI and 82.5% interest in TownNews.com. TNI and MNI are accounted for under the equity method. Results of TownNews.com are consolidated.
In August 2014, the Financial Accounting Standards Board ("FASB") issued a new going concern standard. The new standard provides guidance on how management evaluates and discloses the Company's ability to continue as a going concern for a look-forward period of one year from the financial statement issuance date. We adopted the new standard in 2017, as required. The adoption of this standard did not impact our Consolidated Financial Statements, taken as a whole.
Fiscal Year
All of our enterprises use period accounting with the fiscal year ending on the last Sunday in September.
Subsequent Events
We have evaluated subsequent events through December 8, 2017. No events have occurred subsequent to September 24, 2017 that require disclosure or recognition in these financial statements, except as included herein.
Accounting Estimates
The preparation of financial statements in conformity with accounting principles generally accepted in the United States of America ("GAAP") requires us to make estimates and judgments that affect the reported amounts of assets, liabilities, revenue and expenses, and related disclosure of contingent assets and liabilities. We evaluate our estimates on an on-going basis. We base our estimates on historical experience and on various other assumptions that are believed to be reasonable under the circumstances, the results of which form the basis for making judgments about the carrying
values of assets and liabilities that are not readily apparent from other sources. Actual results may differ from these estimates under different assumptions or conditions.
Principles of Consolidation
All significant intercompany transactions and balances have been eliminated.
Investments in TNI and MNI are accounted for using the equity method and are reported at cost, plus our share of undistributed earnings since acquisition less, for TNI, amortization of, and reductions in the value of, intangible assets.
Cash and Cash Equivalents
We consider all highly liquid debt instruments purchased with an original maturity of three months or less at date of acquisition to be cash equivalents.
Outstanding checks in excess of funds on deposit are included in accounts payable and are classified as financing activities in the Consolidated Statements of Cash Flows.
48
Accounts Receivable
We evaluate our allowance for doubtful accounts receivable based on historical credit experience, payment trends and other economic factors. Delinquency is determined based on timing of payments in relation to billing dates. Accounts considered to be uncollectible are written off.
Inventories
Newsprint inventories are priced at the lower of cost or market, with cost being determined by the first-in, first-out (FIFO) or last-in, first-out (LIFO) methods. Newsprint inventories at September 24, 2017 and September 25, 2016 are less than replacement cost by $1,608,000 and $1,900,000, respectively.
The components of newsprint inventory by cost method are as follows:
(Thousands of Dollars) | September 24 2017 | September 25 2016 | |||
FIFO method | 962 | 1,064 | |||
LIFO method | 1,167 | 1,627 | |||
2,129 | 2,691 | ||||
Other inventories consisting of ink, plates and film are priced at the lower of cost or market, with cost being determined by the FIFO method.
Other Investments
Other investments primarily consist of marketable securities held in trust under a deferred compensation arrangement and investments for which no established market exists. Marketable securities are classified as trading securities and carried at fair value with gains and losses reported in earnings. Non-marketable securities are carried at cost.
Property and Equipment
Property and equipment are carried at cost. Equipment, except for printing presses and preprint insertion equipment, is depreciated primarily by declining-balance methods. The straight-line method is used for all other assets. The estimated useful lives are as follows:
Years | |
Buildings and improvements | 5 - 54 |
Printing presses and insertion equipment | 3 - 28 |
Other | 3 - 17 |
We capitalize interest as a component of the cost of constructing major facilities. At September 24, 2017 and September 25, 2016, capitalized interest was not significant.
We recognize the fair value of a liability for a legal obligation to perform an asset retirement activity when such activity is a condition of a future event and the fair value of the liability can be estimated.
Goodwill and Other Intangible Assets
Intangible assets include covenants not to compete, consulting agreements, customer lists, newspaper subscriber lists and mastheads. Intangible assets subject to amortization are being amortized using the straight-line method as follows:
Years | |
Customer lists | 15 - 23 |
Newspaper subscriber lists | 17 - 33 |
49
In January 2017, the Financial Accounting Standards Board ("FASB") issued a new standard simplifying the assessment of goodwill for impairment. The new standard maintains a qualitative and quantitative assessment but eliminates Step 2 of the quantitative assessment. The new standard also requires companies with reporting units with zero or negative carrying value to disclose the amount of goodwill for those reporting units. The Company adopted the standard during Q2 2017. Lee Enterprises is a single reporting unit entity with negative carrying value, and as such all of the Company’s goodwill is attributed to the single reporting unit. In 2017, the Company applied provisions of the new standard to its annual impairment assessment. The annual assessment has historically been and will continue to be made on the first day of our fourth fiscal quarter, or more frequently if impairment triggers are noted.
In 2016, the Company assessed the recoverability of goodwill and other non-amortized intangible assets, using qualitative factors affecting our business to determine if the probability of a goodwill impairment was more likely than not. Our assessment included reviewing internal and external factors affecting our business, such as cash flow projections, stock price and other industry or market considerations. In 2015, the Company performed its assessment using the quantitative assessment prescribed by accounting standards in effect prior to the adoption of the new standard.
We analyze goodwill and other non-amortized intangible assets for impairment more frequently if impairment indicators are present. Such indicators of impairment include, but are not limited to, changes in business climate and operating or cash flow losses related to such assets.
Should we determine that a goodwill impairment is more likely than not, we make a determination of the fair value of our business. Fair value is determined using a combination of an income approach and a market approach weighted equally.
Should we determine that a non-amortized intangible asset impairment is more likely than not, we make a determination of the individual asset's fair value. Fair value is determined using the relief from royalty method, which estimates fair value based upon appropriate royalties of future revenue discounted to their present value. The impairment amount, if any, is calculated based on the excess of the carrying amount over the fair value of such asset.
We review our amortizable intangible assets for impairment when indicators of impairment are present. We assess recoverability of these assets by comparing the estimated undiscounted cash flows associated with the asset group with their carrying amount. The impairment amount, if any, is calculated based on the excess of the carrying amount over the fair value of those asset groups.
The required valuation methodology and underlying financial information that are used to determine fair value require significant judgments to be made by us and represent a Level 3 fair value measurement. These judgments include, but are not limited to, long term projections of future financial performance and the selection of appropriate discount rates used to determine the present value of future cash flows. Changes in such estimates or the application of alternative assumptions could produce significantly different results.
We also periodically evaluate the useful lives of amortizable intangible assets. Any resulting changes in the useful lives of such intangible assets will not impact our cash flows. However, a decrease in the useful lives of such intangible assets would increase future amortization expense and decrease future reported operating results and earnings per common share.
Future decreases in our market value, or significant differences in revenue, expenses or cash flows from estimates used to determine fair value, could result in impairment charges in the future. See Note 3.
Non-controlling Interest
Non-controlling interest in earnings of TownNews.com is recognized in the Consolidated Financial Statements.
Revenue Recognition
Advertising revenue is recorded when advertisements are placed in the publication or on the related digital platform. Subscription revenue is recorded over the print or digital subscription term or as newspapers are individually sold. Other revenue is recognized when the related product or service has been delivered. Unearned revenue arises in the ordinary course of business from advance subscription payments for print or digital products or advance payments for advertising.
50
Advertising Costs
A substantial amount of our advertising and promotion consists of advertising placed in our own publications and digital platforms, using available space. The incremental cost of such advertising is not significant and is not measured separately by us. External advertising costs are not significant and are expensed as incurred.
Pension, Postretirement and Postemployment Benefit Plans
We evaluate our liabilities for pension, postretirement and postemployment benefit plans based upon computations made by consulting actuaries, incorporating estimates and actuarial assumptions of future plan service costs, future interest costs on projected benefit obligations, rates of compensation increases, when applicable, employee turnover rates, anticipated mortality rates, expected investment returns on plan assets, asset allocation assumptions of plan assets and other factors.
We use a fiscal year end measurement date for all our pension and postretirement obligations in accordance with Financial Accounting Standards Board ("FASB") Accounting Standards Codification ("ASC") Topic 715, Retirement Plans.
Income Taxes
Deferred income taxes are provided using the asset and liability method, whereby deferred income tax assets are recognized for deductible temporary differences and loss carryforwards and deferred income tax liabilities are recognized for taxable temporary differences. Temporary differences are the difference between the reported amounts of assets and liabilities and their tax basis. Deferred income tax assets are reduced by a valuation allowance when, in our opinion, it is more likely than not some portion or all of the deferred income tax assets will not be realized. Deferred income tax assets and liabilities are adjusted for the effects of changes in tax laws and rates on the date of enactment.
We recognize the effect of income tax positions only if those positions are more likely than not of being sustained. Recognized income tax positions are measured at the largest amount that is greater than 50% likely of being realized. Changes in recognition or measurement are reflected in the period in which the change in judgment occurs. We record interest and penalties related to unrecognized tax benefits as a component of income tax expense.
Fair Value of Financial Instruments
We utilize FASB ASC Topic 820, Fair Value Measurements and Disclosures, to measure and report fair value. FASB ASC Topic 820 defines fair value, establishes a framework for measuring fair value and expands disclosures about fair value measurements. FASB ASC Topic 820 establishes a three-level hierarchy of fair value measurements based on whether the inputs to those measurements are observable or unobservable, which consists of the following levels:
Level 1 - Quoted prices for identical instruments in active markets.
Level 2 - Quoted prices for similar instruments in active markets; quoted prices for identical or similar instruments in markets that are not active; and model-derived valuations in which all significant inputs are observable in active markets.
Level 3 - Valuations derived from valuation techniques in which one or more significant inputs are unobservable.
Investments measured at net asset value, as a practical expedient for fair value, are excluded from the fair value hierarchy.
Valuation methodologies used for pension and postretirement assets measured at fair value are as follows:
Cash and cash equivalents consist of short term deposits valued based on quoted prices in active markets. Such investments are classified as Level 1.
Treasury Inflation-Protected Securities ("TIPS") consist of low yield mutual funds and are valued by quoted market prices. Such investments are classified as Level 1.
51
Equity securities are valued based on the closing market price in an active market and are classified as Level 1. Certain investments in commingled funds are valued at the net asset value of units held at the end of the period based upon the value of the underlying investments as determined by quoted market prices. Such investments are classified as Level 2.
Debt securities consist of government securities that are valued based upon quoted market prices in an active market. Such investments are classified as Level 1. Corporate bonds that are valued based on quoted market prices in an inactive market. Such investments are classified as Level 2. Certain investments in commingled funds are valued at the net asset value of units held at the end of the period based upon the value of the underlying investments as determined by quoted market prices. Such investments are excluded from the fair value hierarchy.
Hedge funds consist of a long/short equity fund and a diversified fund of funds. These funds are valued at the net asset value of units held at the end of the period based upon the value of the underlying investments, which is determined using multiple approaches including by quoted market prices and by private market quotations. Such investments are excluded from the fair value hierarchy.
Stock Compensation and Warrants
We have several active stock-based compensation plans. We account for grants under those plans under the fair value expense recognition provisions of FASB ASC Topic 718, Compensation-Stock Compensation. We determine the fair value of stock options using the Black-Scholes option pricing formula. Key inputs to this formula include expected term, expected volatility and the risk-free interest rate.
The expected term represents the period that our stock-based awards are expected to be outstanding, and is determined based on historical experience of similar awards, giving consideration to contractual terms of the awards, vesting schedules and expectations of future employee behavior. The volatility factor is calculated using historical market data for our Common Stock. The time frame used is equal to the expected term. We base the risk-free interest rate on the yield to maturity at the time of the stock option grant on zero-coupon U.S. government bonds having a remaining term equal to the option's expected term. When estimating forfeitures, we consider voluntary termination behavior as well as actual option forfeitures.
We amortize as compensation expense the value of stock options and restricted Common Stock using the straight-line method over the vesting or restriction period, which is generally one to four years.
We also have 6,000,000 warrants outstanding to purchase shares of our Common Stock. Warrants are recorded at fair value determined using the Black-Scholes option pricing formula. See Notes 4, 8 and 11.
Uninsured Risks
We are self-insured for health care, workers compensation and certain long-term disability costs of our employees, subject to stop loss insurance, which limits our losses in the event of large claims. We accrue our estimated health care costs in the period in which such costs are incurred, including an estimate of incurred but not reported claims. Other risks are insured and carry deductible losses of varying amounts. Letters of credit and performance bonds totaling $4,790,000 at September 24, 2017 are outstanding in support of our insurance program.
Our accrued reserves for health care and workers compensation claims are based upon estimates of the remaining liability for retained losses made by consulting actuaries. The amount of workers compensation reserve has been determined based upon historical patterns of incurred and paid loss development factors from the insurance industry.
2 INVESTMENTS IN ASSOCIATED COMPANIES
TNI Partners
In Tucson, Arizona, TNI, acting as agent for our subsidiary, Star Publishing Company (“Star Publishing”) and Citizen Publishing Company (“Citizen”), a subsidiary of Gannett Co. Inc., is responsible for printing, delivery, advertising and subscription activities of the Arizona Daily Star, as well as the related digital platforms and specialty publications. TNI collects all receipts and income and pays substantially all operating expenses incident to the partnership's operations and publication of the newspaper and other media.
52
Income or loss of TNI is allocated equally to Star Publishing and Citizen.
Summarized financial information of TNI is as follows:
(Thousands of Dollars) | September 24 2017 | September 25 2016 | |||
ASSETS | |||||
Current assets | 4,457 | 5,107 | |||
Investments and other assets | 12 | 12 | |||
Total assets | 4,469 | 5,119 | |||
LIABILITIES AND MEMBERS' EQUITY | |||||
Current liabilities | 5,485 | 6,484 | |||
Members' equity | (1,016 | ) | (1,365 | ) | |
Total liabilities and members' equity | 4,469 | 5,119 | |||
Summarized results of TNI are as follows:
(Thousands of Dollars) | 2017 | 2016 | 2015 | |||||
Operating revenue | 48,297 | 52,761 | 55,926 | |||||
Operating expenses | 38,150 | 41,804 | 45,413 | |||||
Net income | 10,147 | 10,957 | 10,513 | |||||
Company's 50% share | 5,073 | 5,478 | 5,256 | |||||
Less amortization of intangible assets | 418 | 418 | 418 | |||||
Equity in earnings of TNI | 4,655 | 5,060 | 4,838 | |||||
TNI makes weekly distributions of its earnings. We received $4,644,000, $6,636,000 and $5,475,000 in distributions in 2017, 2016 and 2015, respectively.
At September 24, 2017, the carrying value of the Company's 50% investment in TNI is $15,943,000. The difference between our carrying value and our 50% share of the members' equity of TNI relates principally to goodwill of $12,366,000 and other identified intangible assets of $4,136,000, certain of which are being amortized over their estimated useful lives through 2020. See Note 3.
Madison Newspapers, Inc.
We have a 50% ownership interest in MNI, which publishes daily and Sunday newspapers, and other publications in Madison, Wisconsin, and other Wisconsin locations, and operates their related digital sites. Net income or loss of MNI (after income taxes) is allocated equally to us and The Capital Times Company (“TCT”). MNI conducts its business under the trade name Capital Newspapers.
53
Summarized financial information of MNI is as follows:
(Thousands of Dollars) | September 24, 2017 | September 25 2016 | |||
ASSETS | |||||
Current assets | 11,297 | 12,320 | |||
Investments and other assets | 32,530 | 33,364 | |||
Total assets | 43,827 | 45,684 | |||
LIABILITIES AND MEMBERS' EQUITY | |||||
Current liabilities | 7,852 | 8,391 | |||
Other liabilities | 9,500 | 9,500 | |||
Stockholders' equity | 26,475 | 27,793 | |||
Total liabilities and stockholders' equity | 43,827 | 45,684 | |||
Summarized results of MNI are as follows:
(Thousands of Dollars) | 2017 | 2016 | 2015 | |||||
Operating revenue | 61,396 | 65,172 | 67,264 | |||||
Operating expenses, excluding workforce adjustments, depreciation and amortization | 51,392 | 52,646 | 54,795 | |||||
Workforce adjustments | 296 | 39 | 459 | |||||
Depreciation and amortization | 1,295 | 1,684 | 1,630 | |||||
Operating income | 8,413 | 10,803 | 10,380 | |||||
Net income | 5,908 | 6,947 | 6,832 | |||||
Equity in earnings of MNI | 2,954 | 3,473 | 3,416 | |||||
MNI makes quarterly distributions of its earnings. We received $3,500,000, $7,250,000 and $7,050,000 in distributions in 2017, 2016 and 2015, respectively.
We provide editorial services to MNI. Editorial service fees are included in other revenue in the Consolidated Statements of Income and Comprehensive Income and totaled $7,021,000, $7,099,000 and $7,242,000, in 2017, 2016 and 2015, respectively.
At September 24, 2017, the carrying value of the Company's 50% investment in MNI is $13,238,000.
3 GOODWILL AND OTHER INTANGIBLE ASSETS
Changes in the carrying amount of goodwill related to continuing operations are as follows:
(Thousands of Dollars) | 2017 | 2016 | |||
Goodwill, gross amount | 1,532,458 | 1,532,458 | |||
Accumulated impairment losses | (1,288,729 | ) | (1,288,729 | ) | |
Goodwill, beginning of year | 243,729 | 243,729 | |||
Goodwill acquired in business combinations | 2,697 | — | |||
Goodwill, end of year | 246,426 | 243,729 | |||
54
Identified intangible assets related to continuing operations consist of the following:
(Thousands of Dollars) | September 24 2017 | September 25 2016 | |||
Non-amortized intangible assets: | |||||
Mastheads | 22,035 | 23,644 | |||
Amortizable intangible assets: | |||||
Customer and newspaper subscriber lists | 691,994 | 687,182 | |||
Less accumulated amortization | 577,727 | 552,472 | |||
114,267 | 134,710 | ||||
Non-compete and consulting agreements | 28,524 | 28,524 | |||
Less accumulated amortization | 28,524 | 28,524 | |||
— | — | ||||
136,302 | 158,354 | ||||
In January 2017, the FASB issued a new standard simplifying the assessment of a goodwill impairment. The new standard maintains a qualitative and quantitative assessment but eliminates the Step 2 of the quantitative assessment. The new standard also changes the way a goodwill impairment is calculated. For companies that have reporting units with zero or negative carrying value, the new standard requires disclosure of the amount of goodwill for those reporting units. The Company has elected to early adopt this standard for its 2017 goodwill impairment test.
The Company is a single reporting unit entity with negative carrying value, and as such all of the Company’s goodwill is attributed to the single reporting unit. During Q2 2017, the Company adopted ASU 2017-04. The Company performed its annual assessment on the first day of our fourth fiscal quarter, and determined the fair value of our single reporting unit was significantly in excess of carrying value and as such, there was no impairment in 2017.
In 2016, we performed a qualitative analysis to test our goodwill for impairment and concluded that the likelihood of an impairment was less than 50%. In 2015, we performed additional quantitative analysis of the carrying value of our goodwill and concluded the implied fair value of goodwill was significantly in excess of its carrying value. As a result no goodwill impairment was recorded.
In 2017 and 2016, due to continuing revenue declines, we recorded non-cash charges to reduce the carrying value of non-amortized intangible assets. We also recorded pretax charges to reduce the carrying value of other assets in 2017 and 2016 in Impairment of intangible and other assets in the Consolidated Statements of Income and Comprehensive Income (Loss). We recorded deferred income tax benefits related to these charges.
A summary of the pretax impairment charges is included in the table below:
(Thousands of Dollars) | 2017 | 2016 | 2015 | |||||
Continuing operations: | ||||||||
Non-amortized intangible assets | 2,035 | 818 | — | |||||
Property, equipment and other assets | 482 | 1,367 | — | |||||
2,517 | 2,185 | — | ||||||
In June 2017, we purchased the assets of the Dispatch-Argus serving Moline and Rock Island, IL, (the "Dispatch-Argus"), for $7,150,000 plus an adjustment for working capital. The Dispatch-Argus is a media company with print and digital publishing operations. We financed the transaction with available cash on hand.
The purchase price, based on management's preliminary estimates, was allocated to the tangible assets and identified intangible assets acquired and liabilities assumed based on their estimated fair values. As of the acquisition date, the purchase price assigned to the acquired assets and assumed liabilities were as follows: current assets $989,000, property, plant, and equipment of $100,000, intangible assets of $5,199,000, goodwill of $2,445,000, and current liabilities of $1,056,000.
55
Annual amortization of intangible assets for the years ending September 2018 to September 2022 is estimated to be $16,653,000, $15,972,000, $15,206,000, $14,042,000, and $11,863,000, respectively.
4 DEBT
On March 31, 2014, we completed a comprehensive refinancing of our debt (the"2014 Refinancing"), which included the following:
• | $400,000,000 aggregate principal amount of 9.5% Senior Secured Notes (the “Notes”), pursuant to an Indenture dated as of March 31, 2014 (the “Indenture”). |
• | $250,000,000 first lien term loan (the "1st Lien Term Loan") and $40,000,000 revolving facility (the "Revolving Facility") under a First Lien Credit Agreement dated as of March 31, 2014 (together the “1st Lien Credit Facility”). |
• | $150,000,000 second lien term loan under a Second Lien Loan Agreement dated as of March 31, 2014 (the “2nd Lien Term Loan”). |
Debt is summarized as follows:
Interest Rates (%) | |||||
(Thousands of Dollars) | September 24 2017 | September 26 2016 | September 24 2017 | ||
Revolving Facility | — | — | 6.74 | ||
1st Lien Term Loan | 45,145 | 101,304 | 7.49 | ||
Notes | 385,000 | 385,000 | 9.50 | ||
2nd Lien Term Loan | 118,240 | 130,863 | 12.00 | ||
548,385 | 617,167 | ||||
Unamortized debt issue costs | (21,824 | ) | (26,271 | ) | |
Less current maturities of long-term debt | 30,182 | 25,070 | |||
Total long-term debt | 496,379 | 565,826 | |||
Our weighted average cost of debt, excluding amortization of debt financing costs at September 24, 2017, is 9.9%.
At September 24, 2017, aggregate minimum required maturities of debt excluding amounts required to be paid from future excess cash flow computations total $30,182,000 in 2018, $20,145,000 in 2019, zero in 2020, zero in 2021, $385,000,000 in 2022 and $113,058,000 thereafter.
Notes
The Notes are senior secured obligations of the Company and mature on March 15, 2022. At September 24, 2017, the principal balance of the Notes totaled $385,000,000.
Interest
The Notes require payment of interest semiannually on March 15 and September 15 of each year, at a fixed annual rate of 9.5%.
56
Redemption
We may redeem some, or all, of the principal amount of the Notes at any time. Prior to March 15, 2018, we may redeem the Notes subject to a make whole provision for the interest through March 15, 2018. On or after March 15, 2018, we may redeem the Notes as follows:
Period Beginning | Percentage of Principal Amount |
March 15, 2018 | 104.75 |
March 15, 2019 | 102.38 |
March 15, 2020 | 100.00 |
If we sell certain of our assets or experience specific kinds of changes of control, we must, subject to certain exceptions, offer to purchase the Notes at 101% of the principal amount. Any redemption of the Notes must also satisfy any accrued and unpaid interest thereon.
We may repurchase Notes in the open market at any time. In the 52 weeks ended September 25, 2016, we purchased $15,000,000 principal amount of Notes in privately negotiated transactions which resulted in a gain on extinguishment of debt totaling $1,250,000. The gain is recorded in Other, net in the Consolidated Statements of Income and Comprehensive Income.
Covenants and Other Matters
The Indenture and the 1st Lien Credit Facility contains restrictive covenants as discussed more fully below. However, certain of these covenants will cease to apply if the Notes are rated investment grade by either Moody’s Investors Service, Inc. or Standard & Poor’s Ratings Group and there is no default or event of default under the Indenture.
1st Lien Credit Facility
The 1st Lien Credit Facility consists of the $250,000,000 1st Lien Term Loan that matures in March 2019 and the $40,000,000 Revolving Facility that matures in December 2018. The 1st Lien Credit Facility documents the primary terms of the 1st Lien Term Loan and the Revolving Facility. The Revolving Facility may be used for working capital and general corporate purposes (including letters of credit). At September 24, 2017, after consideration of letters of credit, we have approximately $33,818,000 available for future use under the Revolving Facility.
Interest
Interest on the 1st Lien Term Loan, which has a principal balance of $45,145,000 at September 24, 2017, accrues, at our option, at either (A) LIBOR plus 6.25% (with a LIBOR floor of 1.0%) or (B) 5.25% plus the higher of (i) the prime rate at the time, (ii) the federal funds rate plus 0.5%, or (iii) one month LIBOR plus 1.0% (with a floor of 2.0%). Interest is payable quarterly.
The 1st Lien Term Loan was funded with an original issue discount of 2.0%, or $5,000,000, which is being amortized as debt financing and administration costs over the life of the 1st Lien Term Loan.
Interest on the Revolving Facility, which has a principal balance of zero at September 24, 2017, accrues, at our option, at either (A) LIBOR plus 5.5%, or (B) 4.5% plus the higher of (i) the prime rate at the time, (ii) the federal funds rate plus 0.5%, or (iii) one month LIBOR plus 1.0%.
Principal Payments
Quarterly principal payments of $6,250,000 are required under the 1st Lien Term Loan, with additional payments required to be made based on 90% of excess cash flow of Lee Legacy ("Lee Legacy Excess Cash Flow"), as defined, or from proceeds of asset sales from our subsidiaries other than Pulitzer Inc. ("Pulitzer") and its subsidiaries (collectively, the "Pulitzer Subsidiaries") which are not reinvested. For excess cash flow calculation purposes Lee Legacy constitutes the business of the Company, including MNI, but excluding Pulitzer and TNI. We may voluntarily prepay principal amounts outstanding or reduce commitments under the 1st Lien Credit Facility at any time without premium or penalty, upon proper notice and subject to certain limitations as to minimum amounts of prepayments.
57
Quarterly, the Company is required to prepare a Lee Legacy Excess Cash Flow calculation, which is generally determined as the cash earnings of our subsidiaries other than the Pulitzer Subsidiaries and includes adjustments for changes in working capital, capital spending, pension contributions, debt principal payments and income tax payments or refunds. Any excess cash flow as calculated is required to be paid to the 1st Lien lenders 45 days after the end of the quarter. Lee Legacy Excess Cash Flow for the 13 weeks ended September 24, 2017 and payable in the 13 weeks ended December 24, 2017 was zero.
2017 principal payments made for the year under the 1st Lien Term Loan are summarized as follows:
13 Weeks Ended | ||||||||
(Thousands of Dollars) | December 25 2016 | March 26 2017 | June 25 2017 | September 24 2017 | ||||
Mandatory | 6,250 | 6,250 | 6,250 | 6,250 | ||||
Voluntary | 11,000 | 7,500 | 5,000 | 6,000 | ||||
Excess cash flow payment | 70 | — | — | 1,589 | ||||
17,320 | 13,750 | 11,250 | 13,839 | |||||
Covenants and Other Matters
The 1st Lien Credit Facility requires that we comply with certain affirmative and negative covenants customary for financing of this nature, including a maximum total leverage ratio, which is only applicable to the Revolving Facility.
The 1st Lien Credit Facility restricts us from paying dividends on our Common Stock. This restriction no longer applies if Lee Legacy leverage is below 3.25x before and after such payments. Further, the 1st Lien Credit Facility restricts or limits, among other things, subject to certain exceptions, the ability of the Company and its subsidiaries to: (i) incur indebtedness, (ii) enter into mergers, acquisitions and asset sales, (iii) incur or create liens and (iv) enter into transactions with certain affiliates. The 1st Lien Credit Facility contains various representations and warranties and may be terminated upon occurrence of certain events of default. The 1st Lien Credit Facility also contains cross-default provisions tied to the terms of each of the Indenture and 2nd Lien Term Loan.
2nd Lien Term Loan
The 2nd Lien Term Loan, which has a balance of $118,240,000 at September 24, 2017, bears interest at a fixed annual rate of 12.0%, payable quarterly, and matures in December 2022.
Principal Payments
There are no scheduled mandatory amortization payments required under the 2nd Lien Term Loan.
Quarterly, we are required to prepare a calculation of excess cash flow of the Pulitzer Subsidiaries ("Pulitzer Excess Cash Flow"). Pulitzer Excess Cash Flow is generally determined as the cash earnings of the Pulitzer Subsidiaries including adjustments for changes in working capital, capital spending, pension contributions, debt principal payments and income tax payments. Pulitzer Excess Cash Flow also includes a deduction for interest costs incurred under the 2nd Lien Term Loan.
Prior to March 31, 2017, we were required to offer the Pulitzer Excess Cash Flow to the 2nd Lien Lenders to prepay the 2nd Lien Term Loan at par, which payment the 2nd Lien Lenders could accept or reject. After March 31, 2017, the 2nd Lien Lenders can not reject, and Pulitzer Excess Cash Flow is used to prepay the 2nd Lien Term Loan, at par. Pulitzer Excess Cash Flow payments are required to be paid 45 days after the end of the quarter.
58
Pulitzer Excess Cash Flow and the related payments on the 2nd Lien Term Loan for the previous four quarters are as follows:
For the Period Ending (Thousands of Dollars) | Pulitzer Excess Cash Flow | Payment Date | Payment Amount (not rejected) | ||
September 25, 2016 | — | Q1 2017 | — | ||
December 25, 2016 | 930 | Q2 2017 | 174 | ||
March 26, 2017 | 4,488 | Q3 2017 | 4,488 | ||
June 25, 2017 | 5,549 | Q4 2017 | 5,549 | ||
For the 13 weeks ended September 24, 2017, Pulitzer Excess Cash Flow totaled $5,182,000, and was paid in November 2017, at par.
Subject to certain other conditions in the 2nd Lien Term Loan, the balance of the 2nd Lien Term Loan will be repaid at par from proceeds from asset sales by the Pulitzer Subsidiaries that are not reinvested. For the 52 weeks ended September 24, 2017 and September 25, 2016, we repaid $2,412,000 and $8,119,000, respectively, on the 2nd Lien Term Loan, at par, with net proceeds from the sale of Pulitzer assets.
Voluntary payments under the 2nd Lien Term Loan are subject to call premiums as follows:
Period Beginning | Percentage of Principal Amount |
March 31, 2017 | 106 |
March 31, 2018 | 103 |
March 31, 2019 | 100 |
Covenants and Other Matters
The 2nd Lien Term Loan requires that we comply with certain affirmative and negative covenants customary for financing of this nature, including the negative covenants under the 1st Lien Credit Facility discussed above. The 2nd Lien Term Loan contains various representations and warranties and may be terminated upon occurrence of certain events of default. The 2nd Lien Term Loan also contains cross-default provisions tied to the terms of the Indenture and 1st Lien Credit Facility.
In connection with the 2nd Lien Term Loan, we entered into a Warrant Agreement dated as of March 31, 2014 (the “Warrant Agreement”). Under the Warrant Agreement, certain affiliates or designees of the 2nd Lien Lenders received on March 31, 2014 their pro rata share of warrants to purchase, in cash, an initial aggregate of 6,000,000 shares of Common Stock, subject to adjustment pursuant to anti-dilution provisions (the “Warrants”). The Warrants represent, when fully exercised, approximately 10.1% of shares of Common Stock outstanding at March 30, 2014 on a fully diluted basis. The exercise price of the Warrants is $4.19 per share.
The Warrant Agreement contains a cash settlement provision in the event of a change of control prior to March 31, 2018 as well as other provisions requiring the Warrants to be measured at fair value and included in warrants and other liabilities in our Consolidated Balance Sheets. We remeasure the fair value of the liability each reporting period, with changes reported in other, net non-operating income (expense). The initial fair value of the Warrants was $16,930,000. See Note 8 and Note 11.
In connection with the issuance of the Warrants, we entered into a Registration Rights Agreement dated as of March 31, 2014 (the “Registration Rights Agreement”). The Registration Rights Agreement requires, among other matters, that we use our commercially reasonable efforts to maintain the effectiveness for certain specified periods of a shelf registration statement related to the shares of Common Stock to be issued upon exercise of the Warrants.
Security
The Notes and the 1st Lien Credit Facility are fully and unconditionally guaranteed on a joint and several first-priority basis by each of the Company's material domestic subsidiaries, excluding MNI, the Pulitzer Subsidiaries and TNI (the
59
"Lee Legacy Assignors"), pursuant to a first lien guarantee and collateral agreement dated as of March 31, 2014 (the "1st Lien Guarantee and Collateral Agreement").
The Notes, the 1st Lien Credit Facility and the subsidiary guarantees are secured, subject to certain exceptions, priorities and limitations, by perfected security interests in all property and assets, including certain real estate, of the Lee Legacy Assignors, other than the capital stock of MNI and any property and assets of MNI (the “Lee Legacy Collateral”), on a first-priority basis, equally and ratably with all of the Lee Legacy Assignors' existing and future obligations. The Lee Legacy Collateral includes, among other things, equipment, inventory, accounts receivables, depository accounts, intellectual property and certain of their other tangible and intangible assets.
Also, the Notes and the 1st Lien Credit Facility are secured, subject to certain exceptions, priorities and limitations in the various agreements, by first-priority security interests in the capital stock of, and other equity interests owned by, the Lee Legacy Assignors (excluding the capital stock of MNI). The Notes and 1st Lien Credit Facility are subject to a Pari Passu Intercreditor Agreement dated March 31, 2014.
The Notes, the 1st Lien Credit Facility and the subsidiary guarantees are also secured, subject to permitted liens, by a second-priority security interest in the property and assets of the Pulitzer Subsidiaries that become subsidiary guarantors (the "Pulitzer Assignors") other than assets of or used in the operations or business of TNI (collectively, the “Pulitzer Collateral”). In June 2015 the Pulitzer Assignors became a party to the 1st Lien Guarantee and Collateral Agreement on a second lien basis.
Also, the Notes and the 1st Lien Credit Facility are secured, subject to certain exceptions, priorities, and limitations in the various agreements, by second-priority security interests in the capital stock of, and other equity interests in, the Pulitzer Assignors and Star Publishing’s interest in TNI.
The 2nd Lien Term Loan is fully and unconditionally guaranteed on a joint and several first-priority basis by the Pulitzer Assignors, pursuant to a Second Lien Guarantee and Collateral Agreement dated as of March 31, 2014 (the “2nd Lien Guarantee and Collateral Agreement”) among the Pulitzer Assignors and the 2nd Lien collateral agent.
Under the 2nd Lien Guarantee and Collateral Agreement, the Pulitzer Assignors have granted (i) first-priority security interests, subject to certain priorities and limitations in the various agreements, in the Pulitzer Collateral and (ii) have granted first-priority lien mortgages or deeds of trust covering certain real estate, as collateral for the payment and performance of their obligations under the 2nd Lien Term Loan.
Also, under the 2nd Lien Guarantee and Collateral Agreement, the Lee Legacy Assignors have granted (i) second-priority security interests, subject to certain priorities and limitations in the various agreements, in the Lee Legacy Collateral, and (ii) have granted second-priority lien mortgages or deeds of trust covering certain real estate, as collateral for the payment and performance of their obligations under the 2nd Lien Term Loan. Assets of, or used in the operations or business of, MNI are excluded.
The rights of each of the collateral agents with respect to the Lee Legacy Collateral and the Pulitzer Collateral are subject to customary intercreditor and intercompany agreements.
Other
In connection with the 2014 Refinancing, we capitalized $37,819,000 of debt financing costs. Amortization of debt financing costs totaled $4,447,000, $5,541,000 and $4,693,000 in 2017, 2016 and 2015, respectively. Amortization of such costs is estimated to total $4,109,000 in 2018, $3,962,000 in 2019, $4,025,000 in 2020, $4,200,000 in 2021 and $4,390,000 in 2022. At September 24, 2017, we have $21,824,000 of unamortized debt financing costs recorded as a reduction of Long-term debt in our Consolidated Balance Sheets.
In April 2015, the FASB issued a new standard for the presentation of debt issuance costs. The new standard streamlined the balance sheet presentation of debt related valuations. Debt issuance costs were previously recognized as deferred charges and presented as an asset while debt discounts and premiums are treated as adjustments to the related debt. Under the new standard, debt issuance costs are now recognized as reductions to the related debt. The adoption of this standard reclassified certain amounts within our Consolidated Balance Sheets. We adopted the new standard in 2017, as required, and adopted this standard retrospectively. As a result, we have reclassified $26,271,000 of Other long-term assets to a reduction of long-term debt, net of current maturities in the September 25, 2016 Consolidated Balance Sheet.
60
Liquidity
At September 24, 2017, after consideration of letters of credit, we have approximately $33,818,000 available for future use under our Revolving Facility. Including cash, our liquidity at September 24, 2017 totals $44,439,000. This liquidity amount excludes any future cash flows. We expect all interest and principal payments due in the next twelve months will be satisfied by existing cash and our cash flows, which will allow us to maintain an adequate level of liquidity. The Warrants, if and when exercised, would provide additional liquidity in an amount up to $25,140,000 subject to a reduction for any amounts the Company may elect to use to repay our 1st Lien Term Loan and/or the Notes.
Final maturities of our debt range from December 2018 through December 2022.
There are numerous potential consequences under the Notes, 1st Lien Credit Facility and 2nd Lien Term Loan, if an event of default, as defined, occurs and is not remedied. Many of those consequences are beyond our control. The occurrence of one or more events of default would give rise to the right of the applicable lender(s) to exercise their remedies under the Notes, 1st Lien Credit Facility and 2nd Lien Term Loan, respectively, including, without limitation, the right to accelerate all outstanding debt and take actions authorized in such circumstances under applicable collateral security documents.
Our ability to operate as a going concern is dependent on our ability to remain in compliance with debt covenants and to repay, refinance or amend our debt agreements as they become due. The Notes, 1st Lien Credit Facility and 2nd Lien Term Loan have only limited affirmative covenants with which we are required to maintain compliance. We are in compliance with our debt covenants at September 24, 2017.
5 PENSION PLANS
We have several non-contributory defined benefit pension plans that together cover selected employees. Benefits under the plans were generally based on salary and years of service. Effective in 2012, substantially all benefits are frozen and only a small amount of additional benefits are being accrued. Our liability and related expense for benefits under the plans are recorded over the service period of employees based upon annual actuarial calculations. Plan funding strategies are influenced by government regulations. Plan assets consist primarily of domestic and foreign corporate equity securities, government and corporate bonds, hedge fund investments and cash.
The net periodic cost (benefit) components of our pension plans are as follows:
(Thousands of Dollars) | 2017 | 2016 | 2015 | |||||
Service cost for benefits earned during the year | 84 | 197 | 232 | |||||
Interest cost on projected benefit obligation | 5,394 | 6,061 | 8,122 | |||||
Expected return on plan assets | (7,878 | ) | (8,698 | ) | (9,863 | ) | ||
Amortization of net loss | 2,947 | 2,397 | 1,682 | |||||
Amortization of prior service benefit | (136 | ) | (136 | ) | (136 | ) | ||
Net periodic pension cost (benefit) | 411 | (179 | ) | 37 | ||||
Net periodic pension benefit of $56,000 is allocated to TNI in 2017, 2016 and 2015.
61
Changes in benefit obligations and plan assets are as follows:
(Thousands of Dollars) | 2017 | 2016 | |||
Benefit obligation, beginning of year | 202,158 | 193,751 | |||
Service cost | 84 | 197 | |||
Interest cost | 5,394 | 6,061 | |||
Actuarial loss (gain) | (4,241 | ) | 13,630 | ||
Benefits paid | (11,750 | ) | (11,481 | ) | |
Benefit obligation, end of year | 191,645 | 202,158 | |||
Fair value of plan assets, beginning of year: | 149,131 | 143,288 | |||
Actual return on plan assets | 14,721 | 14,819 | |||
Benefits paid | (11,750 | ) | (11,481 | ) | |
Administrative expenses paid | (2,340 | ) | (2,099 | ) | |
Employer contributions | — | 4,604 | |||
Fair value of plan assets, end of year | 149,762 | 149,131 | |||
Funded status | (41,883 | ) | (53,027 | ) | |
Disaggregated amounts recognized in the Consolidated Balance Sheets are as follows:
(Thousands of Dollars) | September 24 2017 | September 25 2016 | |||
Pension obligations | (41,883 | ) | (53,027 | ) | |
Accumulated other comprehensive loss (before income taxes) | (43,307 | ) | (54,862 | ) | |
Amounts recognized in accumulated other comprehensive income (loss) are as follows:
(Thousands of Dollars) | September 24 2017 | September 25 2016 | |||
Unrecognized net actuarial loss | (43,550 | ) | (55,241 | ) | |
Unrecognized prior service benefit | 243 | 379 | |||
(43,307 | ) | (54,862 | ) | ||
We expect to recognize $2,025,000 and $137,000 of unrecognized net actuarial loss and unrecognized prior service benefit, respectively, in net periodic pension cost in 2018.
The accumulated benefit obligation for the plans total $191,645,000 at September 24, 2017 and $202,158,000 at September 25, 2016. The projected benefit obligation, accumulated benefit obligation and fair value of plan assets for the pension plans with accumulated benefit obligations in excess of plan assets are $191,645,000, $191,645,000 and $149,762,000, respectively, at September 24, 2017.
Assumptions
Weighted-average assumptions used to determine benefit obligations are as follows:
(Percent) | September 24 2017 | September 25 2016 | |
Discount rate | 3.7 | 3.5 | |
62
Weighted-average assumptions used to determine net periodic benefit cost are as follows:
(Percent) | 2017 | 2016 | 2015 | |||||
Discount rate | 3.5 | 4.2 | 4.2 | |||||
Expected long-term return on plan assets | 5.5 | 6.3 | 6.8 | |||||
For 2018, the expected long-term return on plan assets is 5.5%. The assumptions related to the expected long-term return on plan assets are developed through an analysis of historical market returns, current market conditions and composition of plan assets.
Plan Assets
The primary objective of our investment strategy is to satisfy our pension obligations at a reasonable cost. Assets are actively invested to balance real growth of capital through appreciation and reinvestment of dividend and interest income and safety of invested funds. Pension assets included below include assets of plans described below under the heading Other Plans.
Our investment policy outlines the governance structure for decision making, sets investment objectives and restrictions and establishes criteria for selecting and evaluating investment managers. The use of derivatives is strictly prohibited, except on a case-by-case basis where the manager has a proven capability, and only to hedge quantifiable risks such as exposure to foreign currencies. An investment committee, consisting of certain of our executives and supported by independent consultants, is responsible for monitoring compliance with the investment policy. Assets are periodically redistributed to maintain the appropriate policy allocation.
The weighted-average asset allocation of our pension assets is as follows:
(Percent) | Policy Allocation | Actual Allocation | ||
Asset Class | September 24, 2017 | September 24 2017 | September 25 2016 | |
Equity securities | 50 | 50 | 50 | |
Debt securities | 35 | 33 | 33 | |
TIPS | 5 | 4 | 4 | |
Hedge fund investments | 10 | 12 | 11 | |
Cash and cash equivalents | — | 1 | 2 | |
Plan assets include no Company securities. Assets include cash and cash equivalents and receivables from time to time due to the need to reallocate assets within policy guidelines.
Fair Value Measurements
The fair value hierarchy of pension assets at September 24, 2017 is as follows:
(Thousands of Dollars) | NAV | Level 1 | Level 2 | Level 3 | ||||
Cash and cash equivalents | — | 1,882 | — | — | ||||
Domestic equity securities | — | 10,484 | 49,483 | — | ||||
International equity securities | — | 7,290 | 8,047 | — | ||||
TIPS | — | 6,553 | — | — | ||||
Debt securities | 14,711 | 26,015 | 8,266 | — | ||||
Hedge fund investments | 19,067 | — | — | — | ||||
63
The fair value hierarchy of pension assets at September 25, 2016 is as follows:
(Thousands of Dollars) | NAV | Level 1 | Level 2 | Level 3 | ||||
Cash and cash equivalents | — | 2,757 | — | — | ||||
Domestic equity securities | — | 9,669 | 49,809 | — | ||||
International equity securities | — | 6,773 | 7,755 | — | ||||
TIPS | — | 6,883 | — | — | ||||
Debt securities | 14,558 | 25,612 | 9,648 | — | ||||
Hedge fund investments | 17,531 | — | — | — | ||||
There were no purchases, sales or transfers of assets classified as Level 3 in 2017 or 2016.
Cash Flows
Based on our forecast at September 24, 2017, we expect to make contributions of $4,940,000 to our pension trust in 2018.
We anticipate future benefit payments to be paid from the pension trust as follows:
(Thousands of Dollars) | ||
2018 | 12,500 | |
2019 | 11,873 | |
2020 | 11,809 | |
2021 | 11,782 | |
2022 | 11,748 | |
2023-2027 | 58,047 | |
Other Plans
We are obligated under an unfunded plan to provide fixed retirement payments to certain former employees. The plan is frozen and no additional benefits are being accrued. The accrued liability under the plan is $1,766,000 and $2,232,000 at September 24, 2017 and September 25, 2016, respectively, of which $113,000 is included in compensation and other accrued liabilities in the Consolidated Balance Sheet at September 24, 2017 and September 25, 2016, respectively.
6 POSTRETIREMENT AND POSTEMPLOYMENT BENEFITS
We provide retiree medical and life insurance benefits under postretirement plans at several of our operating locations. The level and adjustment of participant contributions vary depending on the specific plan. In addition, St. Louis Post Dispatch LLC provides postemployment disability benefits to certain employee groups prior to retirement. Our liability and related expense for benefits under the postretirement plans are recorded over the service period of active employees based upon annual actuarial calculations. We accrue postemployment disability benefits when it becomes probable that such benefits will be paid and when sufficient information exists to make reasonable estimates of the amounts to be paid.
64
The net periodic postretirement benefit cost (benefit) components for our postretirement plans are as follows:
(Thousands of Dollars) | 2017 | 2016 | 2015 | |||||
Service cost for benefits earned during the year | 13 | 63 | 76 | |||||
Interest cost on projected benefit obligation | 412 | 623 | 922 | |||||
Expected return on plan assets | (1,056 | ) | (1,322 | ) | (1,445 | ) | ||
Amortization of net actuarial gain | (987 | ) | (1,093 | ) | (1,386 | ) | ||
Amortization of prior service benefit | (1,459 | ) | (1,459 | ) | (1,459 | ) | ||
Curtailment gains | (3,741 | ) | — | — | ||||
Net periodic postretirement benefit | (6,818 | ) | (3,188 | ) | (3,292 | ) | ||
In March 2017, we notified certain participants in one of our post employment medical plans of changes to their plan, which included notice that the plan will terminate on December 31, 2017. These changes resulted in a non-cash curtailment gain of $3,741,000, which is recorded in gain on sales of assets and other, net in the Consolidated Statements of income and Comprehensive Income. These changes also reduced the postemployment benefit obligation by $5,112,000 and reduced accumulated other comprehensive loss by $1,417,000.
Changes in benefit obligations and plan assets are as follows:
(Thousands of Dollars) | 2017 | 2016 | |||
Benefit obligation, beginning of year | 22,511 | 23,812 | |||
Service cost | 13 | 63 | |||
Interest cost | 412 | 623 | |||
Actuarial loss (gain) | (627 | ) | (773 | ) | |
Benefits paid, net of premiums received | (1,527 | ) | (1,434 | ) | |
Curtailment | (5,112 | ) | — | ||
Medicare Part D subsidies | (3 | ) | 220 | ||
Benefit obligation, end of year | 15,667 | 22,511 | |||
Fair value of plan assets, beginning of year | 24,123 | 30,123 | |||
Actual return on plan assets | 2,112 | 1,085 | |||
Employer contributions | 755 | 563 | |||
Benefits paid, net of premiums and Medicare Part D subsidies received | (1,530 | ) | (1,213 | ) | |
Benefits paid for active employees | (834 | ) | (1,510 | ) | |
Allocation to active medical plans | — | (4,925 | ) | ||
Fair value of plan assets at measurement date | 24,626 | 24,123 | |||
Funded status | 8,959 | 1,612 | |||
The accumulated benefit obligation for plans with benefit obligations in excess of plan assets included in the table above was $2,061,000 at September 24, 2017. These plans are unfunded.
Disaggregated amounts recognized in the Consolidated Balance Sheets are as follows:
(Thousands of Dollars) | September 24 2017 | September 25 2016 | |||
Non-current assets | 11,020 | 9,138 | |||
Postretirement benefit obligations | (2,061 | ) | (7,527 | ) | |
Accumulated other comprehensive income (before income tax benefit) | 18,782 | 19,026 | |||
65
Amounts recognized in accumulated other comprehensive income are as follows:
(Thousands of Dollars) | September 24 2017 | September 25 2016 | |||
Unrecognized net actuarial gain | 12,304 | 11,089 | |||
Unrecognized prior service benefit | 6,478 | 7,937 | |||
18,782 | 19,026 | ||||
We expect to recognize $985,000 and $785,000 of unrecognized net actuarial gain and unrecognized prior service benefit, respectively, in net periodic postretirement benefit in 2018.
Assumptions
Weighted-average assumptions used to determine post retirement benefit obligations are as follows:
(Percent) | September 24 2017 | September 25 2016 | |
Discount rate | 3.4 | 3.1 | |
Expected long-term return on plan assets | 4.5 | 4.5 | |
The assumptions related to the expected long-term return on plan assets are developed through an analysis of historical market returns, current market conditions and composition of plan assets.
Weighted-average assumptions used to determine net periodic benefit cost are as follows:
(Percent) | 2017 | 2016 | 2015 | |||||
Discount rate | 3.1 | 3.7 | 3.7 | |||||
Expected long-term return on plan assets | 4.5 | 4.5 | 4.5 | |||||
For 2018, the expected long-term return on plan assets is 4.5%. The assumptions related to the expected long-term return on plan assets are developed through an analysis of historical market returns, current market conditions and composition of plan assets.
Assumed health care cost trend rates are as follows:
(Percent) | September 24 2017 | September 25 2016 | |
Health care cost trend rates | 9.7 | 9.0 | |
Rate to which the cost trend rate is assumed to decline (the “Ultimate Trend Rate”) | 4.5 | 4.5 | |
Year in which the rate reaches the Ultimate Trend Rate | 2026 | 2025 | |
Administrative costs related to indemnity plans are assumed to increase at the health care cost trend rates noted above.
Assumed health care cost trend rates have an effect on the amounts reported for the postretirement plans. A one percentage point change in assumed health care cost trend rates would have the following annualized effects on reported amounts for 2017:
One Percentage Point | |||||
(Thousands of Dollars) | Increase | Decrease | |||
Effect on net periodic postretirement benefit | 19 | (17 | ) | ||
Effect on postretirement benefit obligation | 578 | (526 | ) | ||
66
Plan Assets
Assets of the retiree medical plan are invested in a master trust. The master trust also pays benefits of active employee medical plans for the same union employees. In 2016, it was determined that the assets of the retiree medical plan should be allocated among all plans that it funds and as a result, we allocated $4,925,000 of the retiree medical plan assets to the active medical plans during the year. The fair value of master trust assets allocated to the active employee medical plans at September 25, 2017 is $4,372,000, which are included within the tables below.
The primary objective of our investment strategy is to satisfy our postretirement obligations at a reasonable cost. Assets are actively invested to balance real growth of capital through appreciation and reinvestment of dividend and interest income and safety of invested funds.
Our investment policy outlines the governance structure for decision making, sets investment objectives and restrictions, and establishes criteria for selecting and evaluating investment managers. The use of derivatives is strictly prohibited, except on a case-by-case basis where the manager has a proven capability, and only to hedge quantifiable risks such as exposure to foreign currencies. An investment committee, consisting of certain of our executives and supported by independent consultants, is responsible for monitoring compliance with the investment policy. Assets are periodically redistributed to maintain the appropriate policy allocation.
The weighted-average asset allocation of our postretirement assets is as follows:
(Percent) | Policy Allocation | Actual Allocation | ||
Asset Class | September 24 2017 | September 24 2017 | September 25 2016 | |
Equity securities | 20 | 21 | 22 | |
Debt securities | 70 | 67 | 65 | |
Hedge fund investment | 10 | 12 | 11 | |
Cash and cash equivalents | — | — | 2 | |
Plan assets include no Company securities. Assets include cash and cash equivalents and receivables from time to time due to the need to reallocate assets within policy guidelines.
Fair Value Measurements
The fair value hierarchy of postretirement assets at September 24, 2017 is as follows:
(Thousands of Dollars) | NAV | Level 1 | Level 2 | Level 3 | ||||
Cash and cash equivalents | — | — | — | — | ||||
Domestic equity securities | — | 3,479 | 741 | — | ||||
International equity securities | — | 800 | 1,051 | — | ||||
Debt securities | — | 19,548 | — | — | ||||
Hedge fund investment | 3,343 | — | — | — | ||||
The fair value hierarchy of postretirement assets at September 25, 2016 is as follows:
(Thousands of Dollars) | NAV | Level 1 | Level 2 | Level 3 | ||||
Cash and cash equivalents | — | 518 | — | — | ||||
Domestic equity securities | — | 3,342 | 1,572 | — | ||||
International equity securities | — | 695 | 898 | — | ||||
Debt securities | — | 18,840 | — | — | ||||
Hedge fund investment | 3,182 | — | — | — | ||||
There were no purchases, sales or transfers of assets classified as Level 3 in 2017 or 2016.
67
Cash Flows
Based on our forecast at September 24, 2017, we do not expect to contribute to our postretirement plans in 2018.
The Medicare Prescription Drug, Improvement and Modernization Act of 2003 (the “Modernization Act”) introduced a prescription drug benefit under Medicare (“Medicare Part D”) and a federal subsidy to sponsors of retiree health care benefit plans (“Subsidy”) that provide a benefit at least actuarially equivalent (as that term is defined in the Modernization Act) to Medicare Part D. We concluded we qualify for the Subsidy under the Modernization Act since the prescription drug benefits provided under our postretirement health care plans generally require lower premiums from covered retirees and have lower deductibles than the benefits provided in Medicare Part D and, accordingly, are actuarially equivalent to or better than, the benefits provided under the Modernization Act.
We anticipate future benefit payments to be paid either with future contributions to the plan or directly from plan assets, as follows:
(Thousands of Dollars) | Gross Payments | Less Medicare Part D Subsidy | Net Payments | |||||
2018 | 3,474 | (167 | ) | 3,307 | ||||
2019 | 1,393 | (168 | ) | 1,225 | ||||
2020 | 1,372 | (168 | ) | 1,204 | ||||
2021 | 1,340 | (166 | ) | 1,174 | ||||
2022 | 1,298 | (162 | ) | 1,136 | ||||
2023-2027 | 5,582 | (695 | ) | 4,887 | ||||
Postemployment Plan
Our postemployment benefit obligation, representing certain disability benefits, is $2,943,000 at September 24, 2017 and $3,190,000 at September 25, 2016.
7 OTHER RETIREMENT PLANS
Substantially all of our employees are eligible to participate in a qualified defined contribution retirement plan. We also have a non-qualified plan for employees whose incomes exceed qualified plan limits.
Retirement and compensation plan costs, including costs related to stock based compensation and the defined contribution retirement plan, charged to continuing operations are $4,396,000 in 2017, $4,616,000 in 2016 and $4,125,000 in 2015.
Multiemployer Pension Plans
We contribute to three multiemployer defined benefit pension plans under the terms of collective-bargaining agreements ("CBAs"). The risks of participating in these multiemployer plans are different from our company-sponsored plans in the following aspects:
• | We do not manage the plan investments or any other aspect of plan administration; |
• | Assets contributed to the multiemployer plan by one employer may be used to provide benefits to employees of other participating employers; |
• | If a participating employer stops contributing to the plan, the unfunded obligations of the plan may be borne by the remaining participating employers; and |
• | If we choose to stop participating in one or more multiemployer plans, we may be required to fund over time an amount based on the unfunded status of the plan at the time of withdrawal, referred to as "withdrawal liability". |
68
Information related to these plans is outlined in the table below:
(Thousands of Dollars) | Zone Status September 30 | Funding Improvement Plan/Rehabilitation Plan Status | Contributions | ||||||||
Pension Plan | 2017 | 2016 | Status | 2017 | 2016 | 2015 | Surcharge Imposed | Expiration Dates of CBAs | |||
GCIU- Employer Retirement Fund 91-6024903/001 | Red | Red | Implemented | 123 | 138 | 145 | No | 1/13/2018 | |||
CWA/ITU Negotiated Pension Plan 13-6212879/001 | Red | Red | Implemented | 101 | 108 | 122 | No | 5/12/2019 | |||
12/31/2017 | |||||||||||
4/1/2018 | |||||||||||
District No. 9, International Association of Machinists and Aerospace Workers Pension Trust 43-0736847/001 | Green | Green | N/A | 31 | 31 | 34 | N/A | 8/01/2019 | |||
Multiemployer plans in red zone status are generally less well funded than plans in green zone status.
One of our enterprise's bargaining units withdrew from representation, and as a result we are subject to a claim from the multiemployer pension plan for a withdrawal liability. The amount and timing of such liability will be dependent on actions taken, or not taken, by the Company and the pension plan, as well as the future investment performance and funding status of the pension plan. In 2017, we accrued a liability of $2,600,000 related to this withdrawal. The withdrawal liability determined to be due under this plan will be funded over a period of 20 years.
8 COMMON STOCK, CLASS B COMMON STOCK AND PREFERRED SHARE PURCHASE RIGHTS
Common Stock
The par value of our Common Stock was changed from $2.00 per share to $0.01 per share effective January 30, 2012. Holders of our previous 2nd lien agreement shared in the issuance of 6,743,640 shares of our Common Stock, an amount equal to 13% of outstanding shares on a pro forma basis as of January 30, 2012.
In connection with the currently outstanding 2nd Lien Term Loan, we entered into the Warrant Agreement. Under the Warrant Agreement, certain affiliates or designees of the 2nd Lien Lenders received on March 31, 2014 their pro rata share of Warrants to purchase, in cash, 6,000,000 shares of Common Stock, subject to adjustment pursuant to anti-dilution provisions. The Warrants represent, when fully exercised, approximately 10.1% of shares of Common Stock outstanding at March 30, 2014 on a fully diluted basis. The exercise price of the Warrants is $4.19 per share.
The Warrant Agreement contains a cash settlement provision in the event of a change of control prior to March 31, 2018, as well as other provisions requiring the Warrants be measured at fair value and classified as warrants and other liabilities in our Consolidated Balance Sheets. We remeasure the liability to fair value each reporting period, with changes reported in other non-operating income (expense). The initial fair value of the Warrants was $16,930,000. At September 24, 2017, the fair value of the Warrants is $1,580,000.
In connection with the issuance of the Warrants, we entered into the Registration Rights Agreement. The Registration Rights Agreement requires, among other matters, that we use our commercially reasonable efforts to file and maintain the effectiveness for certain specified periods of a shelf registration statement covering the shares of Common Stock upon exercise of the Warrants.
69
Class B Common Stock
In 1986, one share of Class B Common Stock was issued as a dividend for each share of Common Stock held by stockholders of record at the time. The transfer of Class B Common Stock was restricted. As originally anticipated, the number of outstanding Class B shares decreased over time through trading and reached the sunset level of 5,600,000 shares in March 2011. In March 2011, in accordance with the sunset provisions established in 1986, we effected conversion of all outstanding shares of Class B Common Stock to Common Stock. As a result, all stockholders have one vote per share on all future matters. Class B shares formerly had ten votes per share.
Preferred Share Purchase Rights
In 1998, the Board of Directors adopted a Shareholder Rights Plan (the “Rights Plan”). Under the Rights Plan, the Board of Directors declared a dividend of one Preferred Share Purchase Right (“Right”) for each outstanding share of our Common Stock and Class B Common Stock (collectively “Common Shares”). Rights are attached to, and automatically trade with, our Common Shares. In 2008, the Board of Directors approved an amendment to the Rights Plan. The amendment increased the beneficial ownership threshold to 25% from 20% for stockholders purchasing Common Stock for passive investment only and decreased the threshold to 15% for all other investors. In addition, the amendment extended the expiration of the Rights Plan to May 31, 2018 from May 31, 2008.
Rights become exercisable only in the event that any person or group of affiliated persons other than a passive investor becomes a holder of 15% or more of our outstanding Common Shares, or commences a tender or exchange offer which, if consummated, would result in that person or group of affiliated persons owning at least 15% of our outstanding Common Shares. Once the Rights become exercisable, they entitle all other stockholders to purchase, by payment of a $150 exercise price, one one-thousandth of a share of Series A Participating Preferred Stock, subject to adjustment, with a value of twice the exercise price. In addition, at any time after a 15% position is acquired and prior to the acquisition of a 50% position, the Board of Directors may require, in whole or in part, each outstanding Right (other than Rights held by the acquiring person or group of affiliated persons) to be exchanged for one share of Common Stock or one one-thousandth of a share of Series A Preferred Stock. The Rights may be redeemed at a price of $0.001 per Right at any time prior to their expiration.
9 STOCK OWNERSHIP PLANS
Total non-cash stock compensation expense is $2,088,000, $2,306,000 and $1,971,000, in 2017, 2016 and 2015, respectively.
At September 24, 2017, we have reserved 3,589,448 shares of Common Stock for issuance to employees under an incentive and nonstatutory stock option and restricted stock plan approved by stockholders of which 2,318,298 shares are available for granting of non-qualified stock options or issuance of restricted Common Stock.
Stock Options
Options are granted at a price equal to the fair market value on the date of the grant and are exercisable, upon vesting, over a ten-year period.
A summary of stock option activity is as follows:
(Thousands of Shares) | 2017 | 2016 | 2015 | |||||
Under option, beginning of year | 1,698 | 1,871 | 2,333 | |||||
Exercised | (339 | ) | (74 | ) | (289 | ) | ||
Canceled | (88 | ) | (99 | ) | (173 | ) | ||
Under option, end of year | 1,271 | 1,698 | 1,871 | |||||
Exercisable, end of year | 1,271 | 1,692 | 1,840 | |||||
70
Weighted average prices of stock options are as follows:
(Dollars) | 2017 | 2016 | 2015 | |||||
Exercised | 1.53 | 1.17 | 1.27 | |||||
Cancelled | 14.02 | 8.78 | 5.02 | |||||
Under option, end of year | 1.86 | 2.42 | 2.71 | |||||
A summary of stock options outstanding at September 24, 2017 is as follows:
(Dollars) | Options Outstanding | Options Exercisable | ||||||||||
Range of Exercise Prices | Number Outstanding (Thousands) | Weighted Average Remaining Contractual Life (Years) | Weighted Average Exercise Price | Number Exercisable (Thousands) | Weighted Average Exercise Price | |||||||
1 - 2 | 569 | 4.7 | 1.14 | 569 | 1.14 | |||||||
2 - 3 | 702 | 2.8 | 2.44 | 702 | 2.44 | |||||||
1,271 | 3.6 | 1.86 | 1,271 | 1.86 | ||||||||
There is no unrecognized compensation expense for unvested stock options at September 24, 2017.
The aggregate intrinsic value of stock options outstanding at September 24, 2017 is $631,000.
Restricted Common Stock
A summary of restricted Common Stock activity follows:
(Thousands of Shares) | 2017 | 2016 | 2015 | |||||
Outstanding, beginning of year | 2,462 | 1,546 | 1,291 | |||||
Granted | 837 | 1,018 | 786 | |||||
Vested | (751 | ) | (63 | ) | (500 | ) | ||
Forfeited | (70 | ) | (39 | ) | (31 | ) | ||
Outstanding, end of year | 2,478 | 2,462 | 1,546 | |||||
Weighted average grant date fair values of restricted Common Stock are as follows:
(Dollars) | 2017 | 2016 | 2015 | |||||
Outstanding, beginning of year | 2.74 | 3.62 | 2.72 | |||||
Granted | 3.34 | 1.49 | 3.62 | |||||
Vested | 3.59 | 3.39 | 1.31 | |||||
Forfeited | 2.98 | 3.31 | 3.62 | |||||
Outstanding, end of year | 2.69 | 2.74 | 3.62 | |||||
Total unrecognized compensation expense for unvested restricted Common Stock at September 24, 2017 is $2,788,000, which will be recognized over a weighted average period of 1.3 years.
In December 2017, we issued 375,000 shares of restricted Common Stock to employees. The grant date fair value was $2.30 per share. All restrictions with respect to these shares lapse in December 2021 with respect to these shares.
71
Stock Purchase Plans
We have 270,000 shares of Common Stock available for issuance pursuant to our Employee Stock Purchase Plan. We also have 8,700 shares of Common Stock available for issuance under our Supplemental Employee Stock Purchase Plan. There has been no activity under these plans in 2017, 2016 or 2015.
10 INCOME TAXES
Income tax expense consists of the following:
(Thousands of Dollars) | 2017 | 2016 | 2015 | |||||
Current: | ||||||||
Federal | 394 | 1,241 | 720 | |||||
State | 819 | 379 | (92 | ) | ||||
Deferred | 10,398 | 20,556 | 12,966 | |||||
11,611 | 22,176 | 13,594 | ||||||
Income tax expense (benefit) related to continuing operations differs from the amounts computed by applying the U.S. federal income tax rate to income (loss) before income taxes. The reasons for these differences are as follows:
(Percent of Income (Loss) Before Income Taxes) | 2017 | 2016 | 2015 | |||||
Computed “expected” income tax expense (benefit) | 35.0 | 35.0 | 35.0 | |||||
State income tax expense (benefit), net of federal tax impact | 2.3 | 3.8 | (7.1 | ) | ||||
Net income of associated companies taxed at dividend rates | (3.7 | ) | (2.6 | ) | (5.2 | ) | ||
Resolution of tax matters | 2.2 | 3.2 | 0.5 | |||||
Non-deductible expenses | 1.5 | 1.0 | 2.8 | |||||
Valuation allowance | 2.6 | (7.7 | ) | 15.9 | ||||
Warrant valuation | (10.2 | ) | 5.0 | (6.1 | ) | |||
Other | (0.8 | ) | 0.4 | 0.1 | ||||
28.9 | 38.1 | 35.9 | ||||||
72
Net deferred income tax liabilities consist of the following components:
(Thousands of Dollars) | September 24 2017 | September 25 2016 | |||
Deferred income tax liabilities: | |||||
Property and equipment | (28,422 | ) | (33,549 | ) | |
Identified intangible assets | (35,790 | ) | (43,745 | ) | |
Long-term debt | (16,993 | ) | (16,158 | ) | |
(81,205 | ) | (93,452 | ) | ||
Deferred income tax assets: | |||||
Investments | 2,520 | 12,138 | |||
Accrued compensation | 4,622 | 6,391 | |||
Allowance for doubtful accounts and losses on loans | 1,487 | 1,273 | |||
Pension and postretirement benefits | 4,593 | 6,505 | |||
Net operating loss carryforwards | 37,997 | 52,604 | |||
Accrued expenses | 601 | 577 | |||
Other | 5,023 | 3,634 | |||
56,843 | 83,122 | ||||
Valuation allowance | (29,035 | ) | (27,978 | ) | |
Net deferred income tax liabilities | (53,397 | ) | (38,308 | ) | |
All deferred taxes are categorized as non-current.
A reconciliation of 2017 and 2016 changes in gross unrecognized tax benefits is as follows:
(Thousands of Dollars) | 2017 | 2016 | |||
Balance, beginning of year | 12,531 | 11,799 | |||
Increases (decreases) in tax positions for prior years | 36 | 46 | |||
Increases in tax positions for the current year | 2,150 | 1,600 | |||
Lapse in statute of limitations | (802 | ) | (914 | ) | |
Balance, end of year | 13,915 | 12,531 | |||
Approximately $9,010,000 and $8,025,000 of the gross unrecognized tax benefit balances for 2017 and 2016 respectively, relate to state net operating losses which are netted against deferred taxes on our balance sheet. The total amount of unrecognized tax benefits that, if recognized, would impact the effective tax rate was $9,045,000 at September 24, 2017. We recognize interest and penalties related to unrecognized tax benefits as a component of income tax expense. The amount of accrued interest related to unrecognized tax benefits was, net of tax, $367,000 at September 24, 2017 and $317,000 at September 25, 2016. There were no amounts provided for penalties at September 24, 2017 or September 25, 2016.
No significant income tax audits are currently in progress and the Company has not received any notices of intent to audit. Certain of the Company's state income tax returns for the year ended September 30, 2012 are open for examination. The Federal and remaining state returns are open beginning with the September 29, 2014 year.
At September 24, 2017, we have state tax benefits of approximately $57,856,000 in net operating loss ("NOL") carryforwards that expire between 2018 and 2037. These NOL carryforwards result in a deferred income tax asset of $37,607,000 at September 24, 2017, a portion of which is offset by a valuation allowance.
We reported a Federal NOL of approximately $58,601,000 as of year-end September 25, 2016. We expect to report taxable income in 2017 which will further reduce the Federal NOL to $17,850,000 resulting in a deferred income tax asset balance of $6,247,000 as of September 24, 2017. A valuation allowance is not required for the Federal NOL in the current year based on our projection of future earnings during the carryforward period.
73
11 FAIR VALUE OF FINANCIAL INSTRUMENTS
The following methods and assumptions are used to estimate the fair value of each class of financial instruments for which it is practicable to estimate value.
The carrying amounts of cash equivalents, accounts receivable and accounts payable approximate fair value because of the short maturity of those instruments. Investments totaling $6,068,000, including our 17% ownership of the non-voting common stock of TCT and a private equity investment, are carried at cost. As of September 25, 2017, the approximate fair value of the private equity investment is $9,205,000, which is a level 3 fair value measurement.
The fair value of floating rate debt, which consists of our 1st Lien Term Loan, is $45,145,000, based on an average of private market price quotations. Our fixed rate debt consists of $385,000,000 principal amount of the Notes and, $118,240,000 principal amount under the 2nd Lien Term Loan. At September 24, 2017, based on an average of private market price quotations, the fair values were $397,513,000 and $121,787,000 for the Notes and 2nd Lien Term Loan, respectively. These represent Level 2 fair value measurements.
As discussed more fully in Notes 4 and 8, we recorded a liability for the Warrants issued in connection with the Warrant Agreement. The liability was initially measured at its fair value and we will remeasure the liability to fair value each reporting period, with changes reported in other non-operating income (expense). The initial fair value of the Warrants was $16,930,000. The fair value of the Warrants at September 24, 2017, September 25, 2016 and September 27, 2015 are $1,580,000, $11,760,000 and $4,240,000, respectively. In other, net in the Consolidated Statements of Income and Comprehensive Income, we recognized income of $10,181,000 in 2017, expense of $7,519,000 in 2016 and income of $6,568,000 in 2015, for adjustments in the fair value of the Warrants.
The following assumptions were used to estimate the fair value of the Warrants:
2017 | 2016 | 2015 | ||||||
Volatility (Percent) | 37 | 63 | 61 | |||||
Risk-free interest rate (Percent) | 1.81 | 1.25 | 1.75 | |||||
Expected term (Years) | 4.5 | 5.5 | 6.5 | |||||
Estimated fair value (Dollars) | 0.26 | 1.96 | 0.71 | |||||
12 EARNINGS PER COMMON SHARE
The following table sets forth the computation of basic and diluted earnings (loss) per common share:
(Thousands of Dollars and Shares, Except Per Common Share Data) | 2017 | 2016 | 2015 | |||||
Income attributable to Lee Enterprises, Incorporated: | 27,481 | 34,961 | 23,316 | |||||
Weighted average Common Stock | 56,481 | 55,493 | 54,430 | |||||
Less non-vested restricted Common Stock | (2,491 | ) | (2,295 | ) | (1,790 | ) | ||
Basic average Common Stock | 53,990 | 53,198 | 52,640 | |||||
Dilutive stock options and restricted Common Stock | 1,402 | 1,026 | 1,291 | |||||
Diluted average Common Stock | 55,392 | 54,224 | 53,931 | |||||
Earnings per common share: | ||||||||
Basic: | 0.51 | 0.66 | 0.44 | |||||
Diluted | 0.50 | 0.64 | 0.43 | |||||
For 2017, 2016 and 2015, we had 7,206,000, 7,577,000 and 6,620,000 weighted average shares, respectively, not considered in the computation of diluted earnings per common share because the exercise prices of the related stock options and Warrants were in excess of the fair market value of our Common Stock.
74
13 ALLOWANCE FOR DOUBTFUL ACCOUNTS
Valuation and qualifying account information related to the allowance for doubtful accounts receivable related to continuing operations is as follows:
(Thousands of Dollars) | 2017 | 2016 | 2015 | |||||
Balance, beginning of year | 4,327 | 4,194 | 4,526 | |||||
Additions charged to expense | 1,696 | 1,195 | 1,307 | |||||
Deductions from reserves | (1,227 | ) | (1,062 | ) | (1,639 | ) | ||
Balance, end of year | 4,796 | 4,327 | 4,194 | |||||
14 OTHER INFORMATION
Compensation and other accrued liabilities consist of the following:
(Thousands of Dollars) | September 24 2017 | September 25 2016 | |||
Compensation | 12,088 | 12,290 | |||
Retirement plans | 3,374 | 4,135 | |||
Other | 6,961 | 7,459 | |||
22,423 | 23,884 | ||||
Supplemental cash flow information includes the following cash payments:
(Thousands of Dollars) | 2017 | 2016 | 2015 | |||||
Interest | 58,844 | 65,410 | 72,937 | |||||
Debt financing and reorganization costs | 373 | 422 | 733 | |||||
Income tax payments, net | 1,214 | 269 | 485 | |||||
Accumulated other comprehensive income (loss), net of deferred income taxes at September 24, 2017 and September 25, 2016, is related to pension and postretirement benefits.
15 COMMITMENTS AND CONTINGENT LIABILITIES
Operating Leases
We have operating lease commitments for certain of our office, production and distribution facilities. Management expects that in the normal course of business, existing leases will be renewed or replaced. Minimum lease payments during the five years ending September 2022 and thereafter are $2,976,000, $1,581,000, $1,026,000, $784,000, $439,000 and $3,498,000, respectively. In 2017, 2016, and 2015 total operating lease expense is $3,866,000, $3,792,000 and $3,415,000, respectively.
Capital Expenditures
At September 24, 2017, we had construction and equipment purchase commitments totaling approximately $503,000.
Income Taxes
Commitments exclude unrecognized tax benefits to be recorded in accordance with FASB ASC Topic 740, Income Taxes. We are unable to reasonably estimate the ultimate amount or timing of cash settlements with the respective taxing authorities for such matters. See Note 10.
We file income tax returns with the Internal Revenue Service ("IRS") and various state tax jurisdictions. From time to time, we are subject to routine audits by those agencies, and those audits may result in proposed adjustments. We have considered the alternative interpretations that may be assumed by the various taxing agencies, believe our
75
positions taken regarding our filings are valid, and that adequate tax liabilities have been recorded to resolve such matters. However, the actual outcome cannot be determined with certainty and the difference could be material, either positively or negatively, to the Consolidated Statements of Income and Comprehensive Income (Loss) in the periods in which such matters are ultimately determined. We do not believe the final resolution of such matters will be material to our consolidated financial position or cash flows.
We have various income tax examinations ongoing and at various stages of completion, but generally our income tax returns have been audited or closed to audit through 2011.
Legal Proceedings
We are involved in a variety of legal actions that arise in the normal course of business. Insurance coverage mitigates potential loss for certain of these matters. While we are unable to predict the ultimate outcome of these legal actions, it is our opinion that the disposition of these matters will not have a material adverse effect on our Consolidated Financial Statements, taken as a whole.
Multiemployer Pension Plans
One of our enterprise's bargaining units withdrew from representation, and as a result we are subject to a claim from the multiemployer pension plan for a withdrawal liability. The amount and timing of such liability will be dependent on actions taken, or not taken, by the Company and the pension plan, as well as the future investment performance and funding status of the pension plan. In 2017, we accrued a liability of $2,600,000 related to this withdrawal. The withdrawal liability determined to be due under this plan will be funded over a period of 20 years.
16 QUARTERLY FINANCIAL DATA (UNAUDITED)
Quarter Ended | |||||||||||
(Thousands of Dollars, Except Per Common Share Data) | December | March | June | September | |||||||
2017 | |||||||||||
Operating revenue | 153,989 | 133,387 | 139,355 | 140,212 | |||||||
Net income | 12,440 | 6,377 | 6,287 | 3,501 | |||||||
Income attributable to Lee Enterprises, Incorporated | 12,173 | 6,128 | 5,995 | 3,185 | |||||||
Earnings per common share: | |||||||||||
Basic | 0.23 | 0.11 | 0.11 | 0.06 | |||||||
Diluted | 0.22 | 0.11 | 0.11 | 0.06 | |||||||
2016 | |||||||||||
Operating revenue | 168,405 | 146,835 | 150,946 | 148,178 | |||||||
Net income | 11,508 | 19,483 | 4,367 | 661 | |||||||
Income attributable to Lee Enterprises, Incorporated | 11,237 | 19,228 | 4,092 | 404 | |||||||
Earnings (loss) per common share: | |||||||||||
Basic | 0.21 | 0.36 | 0.08 | 0.01 | |||||||
Diluted | 0.21 | 0.36 | 0.08 | 0.01 | |||||||
Results of operations for the September quarter of 2017 include pre-tax non-cash impairment charges of $2,517,000.
76
Report of Independent Registered Public Accounting Firm
The Board of Directors and Stockholders
Lee Enterprises, Incorporated:
We have audited the accompanying consolidated balance sheets of Lee Enterprises, Incorporated and subsidiaries (the Company) as of September 24, 2017 and September 25, 2016, and the related consolidated statements of income and comprehensive income, stockholders’ equity (deficit), and cash flows for each of the 52-week periods ended September 24, 2017, September 25, 2016, and September 27, 2015. These consolidated financial statements are the responsibility of the Company’s management. Our responsibility is to express an opinion on these consolidated financial statements based on our audits.
We conducted our audits in accordance with the standards of the Public Company Accounting Oversight Board (United States). Those standards require that we plan and perform the audit to obtain reasonable assurance about whether the financial statements are free of material misstatement. An audit includes examining, on a test basis, evidence supporting the amounts and disclosures in the financial statements. An audit also includes assessing the accounting principles used and significant estimates made by management, as well as evaluating the overall financial statement presentation. We believe that our audits provide a reasonable basis for our opinion.
In our opinion, the consolidated financial statements referred to above present fairly, in all material respects, the financial position of Lee Enterprises, Incorporated and subsidiaries as of September 24, 2017 and September 25, 2016, and the results of their operations and their cash flows for each of the 52-week periods ended September 24, 2017, September 25, 2016, and September 27, 2015, in conformity with U.S. generally accepted accounting principles.
We also have audited, in accordance with the standards of the Public Company Accounting Oversight Board (United States), Lee Enterprises, Incorporated and subsidiaries’ internal control over financial reporting as of September 24, 2017, based on criteria established in Internal Control-Integrated Framework (2013) issued by the Committee of Sponsoring Organizations of the Treadway Commission (COSO), and our report dated December 8, 2017 expressed an unqualified opinion on the effectiveness of the Company’s internal control over financial reporting.
/s/ KPMG LLP
Chicago, Illinois
December 8, 2017
77
SIGNATURES
Pursuant to the requirements of Section 13 or 15(d) of the Securities Exchange Act of 1934, the Registrant has duly caused this Annual Report on Form 10-K to be signed on its behalf by the undersigned, thereunto duly authorized on the 8th day of December 2017.
LEE ENTERPRISES, INCORPORATED
/s/ Kevin D. Mowbray | /s/ Ronald A. Mayo | |
Kevin D. Mowbray | Ronald A. Mayo | |
President and Chief Executive Officer | Vice President, Chief Financial Officer and Treasurer | |
(Principal Executive Officer) | (Principal Financial and Accounting Officer) | |
Pursuant to the requirements of the Securities Exchange Act of 1934, this report has been signed below by the following persons on behalf of the Registrant and in their respective capacities on the 8th day of December 2017.
Signature | ||
/s/ Richard R. Cole | Director | |
Richard R. Cole | ||
/s/ Nancy S. Donovan | Director | |
Nancy S. Donovan | ||
/s/ Leonard J. Elmore | Director | |
Leonard J. Elmore | ||
/s/ Mary E. Junck | Executive Chairman and Director | |
Mary E. Junck | ||
/s/ Brent Magid | Director | |
Brent Magid | ||
/s/ William E. Mayer | Director | |
William E. Mayer | ||
/s/ Herbert W. Moloney III | Director | |
Herbert W. Moloney III | ||
/s/ Kevin D. Mowbray | President and Chief Executive Officer, and Director | |
Kevin D. Mowbray | ||
/s/ Gregory P. Schermer | Director | |
Gregory P. Schermer | ||
/s/ Ronald A. Mayo | Vice President, Chief Financial Officer and Treasurer | |
Ronald A. Mayo | ||
78
EXHIBIT INDEX
Exhibits marked with an asterisk (*) are incorporated by reference to documents previously filed by us with the SEC, as indicated. Exhibits marked with a plus (+) are management contracts or compensatory plan contracts or arrangements filed pursuant to Item 601(b)(10)(iii)(A) of Regulation S-K. All other documents listed are filed with this Annual Report on Form 10-K.
Number | Description |
3.1 * | |
3.2 * | |
4.1 * | |
4.2 * | |
4.3 * | |
4.4 * | |
10.1 * | |
10.2 * | |
10.3 * | |
10.4 * | |
10.5 * | |
10.6 * | |
79
Number | Description |
10.7 * | |
10.8 * | |
10.9 * | |
10.10 * | |
10.11 * | |
10.12 * | |
10.13* | |
10.14 * | |
10.15 * | |
10.16 * | |
10.17* | |
10.18* | |
10.19* | |
10.20* | |
10.21* | |
10.22* | |
10.23 * | |
80
Number | Description |
10.24 * | |
10.25* | |
10.26 +* | |
10.27.1 +* | |
10.27.2 +* | |
10.27.3 +* | |
10.27.4 +* | |
10.28 +* | |
10.29 +* | |
10.30 +* | |
10.31.1 +* | |
10.31.2 +* | |
10.31.3 +* | |
10.32 + | |
10.33 +* | |
21 | |
23 | |
24 | |
31.1 | |
31.2 | |
32 | |
81