Attached files
| file | filename |
|---|---|
| EX-99.1 - EX-99.1 - IES Holdings, Inc. | d493623dex991.htm |
| 8-K - 8-K - IES Holdings, Inc. | d493623d8k.htm |
IES Holdings, Inc. Fourth Quarter and Fiscal Year 2017 Update Exhibit 99.2
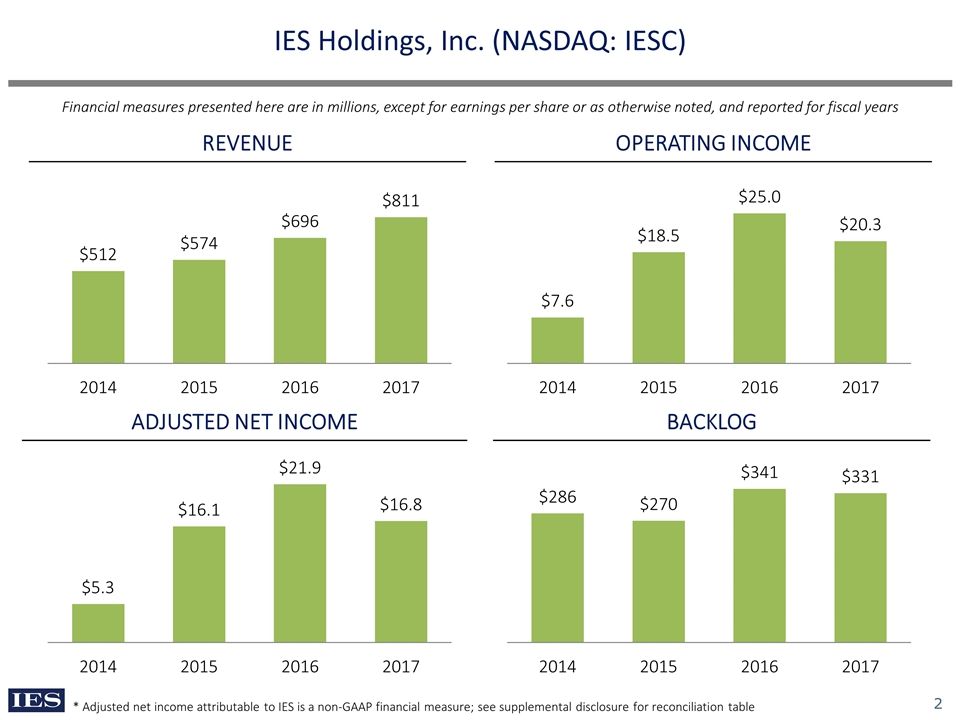
IES Holdings, Inc. (NASDAQ: IESC) REVENUE OPERATING INCOME ADJUSTED NET INCOME BACKLOG * Adjusted net income attributable to IES is a non-GAAP financial measure; see supplemental disclosure for reconciliation table Financial measures presented here are in millions, except for earnings per share or as otherwise noted, and reported for fiscal years
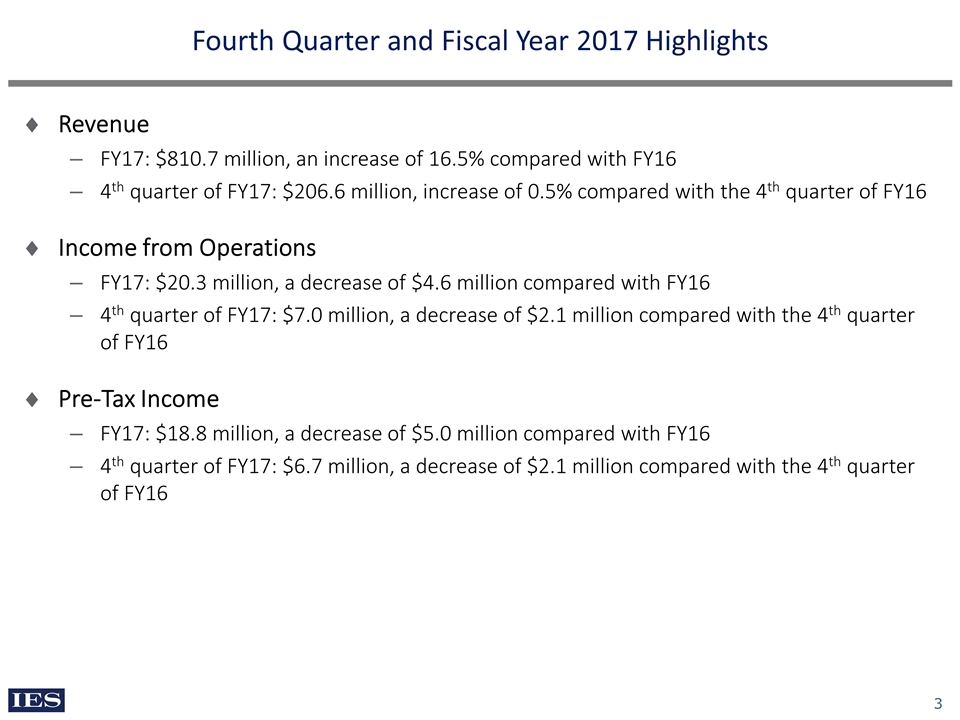
Fourth Quarter and Fiscal Year 2017 Highlights Revenue FY17: $810.7 million, an increase of 16.5% compared with FY16 4th quarter of FY17: $206.6 million, increase of 0.5% compared with the 4th quarter of FY16 Income from Operations FY17: $20.3 million, a decrease of $4.6 million compared with FY16 4th quarter of FY17: $7.0 million, a decrease of $2.1 million compared with the 4th quarter of FY16 Pre-Tax Income FY17: $18.8 million, a decrease of $5.0 million compared with FY16 4th quarter of FY17: $6.7 million, a decrease of $2.1 million compared with the 4th quarter of FY16
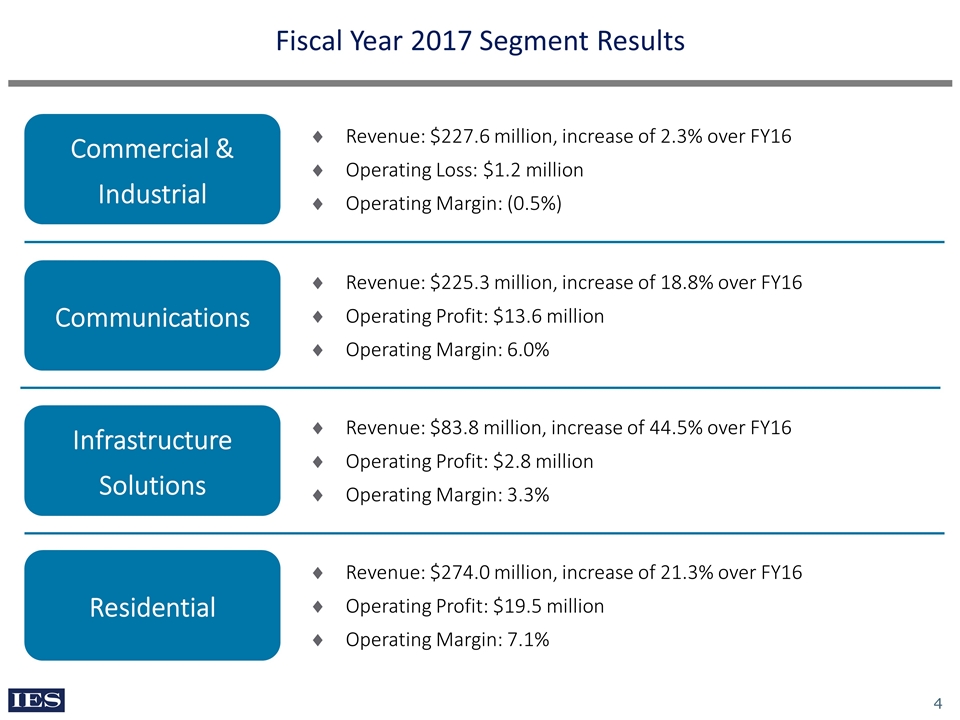
Fiscal Year 2017 Segment Results Commercial & Industrial Communications Infrastructure Solutions Residential Revenue: $227.6 million, increase of 2.3% over FY16 Operating Loss: $1.2 million Operating Margin: (0.5%) Revenue: $225.3 million, increase of 18.8% over FY16 Operating Profit: $13.6 million Operating Margin: 6.0% Revenue: $83.8 million, increase of 44.5% over FY16 Operating Profit: $2.8 million Operating Margin: 3.3% Revenue: $274.0 million, increase of 21.3% over FY16 Operating Profit: $19.5 million Operating Margin: 7.1%
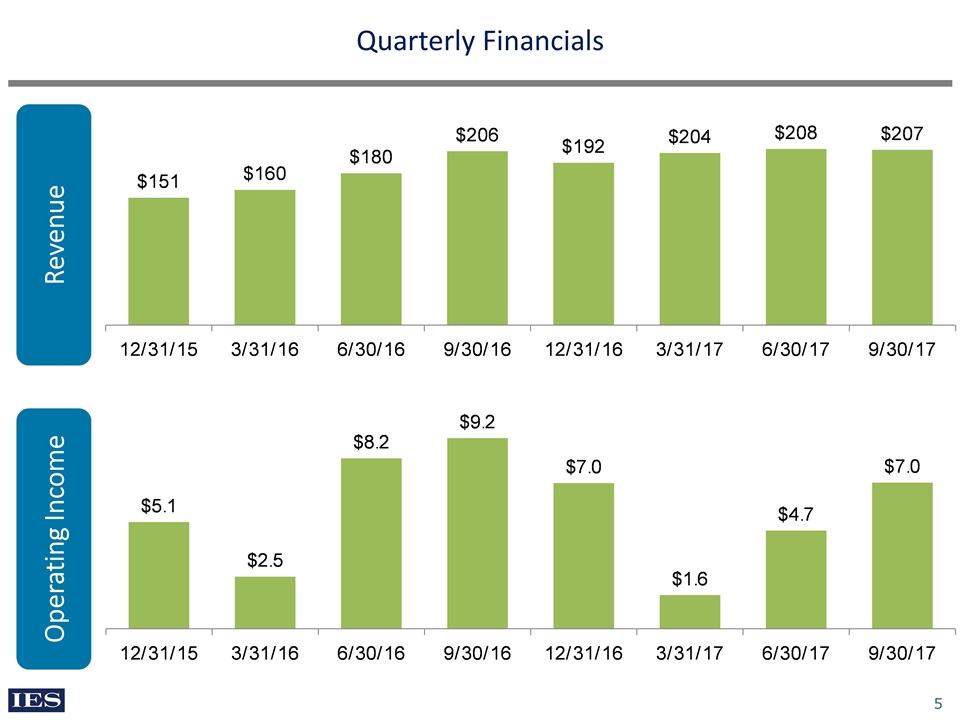
Quarterly Financials Revenue Operating Income
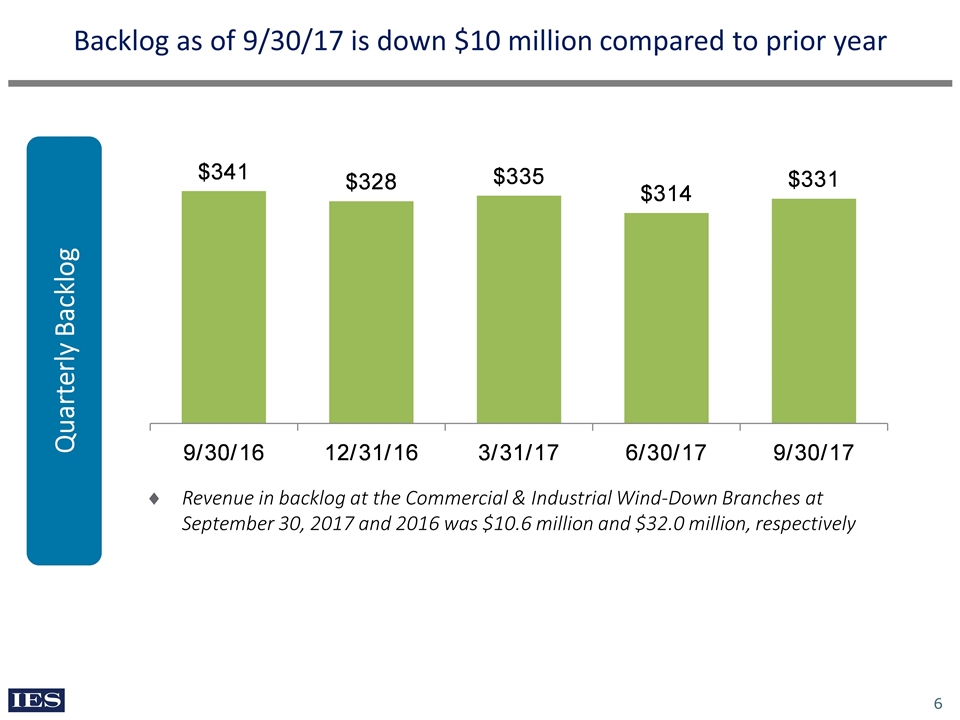
Backlog as of 9/30/17 is down $10 million compared to prior year Quarterly Backlog Revenue in backlog at the Commercial & Industrial Wind-Down Branches at September 30, 2017 and 2016 was $10.6 million and $32.0 million, respectively
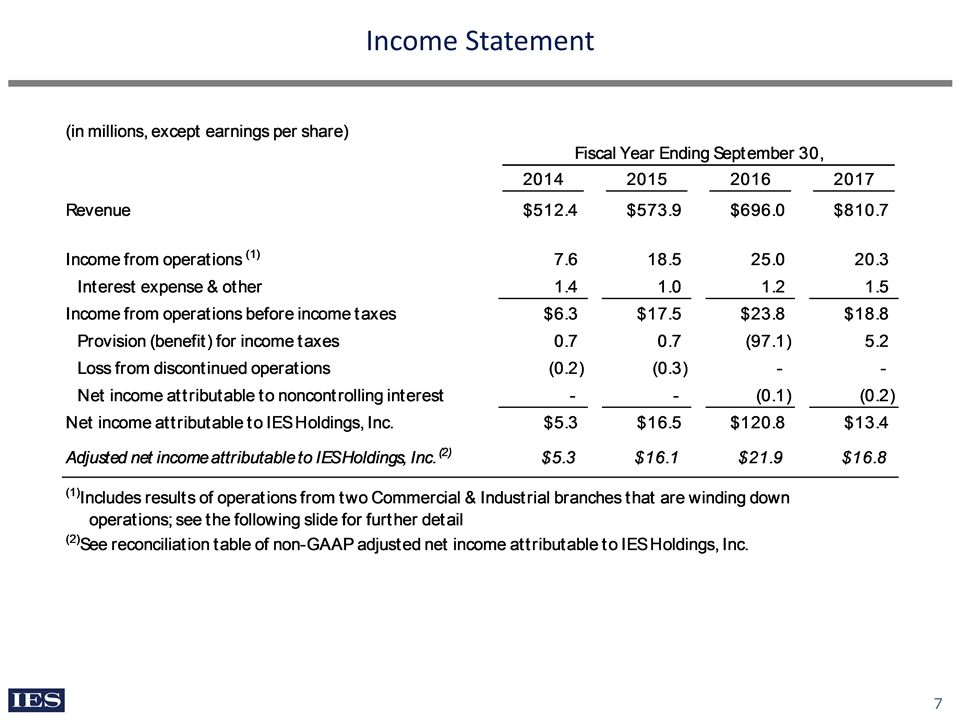
Income Statement
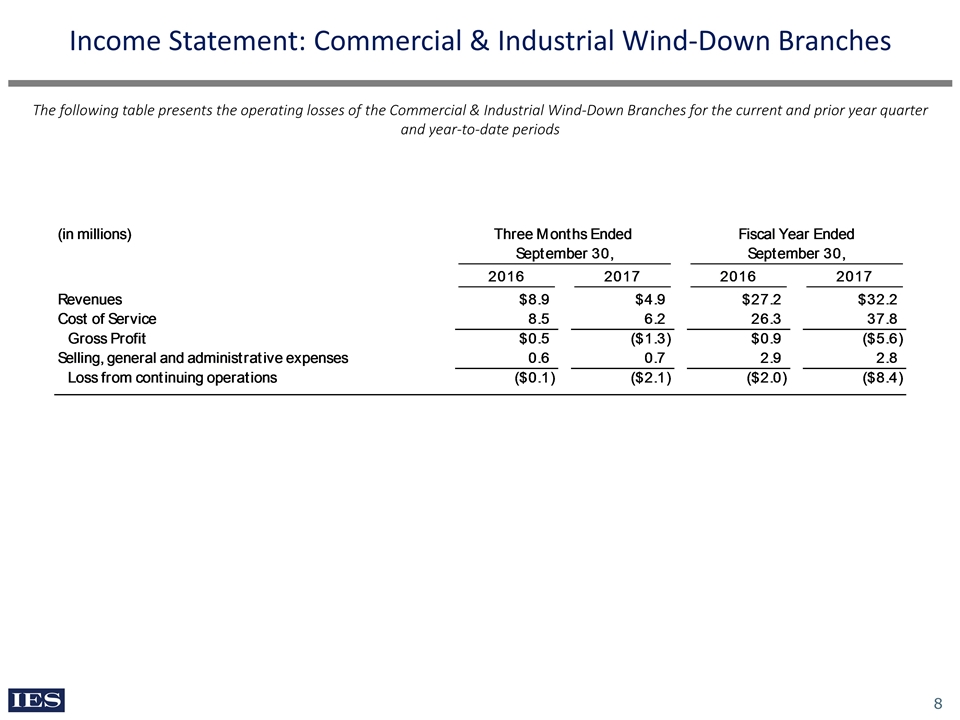
Income Statement: Commercial & Industrial Wind-Down Branches The following table presents the operating losses of the Commercial & Industrial Wind-Down Branches for the current and prior year quarter and year-to-date periods
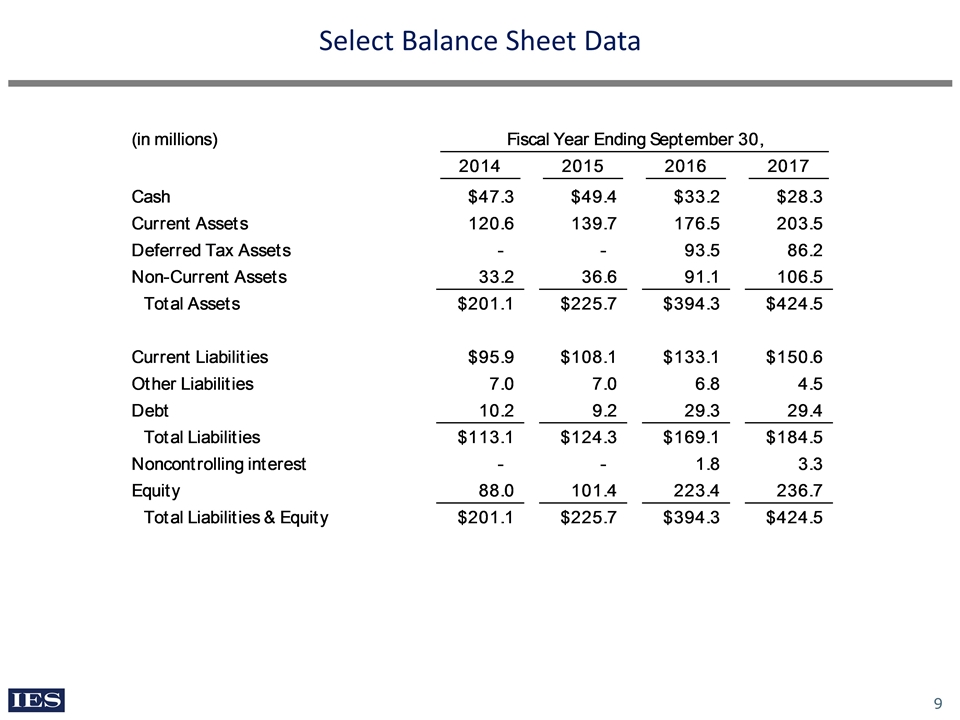
Select Balance Sheet Data
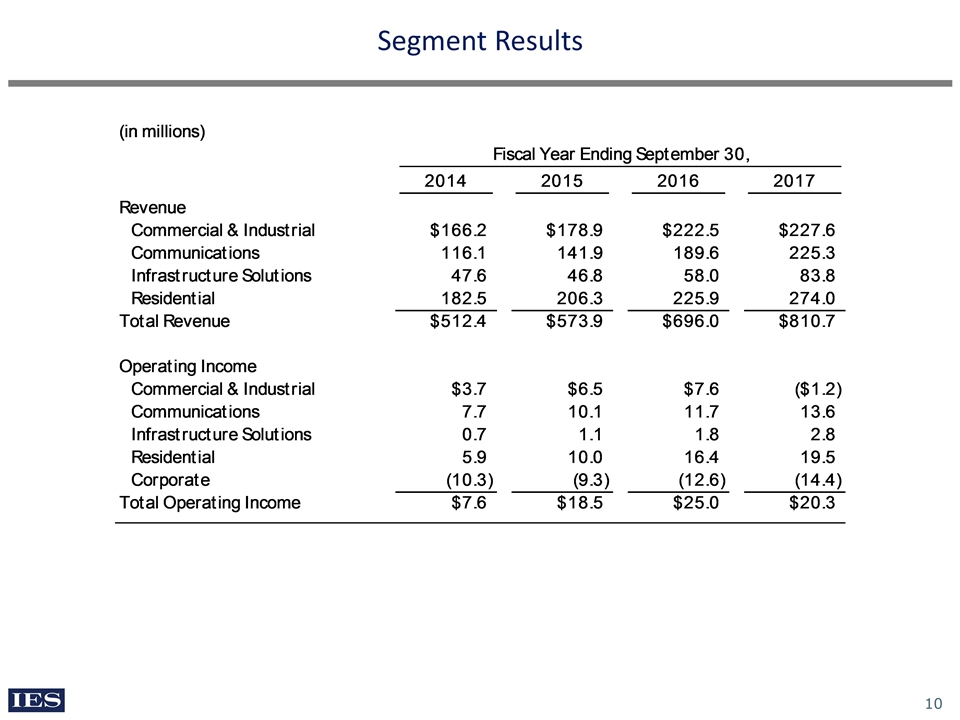
Segment Results
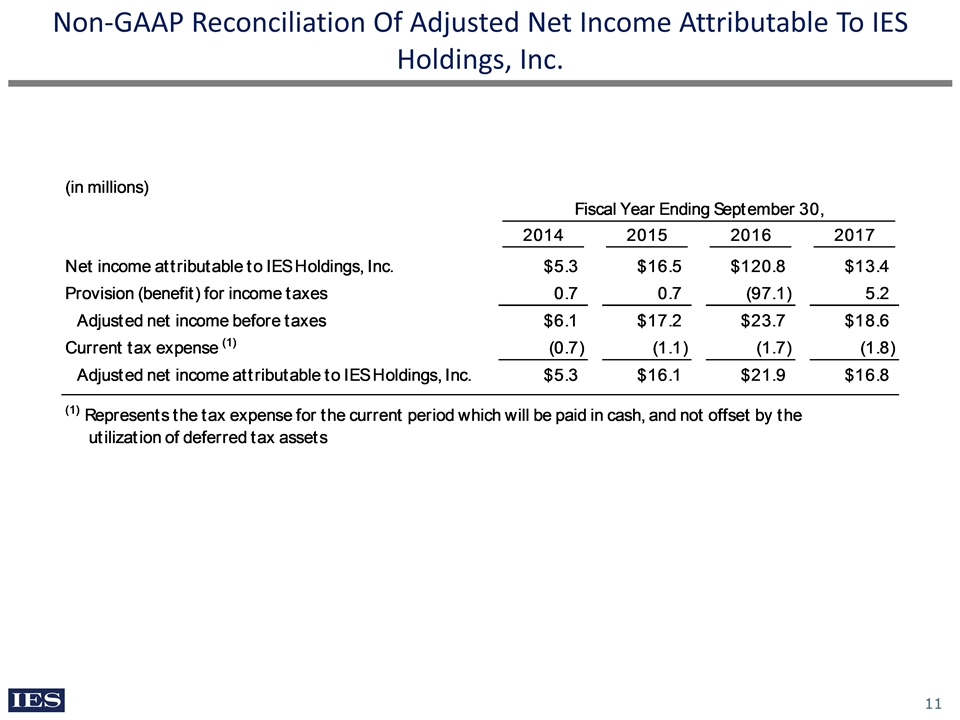
Non-GAAP Reconciliation Of Adjusted Net Income Attributable To IES Holdings, Inc.
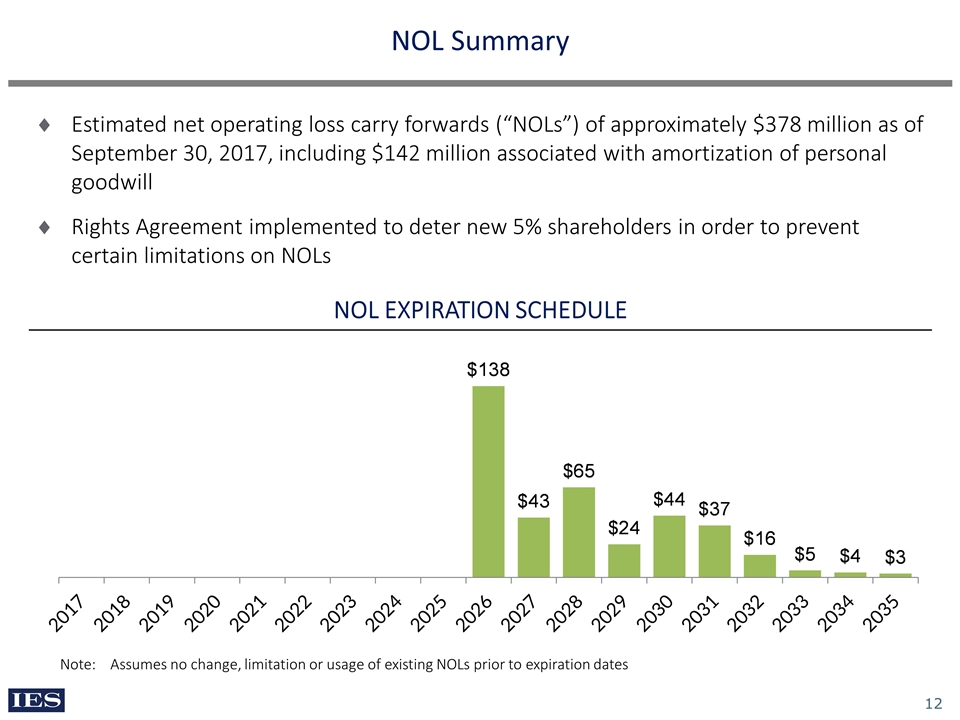
NOL Summary Estimated net operating loss carry forwards (“NOLs”) of approximately $378 million as of September 30, 2017, including $142 million associated with amortization of personal goodwill Rights Agreement implemented to deter new 5% shareholders in order to prevent certain limitations on NOLs Note: Assumes no change, limitation or usage of existing NOLs prior to expiration dates NOL EXPIRATION SCHEDULE
