Attached files
| file | filename |
|---|---|
| 8-K - FORM 8-K - Regional Management Corp. | d489596d8k.htm |
Exhibit 99.1
Jefferies Crossover Consumer Finance Summit
December 7, 2017
Safe Harbor Statement
This presentation, the
related remarks, and the responses to various questions may contain various “forward-looking statements” within the meaning of the Private Securities Litigation Reform Act of 1995, which represent Regional Management Corp.’s
expectations or beliefs concerning future events. Words such as “may,” “will,” “should,” “likely,” “anticipates,” “expects,” “intends,” “plans,” “projects,”
“believes,” “estimates,” “outlook,” and similar expressions may be used to identify these forward-looking statements. Such forward-looking statements are about matters that are inherently subject to risks and
uncertainties, many of which are outside of the control of Regional Management. Factors that could cause actual results or performance to differ from the expectations expressed or implied in such forward-looking statements include, but are not
limited to, the following: changes in general economic conditions, including levels of unemployment and bankruptcies; risks associated with Regional Management’s transition to a new loan origination and servicing software system; risks related
to opening new branches, including the ability or inability to open new branches as planned; risks inherent in making loans, including repayment risks and value of collateral, which risks may increase in light of adverse or recessionary economic
conditions; changes in interest rates; the risk that Regional Management’s existing sources of liquidity become insufficient to satisfy its needs or that its access to these sources becomes unexpectedly restricted; changes in federal, state, or
local laws, regulations, or regulatory policies and practices, and risks associated with the manner in which laws and regulations are interpreted, implemented, and enforced; the timing and amount of revenues that may be recognized by Regional
Management; changes in current revenue and expense trends (including trends affecting delinquencies and credit losses); changes in Regional Management’s markets and general changes in the economy (particularly in the markets served by Regional
Management); changes in the competitive environment in which Regional Management operates or in the demand for its products; risks related to acquisitions; changes in operating and administrative expenses; and the departure, transition, or
replacement of key personnel. Such factors and others are discussed in greater detail in Regional Management’s filings with the Securities and Exchange Commission. We cannot guarantee future events, results, actions, levels of activity,
performance, or achievements.
Except to the extent required by law, neither Regional Management nor any of its respective agents, employees, or advisors intend or
have any duty or obligation to supplement, amend, update, or revise any forward-looking statement, whether as a result of new information, future developments, or otherwise.
The information and opinions contained in this document are provided as of the date of this presentation and are subject to change without notice. This document has not been
approved by any regulatory or supervisory authority.
2
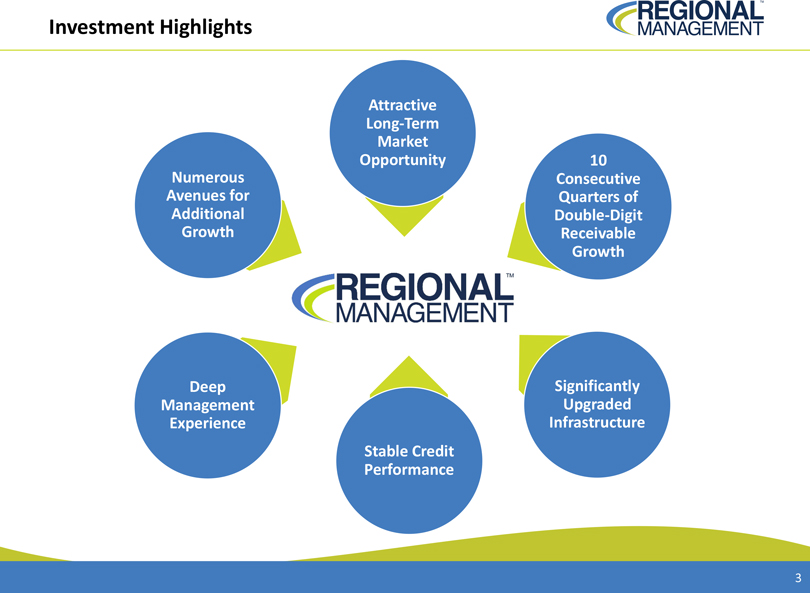
Investment Highlights
Numerous Avenues for
Additional Growth
Attractive Long-Term Market Opportunity
10 Consecutive
Quarters of Double-Digit Receivable Growth
Significantly Upgraded Infrastructure
Stable Credit Performance
Deep Management Experience
3
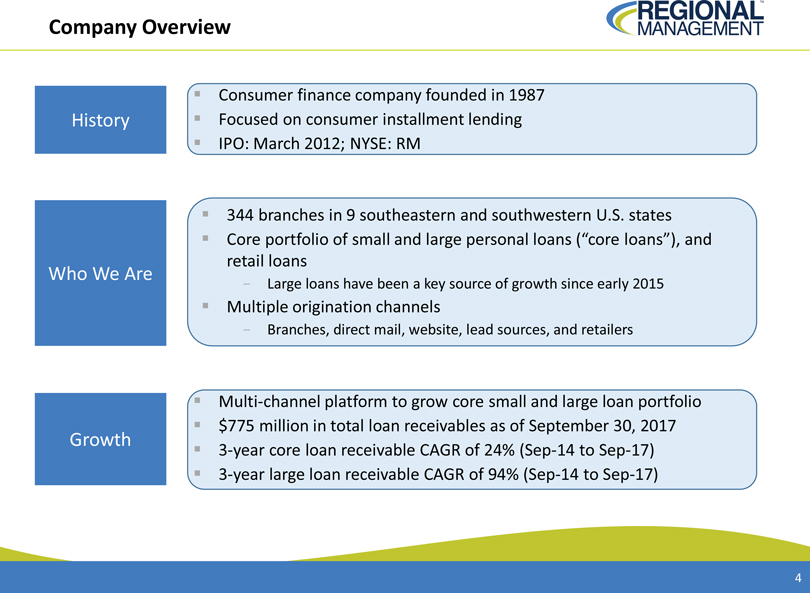
Company Overview
History
Consumer finance company founded in 1987 Focused on consumer installment lending IPO: March 2012; NYSE: RM
Who We Are
344 branches in 9 southeastern and southwestern U.S. states Core portfolio of small
and large personal loans (“core loans”), and retail loans
- Large loans have been a key source of growth since early 2015
Multiple origination channels
- Branches, direct mail, website, lead sources, and retailers
Growth
Multi-channel platform to grow core small and large loan portfolio
$775 million in total loan receivables as of September 30, 2017 3-year core loan receivable CAGR of 24% (Sep-14 to
Sep-17) 3-year large loan receivable CAGR of 94% (Sep-14 to Sep-17)
4
2018 & 2019: Realize the Benefits of Our Investments
Recent significant investments should accelerate top and bottom line growth in the coming years.
ï,§ With modernized infrastructure, plan to increase de novo branches in 2018
ï,§ Hybrid approach to growth: increased receivables per branch and de novo expansion
ï,§ Focus on core portfolio – small and large loans
ï,§ Digital platform will enhance existing customer engagement and experience, as well as attract new digital-oriented customers
ï,§ Strong credit function to improve the credit quality of new loans
- New credit
scorecards
- Automation of underwriting, which should significantly reduce manual errors
ï,§ Centralized collections to decrease delinquency and reduce net credit losses
-
Allows branch labor to focus on local marketing and customer sales
5
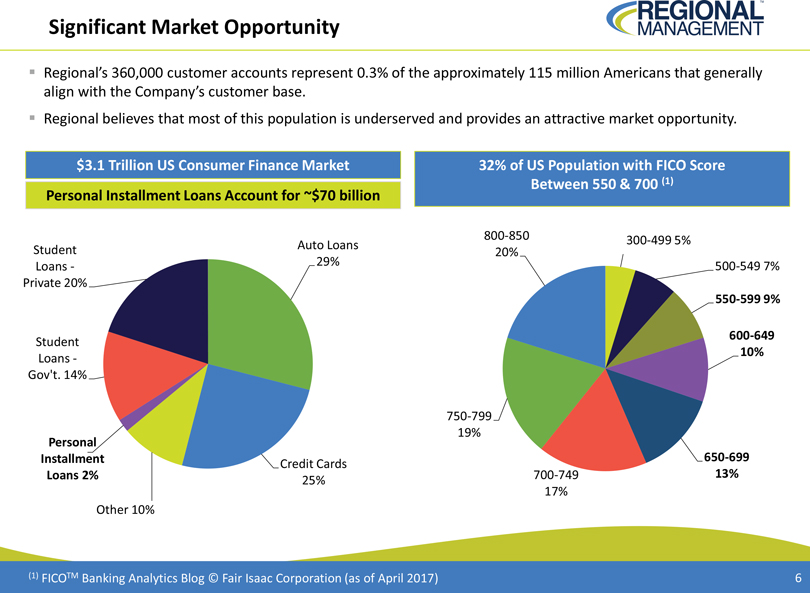
Significant Market Opportunity
Regional’s
360,000 customer accounts represent 0.3% of the approximately 115 million Americans that generally align with the Company’s customer base.
Regional
believes that most of this population is underserved and provides an attractive market opportunity.
$3.1 Trillion US Consumer Finance Market Personal Installment
Loans Account for ~$70 billion
Student Loans -Private 20%
Auto Loans 29%
Credit Cards 25%
Other 10%
Personal Installment Loans 2%
Student Loans
-Gov’t. 14%
32% of US Population with FICO Score Between 550 & 700 (1)
800-850 20%
300-499 5%
500-549 7%
550-599 9%
600-649 10%
650-699 13%
700-749 17%
750-799 19%
(1) FICOTM Banking Analytics Blog © Fair Isaac Corporation (as of April 2017)
6
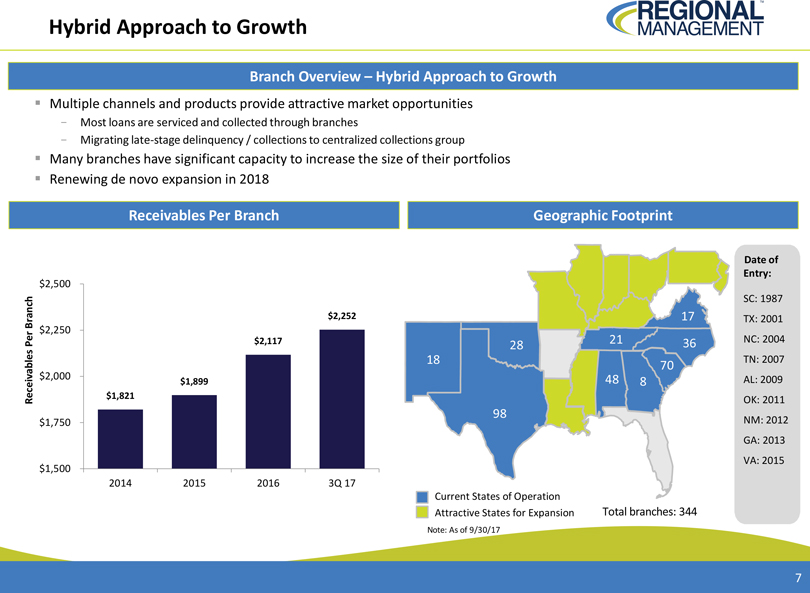
Hybrid Approach to Growth
Branch Overview –
Hybrid Approach to Growth
ï,§ Multiple channels and products provide attractive market opportunities
- Most loans are serviced and collected through branches
- Migrating late-stage delinquency /
collections to centralized collections group
ï,§ Many branches have significant capacity to increase the size of their portfoliosï,§ Renewing
de novo expansion in 2018
Receivables Per Branch
$2,500 Branch $2,252 $2,250
Per $2,117 $2,000 $1,899 Receivables $1,821 $1,750 $1,500 2014 2015 2016 3Q 17 Geographic Footprint Date of Entry: SC: 1987 17 TX: 2001 21 3617 NC: 2004 28 18 28 21 TN: 2007 70 18 48 8 AL: 2009 48 OK: 2011 98 98 NM: 2012 GA: 2013 VA: 2015 Current
States of Operation Attractive States for Expansion Total branches: 344 Note: As of 9/30/17
7
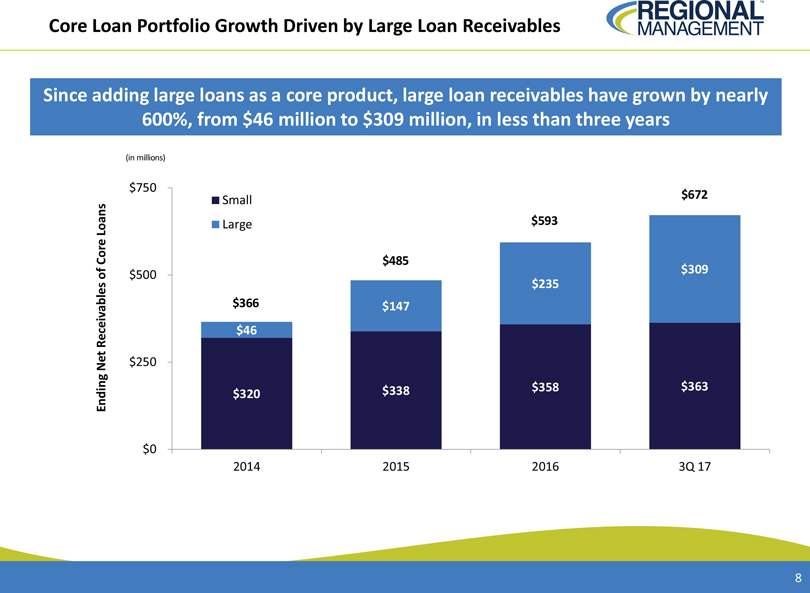
Core Loan Portfolio Growth Driven by Large Loan Receivables
Since adding large loans as a core product, large loan receivables have grown by nearly 600%, from $46 million to $309 million, in less than three years
(in millions)
$750 Small $672 Loans Large $593 Core $485 of $500 $309
$235 $366 $147 Receivables $46 Net $250 $338 $358 $363 Ending $320 $0 2014 2015 2016 3Q 17
8
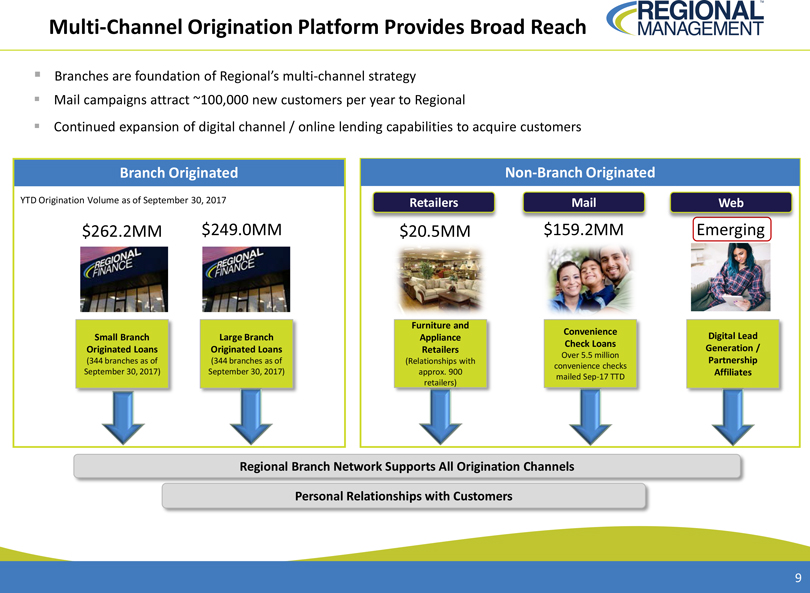
Multi-Channel Origination Platform Provides Broad Reach
ï,§ Branches are foundation of Regional’s multi-channel strategy ï,§ Mail campaigns attract ~100,000 new customers per year to Regional
ï,§ Continued expansion of digital channel / online lending capabilities to acquire customers
Branch Originated Non-Branch Originated
YTD
Origination Volume as of September 30, 2017 Retailers Mail Web
$262.2MM $249.0MM $20.5MM $159 M Em g
Furniture and
Convenience Digital Lead Small Branch Large Branch Appliance Check Loans
Generation / Originated Loans Originated Loans Retailers
Over 5.5 million Partnership (344 branches as of (344 branches as of (Relationships with convenience
checks September 30, 2017) September 30, 2017) approx. 900 Affiliates mailed Sep-17 TTD retailers)
Regional
Branch Network Supports All Origination Channels
Personal Relationships with Customers
9
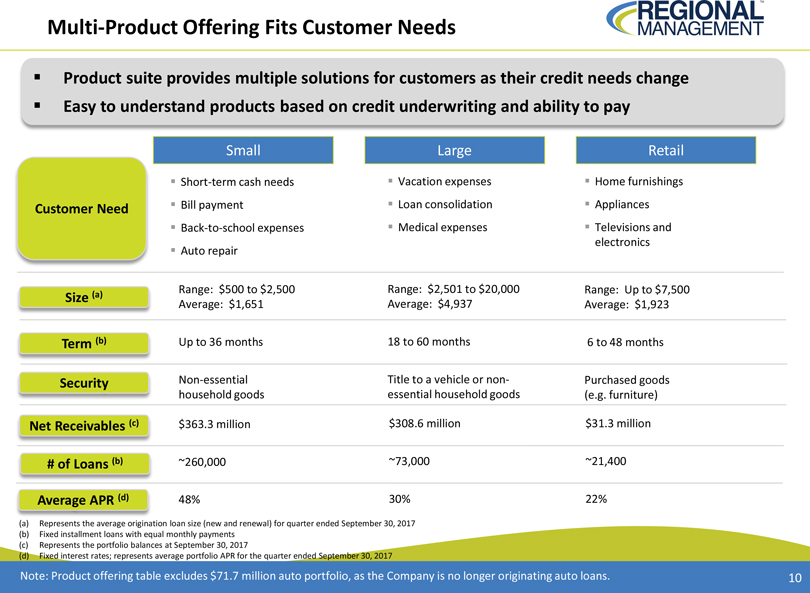
Multi-Product Offering Fits Customer Needs
ï,§ Product suite provides multiple solutions for customers as their credit needs changeï,§ Easy to understand products based on credit
underwriting and ability to pay
Small Large Retail
ï,§ Short-term
cash needsï,§ Vacation expensesï,§ Home furnishings Customer Needï,§ Bill paymentï,§ Loan consolidationï,§ Appliancesï,§
Back-to-school expensesï,§ Medical expensesï,§ Televisions and electronicsï,§ Auto repair
(a) Range: $500 to $2,500 Range: $2,501 to $20,000 Range: Up to $7,500 Size Average: $1,651 Average: $4,937 Average: $1,923
Term (b) Up to 36 months 18 to 60 months 6 to 48 months
Security Non-essential Title to a vehicle or non- Purchased goods household goods essential household goods (e.g. furniture)
Net Receivables (c) $363.3 million $308.6 million $31.3 million
# of Loans (b)
~260,000 ~73,000 ~21,400
Average APR (d) 48% 30% 22%
(a) Represents the
average origination loan size (new and renewal) for quarter ended September 30, 2017 (b) Fixed installment loans with equal monthly payments (c) Represents the portfolio balances at September 30, 2017 (d) Fixed interest rates;
represents average portfolio APR for the quarter ended September 30, 2017
Note: Product offering table excludes $71.7 million auto portfolio, as the
Company is no longer originating auto loans.
10
High Customer Satisfaction
Regional’s
“Net Promoter Score” (NPS) of 66%, which measures customer loyalty, compares favorably to other companies in financial services and in other industries.
Top-three box (8, 9, or 10 out of 10) customer satisfaction of 88%
Over 75% of customers would apply to Regional Finance first
the next time they need a loan
~90% favorable ratings for key attributes:
Loan process was quick, easy, affordable, understandable
People are
professional, responsive, respectful, knowledgeable, helpful, friendly
Customers pleased with products/services; anticipate enhancements, such as texting, online
account self-service, electronic payments, and digital lending, should increase customer satisfaction
11
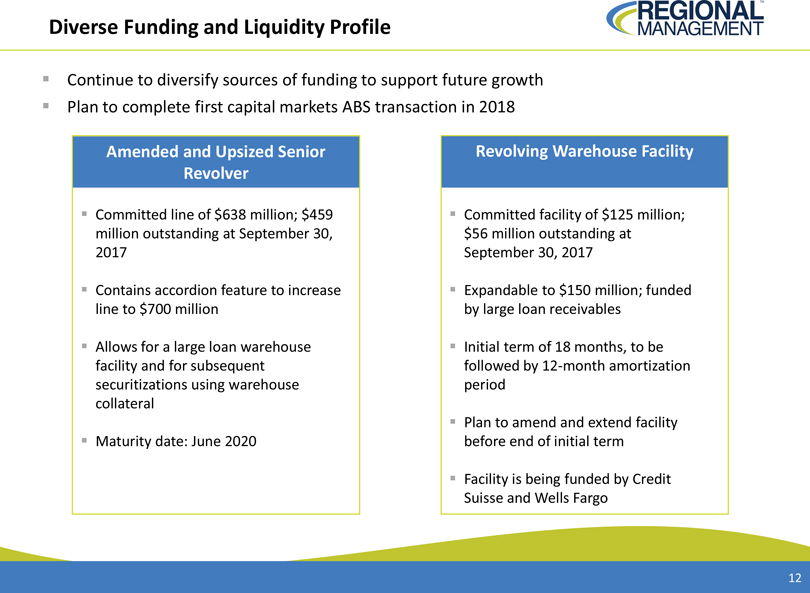
Diverse Funding and Liquidity Profile
ï,§ Continue to diversify sources of funding to support future growthï,§ Plan to complete first capital markets ABS transaction in 2018
Amended and Upsized Senior Revolver
ï,§ Committed line of
$638 million; $459 million outstanding at September 30, 2017
ï,§ Contains accordion feature to increase line to $700 million
ï,§ Allows for a large loan warehouse facility and for subsequent securitizations using warehouse collateral
ï,§ Maturity date: June 2020
Revolving Warehouse Facility
ï,§ Committed facility of $125 million; $56 million outstanding at September 30, 2017
ï,§ Expandable to $150 million; funded by large loan receivables
ï,§
Initial term of 18 months, to be followed by 12-month amortization period
ï,§ Plan to amend and extend facility
before end of initial term
ï,§ Facility is being funded by Credit Suisse and Wells Fargo
12
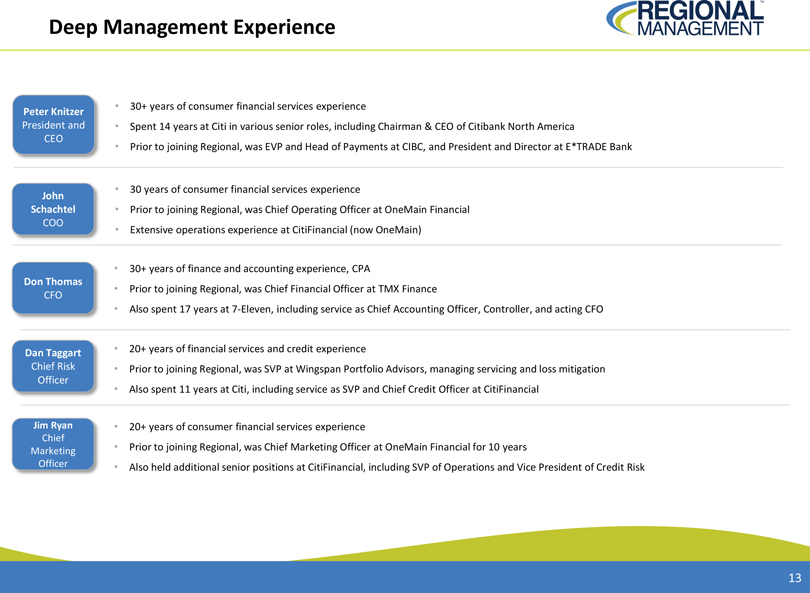
Deep Management Experience
Peter Knitzer •
30+ years of consumer financial services experience
President and • Spent 14 years at Citi in various senior roles, including Chairman & CEO of
Citibank North America CEO
• Prior to joining Regional, was EVP and Head of Payments at CIBC, and President and Director at E*TRADE Bank
• 30 years of consumer financial services experience
John
Schachtel • Prior to joining Regional, was Chief Operating Officer at OneMain Financial COO
• Extensive operations experience at CitiFinancial (now OneMain)
•
30+ years of finance and accounting experience, CPA
Don Thomas
• Prior
to joining Regional, was Chief Financial Officer at TMX Finance CFO
• Also spent 17 years at 7-Eleven, including
service as Chief Accounting Officer, Controller, and acting CFO
Dan Taggart • 20+ years of financial services and credit experience
Chief Risk • Prior to joining Regional, was SVP at Wingspan Portfolio Advisors, managing servicing and loss mitigation Officer
• Also spent 11 years at Citi, including service as SVP and Chief Credit Officer at CitiFinancial
Jim Ryan • 20+ years of consumer financial services experience
Chief
Marketing • Prior to joining Regional, was Chief Marketing Officer at OneMain Financial for 10 years
Officer • Also held additional senior positions at CitiFinancial, including SVP of Operations and Vice President of Credit Risk
13
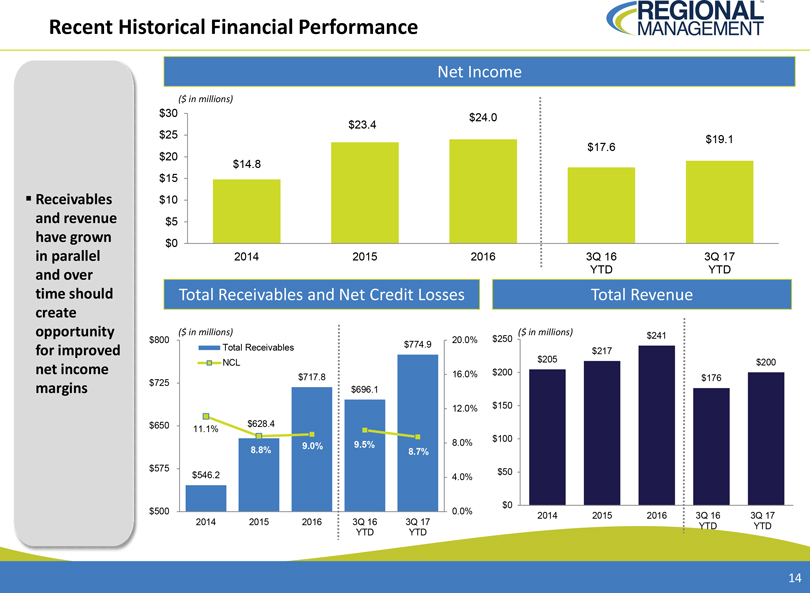
Recent Historical Financial Performance
Net Income
($ in millions)
$30 $23.4 $24.0
$25 $19.1 $17.6 $20 $14.8 $15
ï,§Receivables $10 and revenue $5 have grown $0
in parallel 2014 2015 2016 3Q 16 3Q 17
and over YTD YTD time should Total
Receivables and Net Credit Losses Total Revenue create
opportunity ($ in millions) ($ in millions) $241 $800 20.0% $250 Total Receivables $774.9
for improved $217
NCL $205 $200
net income 16.0% $200
$717.8 $176 $725
margins $696.1
12.0% $150 $650 $628.4 11.1% $100
9.0% 9.5% 8.0%
8.8% 8.7% $575 $50 $546.2 4.0%
$0 $500 0.0% 2014 2015 2016 3Q 16 3Q 17 2014 2015 2016 3Q 16 3Q 17 YTD YTD
YTD YTD
14
Investment Highlights
Attractive
Long-Term Market
Opportunity 10 Numerous Consecutive Avenues for Quarters of Additional Double-Digit Growth Receivable Growth
Deep Significantly Management Upgraded Experience Infrastructure Stable Credit Performance
15