Attached files
| file | filename |
|---|---|
| 8-K - 8-K - HollyFrontier Corp | hfc-form8xkanalystday2017.htm |
HOLLYFRONTIER
2017 ANALYST DAY
December 7, 2017

Craig Biery
Director, Investor Relations
W E L C O M E
Disclosure Statement
Statements made during the course of this presentation that are not historical facts are “forward-looking statements” within the meaning of the
U.S. Private Securities Litigation Reform Act of 1995. Forward-looking statements are inherently uncertain and necessarily involve risks that
may affect the business prospects and performance of HollyFrontier Corporation and/or Holly Energy Partners, L.P., and actual results may
differ materially from those discussed during the presentation. Such risks and uncertainties include but are not limited to risks and
uncertainties with respect to the actions of actual or potential competitive suppliers and transporters of refined petroleum products in
HollyFrontier’s and Holly Energy Partners’ markets, the demand for and supply of crude oil and refined products, the spread between market
prices for refined products and market prices for crude oil, the possibility of constraints on the transportation of refined products, the possibility
of inefficiencies or shutdowns in refinery operations or pipelines, effects of governmental regulations and policies, the availability and cost of
financing to HollyFrontier and Holly Energy Partners, the effectiveness of HollyFrontier’s and Holly Energy Partners’ capital investments and
marketing strategies, HollyFrontier's and Holly Energy Partners’ efficiency in carrying out construction projects, HollyFrontier's ability to
acquire refined product operations or pipeline and terminal operations on acceptable terms and to integrate any existing or future acquired
operations, the possibility of terrorist attacks and the consequences of any such attacks, and general economic conditions. Additional
information on risks and uncertainties that could affect the business prospects and performance of HollyFrontier and Holly Energy Partners is
provided in the most recent reports of HollyFrontier and Holly Energy Partners filed with the Securities and Exchange Commission. All
forward-looking statements included in this presentation are expressly qualified in their entirety by the foregoing cautionary statements. The
forward-looking statements speak only as of the date hereof and, other than as required by law, HollyFrontier and Holly Energy Partners
undertake no obligation to publicly update or revise any forward-looking statements, whether as a result of new information, future events or
otherwise.
3
Agenda
4
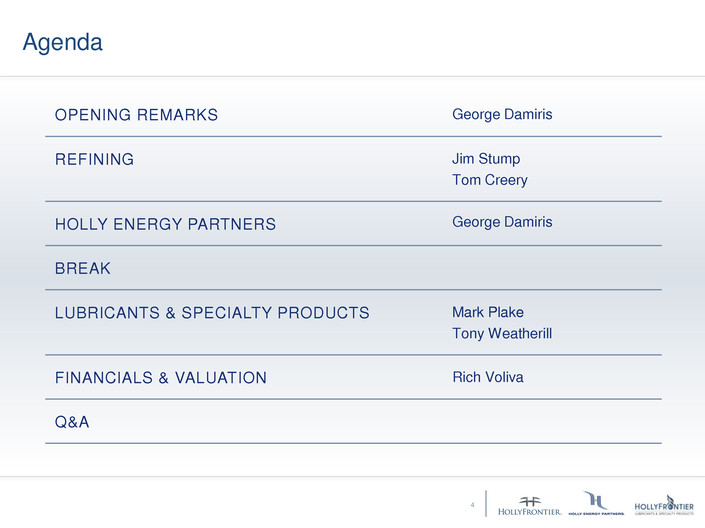
OPENING REMARKS George Damiris
REFINING Jim Stump
Tom Creery
HOLLY ENERGY PARTNERS George Damiris
BREAK
LUBRICANTS & SPECIALTY PRODUCTS Mark Plake
Tony Weatherill
FINANCIALS & VALUATION Rich Voliva
Q&A
4

George Damiris
Chief Executive Officer
O P E N I N G R E M A R K S
Mission & Values
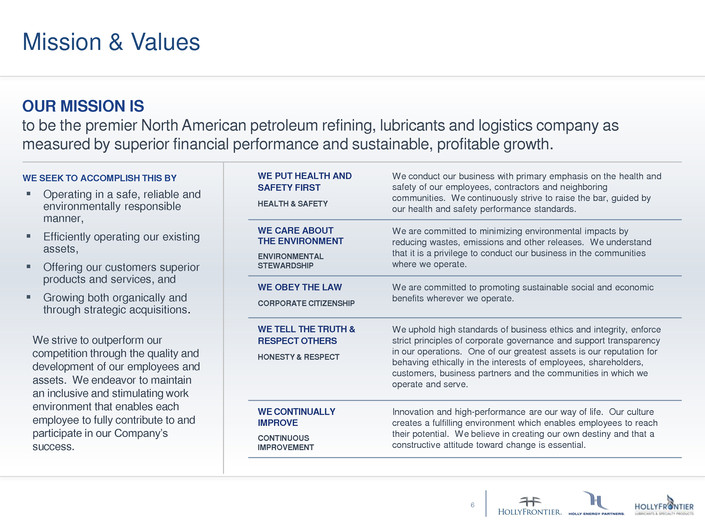
OUR MISSION IS
to be the premier North American petroleum refining, lubricants and logistics company as
measured by superior financial performance and sustainable, profitable growth.
WE PUT HEALTH AND
SAFETY FIRST
HEALTH & SAFETY
We conduct our business with primary emphasis on the health and
safety of our employees, contractors and neighboring
communities. We continuously strive to raise the bar, guided by
our health and safety performance standards.
WE CARE ABOUT
THE ENVIRONMENT
ENVIRONMENTAL
STEWARDSHIP
We are committed to minimizing environmental impacts by
reducing wastes, emissions and other releases. We understand
that it is a privilege to conduct our business in the communities
where we operate.
WE OBEY THE LAW
CORPORATE CITIZENSHIP
We are committed to promoting sustainable social and economic
benefits wherever we operate.
WE TELL THE TRUTH &
RESPECT OTHERS
HONESTY & RESPECT
We uphold high standards of business ethics and integrity, enforce
strict principles of corporate governance and support transparency
in our operations. One of our greatest assets is our reputation for
behaving ethically in the interests of employees, shareholders,
customers, business partners and the communities in which we
operate and serve.
WE CONTINUALLY
IMPROVE
CONTINUOUS
IMPROVEMENT
Innovation and high-performance are our way of life. Our culture
creates a fulfilling environment which enables employees to reach
their potential. We believe in creating our own destiny and that a
constructive attitude toward change is essential.
WE SEEK TO ACCOMPLISH THIS BY
Operating in a safe, reliable and
environmentally responsible
manner,
Efficiently operating our existing
assets,
Offering our customers superior
products and services, and
Growing both organically and
through strategic acquisitions.
We strive to outperform our
competition through the quality and
development of our employees and
assets. We endeavor to maintain
an inclusive and stimulating work
environment that enables each
employee to fully contribute to and
participate in our Company’s
success.
6
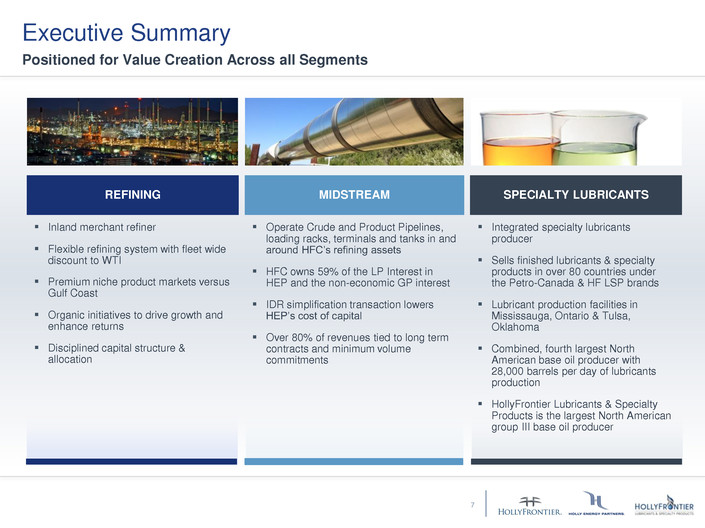
Executive Summary
Positioned for Value Creation Across all Segments
REFINING MIDSTREAM SPECIALTY LUBRICANTS
Inland merchant refiner
Flexible refining system with fleet wide
discount to WTI
Premium niche product markets versus
Gulf Coast
Organic initiatives to drive growth and
enhance returns
Disciplined capital structure &
allocation
Operate Crude and Product Pipelines,
loading racks, terminals and tanks in and
around HFC’s refining assets
HFC owns 59% of the LP Interest in
HEP and the non-economic GP interest
IDR simplification transaction lowers
HEP’s cost of capital
Over 80% of revenues tied to long term
contracts and minimum volume
commitments
Integrated specialty lubricants
producer
Sells finished lubricants & specialty
products in over 80 countries under
the Petro-Canada & HF LSP brands
Lubricant production facilities in
Mississauga, Ontario & Tulsa,
Oklahoma
Combined, fourth largest North
American base oil producer with
28,000 barrels per day of lubricants
production
HollyFrontier Lubricants & Specialty
Products is the largest North American
group III base oil producer
7
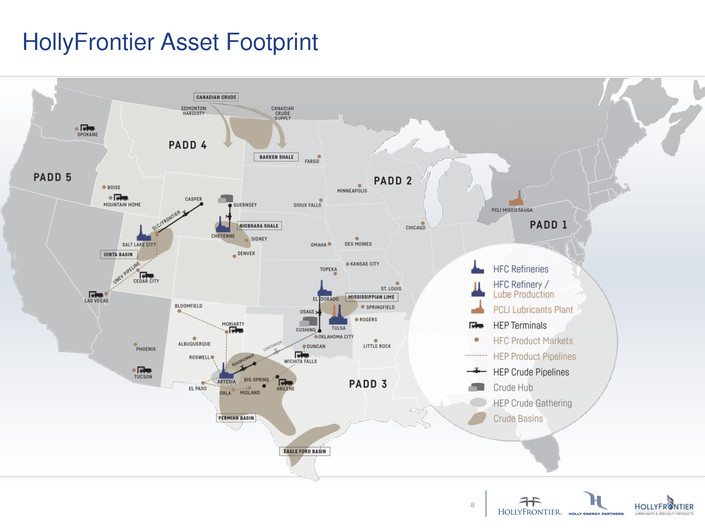
HollyFrontier Asset Footprint
8
Strategy
Safe & Reliable Operations
Value Creation Through Growth
Financial Strength & Discipline
9
R E F I N I N G : O P E R AT I O N S
Jim Stump
Senior Vice President, Refining

Health & Safety Top Priority
0.0
0.5
1.0
1.5
2012 2013 2014 2015 2016 YTD 2017
Employees Contractors
0
5
10
15
20
0.0
0.1
0.2
0.3
0.4
2012 2013 2014 2015 2016 YTD 2017
Incident Rate Incident Count
HollyFrontier Recordable Incident Rates Tier 1 Process Safety Incident Rate vs
Count
1. Total Recordable Incident Rate is the number of recordable injuries per 200,000 man hours worked
2. Tier 1 Incident Rate is the number of Tier 1 Process Safety Incidents for every 200,000 man hours worked
Total Recordable Incident Rate1 Tier 1 Incident Rate2
11
Tier 1 Incident Count
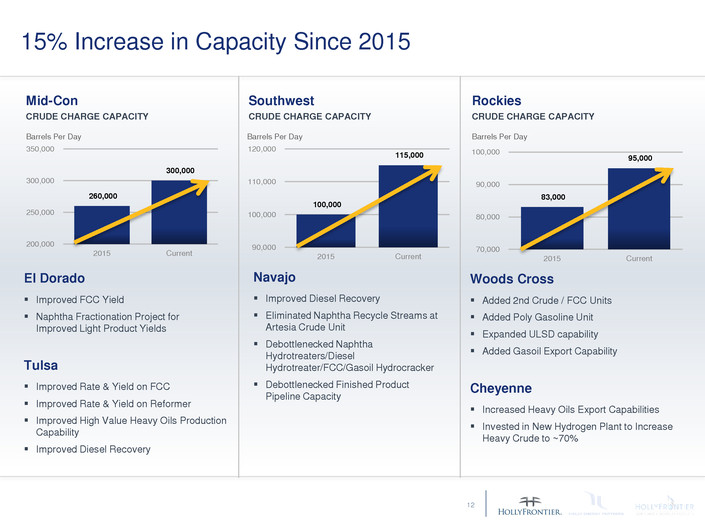
15% Increase in Capacity Since 2015
El Dorado
Improved FCC Yield
Naphtha Fractionation Project for
Improved Light Product Yields
Tulsa
Improved Rate & Yield on FCC
Improved Rate & Yield on Reformer
Improved High Value Heavy Oils Production
Capability
Improved Diesel Recovery
Navajo
Improved Diesel Recovery
Eliminated Naphtha Recycle Streams at
Artesia Crude Unit
Debottlenecked Naphtha
Hydrotreaters/Diesel
Hydrotreater/FCC/Gasoil Hydrocracker
Debottlenecked Finished Product
Pipeline Capacity
Woods Cross
Added 2nd Crude / FCC Units
Added Poly Gasoline Unit
Expanded ULSD capability
Added Gasoil Export Capability
Cheyenne
Increased Heavy Oils Export Capabilities
Invested in New Hydrogen Plant to Increase
Heavy Crude to ~70%
Mid-Con
CRUDE CHARGE CAPACITY
Rockies
CRUDE CHARGE CAPACITY
Southwest
CRUDE CHARGE CAPACITY
260,000
300,000
200,000
250,000
300,000
350,000
2015 Current
100,000
115,000
90,000
100,000
110,000
120,000
2015 Current
83,000
95,000
70,000
80,000
90,000
100,000
2015 Current
Barrels Per Day Barrels Per Day Barrels Per Day
12
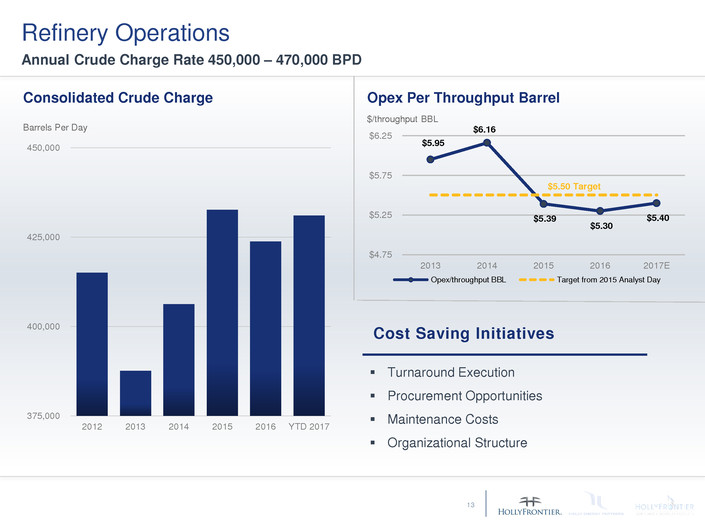
375,000
400,000
425,000
450,000
2012 2013 2014 2015 2016 YTD 2017
$5.95
$6.16
$5.39
$5.30
$5.40
$4.75
$5.25
$5.75
$6.25
2013 2014 2015 2016 2017E
Opex/throughput BBL Target from 2015 Analyst Day
Barrels Per Day
Opex Per Throughput Barrel Consolidated Crude Charge
$/throughput BBL
Cost Saving Initiatives
Turnaround Execution
Procurement Opportunities
Maintenance Costs
Organizational Structure
13
Refinery Operations
Annual Crude Charge Rate 450,000 – 470,000 BPD
$5.50 Target
R E F I N I N G : C O M M E R C I A L
Tom Creery
Senior Vice President, Commercial
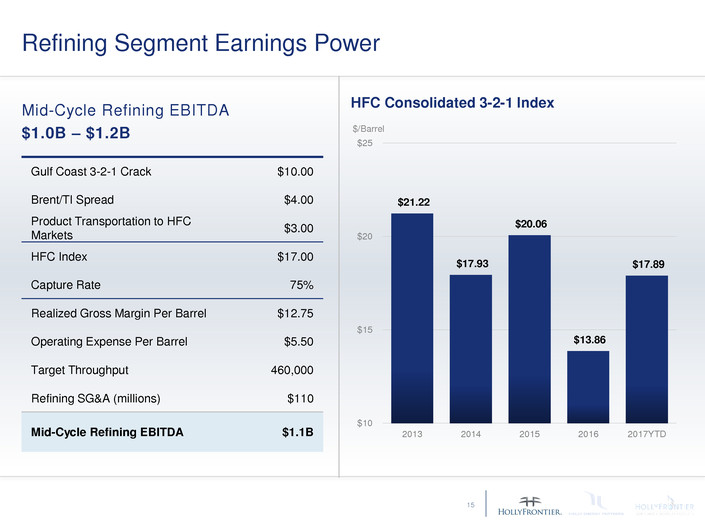
Refining Segment Earnings Power
$21.22
$17.93
$20.06
$13.86
$17.89
$10
$15
$20
$25
2013 2014 2015 2016 2017YTD
Mid-Cycle Refining EBITDA
$1.0B – $1.2B
Gulf Coast 3-2-1 Crack $10.00
Brent/TI Spread $4.00
Product Transportation to HFC
Markets
$3.00
HFC Index $17.00
Capture Rate 75%
Realized Gross Margin Per Barrel $12.75
Operating Expense Per Barrel $5.50
Target Throughput 460,000
Refining SG&A (millions) $110
Mid-Cycle Refining EBITDA $1.1B
HFC Consolidated 3-2-1 Index
$/Barrel
15
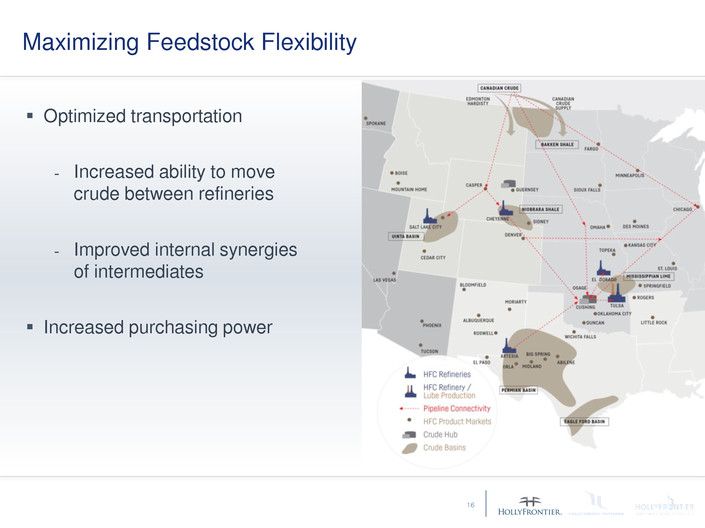
Maximizing Feedstock Flexibility
Optimized transportation
- Increased ability to move
crude between refineries
- Improved internal synergies
of intermediates
Increased purchasing power
16
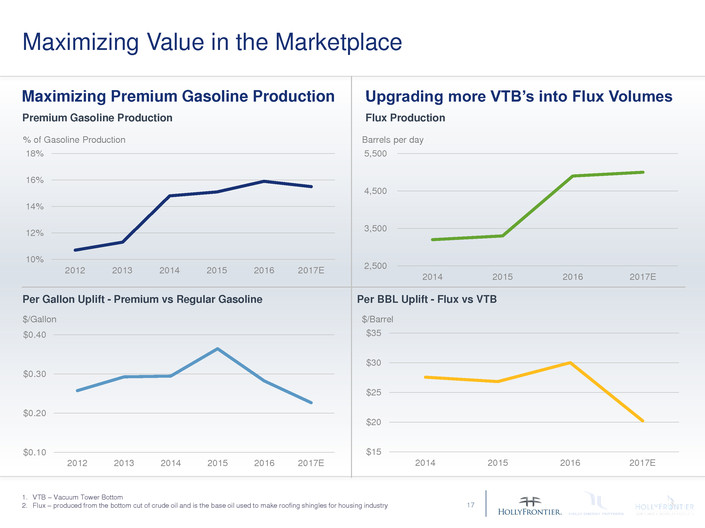
Maximizing Value in the Marketplace
17
10%
12%
14%
16%
18%
2012 2013 2014 2015 2016 2017E
Maximizing Premium Gasoline Production
$0.10
$0.20
$0.30
$0.40
2012 2013 2014 2015 2016 2017E
Upgrading more VTB’s into Flux Volumes
2,500
3,500
4,500
5,500
2014 2015 2016 2017E
$15
$20
$25
$30
$35
2014 2015 2016 2017E
Premium Gasoline Production Flux Production
Per BBL Uplift - Flux vs VTB Per Gallon Uplift - Premium vs Regular Gasoline
% of Gasoline Production Barrels per day
$/Barrel $/Gallon
1. VTB – Vacuum Tower Bottom
2. Flux – produced from the bottom cut of crude oil and is the base oil used to make roofing shingles for housing industry
H O L LY E N E R G Y
PA RT N E R S
George Damiris
Chief Executive Officer
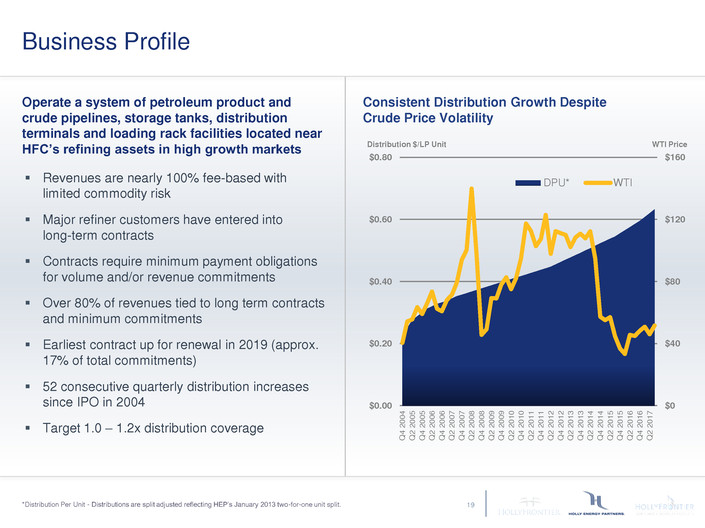
Operate a system of petroleum product and
crude pipelines, storage tanks, distribution
terminals and loading rack facilities located near
HFC’s refining assets in high growth markets
Revenues are nearly 100% fee-based with
limited commodity risk
Major refiner customers have entered into
long-term contracts
Contracts require minimum payment obligations
for volume and/or revenue commitments
Over 80% of revenues tied to long term contracts
and minimum commitments
Earliest contract up for renewal in 2019 (approx.
17% of total commitments)
52 consecutive quarterly distribution increases
since IPO in 2004
Target 1.0 – 1.2x distribution coverage
*Distribution Per Unit - Distributions are split adjusted reflecting HEP’s January 2013 two-for-one unit split.
Business Profile
$0
$40
$80
$120
$160
$0.00
$0.20
$0.40
$0.60
$0.80
Q
4
2
0
0
4
Q
2
2
0
0
5
Q
4
2
0
0
5
Q
2
2
0
0
6
Q
4
2
0
0
6
Q
2
2
0
0
7
Q
4
2
0
0
7
Q
2
2
0
0
8
Q
4
2
0
0
8
Q
2
2
0
0
9
Q
4
2
0
0
9
Q
2
2
0
1
0
Q
4
2
0
1
0
Q
2
2
0
1
1
Q
4
2
0
1
1
Q
2
2
0
1
2
Q
4
2
0
1
2
Q
2
2
0
1
3
Q
4
2
0
1
3
Q
2
2
0
1
4
Q
4
2
0
1
4
Q
2
2
0
1
5
Q
4
2
0
1
5
Q
2
2
0
1
6
Q
4
2
0
1
6
Q
2
2
0
1
7
DPU* WTI
Consistent Distribution Growth Despite
Crude Price Volatility
WTI Price Distribution $/LP Unit
19
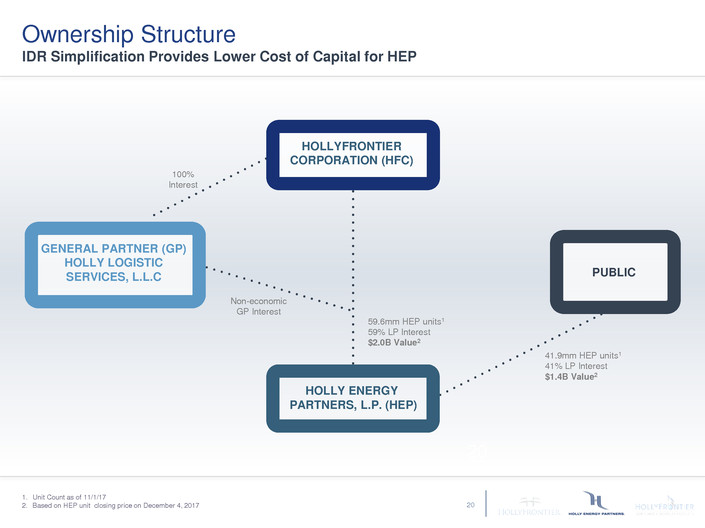
1. Unit Count as of 11/1/17
2. Based on HEP unit closing price on December 4, 2017
20
100%
Interest
41.9mm HEP units1
41% LP Interest
$1.4B Value2
59.6mm HEP units1
59% LP Interest
$2.0B Value2
HOLLYFRONTIER
CORPORATION (HFC)
GENERAL PARTNER (GP)
HOLLY LOGISTIC
SERVICES, L.L.C
HOLLY ENERGY
PARTNERS, L.P. (HEP)
PUBLIC
Non-economic
GP Interest
Ownership Structure
IDR Simplification Provides Lower Cost of Capital for HEP
20
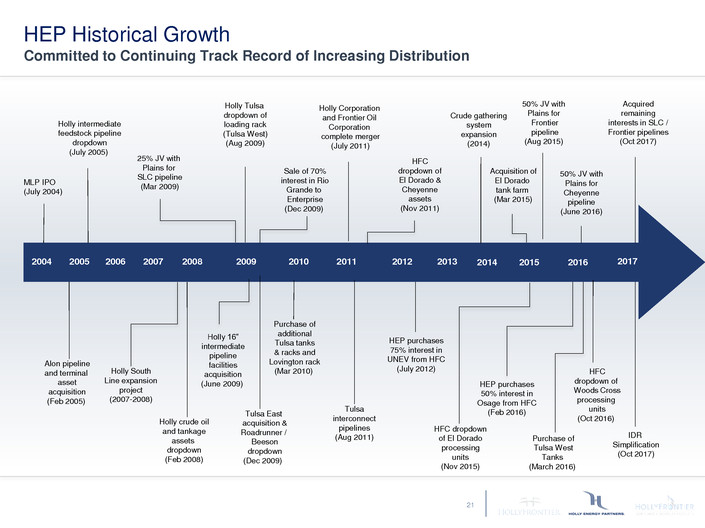
2004 2005 2006 2007 2008 2009
MLP IPO
(July 2004)
Holly intermediate
feedstock pipeline
dropdown
(July 2005)
25% JV with
Plains for
SLC pipeline
(Mar 2009)
Holly Tulsa
dropdown of
loading rack
(Tulsa West)
(Aug 2009)
Holly crude oil
and tankage
assets
dropdown
(Feb 2008)
Alon pipeline
and terminal
asset
acquisition
(Feb 2005)
Holly 16”
intermediate
pipeline
facilities
acquisition
(June 2009)
Tulsa East
acquisition &
Roadrunner /
Beeson
dropdown
(Dec 2009)
Sale of 70%
interest in Rio
Grande to
Enterprise
(Dec 2009)
2010
Purchase of
additional
Tulsa tanks
& racks and
Lovington rack
(Mar 2010)
2011
HFC
dropdown of
El Dorado &
Cheyenne
assets
(Nov 2011)
Holly South
Line expansion
project
(2007-2008)
Holly Corporation
and Frontier Oil
Corporation
complete merger
(July 2011)
2012
HEP purchases
75% interest in
UNEV from HFC
(July 2012)
Tulsa
interconnect
pipelines
(Aug 2011)
2013
Crude gathering
system
expansion
(2014)
2014 2015 2016 2017
Acquired
remaining
interests in SLC /
Frontier pipelines
(Oct 2017)
IDR
Simplification
(Oct 2017)
Purchase of
Tulsa West
Tanks
(March 2016)
HFC dropdown
of El Dorado
processing
units
(Nov 2015)
50% JV with
Plains for
Frontier
pipeline
(Aug 2015)
50% JV with
Plains for
Cheyenne
pipeline
(June 2016)
HFC
dropdown of
Woods Cross
processing
units
(Oct 2016)
Acquisition of
El Dorado
tank farm
(Mar 2015)
HEP Historical Growth
Committed to Continuing Track Record of Increasing Distribution
HEP purchases
50% interest in
Osage from HFC
(Feb 2016)
21
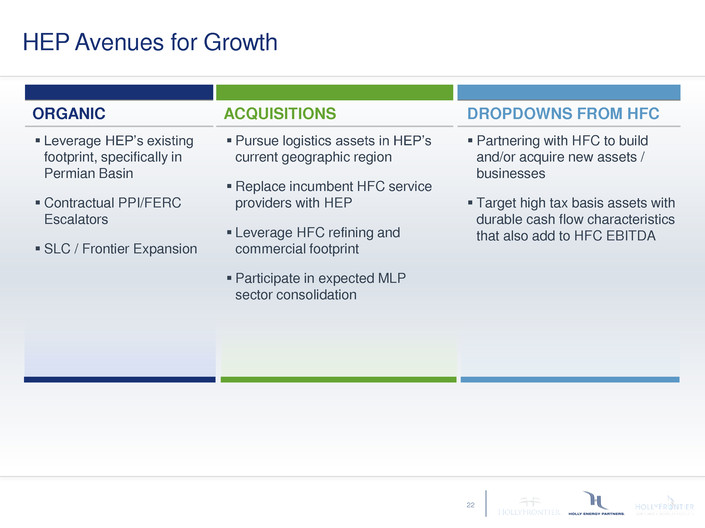
HEP Avenues for Growth
ORGANIC ACQUISITIONS DROPDOWNS FROM HFC
Leverage HEP’s existing
footprint, specifically in
Permian Basin
Contractual PPI/FERC
Escalators
SLC / Frontier Expansion
Pursue logistics assets in HEP’s
current geographic region
Replace incumbent HFC service
providers with HEP
Leverage HFC refining and
commercial footprint
Participate in expected MLP
sector consolidation
Partnering with HFC to build
and/or acquire new assets /
businesses
Target high tax basis assets with
durable cash flow characteristics
that also add to HFC EBITDA
22

B R E A K

H F L U B R I C A N T S &
S P E C I A LT Y P R O D U C T S
Mark Plake
President
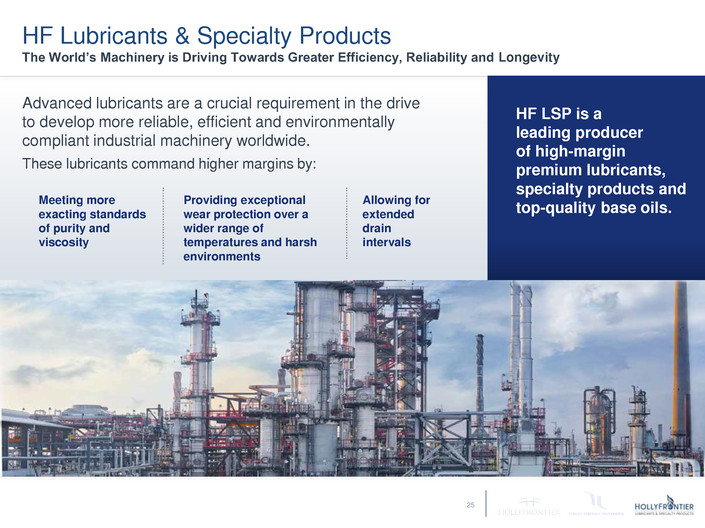
Advanced lubricants are a crucial requirement in the drive
to develop more reliable, efficient and environmentally
compliant industrial machinery worldwide.
These lubricants command higher margins by:
HF Lubricants & Specialty Products
The World’s Machinery is Driving Towards Greater Efficiency, Reliability and Longevity
Meeting more
exacting standards
of purity and
viscosity
Providing exceptional
wear protection over a
wider range of
temperatures and harsh
environments
Allowing for
extended
drain
intervals
HF LSP is a
leading producer
of high-margin
premium lubricants,
specialty products and
top-quality base oils.
25
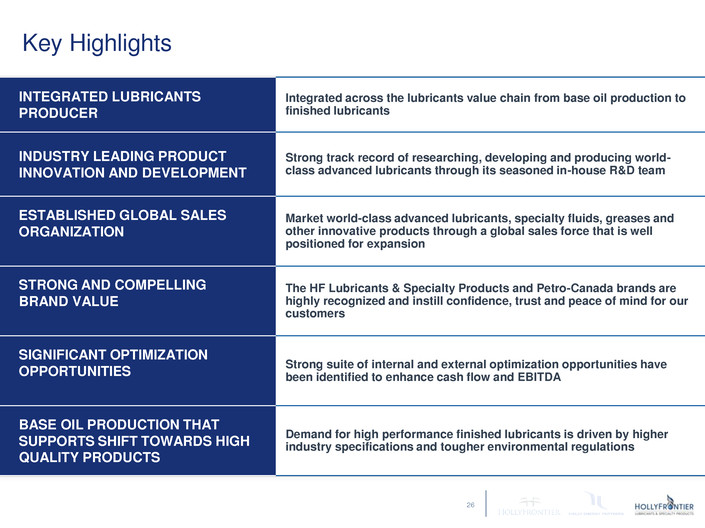
Key Highlights
INTEGRATED LUBRICANTS
PRODUCER
Integrated across the lubricants value chain from base oil production to
finished lubricants
INDUSTRY LEADING PRODUCT
INNOVATION AND DEVELOPMENT
Strong track record of researching, developing and producing world-
class advanced lubricants through its seasoned in-house R&D team
ESTABLISHED GLOBAL SALES
ORGANIZATION
Market world-class advanced lubricants, specialty fluids, greases and
other innovative products through a global sales force that is well
positioned for expansion
STRONG AND COMPELLING
BRAND VALUE
The HF Lubricants & Specialty Products and Petro-Canada brands are
highly recognized and instill confidence, trust and peace of mind for our
customers
SIGNIFICANT OPTIMIZATION
OPPORTUNITIES
Strong suite of internal and external optimization opportunities have
been identified to enhance cash flow and EBITDA
BASE OIL PRODUCTION THAT
SUPPORTS SHIFT TOWARDS HIGH
QUALITY PRODUCTS
Demand for high performance finished lubricants is driven by higher
industry specifications and tougher environmental regulations
26
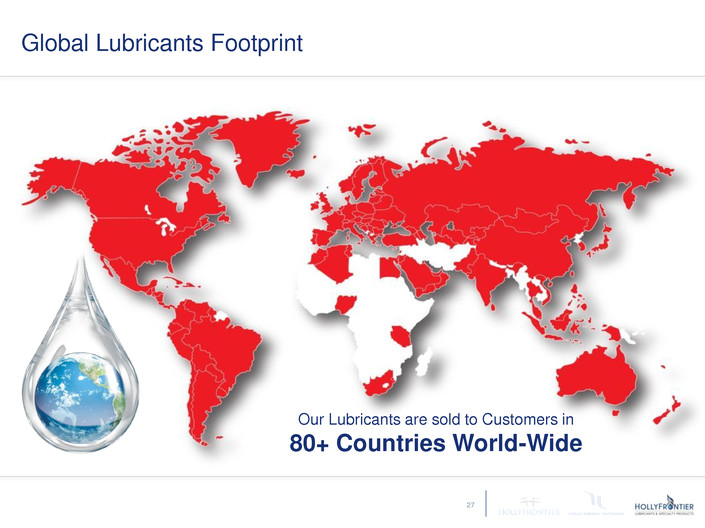
Global Lubricants Footprint
Our Lubricants are sold to Customers in
80+ Countries World-Wide
27
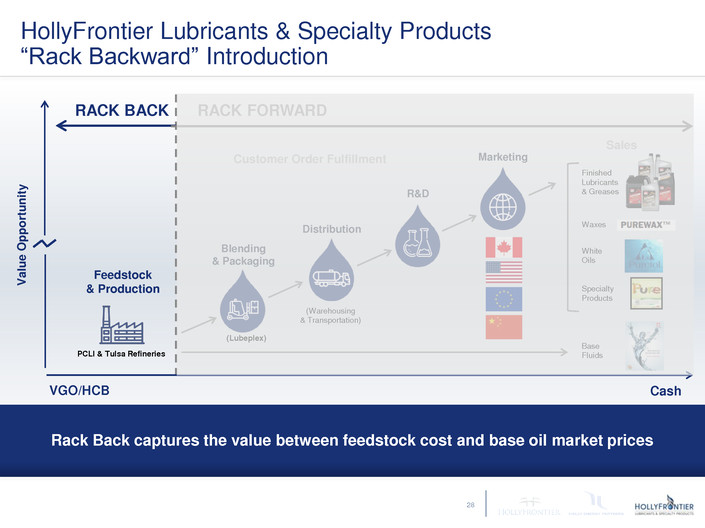
V
a
lu
e
O
p
p
ortu
n
it
y
PCLI & Tulsa Refineries
(Lubeplex)
(Warehousing
& Transportation)
Feedstock
& Production
Blending
& Packaging
RACK BACK
Marketing
Distribution
R&D
RACK FORWARD
VGO/HCB Cash
HollyFrontier Lubricants & Specialty Products
“Rack Backward” Introduction
Base
Fluids
White
Oils
Specialty
Products
Waxes
Finished
Lubricants
& Greases
Rack Back captures the value between feedstock cost and base oil market prices
Customer Order Fulfillment
Sales
28
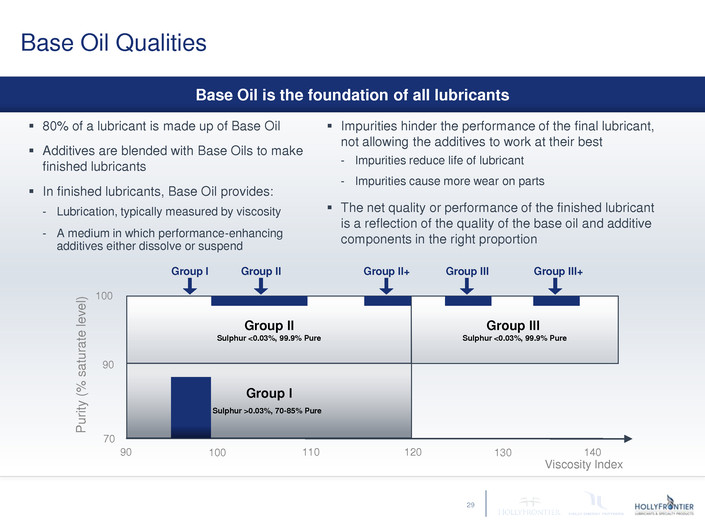
Base Oil Qualities
80% of a lubricant is made up of Base Oil
Additives are blended with Base Oils to make
finished lubricants
In finished lubricants, Base Oil provides:
- Lubrication, typically measured by viscosity
- A medium in which performance-enhancing
additives either dissolve or suspend
P
uri
ty
(
%
s
at
u
rat
e
le
v
e
l)
70
90
100
Viscosity Index
90 100 110 120 130
Group II
Sulphur <0.03%, 99.9% Pure
Group I
Sulphur >0.03%, 70-85% Pure
Group III
Sulphur <0.03%, 99.9% Pure
140
Group I Group II Group II+ Group III Group III+
Impurities hinder the performance of the final lubricant,
not allowing the additives to work at their best
- Impurities reduce life of lubricant
- Impurities cause more wear on parts
The net quality or performance of the finished lubricant
is a reflection of the quality of the base oil and additive
components in the right proportion
Base Oil is the foundation of all lubricants
29
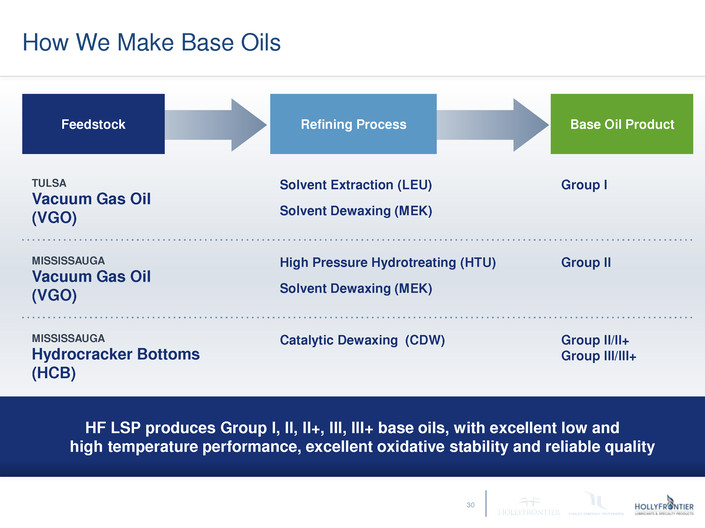
How We Make Base Oils
HF LSP produces Group I, II, II+, III, III+ base oils, with excellent low and
high temperature performance, excellent oxidative stability and reliable quality
Feedstock Refining Process Base Oil Product
TULSA
Vacuum Gas Oil
(VGO)
Solvent Extraction (LEU)
Solvent Dewaxing (MEK)
Group I
MISSISSAUGA
Vacuum Gas Oil
(VGO)
High Pressure Hydrotreating (HTU)
Solvent Dewaxing (MEK)
Group II
MISSISSAUGA
Hydrocracker Bottoms
(HCB)
Catalytic Dewaxing (CDW) Group II/II+
Group III/III+
30
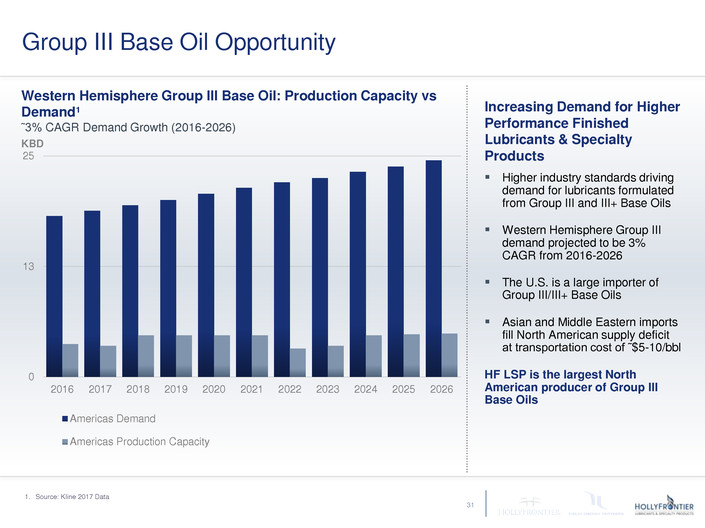
Group III Base Oil Opportunity
Increasing Demand for Higher
Performance Finished
Lubricants & Specialty
Products
Higher industry standards driving
demand for lubricants formulated
from Group III and III+ Base Oils
Western Hemisphere Group III
demand projected to be 3%
CAGR from 2016-2026
The U.S. is a large importer of
Group III/III+ Base Oils
Asian and Middle Eastern imports
fill North American supply deficit
at transportation cost of ˜$5-10/bbl
HF LSP is the largest North
American producer of Group III
Base Oils
Western Hemisphere Group III Base Oil: Production Capacity vs
Demand¹
˜3% CAGR Demand Growth (2016-2026)
1. Source: Kline 2017 Data
0
13
25
2016 2017 2018 2019 2020 2021 2022 2023 2024 2025 2026
Americas Demand
Americas Production Capacity
31
KBD
F I N I S H E D L U B R I C A N T S
& S P E C I A LT Y P R O D U C T S
Tony Weatherill
Managing Director of Marketing, Research and Development
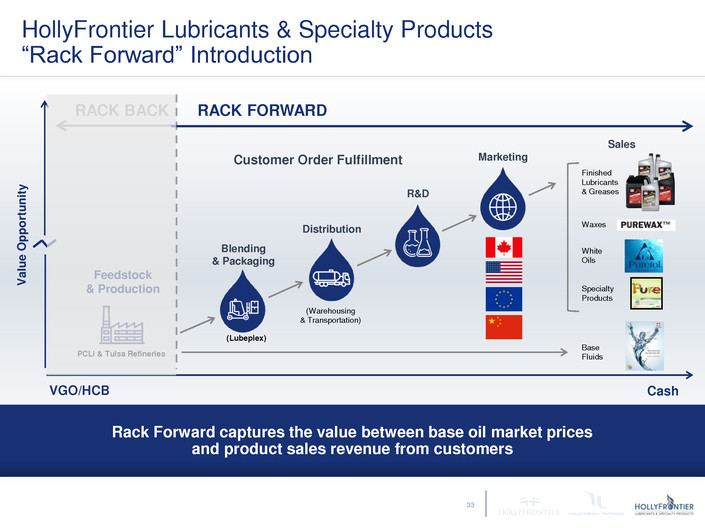
Rack Forward captures the value between base oil market prices
and product sales revenue from customers
V
a
lu
e
O
p
p
ortu
n
it
y
PCLI & Tulsa Refineries
(Lubeplex)
(Warehousing
& Transportation)
Feedstock
& Production
Blending
& Packaging
RACK BACK
Marketing
Distribution
R&D
Customer Order Fulfillment
RACK FORWARD
VGO/HCB Cash
Sales
Base
Fluids
White
Oils
Specialty
Products
Waxes
Finished
Lubricants
& Greases
HollyFrontier Lubricants & Specialty Products
“Rack Forward” Introduction
33
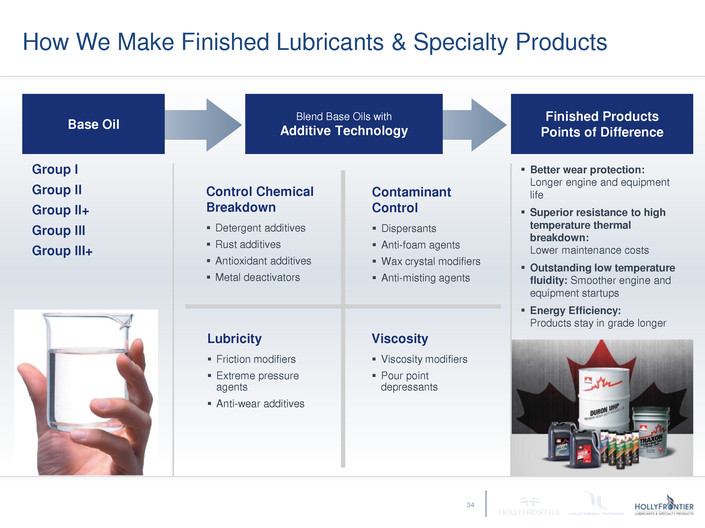
Better wear protection:
Longer engine and equipment
life
Superior resistance to high
temperature thermal
breakdown:
Lower maintenance costs
Outstanding low temperature
fluidity: Smoother engine and
equipment startups
Energy Efficiency:
Products stay in grade longer
Group I
Group II
Group II+
Group III
Group III+
How We Make Finished Lubricants & Specialty Products
Base Oil
Blend Base Oils with
Additive Technology
Finished Products
Points of Difference
Control Chemical
Breakdown
Detergent additives
Rust additives
Antioxidant additives
Metal deactivators
Lubricity
Friction modifiers
Extreme pressure
agents
Anti-wear additives
Contaminant
Control
Dispersants
Anti-foam agents
Wax crystal modifiers
Anti-misting agents
Viscosity
Viscosity modifiers
Pour point
depressants
34
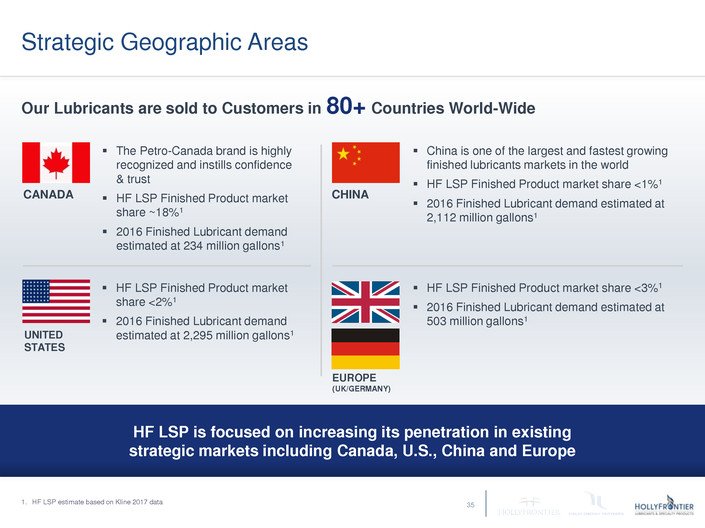
Our Lubricants are sold to Customers in 80+ Countries World-Wide
CANADA
HF LSP Finished Product market
share <2%1
2016 Finished Lubricant demand
estimated at 2,295 million gallons1
HF LSP Finished Product market share <3%1
2016 Finished Lubricant demand estimated at
503 million gallons1
China is one of the largest and fastest growing
finished lubricants markets in the world
HF LSP Finished Product market share <1%1
2016 Finished Lubricant demand estimated at
2,112 million gallons1
The Petro-Canada brand is highly
recognized and instills confidence
& trust
HF LSP Finished Product market
share ~18%1
2016 Finished Lubricant demand
estimated at 234 million gallons1
Strategic Geographic Areas
UNITED
STATES
EUROPE
(UK/GERMANY)
CHINA
HF LSP is focused on increasing its penetration in existing
strategic markets including Canada, U.S., China and Europe
1. HF LSP estimate based on Kline 2017 data 35
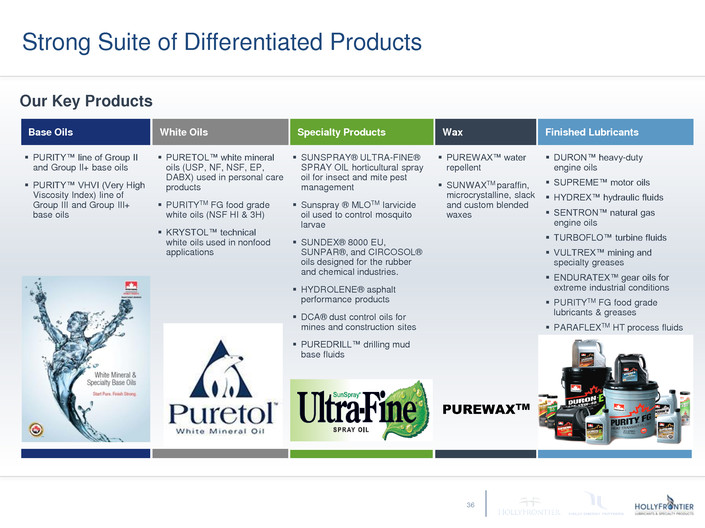
SUNSPRAY® ULTRA-FINE®
SPRAY OIL horticultural spray
oil for insect and mite pest
management
Sunspray ® MLOTM larvicide
oil used to control mosquito
larvae
SUNDEX® 8000 EU,
SUNPAR®, and CIRCOSOL®
oils designed for the rubber
and chemical industries.
HYDROLENE® asphalt
performance products
DCA® dust control oils for
mines and construction sites
PUREDRILL™ drilling mud
base fluids
Specialty Products
PURETOL™ white mineral
oils (USP, NF, NSF, EP,
DABX) used in personal care
products
PURITYTM FG food grade
white oils (NSF HI & 3H)
KRYSTOL™ technical
white oils used in nonfood
applications
White Oils
PURITY™ line of Group II
and Group II+ base oils
PURITY™ VHVI (Very High
Viscosity Index) line of
Group III and Group III+
base oils
Base Oils
Strong Suite of Differentiated Products
Our Key Products
PUREWAX™ water
repellent
SUNWAXTM paraffin,
microcrystalline, slack
and custom blended
waxes
DURON™ heavy-duty
engine oils
SUPREME™ motor oils
HYDREX™ hydraulic fluids
SENTRON™ natural gas
engine oils
TURBOFLO™ turbine fluids
VULTREX™ mining and
specialty greases
ENDURATEX™ gear oils for
extreme industrial conditions
PURITYTM FG food grade
lubricants & greases
PARAFLEXTM HT process fluids
Finished Lubricants Wax
36
PUREWAXTM
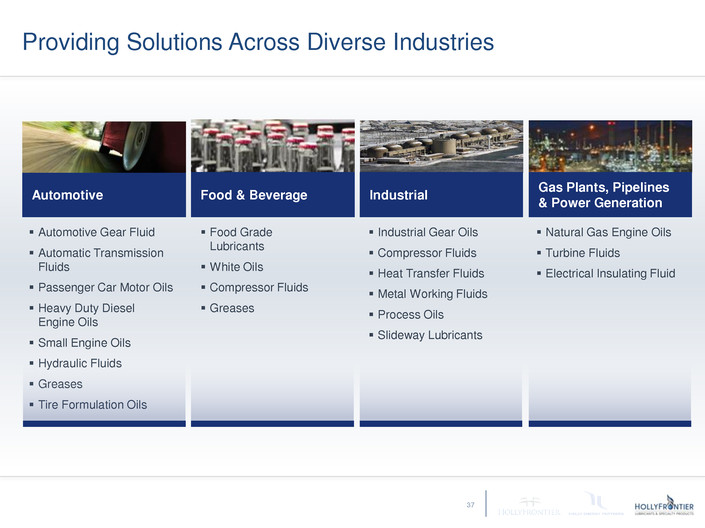
Automotive Gear Fluid
Automatic Transmission
Fluids
Passenger Car Motor Oils
Heavy Duty Diesel
Engine Oils
Small Engine Oils
Hydraulic Fluids
Greases
Tire Formulation Oils
Food Grade
Lubricants
White Oils
Compressor Fluids
Greases
Industrial Gear Oils
Compressor Fluids
Heat Transfer Fluids
Metal Working Fluids
Process Oils
Slideway Lubricants
Natural Gas Engine Oils
Turbine Fluids
Electrical Insulating Fluid
Providing Solutions Across Diverse Industries
Automotive Food & Beverage Industrial
Gas Plants, Pipelines
& Power Generation
37
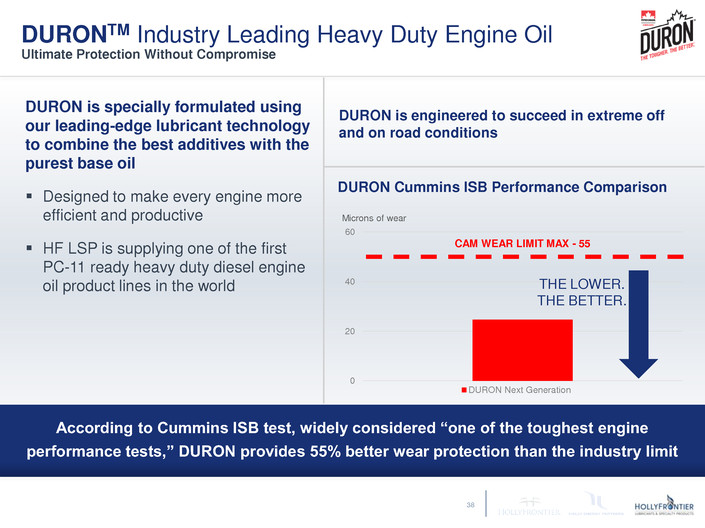
According to Cummins ISB test, widely considered “one of the toughest engine
performance tests,” DURON provides 55% better wear protection than the industry limit
DURON is specially formulated using
our leading-edge lubricant technology
to combine the best additives with the
purest base oil
Designed to make every engine more
efficient and productive
HF LSP is supplying one of the first
PC-11 ready heavy duty diesel engine
oil product lines in the world
DURON is engineered to succeed in extreme off
and on road conditions
DURONTM Industry Leading Heavy Duty Engine Oil
Ultimate Protection Without Compromise
38
0
20
40
60
DURON Next Generation
CAM WEAR LIMIT MAX - 55
THE LOWER.
THE BETTER.
Microns of wear
DURON Cummins ISB Performance Comparison
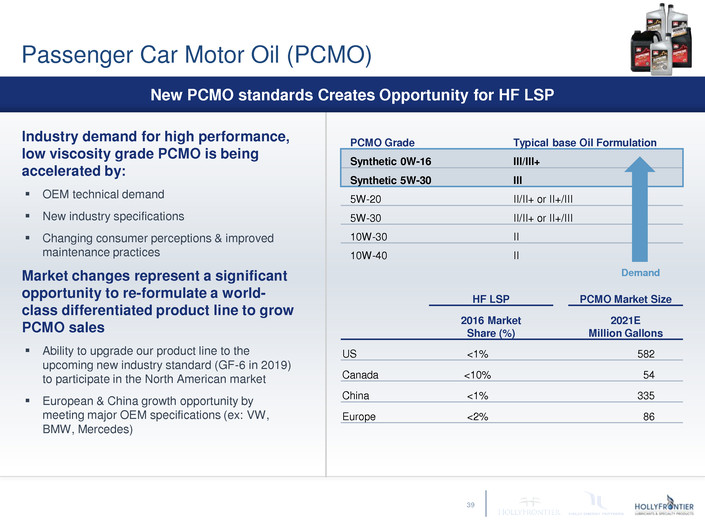
PCMO Grade Typical base Oil Formulation
Synthetic 0W-16 III/III+
Synthetic 5W-30 III
5W-20 II/II+ or II+/III
5W-30 II/II+ or II+/III
10W-30 II
10W-40 II
Passenger Car Motor Oil (PCMO)
Industry demand for high performance,
low viscosity grade PCMO is being
accelerated by:
OEM technical demand
New industry specifications
Changing consumer perceptions & improved
maintenance practices
Market changes represent a significant
opportunity to re-formulate a world-
class differentiated product line to grow
PCMO sales
Ability to upgrade our product line to the
upcoming new industry standard (GF-6 in 2019)
to participate in the North American market
European & China growth opportunity by
meeting major OEM specifications (ex: VW,
BMW, Mercedes)
Demand
HF LSP PCMO Market Size
2016 Market
Share (%)
2021E
Million Gallons
US <1% 582
Canada <10% 54
China <1% 335
Europe <2% 86
39
New PCMO standards Creates Opportunity for HF LSP
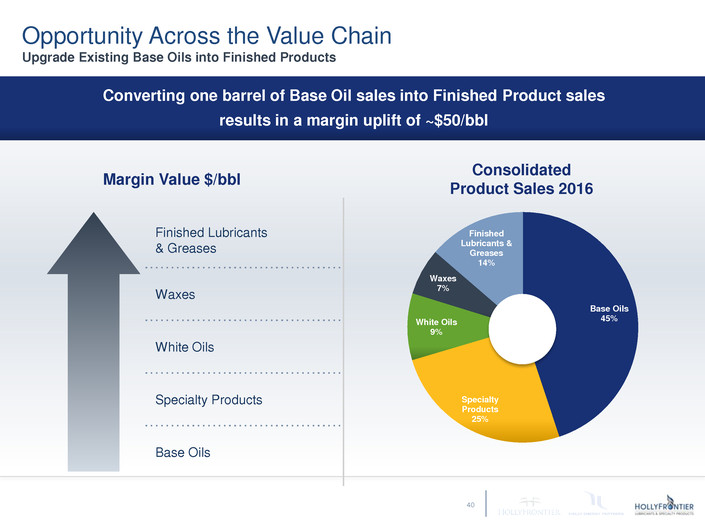
Base Oils
45%
Specialty
Products
25%
White Oils
9%
Waxes
7%
Finished
Lubricants &
Greases
14%
Consolidated
Product Sales 2016
Finished Lubricants
& Greases
Waxes
White Oils
Specialty Products
Base Oils
Margin Value $/bbl
Converting one barrel of Base Oil sales into Finished Product sales
results in a margin uplift of ~$50/bbl
40
Opportunity Across the Value Chain
Upgrade Existing Base Oils into Finished Products

F I N A N C I A L S &
VA L U AT I O N
Rich Voliva
Chief Financial Officer
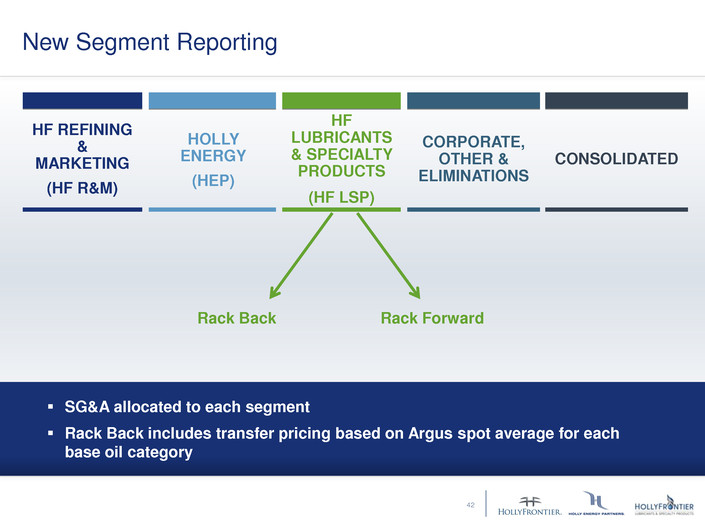
New Segment Reporting
Rack Back Rack Forward
HF REFINING
&
MARKETING
(HF R&M)
HOLLY
ENERGY
(HEP)
HF
LUBRICANTS
& SPECIALTY
PRODUCTS
(HF LSP)
CORPORATE,
OTHER &
ELIMINATIONS
CONSOLIDATED
SG&A allocated to each segment
Rack Back includes transfer pricing based on Argus spot average for each
base oil category
42
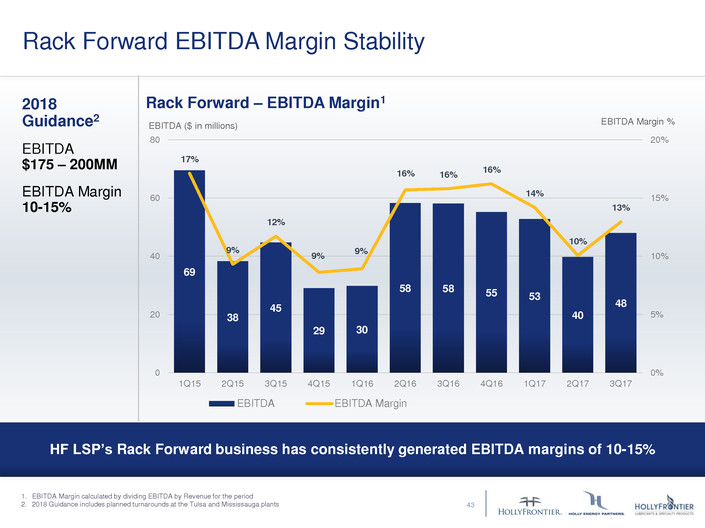
Rack Forward EBITDA Margin Stability
69
38
45
29 30
58 58 55 53
40
48
17%
9%
12%
9%
9%
16% 16%
16%
14%
10%
13%
0%
5%
10%
15%
20%
0
20
40
60
80
1Q15 2Q15 3Q15 4Q15 1Q16 2Q16 3Q16 4Q16 1Q17 2Q17 3Q17
EBITDA EBITDA Margin
Rack Forward – EBITDA Margin1 2018
Guidance2
EBITDA
$175 – 200MM
EBITDA Margin
10-15%
1. EBITDA Margin calculated by dividing EBITDA by Revenue for the period
2. 2018 Guidance includes planned turnarounds at the Tulsa and Mississauga plants
HF LSP’s Rack Forward business has consistently generated EBITDA margins of 10-15%
EBITDA Margin % EBITDA ($ in millions)
43
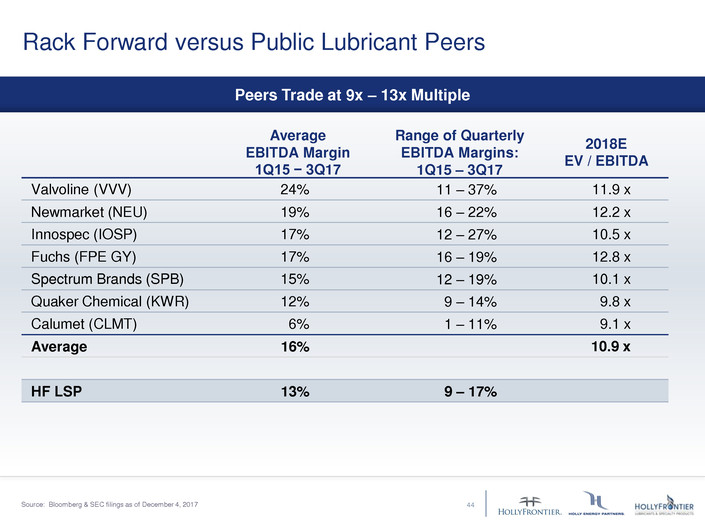
Rack Forward versus Public Lubricant Peers
Average
EBITDA Margin
1Q15 − 3Q17
Range of Quarterly
EBITDA Margins:
1Q15 – 3Q17
2018E
EV / EBITDA
Valvoline (VVV) 24% 11 – 37% 11.9 x
Newmarket (NEU) 19% 16 – 22% 12.2 x
Innospec (IOSP) 17% 12 – 27% 10.5 x
Fuchs (FPE GY) 17% 16 – 19% 12.8 x
Spectrum Brands (SPB) 15% 12 – 19% 10.1 x
Quaker Chemical (KWR) 12% 9 – 14% 9.8 x
Calumet (CLMT) 6% 1 – 11% 9.1 x
Average 16% 10.9 x
HF LSP 13% 9 – 17%
Source: Bloomberg & SEC filings as of December 4, 2017 44
Peers Trade at 9x – 13x Multiple
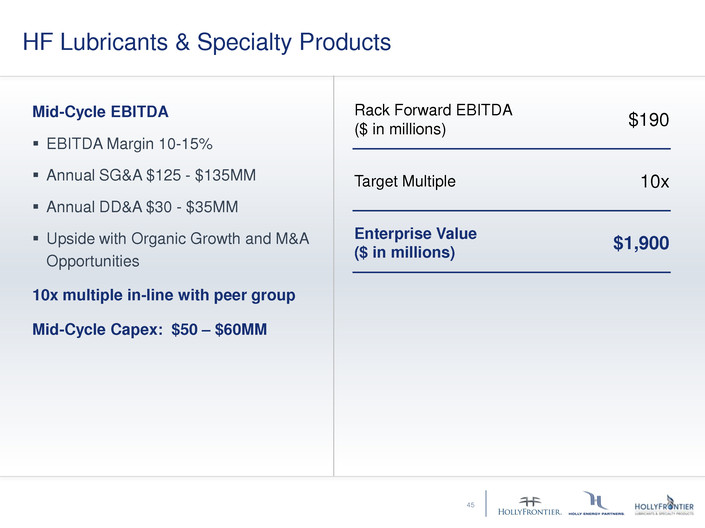
HF Lubricants & Specialty Products
Mid-Cycle EBITDA
EBITDA Margin 10-15%
Annual SG&A $125 - $135MM
Annual DD&A $30 - $35MM
Upside with Organic Growth and M&A
Opportunities
10x multiple in-line with peer group
Mid-Cycle Capex: $50 – $60MM
Rack Forward EBITDA
($ in millions)
$190
Target Multiple 10x
Enterprise Value
($ in millions)
$1,900
45
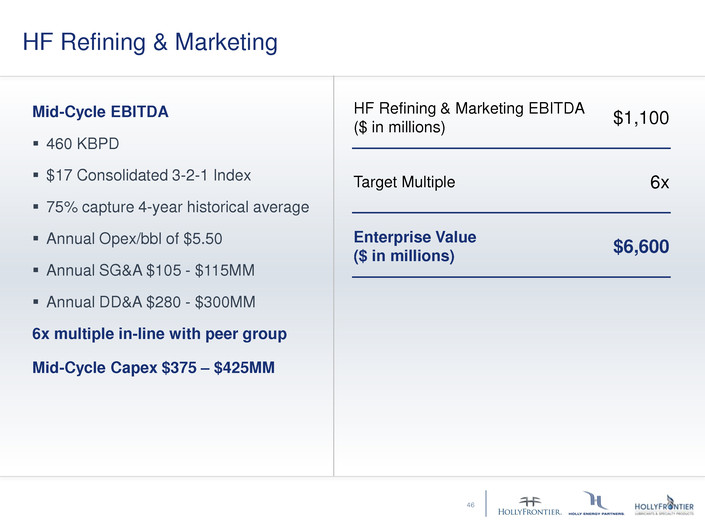
HF Refining & Marketing
HF Refining & Marketing EBITDA
($ in millions)
$1,100
Target Multiple 6x
Enterprise Value
($ in millions)
$6,600
Mid-Cycle EBITDA
460 KBPD
$17 Consolidated 3-2-1 Index
75% capture 4-year historical average
Annual Opex/bbl of $5.50
Annual SG&A $105 - $115MM
Annual DD&A $280 - $300MM
6x multiple in-line with peer group
Mid-Cycle Capex $375 – $425MM
46
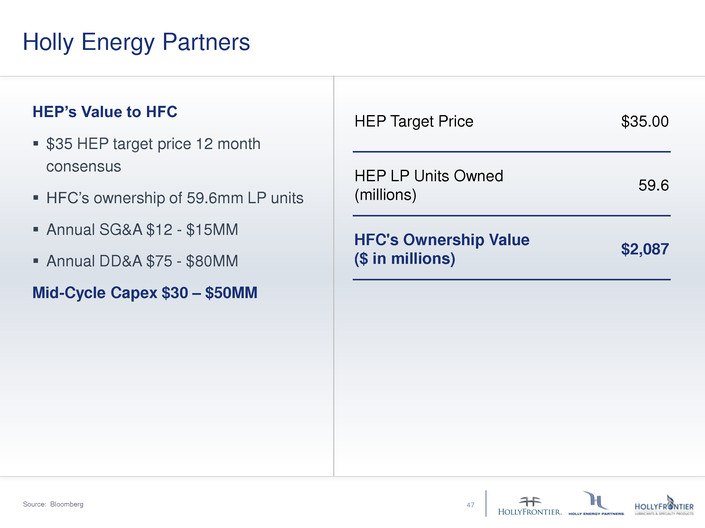
Holly Energy Partners
HEP’s Value to HFC
$35 HEP target price 12 month
consensus
HFC’s ownership of 59.6mm LP units
Annual SG&A $12 - $15MM
Annual DD&A $75 - $80MM
Mid-Cycle Capex $30 – $50MM
Source: Bloomberg
HEP Target Price $35.00
HEP LP Units Owned
(millions)
59.6
HFC's Ownership Value
($ in millions)
$2,087
47
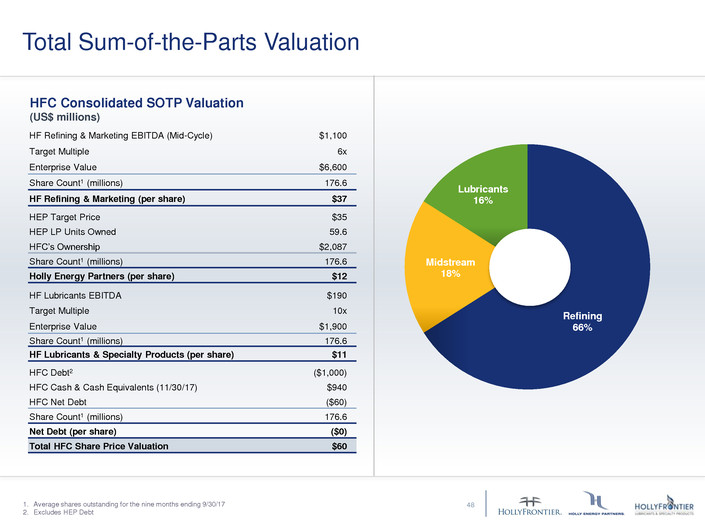
Total Sum-of-the-Parts Valuation
HF Refining & Marketing EBITDA (Mid-Cycle) $1,100
Target Multiple 6x
Enterprise Value $6,600
Share Count1 (millions) 176.6
HF Refining & Marketing (per share) $37
HEP Target Price $35
HEP LP Units Owned 59.6
HFC’s Ownership $2,087
Share Count1 (millions) 176.6
Holly Energy Partners (per share) $12
HF Lubricants EBITDA $190
Target Multiple 10x
Enterprise Value $1,900
Share Count1 (millions) 176.6
HF Lubricants & Specialty Products (per share) $11
HFC Debt2 ($1,000)
HFC Cash & Cash Equivalents (11/30/17) $940
HFC Net Debt ($60)
Share Count1 (millions) 176.6
Net Debt (per share) ($0)
Total HFC Share Price Valuation $60
HFC Consolidated SOTP Valuation
(US$ millions)
Refining
66%
Midstream
18%
Lubricants
16%
48 1. Average shares outstanding for the nine months ending 9/30/17
2. Excludes HEP Debt
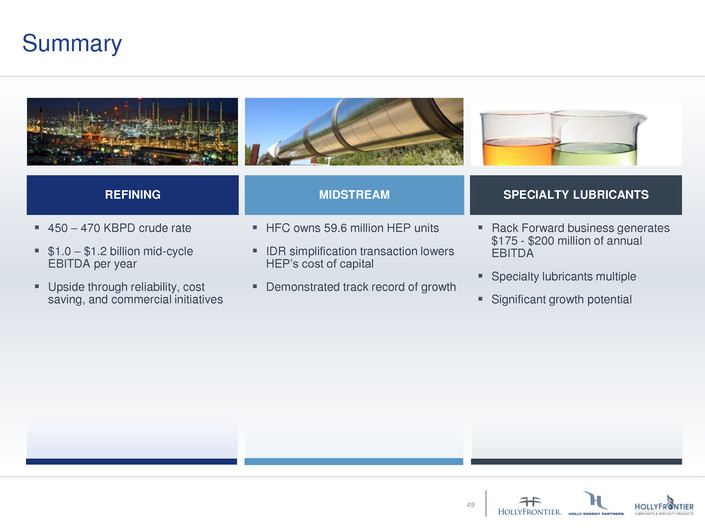
Summary
REFINING MIDSTREAM SPECIALTY LUBRICANTS
450 – 470 KBPD crude rate
$1.0 – $1.2 billion mid-cycle
EBITDA per year
Upside through reliability, cost
saving, and commercial initiatives
HFC owns 59.6 million HEP units
IDR simplification transaction lowers
HEP’s cost of capital
Demonstrated track record of growth
Rack Forward business generates
$175 - $200 million of annual
EBITDA
Specialty lubricants multiple
Significant growth potential
49
A P P E N D I X
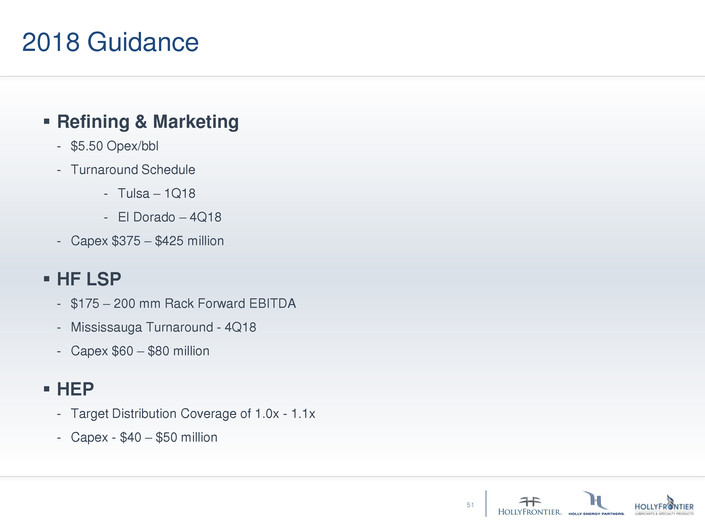
2018 Guidance
Refining & Marketing
- $5.50 Opex/bbl
- Turnaround Schedule
- Tulsa – 1Q18
- El Dorado – 4Q18
- Capex $375 – $425 million
HF LSP
- $175 – 200 mm Rack Forward EBITDA
- Mississauga Turnaround - 4Q18
- Capex $60 – $80 million
HEP
- Target Distribution Coverage of 1.0x - 1.1x
- Capex - $40 – $50 million
51
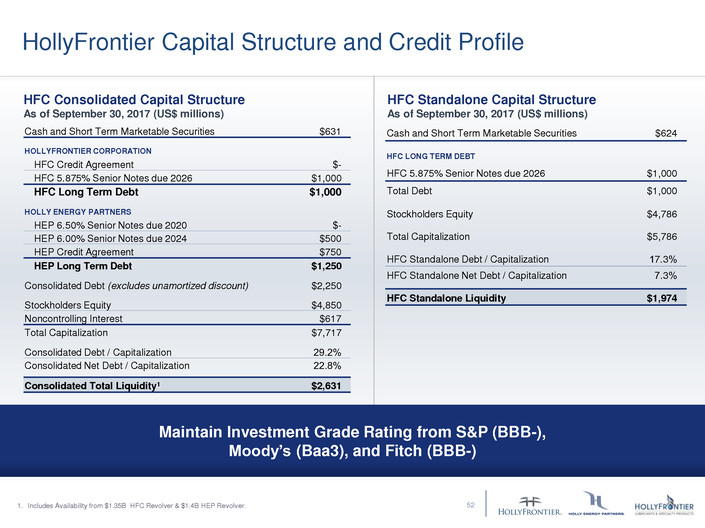
HollyFrontier Capital Structure and Credit Profile
52
52
Maintain Investment Grade Rating from S&P (BBB-),
Moody’s (Baa3), and Fitch (BBB-)
Cash and Short Term Marketable Securities $631
HOLLYFRONTIER CORPORATION
HFC Credit Agreement $-
HFC 5.875% Senior Notes due 2026 $1,000
HFC Long Term Debt $1,000
HOLLY ENERGY PARTNERS
HEP 6.50% Senior Notes due 2020 $-
HEP 6.00% Senior Notes due 2024 $500
HEP Credit Agreement $750
HEP Long Term Debt $1,250
Consolidated Debt (excludes unamortized discount) $2,250
Stockholders Equity $4,850
Noncontrolling Interest $617
Total Capitalization $7,717
Consolidated Debt / Capitalization 29.2%
Consolidated Net Debt / Capitalization 22.8%
Consolidated Total Liquidity1 $2,631
HFC Consolidated Capital Structure
As of September 30, 2017 (US$ millions)
Cash and Short Term Marketable Securities $624
HFC LONG TERM DEBT
HFC 5.875% Senior Notes due 2026 $1,000
Total Debt $1,000
Stockholders Equity $4,786
Total Capitalization $5,786
HFC Standalone Debt / Capitalization 17.3%
HFC Standalone Net Debt / Capitalization 7.3%
HFC Standalone Liquidity $1,974
HFC Standalone Capital Structure
As of September 30, 2017 (US$ millions)
1. Includes Availability from $1.35B HFC Revolver & $1.4B HEP Revolver.
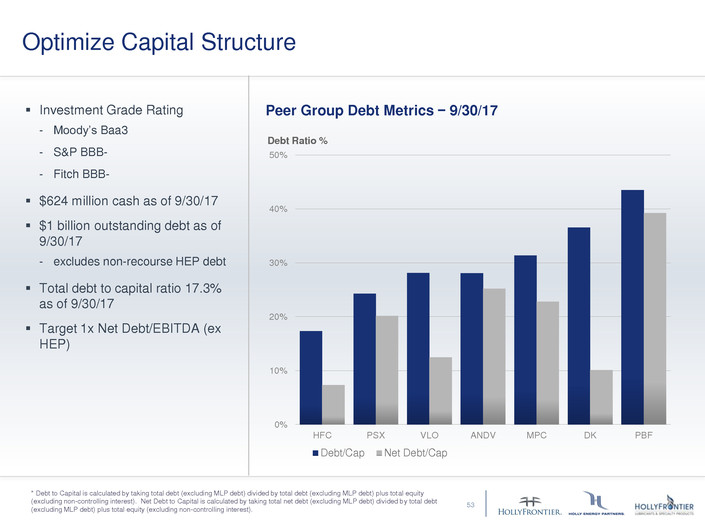
Investment Grade Rating
- Moody’s Baa3
- S&P BBB-
- Fitch BBB-
$624 million cash as of 9/30/17
$1 billion outstanding debt as of
9/30/17
- excludes non-recourse HEP debt
Total debt to capital ratio 17.3%
as of 9/30/17
Target 1x Net Debt/EBITDA (ex
HEP)
* Debt to Capital is calculated by taking total debt (excluding MLP debt) divided by total debt (excluding MLP debt) plus total equity
(excluding non-controlling interest). Net Debt to Capital is calculated by taking total net debt (excluding MLP debt) divided by total debt
(excluding MLP debt) plus total equity (excluding non-controlling interest).
0%
10%
20%
30%
40%
50%
HFC PSX VLO ANDV MPC DK PBF
Debt/Cap Net Debt/Cap
Debt Ratio %
Peer Group Debt Metrics − 9/30/17
Optimize Capital Structure
53
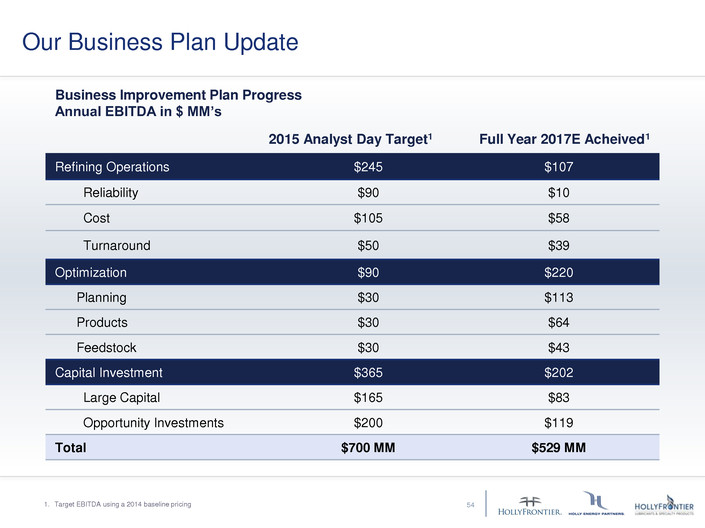
Our Business Plan Update
54 1. Target EBITDA using a 2014 baseline pricing
Business Improvement Plan Progress
Annual EBITDA in $ MM’s
2015 Analyst Day Target1 Full Year 2017E Acheived1
Refining Operations $245 $107
Reliability $90 $10
Cost $105 $58
Turnaround $50 $39
Optimization $90 $220
Planning $30 $113
Products $30 $64
Feedstock $30 $43
Capital Investment $365 $202
Large Capital $165 $83
Opportunity Investments $200 $119
Total $700 MM $529 MM
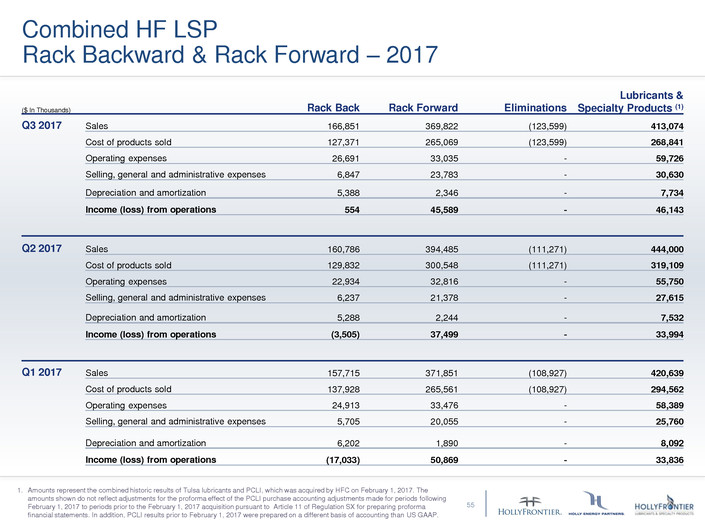
Combined HF LSP
Rack Backward & Rack Forward – 2017
55
($ In Thousands) Rack Back Rack Forward Eliminations
Lubricants &
Specialty Products (1)
Q3 2017 Sales 166,851 369,822 (123,599) 413,074
Cost of products sold 127,371 265,069 (123,599) 268,841
Operating expenses 26,691 33,035 - 59,726
Selling, general and administrative expenses 6,847 23,783 - 30,630
Depreciation and amortization 5,388 2,346 - 7,734
Income (loss) from operations 554 45,589 - 46,143
Q2 2017 Sales 160,786 394,485 (111,271) 444,000
Cost of products sold 129,832 300,548 (111,271) 319,109
Operating expenses 22,934 32,816 - 55,750
Selling, general and administrative expenses 6,237 21,378 - 27,615
Depreciation and amortization 5,288 2,244 - 7,532
Income (loss) from operations (3,505) 37,499 - 33,994
Q1 2017 Sales 157,715 371,851 (108,927) 420,639
Cost of products sold 137,928 265,561 (108,927) 294,562
Operating expenses 24,913 33,476 - 58,389
Selling, general and administrative expenses 5,705 20,055 - 25,760
Depreciation and amortization 6,202 1,890 - 8,092
Income (loss) from operations (17,033) 50,869 - 33,836
1. Amounts represent the combined historic results of Tulsa lubricants and PCLI, which was acquired by HFC on February 1, 2017. The
amounts shown do not reflect adjustments for the proforma effect of the PCLI purchase accounting adjustments made for periods following
February 1, 2017 to periods prior to the February 1, 2017 acquisition pursuant to Article 11 of Regulation SX for preparing proforma
financial statements. In addition, PCLI results prior to February 1, 2017 were prepared on a different basis of accounting than US GAAP.

Lubricants &
($ In Thousands) Rack Back Rack Forward Eliminations Specialty Products(1)
Q4 2016 Sales 150,885 339,765 (105,885) 384,765
Cost of products sold 120,809 234,151 (105,885) 249,075
Operating expenses 25,716 32,271 - 57,987
Selling, general and administrative expenses 5,172 18,223 - 23,395
Depreciation and amortization 7,209 1,382 - 8,591
Income (loss) from operations (8,021) 53,738 - 45,717
Q3 2016 Sales 168,689 367,526 (115,710) 420,505
Cost of products sold 135,181 257,573 (115,710) 277,044
Operating expenses 23,576 32,646 - 56,222
Selling, general and administrative expenses 5,459 19,223 - 24,682
Depreciation and amortization 7,209 1,293 - 8,502
Income (loss) from operations (2,736) 56,791 - 54,055
Q2 2016 Sales 158,914 370,837 (110,950) 418,801
Cost of products sold 120,344 258,848 (110,950) 268,242
Operating expenses 23,146 34,054 - 57,200
Selling, general and administrative expenses 5,639 19,724 - 25,363
Depreciation and amortization 7,218 1,301 - 8,519
Income (loss) from operations 2,567 56,910 - 59,477
Q1 2016 Sales 129,713 333,294 (97,395) 365,612
Cost of products sold 100,367 247,727 (97,395) 250,699
Operating expenses 23,231 32,350 - 55,581
Selling, general and administrative expenses 6,783 23,453 - 30,236
Depreciation and amortization 6,692 1,237 - 7,929
Income (loss) from operations (7,360) 28,527 - 21,167
Combined HF LSP
Rack Backward & Rack Forward – 2016
56
1. Amounts represent the combined historic results of Tulsa lubricants and PCLI, which was acquired by HFC on February 1, 2017. The
amounts shown do not reflect adjustments for the proforma effect of the PCLI purchase accounting adjustments made for periods following
February 1, 2017 to periods prior to the February 1, 2017 acquisition pursuant to Article 11 of Regulation SX for preparing proforma
financial statements. In addition, PCLI results prior to February 1, 2017 were prepared on a different basis of accounting than US GAAP.

($ in Thousands) Rack Back Rack Forward Eliminations
Lubricants &
Specialty Products(1)
Q4 2015 Sales 135,561 337,120 (99,363) 373,318
Cost of products sold 120,018 246,599 (99,363) 267,254
Operating expenses 13,994 32,530 - 46,524
Selling, general and administrative expenses 8,024 28,940 - 36,964
Depreciation and amortization 7,670 1,216 - 8,886
Income (loss) from operations (14,145) 27,835 - 13,690
Q3 2015 Sales 194,340 381,549 (134,226) 441,663
Cost of products sold 167,769 284,321 (134,226) 317,864
Operating expenses 22,018 32,990 - 55,008
Selling, general and administrative expenses 5,376 19,524 - 24,900
Depreciation and amortization 8,905 1,243 - 10,148
Income (loss) from operations (9,728) 43,471 - 33,743
Q2 2015 Sales 204,126 410,308 (138,582) 475,852
Cost of products sold 171,001 316,312 (138,582) 348,731
Operating expenses 26,315 35,312 - 61,627
Selling, general and administrative expenses 5,671 20,458 - 26,129
Depreciation and amortization 9,328 1,277 - 10,605
Income (loss) from operations (8,189) 36,949 - 28,760
Q1 2015 Sales 153,076 405,732 (111,118) 447,690
Cost of products sold 136,935 283,550 (111,118) 309,367
Operating expenses 31,854 34,358 - 66,212
Selling, general and administrative expenses 5,051 18,362 - 23,413
Depreciation and amortization 9,282 1,164 - 10,446
Income (loss) from operations (30,046) 68,298 - 38,252
Combined HF LSP
Rack Backward & Rack Forward – 2015
57
1. Amounts represent the combined historic results of Tulsa lubricants and PCLI, which was acquired by HFC on February 1, 2017. The
amounts shown do not reflect adjustments for the proforma effect of the PCLI purchase accounting adjustments made for periods following
February 1, 2017 to periods prior to the February 1, 2017 acquisition pursuant to Article 11 of Regulation SX for preparing proforma
financial statements. In addition, PCLI results prior to February 1, 2017 were prepared on a different basis of accounting than US GAAP.
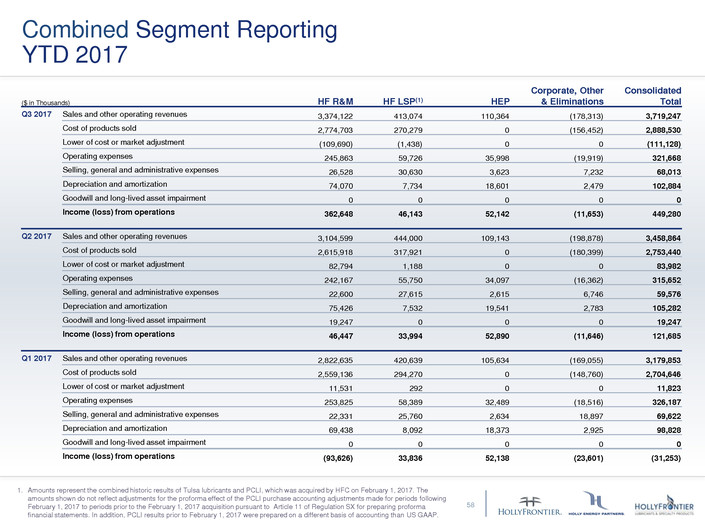
Combined Segment Reporting
YTD 2017
58
($ in Thousands) HF R&M HF LSP(1) HEP
Corporate, Other
& Eliminations
Consolidated
Total
Q3 2017 Sales and other operating revenues 3,374,122 413,074 110,364 (178,313) 3,719,247
Cost of products sold 2,774,703 270,279 0 (156,452) 2,888,530
Lower of cost or market adjustment (109,690) (1,438) 0 0 (111,128)
Operating expenses 245,863 59,726 35,998 (19,919) 321,668
Selling, general and administrative expenses 26,528 30,630 3,623 7,232 68,013
Depreciation and amortization 74,070 7,734 18,601 2,479 102,884
Goodwill and long-lived asset impairment 0 0 0 0 0
Income (loss) from operations 362,648 46,143 52,142 (11,653) 449,280
Q2 2017 Sales and other operating revenues 3,104,599 444,000 109,143 (198,878) 3,458,864
Cost of products sold 2,615,918 317,921 0 (180,399) 2,753,440
Lower of cost or market adjustment 82,794 1,188 0 0 83,982
Operating expenses 242,167 55,750 34,097 (16,362) 315,652
Selling, general and administrative expenses 22,600 27,615 2,615 6,746 59,576
Depreciation and amortization 75,426 7,532 19,541 2,783 105,282
Goodwill and long-lived asset impairment 19,247 0 0 0 19,247
Income (loss) from operations 46,447 33,994 52,890 (11,646) 121,685
Q1 2017 Sales and other operating revenues 2,822,635 420,639 105,634 (169,055) 3,179,853
Cost of products sold 2,559,136 294,270 0 (148,760) 2,704,646
Lower of cost or market adjustment 11,531 292 0 0 11,823
Operating expenses 253,825 58,389 32,489 (18,516) 326,187
Selling, general and administrative expenses 22,331 25,760 2,634 18,897 69,622
Depreciation and amortization 69,438 8,092 18,373 2,925 98,828
Goodwill and long-lived asset impairment 0 0 0 0 0
Income (loss) from operations (93,626) 33,836 52,138 (23,601) (31,253)
1. Amounts represent the combined historic results of Tulsa lubricants and PCLI, which was acquired by HFC on February 1, 2017. The
amounts shown do not reflect adjustments for the proforma effect of the PCLI purchase accounting adjustments made for periods following
February 1, 2017 to periods prior to the February 1, 2017 acquisition pursuant to Article 11 of Regulation SX for preparing proforma
financial statements. In addition, PCLI results prior to February 1, 2017 were prepared on a different basis of accounting than US GAAP.
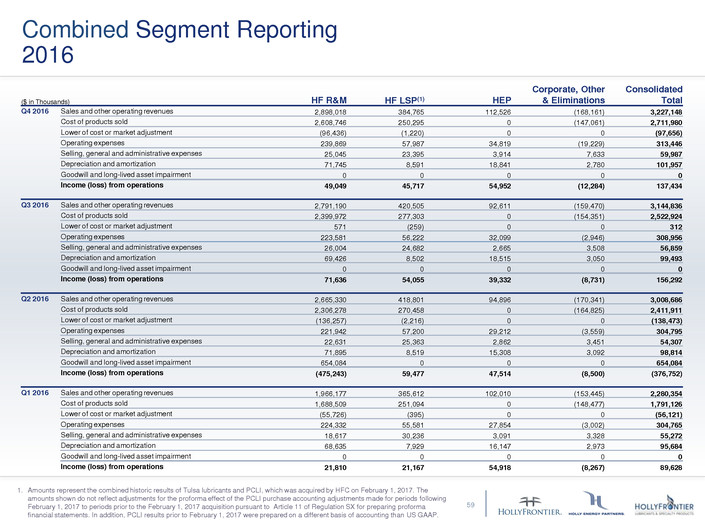
Combined Segment Reporting
2016
59
($ in Thousands) HF R&M HF LSP(1) HEP
Corporate, Other
& Eliminations
Consolidated
Total
Q4 2016 Sales and other operating revenues 2,898,018 384,765 112,526 (168,161) 3,227,148
Cost of products sold 2,608,746 250,295 0 (147,061) 2,711,980
Lower of cost or market adjustment (96,436) (1,220) 0 0 (97,656)
Operating expenses 239,869 57,987 34,819 (19,229) 313,446
Selling, general and administrative expenses 25,045 23,395 3,914 7,633 59,987
Depreciation and amortization 71,745 8,591 18,841 2,780 101,957
Goodwill and long-lived asset impairment 0 0 0 0 0
Income (loss) from operations 49,049 45,717 54,952 (12,284) 137,434
Q3 2016 Sales and other operating revenues 2,791,190 420,505 92,611 (159,470) 3,144,836
Cost of products sold 2,399,972 277,303 0 (154,351) 2,522,924
Lower of cost or market adjustment 571 (259) 0 0 312
Operating expenses 223,581 56,222 32,099 (2,946) 308,956
Selling, general and administrative expenses 26,004 24,682 2,665 3,508 56,859
Depreciation and amortization 69,426 8,502 18,515 3,050 99,493
Goodwill and long-lived asset impairment 0 0 0 0 0
Income (loss) from operations 71,636 54,055 39,332 (8,731) 156,292
Q2 2016 Sales and other operating revenues 2,665,330 418,801 94,896 (170,341) 3,008,686
Cost of products sold 2,306,278 270,458 0 (164,825) 2,411,911
Lower of cost or market adjustment (136,257) (2,216) 0 0 (138,473)
Operating expenses 221,942 57,200 29,212 (3,559) 304,795
Selling, general and administrative expenses 22,631 25,363 2,862 3,451 54,307
Depreciation and amortization 71,895 8,519 15,308 3,092 98,814
Goodwill and long-lived asset impairment 654,084 0 0 0 654,084
Income (loss) from operations (475,243) 59,477 47,514 (8,500) (376,752)
Q1 2016 Sales and other operating revenues 1,966,177 365,612 102,010 (153,445) 2,280,354
Cost of products sold 1,688,509 251,094 0 (148,477) 1,791,126
Lower of cost or market adjustment (55,726) (395) 0 0 (56,121)
Operating expenses 224,332 55,581 27,854 (3,002) 304,765
Selling, general and administrative expenses 18,617 30,236 3,091 3,328 55,272
Depreciation and amortization 68,635 7,929 16,147 2,973 95,684
Goodwill and long-lived asset impairment 0 0 0 0 0
Income (loss) from operations 21,810 21,167 54,918 (8,267) 89,628
1. Amounts represent the combined historic results of Tulsa lubricants and PCLI, which was acquired by HFC on February 1, 2017. The
amounts shown do not reflect adjustments for the proforma effect of the PCLI purchase accounting adjustments made for periods following
February 1, 2017 to periods prior to the February 1, 2017 acquisition pursuant to Article 11 of Regulation SX for preparing proforma
financial statements. In addition, PCLI results prior to February 1, 2017 were prepared on a different basis of accounting than US GAAP.
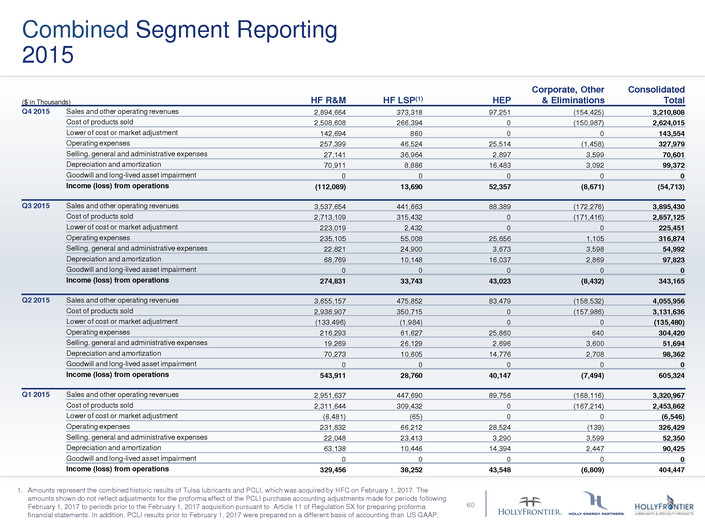
Combined Segment Reporting
2015
60
($ in Thousands) HF R&M HF LSP(1) HEP
Corporate, Other
& Eliminations
Consolidated
Total
Q4 2015 Sales and other operating revenues 2,894,664 373,318 97,251 (154,425) 3,210,808
Cost of products sold 2,508,608 266,394 0 (150,987) 2,624,015
Lower of cost or market adjustment 142,694 860 0 0 143,554
Operating expenses 257,399 46,524 25,514 (1,458) 327,979
Selling, general and administrative expenses 27,141 36,964 2,897 3,599 70,601
Depreciation and amortization 70,911 8,886 16,483 3,092 99,372
Goodwill and long-lived asset impairment 0 0 0 0 0
Income (loss) from operations (112,089) 13,690 52,357 (8,671) (54,713)
Q3 2015 Sales and other operating revenues 3,537,654 441,663 88,389 (172,276) 3,895,430
Cost of products sold 2,713,109 315,432 0 (171,416) 2,857,125
Lower of cost or market adjustment 223,019 2,432 0 0 225,451
Operating expenses 235,105 55,008 25,656 1,105 316,874
Selling, general and administrative expenses 22,821 24,900 3,673 3,598 54,992
Depreciation and amortization 68,769 10,148 16,037 2,869 97,823
Goodwill and long-lived asset impairment 0 0 0 0 0
Income (loss) from operations 274,831 33,743 43,023 (8,432) 343,165
Q2 2015 Sales and other operating revenues 3,655,157 475,852 83,479 (158,532) 4,055,956
Cost of products sold 2,938,907 350,715 0 (157,986) 3,131,636
Lower of cost or market adjustment (133,496) (1,984) 0 0 (135,480)
Operating expenses 216,293 61,627 25,860 640 304,420
Selling, general and administrative expenses 19,269 26,129 2,696 3,600 51,694
Depreciation and amortization 70,273 10,605 14,776 2,708 98,362
Goodwill and long-lived asset impairment 0 0 0 0 0
Income (loss) from operations 543,911 28,760 40,147 (7,494) 605,324
Q1 2015 Sales and other operating revenues 2,951,637 447,690 89,756 (168,116) 3,320,967
Cost of products sold 2,311,644 309,432 0 (167,214) 2,453,862
Lower of cost or market adjustment (6,481) (65) 0 0 (6,546)
Operating expenses 231,832 66,212 28,524 (139) 326,429
Selling, general and administrative expenses 22,048 23,413 3,290 3,599 52,350
Depreciation and amortization 63,138 10,446 14,394 2,447 90,425
Goodwill and long-lived asset impairment 0 0 0 0 0
Income (loss) from operations 329,456 38,252 43,548 (6,809) 404,447
1. Amounts represent the combined historic results of Tulsa lubricants and PCLI, which was acquired by HFC on February 1, 2017. The
amounts shown do not reflect adjustments for the proforma effect of the PCLI purchase accounting adjustments made for periods following
February 1, 2017 to periods prior to the February 1, 2017 acquisition pursuant to Article 11 of Regulation SX for preparing proforma
financial statements. In addition, PCLI results prior to February 1, 2017 were prepared on a different basis of accounting than US GAAP.

Speaker Biographies
61
George Damiris
CEO, PRESIDENT
Mr. Damiris has served as Chief Executive Officer and President since
January 2016. He previously served as Executive Vice President and
Chief Operating Officer from September 2014 to January 2016 and as
Senior Vice President, Supply and Marketing from January 2008 until
September 2014. Mr. Damiris has served as Chief Executive Officer of
HLS since November 2016 and as President of HLS since February 2017.
Mr. Damiris joined Holly Corporation in 2007 as Vice President, Corporate
Development after an 18-year career with Koch Industries, where he was
responsible for managing various refining, chemical, trading, and financial
businesses. Mr. Damiris has both a B.S. and M.B.A. from Case Western
Reserve University.
Richard Voliva
CFO, EXECUTIVE VICE PRESIDENT
Mr. Voliva has served as Executive Vice President and Chief Financial Officer of
HollyFrontier since March, 2017. Since joining the HollyFrontier Companies in
2014, he served in roles of increasing responsibility including Senior Vice
President, Strategy for HollyFrontier and Chief Financial Officer of Holly Energy
Partners. Prior to joining the HollyFrontier Companies, Mr. Voliva worked as a
financial analyst at firms including Millennium Management LLC, Partner Fund
Management, LP and Deutsche Bank. Mr. Voliva holds a B.A. from Harvard
University, an M.A. from Johns Hopkins University, and is a CFA Charterholder.
Thomas Creery
SENIOR VICE PRESIDENT, COMMERCIAL
Mr. Creery was appointed Senior Vice President, Commercial of
HollyFrontier Corporation in January 2016 and President of HollyFrontier
Refining and Marketing in February 2017. He previously served as Vice
President, Crude Supply from October 2008 to January 2016 and Vice
President, Crude Supply and Planning from January 2006 to October
2008. Prior to joining HollyFrontier, Mr. Creery served at Unocal
Corporation for 25 years in a variety of locations based in Calgary, Los
Angeles, Singapore and Houston. Mr. Creery graduated from the
University of Calgary’s Haskayne School of Business.
Jim Stump
SENIOR VICE PRESIDENT, REFINING
Mr. Stump has served as Senior Vice President, Refining (formerly called Senior
Vice President, Refinery Operations) since the merger in July 2011. During his 21
years at Frontier, Mr. Stump held various positions, including serving as Vice
President – Refining Operations for Frontier Refining and Marketing from 2009
until July 2011, and as Vice President and Refining Manager from 2002 to 2009.
Mr. Stump holds a B.S. in Chemical Engineering from the Colorado School of
Mines.
Speaker Biographies
62
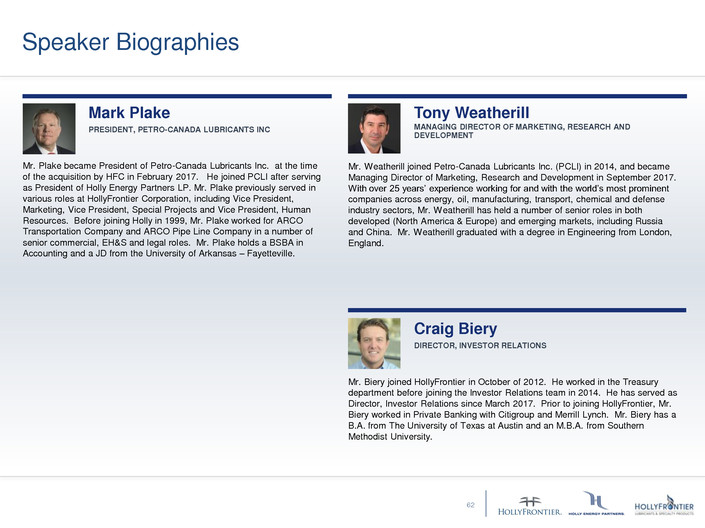
Mark Plake
PRESIDENT, PETRO-CANADA LUBRICANTS INC
Mr. Plake became President of Petro-Canada Lubricants Inc. at the time
of the acquisition by HFC in February 2017. He joined PCLI after serving
as President of Holly Energy Partners LP. Mr. Plake previously served in
various roles at HollyFrontier Corporation, including Vice President,
Marketing, Vice President, Special Projects and Vice President, Human
Resources. Before joining Holly in 1999, Mr. Plake worked for ARCO
Transportation Company and ARCO Pipe Line Company in a number of
senior commercial, EH&S and legal roles. Mr. Plake holds a BSBA in
Accounting and a JD from the University of Arkansas – Fayetteville.
Tony Weatherill
MANAGING DIRECTOR OF MARKETING, RESEARCH AND
DEVELOPMENT
Mr. Weatherill joined Petro-Canada Lubricants Inc. (PCLI) in 2014, and became
Managing Director of Marketing, Research and Development in September 2017.
With over 25 years’ experience working for and with the world’s most prominent
companies across energy, oil, manufacturing, transport, chemical and defense
industry sectors, Mr. Weatherill has held a number of senior roles in both
developed (North America & Europe) and emerging markets, including Russia
and China. Mr. Weatherill graduated with a degree in Engineering from London,
England.
Craig Biery
DIRECTOR, INVESTOR RELATIONS
Mr. Biery joined HollyFrontier in October of 2012. He worked in the Treasury
department before joining the Investor Relations team in 2014. He has served as
Director, Investor Relations since March 2017. Prior to joining HollyFrontier, Mr.
Biery worked in Private Banking with Citigroup and Merrill Lynch. Mr. Biery has a
B.A. from The University of Texas at Austin and an M.B.A. from Southern
Methodist University.
62
Definitions
63
FCC: Fluid catalytic cracking, means a refinery process that breaks down large complex
hydrocarbon molecules into smaller more useful ones using a circulating bed of catalyst at
relatively high temperatures.
Flux: produced from the bottom cut of crude oil and is the base used to make roofing
shingles for housing industry
Free Cash Flow: Calculated by taking operating cash flow and subtracting capital
expenditures.
GF-6: Upcoming industry standard for passenger car motor oils that will be released by the
International Lubricants Standardization and Approval Committee in 2019. GF-6 is
intended to increase fuel economy, enhance oil robustness, expand fuel efficiency,
improve wear protection and reduce engine aeration by increasing the quality standards
for passenger car motor oil.
Hydrocracker bottoms (HCB): the remaining bottom product from hydrocracking. HCB is
the primary feedstock for the Catalytic Dewaxing process used in the production Group
II/II+ and III/III+ base oils
Hydrocracking: the elimination of aromatics and impurities by chemically reacting the
feed stock with hydrogen in the presence of a catalyst at high temperature (400 OC and
high pressure (3000 psig). This process removes the polar compounds, converts the
aromatic hydrocarbons to saturated cyclic hydrocarbons, and breaks up heavy molecules
into lighter saturated hydrocarbons."
Hydrotreating Unit (HTU): processes vacuum gas oil (VGO) streams that have been
fractionated from crude oil but not hydrotreated. The HTU eliminates aromatics and polar
compounds by reacting the feedstock with hydrogen, in the presence of a catalyst at high
temperatures and pressures. The HTU produces exceptionally high quality basestocks
including Group II base oils and pharmaceutical grade white oils.
IDR: Incentive Distribution Rights
Lube Extraction Unit (LEU): solvent extracting process that prepares the feedstock for
the MEK unit by removing low V.I. material; producing a higher V.I. MEK feed.
Lubricant : A solvent neutral paraffinic product used in commercial heavy duty engine
oils, passenger car oils and specialty products for industrial applications such as heat
transfer, metalworking, rubber and other general process oil.
Methyl Ethyl Ketone (MEK): a solvent dewaxing process that separates the wax portion
of the feedstock from the oil portion. This process produces waxes and base oils.
Net Operating Margin: the difference between refinery gross margin and refinery
operating expense per barrel of produced refined products. Net operating margin is a non-
GAAP performance measure that is used by our management and others to compare our
refining performance to that of other companies in our industry. This margin does not
include the effect of depreciation, depletion and amortization. Other companies in our
industry may not calculate this performance measure in the same manner. Our historical
net operating margin is reconciled to net income under the section entitled “Reconciliation
to Amounts Reported Under Generally Accepted Accounting Principles” in HollyFrontier
Corporation’s 2016 10-K filed February 22, 2017.
BPD: the number of barrels per calendar day of crude oil or petroleum products.
CAGR: The compound annual growth rate is calculated by dividing the ending value by
the beginning value, raise the result to the power of one divided by the period length, and
subtract one from the subsequent result. CAGR is the mean annual growth rate of an
investment over a specified period of time longer than one year.
Catalytic Dewaxing Unit (CDW): a high-pressure hydrogen and catalyst system that
isomerizes feedstock into high quality basestock with excellent low temperature
properties. This CDW produces exceptionally high quality Group II/II+/III/III+ basestock
and technical grade white mineral oils"
Cummins ISB Test: Standard test method to evaluate the ability of heavy-duty engine oil
to reduce valve train wear under various operating conditions. The test uses a Cummins
2004 ISB diesel engine, Variable Geometry Turbocharger, and cooled Exhaust Gas
Recirculation
Debt-To-Capital: A measurement of a company's financial leverage, calculated as the
company's long term debt divided by its total capital. Debt includes all long-term
obligations. Total capital includes the company's debt and shareholders' equity.
Distributable Cash Flow: Distributable cash flow (DCF) is not a calculation based upon
GAAP. However, the amounts included in the calculation are derived from amounts
separately presented in HEP’s consolidated financial statements, with the exception of
excess cash flows over earnings of SLC Pipeline, maintenance capital expenditures and
distributable cash flow from discontinued operations. Distributable cash flow should not
be considered in isolation or as an alternative to net income or operating income as an
indication of HEP’s operating performance or as an alternative to operating cash flow as
a measure of liquidity. Distributable cash flow is not necessarily comparable to similarly
titled measures of other companies. Distributable cash flow is presented here because it
is a widely accepted financial indicator used by investors to compare partnership
performance. We believe that this measure provides investors an enhanced perspective
of the operating performance of HEP’s assets and the cash HEP is generating. HEP’s
historical net income is reconciled to distributable cash flow in "Item 6. Selected
Financial Data" of HEP's 2016 10-K filed February 22, 2017.
EBITDA: Earnings before interest, taxes, depreciation and amortization, which we refer
to as EBITDA, is calculated as net income plus (i) interest expense net of interest
income, (ii) income tax provision, and (iii) depreciation, depletion and amortization.
EBITDA is not a calculation provided for under GAAP; however, the amounts included in
the EBITDA calculation are derived from amounts included in our consolidated financial
statements. EBITDA should not be considered as an alternative to net income or
operating income as an indication of our operating performance or as an alternative to
operating cash flow as a measure of liquidity. EBITDA is not necessarily comparable to
similarly titled measures of other companies. EBITDA is presented here because it is a
widely used financial indicator used by investors and analysts to measure performance.
EBITDA is also used by our management for internal analysis and as a basis for financial
covenants. Our historical EBITDA is reconciled to net income under the section entitled
“Reconciliation to Amounts Reported Under Generally Accepted Accounting Principles”
in HollyFrontier Corporation’s 2016 10-K filed February 22, 2017.
Enterprise Value: calculated as market capitalization plus minority interest, plus
preferred shares, plus net-debt, less MLP debt
Definitions
64
Reforming: The process of converting gasoline type molecules into aromatic, higher
octane gasoline blend stocks while producing hydrogen in the process.
Solvent Dewaxing: base oil refining process which lowers the pour point (freezing point)
of base oil product by introducing dewaxing solvents such as methyl-ethyl ketone (MEK).
Wax is removed from the base oil to prevent base oil from crystallizing in engines at low
temperatures.
Solvent Extraction: base oil refining process which removes aromatic components in
vacuum gas oil to improve the lubricating quality of the base oil product.
Sour Crude: Crude oil containing quantities of sulfur greater than 0.4 percent by weight,
while “sweet crude oil” means crude oil containing quantities of sulfur equal to or less
than 0.4 percent by weight.
Vacuum Distillation: The process of distilling vapor from liquid crudes, usually by
heating, and condensing the vapor below atmospheric pressure turning it back to a liquid
in order to purify, fractionate or form the desired products.
Viscosity: measure of a fluid’s resistance to flow. It is ordinarily expressed in terms of
the time required for a standard quantity of the fluid at a certain temperature to flow
through a standard orifice. The higher the value, the more viscous the fluid. Since
viscosity varies inversely with temperature, its value is meaningless unless accompanied
by the temperature at which it is determined. With petroleum oils, viscosity is now
commonly reported in CENTISTOKES (cSt), measured at either 40°C or 100°C."
VTB: Vacuum Tower Bottoms are the left over bottom product of vacuum distillation,
which can be processed in cokers and used for upgrading into gasoline, diesel and gas
oil.
WCS: Western Canada Select crude oil, made up of Canadian heavy conventional and
bitumen crude oils blended with sweet synthetic and condensate diluents.
WTI: West Texas Intermediate, a grade of crude oil used as a common benchmark in oil
pricing. WTI is a sweet crude oil and has a relatively low density.
WTS: West Texas Sour, a medium sour crude oil.
Non GAAP measurements: We report certain financial measures that are not prescribed
or authorized by U. S. generally accepted accounting principles ("GAAP"). We discuss
management's reasons for reporting these non-GAAP measures below. Although
management evaluates and presents these non-GAAP measures for the reasons
described below, please be aware that these non-GAAP measures are not alternatives to
revenue, operating income, income from continuing operations, net income, or any other
comparable operating measure prescribed by GAAP. In addition, these non-GAAP financial
measures may be calculated and/or presented differently than measures with the same or
similar names that are reported by other companies, and as a result, the non-GAAP
measures we report may not be comparable to those reported by others.
OEM: Original Equipment Manufacturer, or company whose goods are used as
components in the products of another company.
Paraffinic oil: A high paraffinic, high gravity oil produced by extracting aromatic oils and
waxes from gas oil and is used in producing high-grade lubricating oils.
PC-11: Proposed Category 11 is a new performance category for heavy-duty engine oils
released by the American Petroleum Institute in December 2016. PC-11 is designed to
help reduce emissions and boost fuel economy by increasing the quality standards for
heavy-duty engine oils. PC-11 engine oils can withstand higher temperatures for longer
periods of time without breaking down.
Rack Backward: business segment of HF LSP that captures the value between feedstock
cost and base oil market prices (transfer prices to rack forward).
Rack Forward: business segment of HF LSP that captures the value between bas oil
market prices and product sales revenue from customers.
RBOB: Reformulated Gasoline Blendstock for Oxygen Blending
Refining gross margin or refinery gross margin: the difference between average net
sales price and average product costs per produced barrel of refined products sold.
Refining gross margin or refinery gross margin is a non-GAAP performance measure that
is used by our management and others to compare our refining performance to that of
other companies in our industry. This margin does not include the effect of depreciation,
depletion and amortization. Other companies in our industry may not calculate this
performance measure in the same manner. Our historical refining gross margin or refinery
gross margin is reconciled to net income under the section entitled “Reconciliation to
Amounts Reported Under Generally Accepted Accounting Principles” in HollyFrontier
Corporation’s 2016 10-K filed February 22, 2017.
HollyFrontier Corporation
(NYSE: HFC)
2828 N. Harwood, Suite 1300
Dallas, Texas 75201
(214) 954-6510
www.hollyfrontier.com
Craig Biery | Director, Investor Relations
investors@hollyfrontier.com
214-954-6510
Jared Harding | Investor Relations
investors@hollyfrontier.com
214-954-6510
