Attached files
| file | filename |
|---|---|
| EX-99.4 - EXHIBIT 99.4 - CIENA CORP | exhibit994pressreleaseshar.htm |
| EX-99.2 - EXHIBIT 99.2 - CIENA CORP | exhibit992transcript.htm |
| EX-99.1 - EXHIBIT 99.1 - CIENA CORP | exhibit9912017q4pressrelea.htm |
| 8-K - 8-K - CIENA CORP | a8-k2017q4earningsrelease.htm |

Copyright © Ciena Corporation 2017. All rights reserved. Confidential & Proprietary.
Ciena Corporation
Period ended October 31, 2017
December 7, 2017
Investor presentation

Copyright © Ciena Corporation 2017. All rights reserved. Confidential & Proprietary. 2
Forward-looking statements and non-GAAP measures
Information in this presentation and related comments of presenters contain a number of forward-looking statements. These statements are based on current expectations, forecasts,
assumptions and other information available to the Company as of the date hereof. Forward-looking statements include Ciena’s long-term financial targets, prospective financial results,
return of capital plans, business strategies, expectations about its addressable markets and market share, and business outlook for future periods, as well as statements regarding Ciena’s
expectations, beliefs, intentions or strategies regarding the future. Often, these can be identified by forward-looking words such as “target” “anticipate,” “believe,” “could,” “estimate,”
“expect,” “intend,” “may,” “should,” “will,” and “would” or similar words.
Ciena's actual results, performance or events may differ materially from these forward-looking statements made or implied due to a number of risks and uncertainties relating to Ciena's
business, including: the effect of broader economic and market conditions on our customers and their business; changes in network spending or network strategy by large communication
service providers; seasonality and the timing and size of customer orders, including our ability to recognize revenue relating to such sales; the level of competitive pressure we encounter;
the product, customer and geographic mix of sales within the period; supply chain disruptions and the level of success relating to efforts to optimize Ciena's operations; changes in foreign
currency exchange rates affecting revenue and operating expense; and the other risk factors disclosed in Ciena's Quarterly Report on Form 10-Q filed with the Securities and Exchange
Commission (SEC) on September 6, 2017 and Ciena’s Annual Report on Form 10-K to be filed with the SEC.
All information, statements, and projections in this presentation and the related earnings call speak only as of the date of this presentation and related earnings call. Ciena assumes no
obligation to update any forward-looking or other information included in this presentation or related earnings calls, whether as a result of new information, future events or otherwise.
In addition, this presentation includes historical, and may include prospective, non-GAAP measures of Ciena’s gross margin, operating expense, operating profit, net income, and net
income per share. These measures are not intended to be a substitute for financial information presented in accordance with GAAP. A reconciliation of non-GAAP measures used in this
presentation to Ciena’s GAAP results for the relevant period can be found in the Appendix to this presentation. Additional information can also be found in our press release filed this
morning and in our reports on Form 10-Q filed with the Securities and Exchange Commission.
With respect to Ciena’s expectations under “Business Outlook” and other forward looking long-term projections in this presentation, Ciena is not able to provide a quantitative
reconciliation of the adjusted (non-GAAP) gross margin and adjusted (non-GAAP) operating expense guidance measures to the corresponding gross profit and gross profit percentage,
and operating expense GAAP measures without unreasonable efforts. Ciena cannot provide meaningful estimates of the non-recurring charges and credits excluded from these
non-GAAP measures due to the forward-looking nature of these estimates and their inherent variability and uncertainty. For the same reasons, Ciena is unable to address the
probable significance of the unavailable information.
Copyright © Ciena Corporation 2017. All rights reserved. Confidential & Proprietary. 3
Table of Contents

Copyright © Ciena Corporation 2017. All rights reserved. Confidential & Proprietary. 4
Our Pedigree

Copyright © Ciena Corporation 2017. All rights reserved. Confidential & Proprietary. 5
Continued execution of our strategy to diversify and scale the business
Ciena has reached an important inflection point in our recent transformation
~8% total revenue | India: $38M
~15% total revenue
Upgrade market only
Network Management System
1,000
60
$2.29B
6.5%
($674M)
Financial
Performance
Scale
Diversification
~18% total revenue | India: $230M+
~25% total revenue
Upgrade + New Build market
Virtualization, multi-vendor network mgmt,
control and orchestration
1,300
80+
$2.80B
11.9%
$33M
APAC
Webscale**
Subsea
Software portfolio
Customers
Countries
Revenue
Adj. Operating Margin
Net (Debt) / Cash*
*Cash & cash equivalents
**Direct, indirect, and apportioned subsea

Copyright © Ciena Corporation 2017. All rights reserved. Confidential & Proprietary. 6
*Industry Average: ADTN, ADVA, CSCO, ERIC, INFN, JNPR and NOKIA
2017 = Represents Ciena fiscal 2017 actuals and midpoint of Q1’18 guidance,
and peer consensus estimates as of 28 November 2017
0.8
1.0
1.2
1.4
1.6
1.8
2011 2012 2013 2014 2015 2016 2017
Normalized Revenue
Industry Avg Ciena
0
5
10
15
20
2011 2012 2013 2014 2015 2016 2017
Normalized Adjusted Operating Profit
Industry Avg Ciena
Outperforming peer group for more than 5 years
Ciena has delivered differentiated growth & profit expansion

Copyright © Ciena Corporation 2017. All rights reserved. Confidential & Proprietary. 7
Strengthening balance sheet
Ciena has improved its leverage and reduced its debt position
13.2
10.9
6.0
4.4
2.8
-
2.0x
4.0x
6.0x
8.0x
10.0x
12.0x
14.0x
2013 2014 2015 2016 2017
Gross debt-to-EBITDA leverage ratio
Leverage Trend Net Debt Position
*Cash & cash equivalents
*

Copyright © Ciena Corporation 2017. All rights reserved. Confidential & Proprietary. 8
Ciena is a market share leader in all target segments
Optical Networks Report, 3Q17
#1 GLOBALLY
• DATA CENTER INTERCONNECT
• DATA CENTER INTERCONNECT for ICPs
#1 N. AMERICA
• TOTAL OPTICAL NETWORKING
• PACKET OPTICAL
• NEXT-GEN OPTICAL
• LH WDM
• METRO WDM
• OPTICAL SWITCHING
#2 GLOBALLY
• NEXT-GEN OPTICAL
• PACKET OPTICAL
• LH WDM
Optical Networks Report, 3Q17
Data Center Interconnect Market Share Report, 2Q17
#1 GLOBALLY
• DATA CENTER INTERCONNECT
• DATA CENTER INTERCONNECT for ICPs
• SUBMARINE SLTE MARKET
#1 N. AMERICA
• TOTAL OPTICAL NETWORKING
• LH WDM
• METRO WDM
#2 GLOBALLY
• TERRESTRIAL WDM NETWORKING
• LH WDM
• METRO WDM
• SUBSEA OPTOELECTRONICS
#1 GLOBALLY
• OPTICAL EQUIPMENT VENDOR
LEADERSHIP SP SURVEY
• CARRIER ETHERNET ACCESS DEVICES
#1 N. AMERICA
• CARRIER ETHERNET ACCESS DEVICES
• LH WDM
• METRO WDM
#2 GLOBALLY
• TOTAL OPTICAL NETWORKING
• METRO WDM
• SUBMARINE
Optical Networks Report, 3Q17
Ethernet Access Devices Tracker, September 2017
Optical Equipment Vendor Leadership Global Service
Provider Survey December 2016

Copyright © Ciena Corporation 2017. All rights reserved. Confidential & Proprietary. 9
Market Context
Copyright © Ciena Corporation 2017. All rights reserved. Confidential & Proprietary. 10
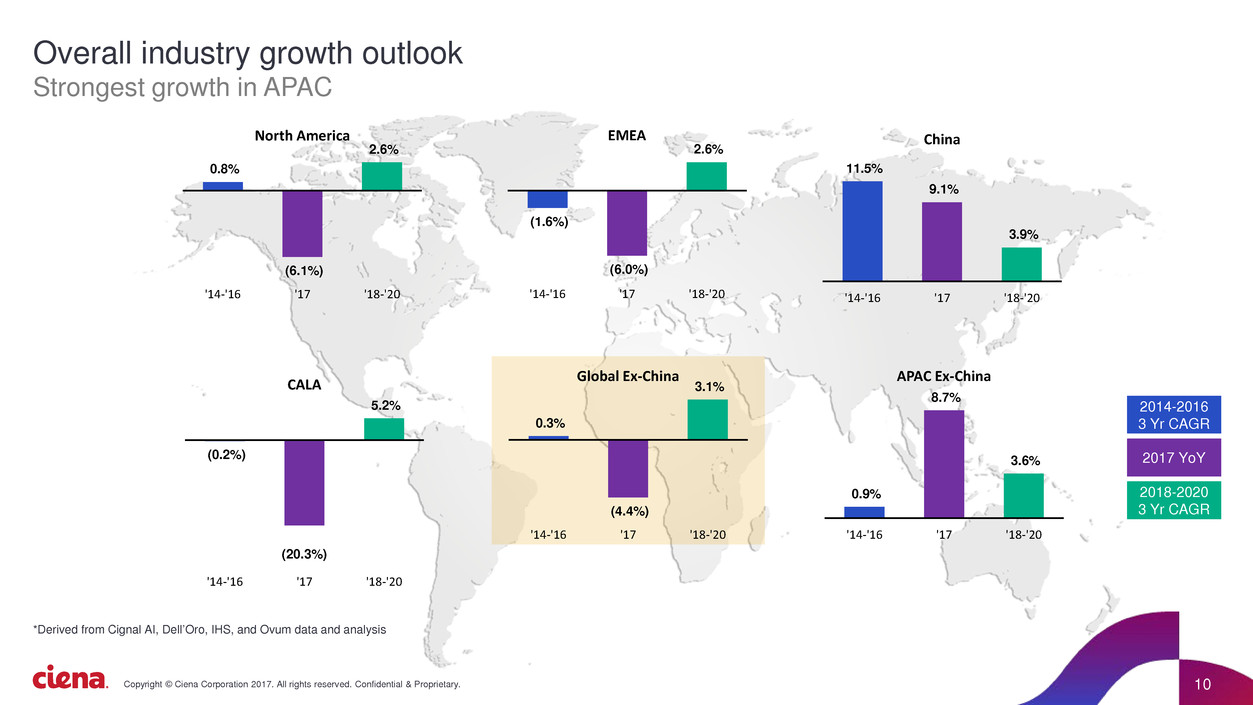
Overall industry growth outlook
Strongest growth in APAC
0.8%
(6.1%)
2.6%
'14-'16 '17 '18-'20
North America
(1.6%)
(6.0%)
2.6%
'14-'16 '17 '18-'20
EMEA
11.5%
9.1%
3.9%
'14-'16 '17 '18-'20
China
(0.2%)
(20.3%)
5.2%
'14-'16 '17 '18-'20
CALA
0.3%
(4.4%)
3.1%
'14-'16 '17 '18-'20
Global Ex-China
0.9%
8.7%
3.6%
'14-'16 '17 '18-'20
APAC Ex-China
2014-2016
3 Yr CAGR
2017 YoY
2018-2020
3 Yr CAGR
*Derived from Cignal AI, Dell’Oro, IHS, and Ovum data and analysis

Copyright © Ciena Corporation 2017. All rights reserved. Confidential & Proprietary. 11
Our industry structure is evolving
Ciena uniquely positioned to address evolving customer demands
Service
Provider
Service
Provider
Webscale
CLOUD
Services & Application Innovation
End User
Data
Center
Data
Center
End User

Copyright © Ciena Corporation 2017. All rights reserved. Confidential & Proprietary. 12
Grow our Packet & Optical
Infrastructure Business
Build our Network
Automation Capabilities
with Blue Planet
Attack the Merchant
Coherent Modem Market
Explore Adjacencies
for Growth
“Best-of-breed at scale”
Ciena is well positioned to take market share and expand addressable market

Copyright © Ciena Corporation 2017. All rights reserved. Confidential & Proprietary. 13
FY’17 Highlights

Copyright © Ciena Corporation 2017. All rights reserved. Confidential & Proprietary. 14
We are taking market share and outperforming the competition
Our balance sheet is strengthening
We are forcing the pace of innovation in the industry
Annual revenue growth faster than market at more than 7.5%
Webscale/DCI momentum continued, including $110M of Waveserver annual revenue and 73 customers
India revenue grew nearly 100% year-over-year to give Ciena #1 market share in the country
Successful convertible debt exchange offer to manage dilution and improve EPS
Significant improvement in debt ratios
Two ratings agency upgrades (Moody’s and S&P)
Net cash position for first time in more than seven years
WaveLogic Ai – 2x capacity per channel, 3x distance at equivalent capacity, and 4x service density
Liquid Spectrum – monitor and mine all available network assets to instantly respond to new bandwidth demands in real-time
Blue Planet MCP – SDN-based domain control for automating Ciena's next-gen packet and optical networks, greatly
simplifying lifecycle management

Copyright © Ciena Corporation 2017. All rights reserved. Confidential & Proprietary. 15
FY’17 financial highlights
* A reconciliation of these non-GAAP measures to our GAAP results is included in the appendix to this presentation.
Adjusted
Gross Margin
Adjusted
Operating Expense
Adjusted
Operating Margin
$2.80B $2.60BRevenue
45.1% 45.5%
$931M
33.2% / total revenue
$887M
34.1% / total revenue
11.9% 11.4%
FY’17 FY’16

Copyright © Ciena Corporation 2017. All rights reserved. Confidential & Proprietary. 16
FY’17 operating metrics
Cash Flow from
Operations
DSO
Inventory Turns
$1.0B* $1.1BCash and Investments
$235M** $290M
80 Days 80 Days
4.9** 5.6
FY’17 FY’16
*Reduced debt by ~$330M
**Working Capital increased to meet customer demand

Copyright © Ciena Corporation 2017. All rights reserved. Confidential & Proprietary. 17
Long-Term Targets

Copyright © Ciena Corporation 2017. All rights reserved. Confidential & Proprietary. 18
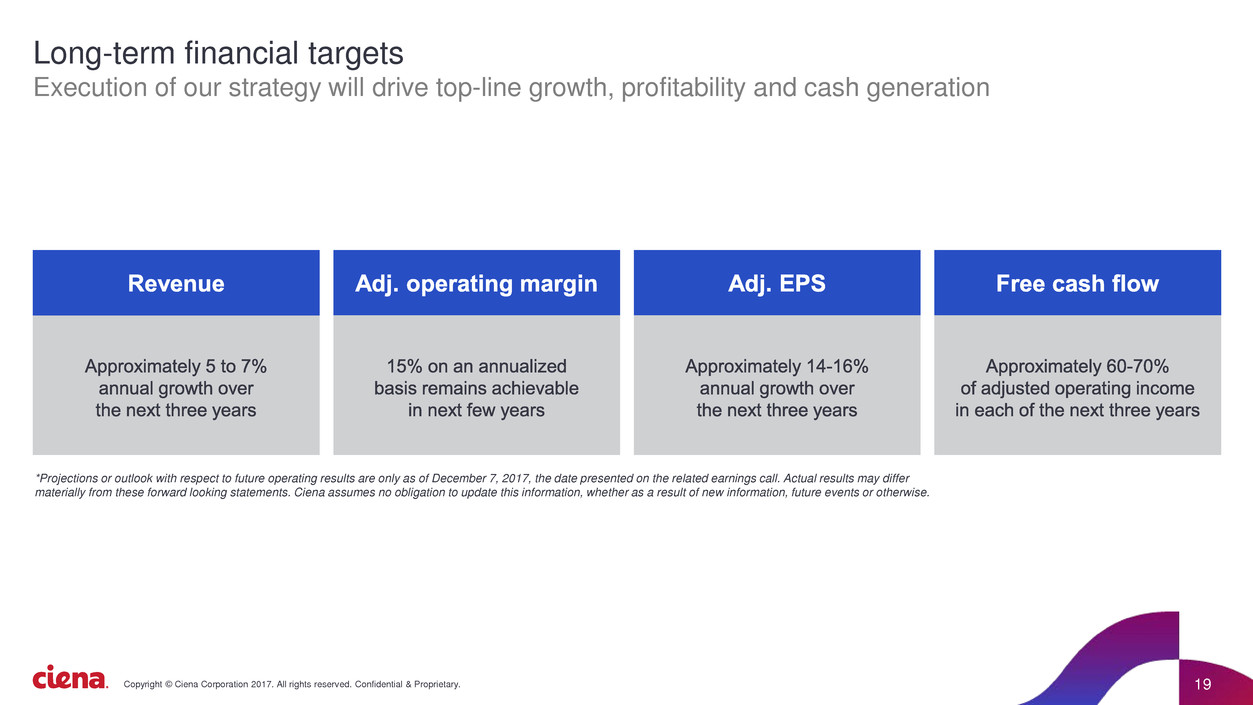
Long-term financial targets
Ciena’s strategic drivers play a key role in our performance
Optical Systems
Attached Services
Packet Networking
Software and Related Services
Components
*Projections or outlook with respect to future operating results are only as of December 7, 2017, the date presented on the related earnings call. Actual results may differ
materially from these forward looking statements. Ciena assumes no obligation to update this information, whether as a result of new information, future events or otherwise.
**Projection indicates goal by the end of the next three fiscal years
Copyright © Ciena Corporation 2017. All rights reserved. Confidential & Proprietary. 19
Long-term financial targets
Execution of our strategy will drive top-line growth, profitability and cash generation
*Projections or outlook with respect to future operating results are only as of December 7, 2017, the date presented on the related earnings call. Actual results may differ
materially from these forward looking statements. Ciena assumes no obligation to update this information, whether as a result of new information, future events or otherwise.

Copyright © Ciena Corporation 2017. All rights reserved. Confidential & Proprietary. 20
Balance Sheet & Capital Allocation

Copyright © Ciena Corporation 2017. All rights reserved. Confidential & Proprietary. 21
Strengthening balance sheet
Ciena has made significant improvements since 2014
Convertible Debt
Net Cash / (Debt)
Gross
Debt-to-EBITDA
leverage ratio
Ratings Agency
Upgrades

Copyright © Ciena Corporation 2017. All rights reserved. Confidential & Proprietary. 22
Capital allocation priorities
Ciena is proactively managing dilution and taking steps to return capital to shareholders
Debt Exchange Offer
Stock Buyback
Business Expansion

Copyright © Ciena Corporation 2017. All rights reserved. Confidential & Proprietary. 23
Q4’17 Financials

Copyright © Ciena Corporation 2017. All rights reserved. Confidential & Proprietary. 24
Q4 Fiscal 2017 Financial Highlights
* A reconciliation of these non-GAAP measures to our GAAP results is included in the appendix to this presentation.

Copyright © Ciena Corporation 2017. All rights reserved. Confidential & Proprietary. 25
Q4 Fiscal 2017 Comparisons (Year-over-Year)
45.2%
44.2%
Adj. Gross Margin*
Q4'16 Q4'17
$716.2 $744.4
Revenue
Q4'16 Q4'17
12.8%
11.9%
Adj. Operating Margin*
Q4'16 Q4'17
* A reconciliation of these non-GAAP measures to our GAAP results is included in the appendix to this presentation.
Copyright © Ciena Corporation 2017. All rights reserved. Confidential & Proprietary. 26
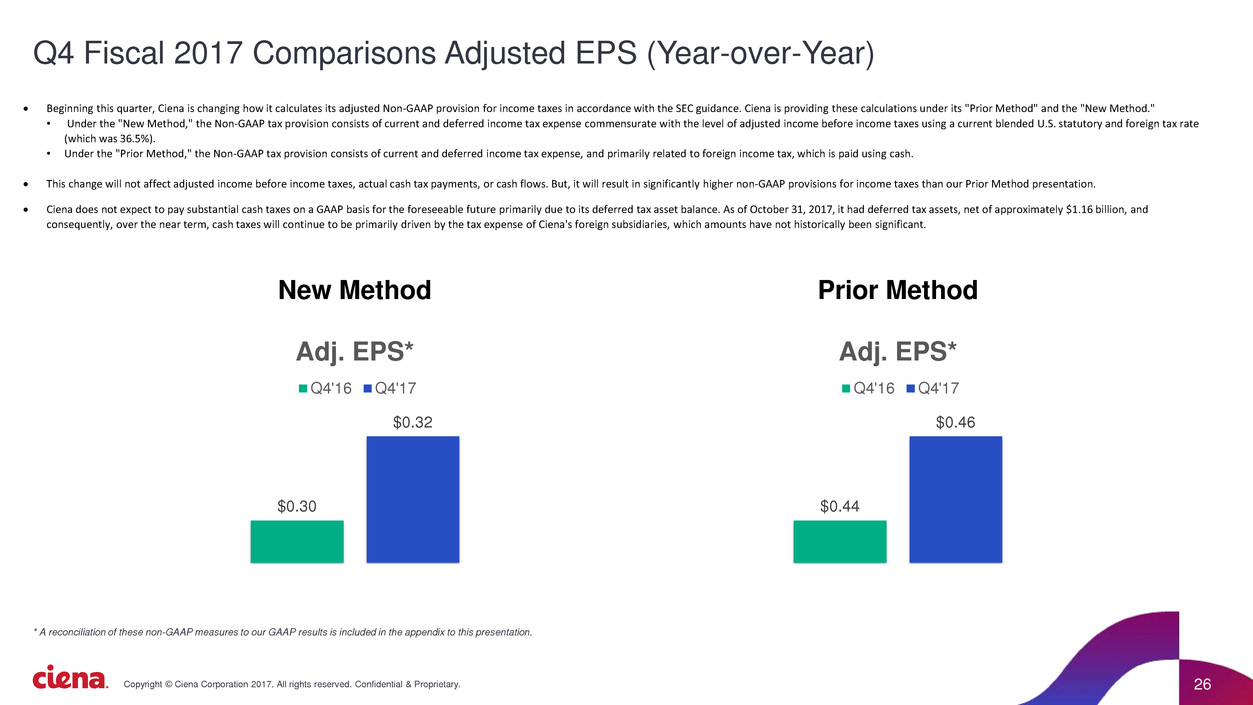
Q4 Fiscal 2017 Comparisons Adjusted EPS (Year-over-Year)
$0.30
$0.32
Adj. EPS*
Q4'16 Q4'17
New Method
$0.44
$0.46
Adj. EPS*
Q4'16 Q4'17
Prior Method
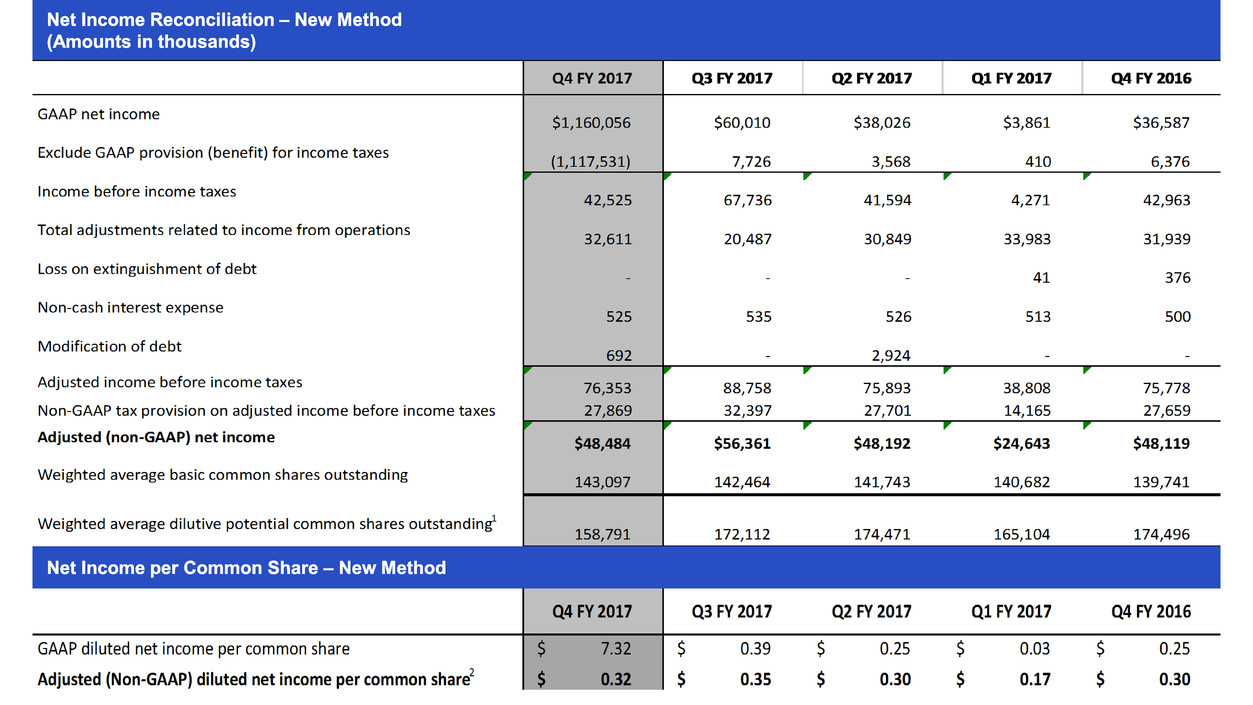
• Beginning this quarter, Ciena is changing how it calculates its adjusted Non-GAAP provision for income taxes in accordance with the SEC guidance. Ciena is providing these calculations under its "Prior Method" and the "New Method."
• Under the "New Method," the Non-GAAP tax provision consists of current and deferred income tax expense commensurate with the level of adjusted income before income taxes using a current blended U.S. statutory and foreign tax rate
(which was 36.5%).
• Under the "Prior Method," the Non-GAAP tax provision consists of current and deferred income tax expense, and primarily related to foreign income tax, which is paid using cash.
• This change will not affect adjusted income before income taxes, actual cash tax payments, or cash flows. But, it will result in significantly higher non-GAAP provisions for income taxes than our Prior Method presentation.
• Ciena does not expect to pay substantial cash taxes on a GAAP basis for the foreseeable future primarily due to its deferred tax asset balance. As of October 31, 2017, it had deferred tax assets, net of approximately $1.16 billion, and
consequently, over the near term, cash taxes will continue to be primarily driven by the tax expense of Ciena's foreign subsidiaries, which amounts have not historically been significant.
* A reconciliation of these non-GAAP measures to our GAAP results is included in the appendix to this presentation.

Copyright © Ciena Corporation 2017. All rights reserved. Confidential & Proprietary. 27
Q4 Fiscal 2017 Balance Sheet and Operating Metrics
DSO

Copyright © Ciena Corporation 2017. All rights reserved. Confidential & Proprietary. 28
Q4 Fiscal 2017 Comparisons (Revenue by Segment)
(in millions)
$598.9 $592.3 $566.2
$41.8 $42.3
$37.6
$103.7 $94.1
$112.4
$0.0
$100.0
$200.0
$300.0
$400.0
$500.0
$600.0
$700.0
$800.0
Q4'17 Q3'17 Q4'16
Networking Platforms Software & Software-Related Services Global Services

Copyright © Ciena Corporation 2017. All rights reserved. Confidential & Proprietary. 29
Q4 Fiscal 2017 Revenue by Segment
(Amounts in millions)
Q4 FY 2017 Q3 FY 2017 Q4 FY 2016
Revenue %* Revenue %* Revenue %*
Networking Platforms
Converged Packet Optical $504.7 67.8 $506.5 69.5 $488.0 68.1
Packet Networking 92.5 12.5 82.1 11.3 72.4 10.1
Optical Transport 1.7 0.2 3.7 0.5 5.8 0.8
Total Networking Platforms 598.9 80.5 592.3 81.3 566.2 79.0
Software and Software-Related Services
Software Platforms 17.3 2.3 18.4 2.5 16.3 2.3
Software-Related Services 24.5 3.3 23.9 3.3 21.3 3.0
Total Software and Software-
41.8 5.6 42.3 5.8 37.6 5.3Related Services
Global Services
Maintenance Support and Training 56.2 7.5 57.9 7.9 59.8 8.3
Installation and Deployment 33.5 4.5 27.4 3.8 38.6 5.4
Consulting and Network Design 14.0 1.9 8.8 1.2 14.0 2.0
Total Global Services 103.7 13.9 94.1 12.9 112.4 15.7
Total $744.4 100.0% $728.7 100.0% $716.2 100.0%
* Denotes % of total revenue

Copyright © Ciena Corporation 2017. All rights reserved. Confidential & Proprietary. 30
U.S. and International Revenue
(Amounts in millions)
Revenue
Q4 FY 2017 Q3 FY 2017 Q2 FY 2017 Q1 FY 2017 Q4 FY 2016
United States $418.2 $438.1 $392.0 $379.7 $436.9
International $326.2 $290.6 $315.0 $241.8 $279.3
Total $744.4 $728.7 $707.0 $621.5 $716.2
% of Total Revenue
Q4 FY 2017 Q3 FY 2017 Q2 FY 2017 Q1 FY 2017 Q4 FY 2016
United States 56.2% 60.1% 55.4% 61.1% 61.0%
International 43.8% 39.9% 44.6% 38.9% 39.0%
Total 100.0% 100.0% 100.0% 100.0% 100.0%

Copyright © Ciena Corporation 2017. All rights reserved. Confidential & Proprietary. 31
Q4 Fiscal 2017 Revenue by Geographic Region
59.2%
14.9%
5.8%
20.1%
North America
Europe, Middle East and Africa
Caribbean and Latin America
Asia Pacific
Copyright © Ciena Corporation 2017. All rights reserved. Confidential & Proprietary. 32
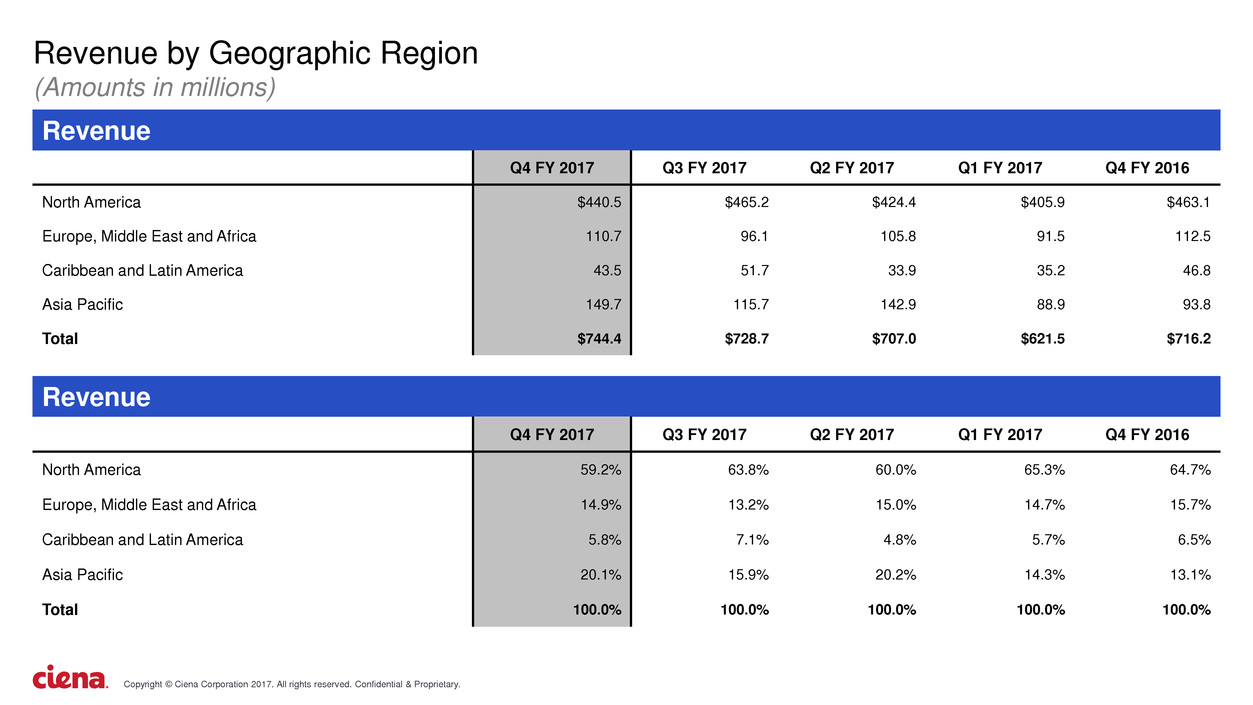
Revenue by Geographic Region
(Amounts in millions)
Revenue
Q4 FY 2017 Q3 FY 2017 Q2 FY 2017 Q1 FY 2017 Q4 FY 2016
North America $440.5 $465.2 $424.4 $405.9 $463.1
Europe, Middle East and Africa 110.7 96.1 105.8 91.5 112.5
Caribbean and Latin America 43.5 51.7 33.9 35.2 46.8
Asia Pacific 149.7 115.7 142.9 88.9 93.8
Total $744.4 $728.7 $707.0 $621.5 $716.2
Revenue
Q4 FY 2017 Q3 FY 2017 Q2 FY 2017 Q1 FY 2017 Q4 FY 2016
North America 59.2% 63.8% 60.0% 65.3% 64.7%
Europe, Middle East and Africa 14.9% 13.2% 15.0% 14.7% 15.7%
Caribbean and Latin America 5.8% 7.1% 4.8% 5.7% 6.5%
Asia Pacific 20.1% 15.9% 20.2% 14.3% 13.1%
Total 100.0% 100.0% 100.0% 100.0% 100.0%

Copyright © Ciena Corporation 2017. All rights reserved. Confidential & Proprietary. 33
Convertible Debt Overview

Copyright © Ciena Corporation 2017. All rights reserved. Confidential & Proprietary. 34
(1) On August 2, 2017, a portion of our 3.75% Senior Convertible Notes due October 15, 2018 (Issued 10/18/2010) (the “Original 2018 Notes”) were exchanged by the holders thereof for 3.75% Senior Convertible Notes due October 15, 2018 (Issued 8/2/2017) (the “New 2018 Notes”). The
New 2018 Notes give Ciena the option, at its election, to settle conversions of such notes for cash, shares of its common stock, or a combination of cash and shares. Except with respect to the additional cash settlement options upon conversion, the New 2018 Notes have substantially the
same terms as the Original 2018 Notes.
(2) Description of Diluted EPS Methodologies:
Treasury Stock Method - Convertible debt instruments that may be settled entirely or partly in cash (such as the New 2018 Notes) may, in certain circumstances where the borrower has the ability and intent to settle in cash, be accounted for utilizing the Treasury Stock Method. Under this
method, the underlying shares issuable upon conversion of the notes (the “Underlying Shares”) are excluded from the calculation of diluted EPS, except to the extent that the Conversion Value (as defined on the following slide) of the notes exceeds their par value. No adjustment is made to
the EPS numerator for interest expense recorded. It is Ciena’s current intent, as of the date of this presentation, that upon conversion of the New 2018 Notes, the principal amount of these notes will be settled in cash, and therefore Ciena intends to use the Treasury Stock Method with
respect to these notes in its diluted EPS calculation. See the following slide for an illustration of this method at varying stock prices and the “Additional EPS Shares” that would be included in calculating diluted EPS.
If-Converted Method – Convertible debt instruments that must be settled in shares (such as the Original 2018 Notes and the 4.0% Convertible Senior Notes due December 15, 2020) are accounted for under the If-Converted Method. Under this method, diluted EPS is computed assuming
the conversion of the notes at the beginning of the reporting period. Ciena adds back to the EPS numerator the recorded interest expense, net of tax, applicable to the notes for the relevant reporting period, and adds the Underlying Shares to the denominator to compute EPS under this
method; provided that such adjustments do not increase diluted EPS. If such adjustments increase diluted EPS, then diluted EPS is computed with the interest expense as recorded and without any Additional EPS Shares for the Underlying Shares of such notes.
(3) Computed for illustrative purposes using the Treasury Stock Method based on Ciena’s $22.74 average price per share during its fiscal fourth quarter. See the following slide for an illustration of the a calculation of Additional EPS Shares at varying stock prices.
NOTE: Net income, earnings per share and stock price assumptions in these materials are for illustrative purposes only and for the sole purpose of further explaining how diluted EPS is calculated in regard to Ciena’s convertible notes. Such metrics do not reflect Ciena’s business outlook.
Ciena makes no assumptions as to whether or when it could achieve the relevant metrics provided in this presentation.
Outstanding Convertible Notes Par Value (in thousands)
Underlying
Shares
(in thousands)
Conversion
Price
Additional Shares
In Diluted EPS
Calculation
(in thousands)
Quarterly Interest
Expense Net of Tax
(in thousands)
Diluted EPS
Methodology(2)
Memo:
Ciena’s quarterly net income must be
equal to or greater than the below amounts
for the Underlying Shares to be included
in Diluted EPS Calculation
(in thousands)
3.75% Senior Convertible Notes due October 15, 2018
(Issued 8/2/2017)(1)
$ 288,730 14,318 $ 20.17 1,616(3) N/A Treasury Stock Method N/A
3.75% Senior Convertible Notes due October 15, 2018
(Issued 10/18/2010)(1)
$ 61,270 3,038 $ 20.17 3,038 $ 399 If-Converted Method $ 19,166
4.0% Convertible Senior Notes due December 15, 2020 $ 187,500 9,198 $ 20.39 9,198 $ 2,217 If-Converted Method $ 35,502
Total $ 537,500 26,554 13,852 $ 2,616
Convertible Notes and Diluted Earnings Per Share (EPS) Analysis (GAAP)

Copyright © Ciena Corporation 2017. All rights reserved. Confidential & Proprietary. 35
Average Stock
Price Per Share
A
Below $20.17
21
22
23
24
25
26
27
28
29
30
31
32
33
34
$ 35
Underlying
Shares
B
Additional Shares in
Diluted EPS Calculation
(Additional EPS Shares)
E÷A
Conversion
Value
C = (A * B)
Par
Value
D
Conversion Value in
Excess of Par Value
E = (C - D)
14,318
14,318
14,318
14,318
14,318
14,318
14,318
14,318
14,318
14,318
14,318
14,318
14,318
14,318
14,318
14,318
N/A
$ 300,678
314,996
329,314
343,632
357,950
372,268
386,586
400,904
415,222
429,540
443,858
458,176
472,494
486,812
$ 501,130
N/A
288,730
288,730
288,730
288,730
288,730
288,730
288,730
288,730
288,730
288,730
288,730
288,730
288,730
288,730
288,730
-
569
1,194
1,765
2,288
2,769
3,213
3,624
4,006
4,362
4,694
5,004
5,295
5,569
5,826
6,069
N/A
$ 11,948
26,266
40,584
54,902
69,220
83,538
97,856
112,174
126,492
140,810
155,128
169,446
183,764
198,082
$ 212,400
Illustrative Treasury Stock Method for New 2018 Notes
The following table (in thousands, except Stock Price Per Share) illustrates the treatment of Ciena’s New 2018 Notes in calculating diluted EPS in the future based on various hypothetical stock prices and using the Treasury Stock Method. The range of
stock prices listed in the table are for illustrative purposes only. Additional EPS Shares would be issuable at Ciena stock prices above $35 per share with the calculation of such Additional EPS Shares to be determined using the same formula below. The
actual number of shares of common stock, if any, issuable by Ciena upon conversion of any notes, will be governed by the terms of the indenture applicable to such notes.

Copyright © Ciena Corporation 2017. All rights reserved. Confidential & Proprietary. 36
Q4 Fiscal 2017 Appendix

Copyright © Ciena Corporation 2017. All rights reserved. Confidential & Proprietary. 37
Q4 FY 2017 Q3 FY 2017 Q2 FY 2017 Q1 FY 2017 Q4 FY 2016
GAAP gross profit $325,685 $328,076 $318,240 $273,785 $318,548
Share-based compensation-products 694 709 708 561 612
Share-based compensation-services 561 619 679 628 557
Amortization of intangible assets 2,332 2,417 3,623 4,313 4,320
Total adjustments related to gross profit 3,587 3,745 5,010 5,502 5,489
Adjusted (non-GAAP) gross profit $329,272 $331,821 $323,250 $279,287 $324,037
Adjusted (non-GAAP) gross margin 44.2% 45.5% 45.7% 44.9% 45.2%

Copyright © Ciena Corporation 2017. All rights reserved. Confidential & Proprietary. 38
Q4 FY 2017 Q3 FY 2017 Q2 FY 2017 Q1 FY 2017 Q4 FY 2016
GAAP income from operations $55,799 $81,999 $57,820 $19,104 $59,673
Total adjustments related to gross profit 3,587 3,745 5,010 5,502 5,489
Total adjustments related to operating expense 29,024 16,742 25,839 28,481 26,450
Total adjustments related to income from operations 32,611 20,487 30,849 33,983 31,939
Adjusted (non-GAAP) income from operations $88,410 $102,486 $88,669 $53,087 $91,612
Adjusted (non-GAAP) operating margin 11.9% 14.1% 12.5% 8.5% 12.8%
Copyright © Ciena Corporation 2017. All rights reserved. Confidential & Proprietary. 39

Copyright © Ciena Corporation 2017. All rights reserved. Confidential & Proprietary. 40

Copyright © Ciena Corporation 2017. All rights reserved. Confidential & Proprietary. 41
•
•
•
•
•
•
•
•

Copyright © Ciena Corporation 2017. All rights reserved. Confidential & Proprietary. 42
•
•
•
•
•
•
•
Copyright © Ciena Corporation 2017. All rights reserved. Confidential & Proprietary. 43
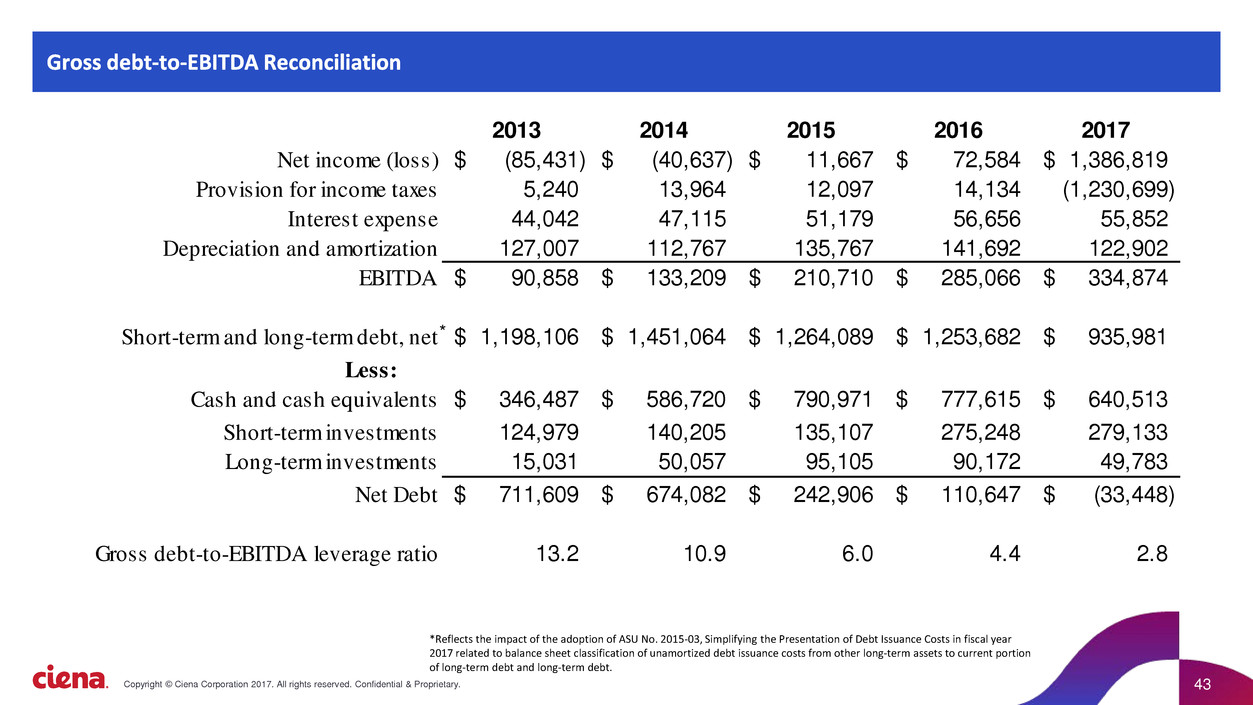
2013 2014 2015 2016 2017
Net income (loss) (85,431)$ (40,637)$ 11,667$ 72,584$ 1,386,819$
Provision for income taxes 5,240 13,964 12,097 14,134 (1,230,699)
Interest expense 44,042 47,115 51,179 56,656 55,852
Depreciation and amortization 127,007 112,767 135,767 141,692 122,902
EBITDA 90,858$ 133,209$ 210,710$ 285,066$ 334,874$
Short-term and long-term debt, net 1,198,106$ 1,451,064$ 1,264,089$ 1,253,682$ 935,981$
Less:
Cash and cash equivalents 346,487$ 586,720$ 790,971$ 777,615$ 640,513$
Short-term investments 124,979 140,205 135,107 275,248 279,133
Long-term investments 15,031 50,057 95,105 90,172 49,783
Net Debt 711,609$ 674,082$ 242,906$ 110,647$ (33,448)$
Gross debt-to-EBITDA leverage ratio 13.2 10.9 6.0 4.4 2.8
*Reflects the impact of the adoption of ASU No. 2015-03, Simplifying the Presentation of Debt Issuance Costs in fiscal year
2017 related to balance sheet classification of unamortized debt issuance costs from other long-term assets to current portion
of long-term debt and long-term debt.
*

44Copyright © Ciena Corporation 2017. All rights reserved. Confidential & Proprietary.
