Attached files
| file | filename |
|---|---|
| EX-99.1 - EXHIBIT 99.1 - B. Riley Financial, Inc. | s108351_ex99-1.htm |
| 8-K - 8-K - B. Riley Financial, Inc. | s108351_8k.htm |
Exhibit 99.2

December 2017 A Diversified Provider of Financial & Business Advisory Services NASDAQ:RILY
2 Safe Harbor Statement FORWARD LOOKING STATEMENTS Statements in this presentation that are not descriptions of historical facts are forward-looking statements that are based on management’s current expectations and assumptions and are subject to risks and uncertainties . If such risks or uncertainties materialize or such assumptions prove incorrect, our business, operating results, financial condition and stock price could be materially negatively affected . In some cases, you can identify forward - looking statements by terminology including “anticipates,” “believes,” “can,” “continue,” “could,” “estimates,” “expects,” “intends,” “may,” “plans,” “potential,” “predicts,” “should,” “will,” “would” or the negative of these terms or other comparable terminology . You should not place undue reliance on such forward-looking statements, which are based on the information currently available to us and speak only as of the date of this presentation . Such forward looking statements include, but are not limited to, express or implied statements regarding future financial performance and future dividends, the effects of our business model, the effects of our balance sheet on our ability to pursue business opportunities, the effects and anticipated benefits of our completed and pending acquisitions and related actions, expectations regarding future transactions and the financial impact, size and consistency of returns and timing thereof, expectations regarding market dynamics, as well as statements regarding the effect of investments in our business segments . Because these forward - looking statements involve known and unknown risks and uncertainties, there are important factors that could cause actual results, events or developments to differ materially from those expressed or implied by these forward - looking statements . Such factors include risks associated with large engagements in our Auction and Liquidation segment ; the contemplated acquisition of m agicJack VocalTec Ltd . including our ability to achieve expected cost savings or other benefits with respect to our completed and pending acquisitions, in each case within expected time frames or at all ; our ability to consummate anticipated transactions and the expected financial impact thereof, in each case within the expected timeframes or at all ; our ability to successfully integrate acquisitions ; loss of key personnel ; our ability to manage growth ; the potential loss of financial institution clients ; the timing of completion of significant engagements ; and those risks described from time to time in B . Riley Financial, Inc . 's filings with the SEC, including, without limitation, the risks described in B . Riley Financial, Inc . 's Annual Report on Form 10 - K for the year ended December 31 , 2016 under the captions "Risk Factors" and "Management's Discussion and Analysis of Financial Condition and Results of Operations . " Additional information is also set forth in our Quarterly Report on Form 10 - Q for the quarter ended September 30 , 2017 . These factors should be considered carefully and readers are cautioned not to place undue reliance on such forward - looking statements . All information is current as of the date this presentation is issued, and B . Riley Financial, Inc . undertakes no duty to update this information . We have filed a registration statement (including a prospectus) with the SEC for the offering to which this presentation relates . Before you invest in such offering, you should read the prospectus in that registration statement, the prospectus supplement for the offering and other documents we have filed with the SEC for more complete information about us and the offering . You may get these documents for free by visiting EDGAR on the SEC Web site at www . sec . gov . Alternatively, we will arrange to send you the prospectus if you request it by calling 1 - 888 - 295 - 0155 . In particular, you should review the preliminary prospectus supplement that we have prepared in connection with the offering and the financial information included or incorporated by reference therein before you invest .
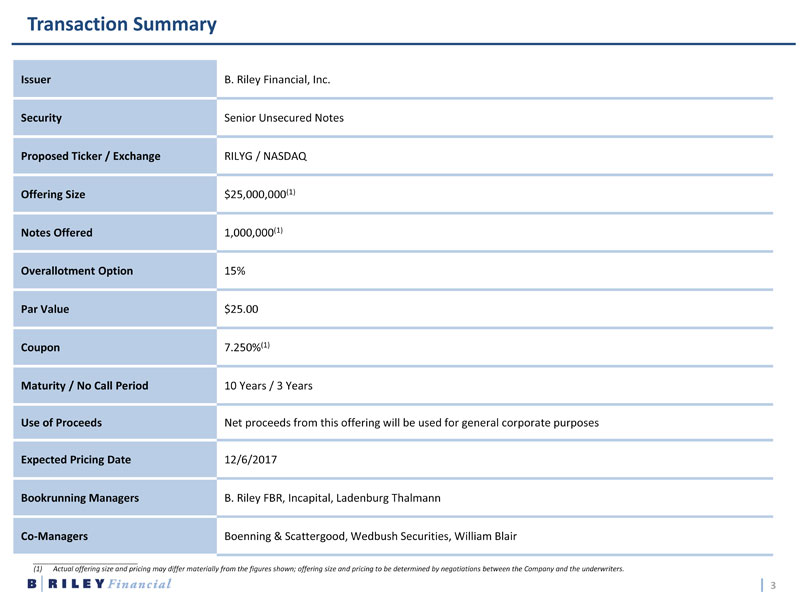
3 Issuer B. Riley Financial, Inc. Security Senior Unsecured Notes Proposed Ticker / Exchange RILYG / NASDAQ Offering Size $25,000,000 (1) Notes Offered 1,000,000 (1) Overallotment Option 15% Par Value $25.00 Coupon 7.250% (1) Maturity / No Call Period 10 Years / 3 Years Use of Proceeds Net proceeds from this offering will be used for general corporate purposes Expected Pricing Date 12/6/2017 Bookrunning Managers B. Riley FBR, Incapital , Ladenburg Thalmann Co - Managers Boenning & Scattergood, Wedbush Securities, William Blair ___________________________ (1) Actual offering size and pricing may differ materially from the figures shown; offering size and pricing to be determined by neg otiations between the Company and the underwriters. Transaction Summary
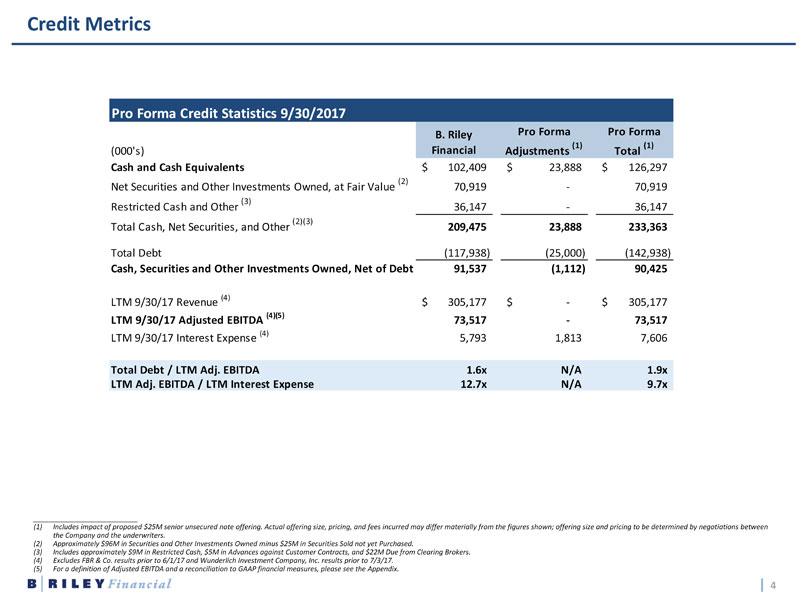
4 ___________________________ (1) Includes impact of proposed $25M senior unsecured note offering. Actual offering size, pricing, and fees incurred may differ materially from the figures shown; offering size and pricing to be determined by negotiations between the Company and the underwriters . (2) Approximately $96M in Securities and Other Investments Owned minus $25M in Securities S old not yet P urchased. (3) Includes approximately $9M in Restricted C ash , $5M in Advances against Customer C ontracts , and $22M Due from Clearing B rokers . (4) Excludes FBR & Co. results prior to 6/1/17 and Wunderlich Investment Company, Inc. results prior to 7/3/17 . (5) For a definition of Adjusted EBITDA and a reconciliation to GAAP financial measures, please see the Appendix. Credit Metrics Pro Forma Credit Statistics 9/30/2017 (000's) B. Riley Financial Pro Forma Adjustments (1) Pro Forma Total (1) Cash and Cash Equivalents 102,409$ 23,888$ 126,297$ Net Securities and Other Investments Owned, at Fair Value (2) 70,919 - 70,919 Restricted Cash and Other (3) 36,147 - 36,147 Total Cash, Net Securities, and Other (2)(3) 209,475 23,888 233,363 Total Debt (117,938) (25,000) (142,938) Cash, Securities and Other Investments Owned, Net of Debt 91,537 (1,112) 90,425 LTM 9/30/17 Revenue (4) 305,177$ -$ 305,177$ LTM 9/30/17 Adjusted EBITDA (4)(5) 73,517 - 73,517 LTM 9/30/17 Interest Expense (4) 5,793 1,813 7,606 Total Debt / LTM Adj. EBITDA 1.6x N/A 1.9x LTM Adj. EBITDA / LTM Interest Expense 12.7x N/A 9.7x
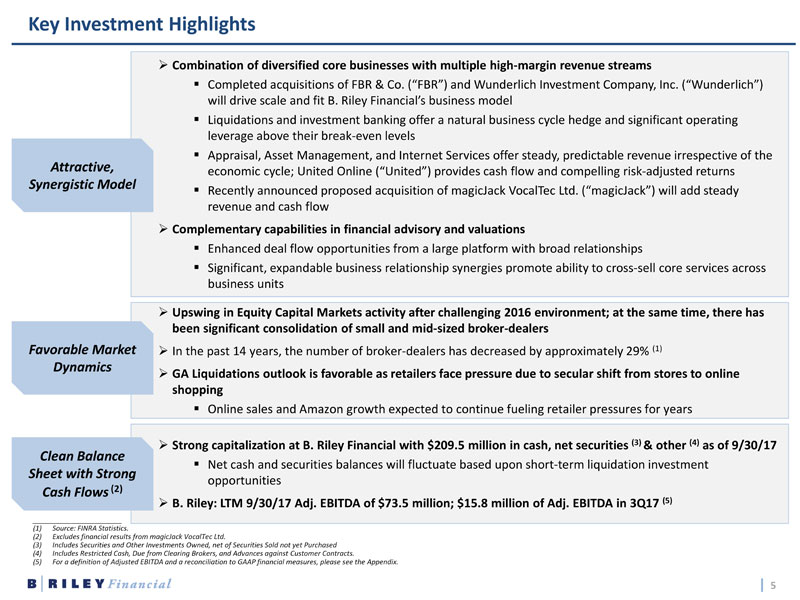
5 _______________________ (1) Source: FINRA Statistics. (2) Excludes financial results from magicJack VocalTec Ltd . (3) Includes Securities and Other Investments Owned, net of Securities S old not yet Purchased (4) Includes Restricted C ash , Due from Clearing B rokers , and Advances against C ustomer C ontracts . (5) For a definition of Adjusted EBITDA and a reconciliation to GAAP financial measures, please see the Appendix . » Strong capitalization at B. Riley Financial with $209.5 million in cash, net securities (3) & other (4) as of 9/30/17 ▪ Net cash and securities balances will fluctuate based upon short - term liquidation investment opportunities » B. Riley: LTM 9/30/17 Adj. EBITDA of $ 73.5 million; $ 15.8 million of Adj. EBITDA in 3Q17 (5) Clean Balance Sheet with Strong Cash Flows (2) » Combination of diversified core businesses with multiple high - margin revenue streams ▪ Completed acquisitions of FBR & Co. (“FBR”) and Wunderlich Investment Company, Inc. (“Wunderlich”) will drive scale and fit B. Riley Financial’s business model ▪ Liquidations and investment banking offer a natural business cycle hedge and significant operating leverage above their break - even levels ▪ Appraisal , Asset Management, and Internet Services offer steady, predictable revenue irrespective of the economic cycle; United Online (“United”) provides cash flow and compelling risk - adjusted returns ▪ Recently announced proposed acquisition of magicJack VocalTec Ltd. (“ magicJack ”) will add steady revenue and cash flow » Complementary capabilities in financial advisory and valuations ▪ Enhanced deal flow opportunities from a large platform with broad relationships ▪ Significant, expandable business relationship synergies promote ability to cross - sell core services across business units Attractive, Synergistic Model » Upswing in Equity Capital Markets activity after challenging 2016 environment; at the same time, there has been significant consolidation of small and mid - sized broker - dealers » In the past 14 years, the number of broker - dealers has decreased by approximately 29% (1) » GA Liquidations outlook is favorable as retailers face pressure due to secular shift from stores to online shopping ▪ Online sales and Amazon growth expected to continue fueling retailer pressures for years Favorable Market Dynamics Key Investment Highlights
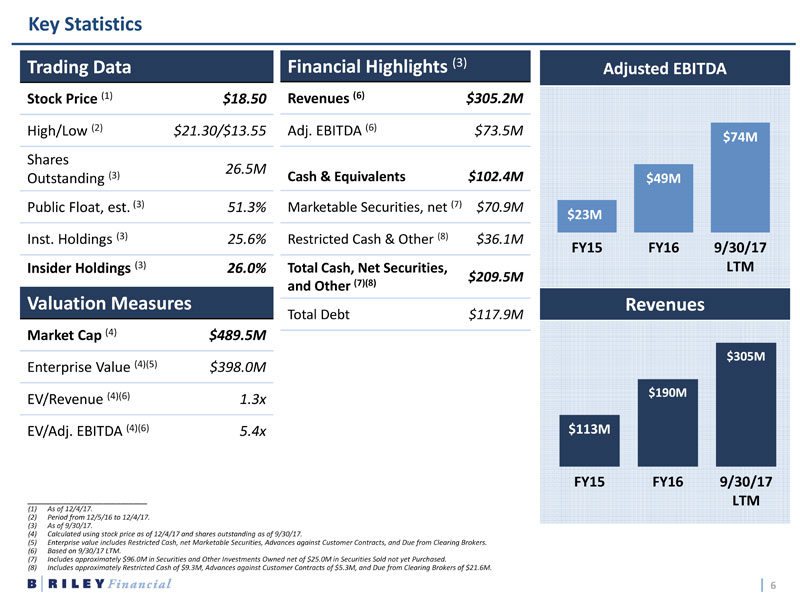
6 Key Statistics Trading Data Stock Price (1) $ 18.50 High/Low (2) $21.30/$ 13.55 Shares Outstanding (3) 26.5M Public Float, est . (3) 51.3% Inst. Holdings (3) 25.6% Insider Holdings (3) 26.0% Valuation Measures Market Cap (4) $ 489.5M Enterprise Value (4)(5) $398.0M EV/Revenue (4)(6) 1.3x EV/Adj. EBITDA (4)(6) 5.4x Financial Highlights (3) Revenues (6) $305.2M Adj. EBITDA (6) $ 73.5M Cash & Equivalents $ 102.4M Marketable Securities, net (7) $ 70.9M Restricted Cash & Other (8) $36.1M Total Cash, Net Securities, and Other (7)(8) $209.5M Total Debt $117.9M Adjusted EBITDA Revenues $23M $49M $74M FY15 FY16 9/30/17 LTM [VALU E] $190M $305M FY15 FY16 9/30/17 LTM ___________________________ (1) As of 12/4/17. (2) P eriod from 12/5/16 to 12/4/17 . (3) As of 9/30/17 . (4) Calculated using stock price as of 12/4/17 and shares outstanding as of 9/30/17. (5) Enterprise value includes Restricted C ash , net Marketable S ecurities , Advances a gainst C ustomer C ontracts , and Due from Clearing B rokers. (6) Based on 9/30/17 LTM. (7) Includes approximately $ 96.0M in Securities and Other Investments Owned net of $25.0M in Securities Sold not yet Purchased. (8) Includes approximately Restricted Cash of $9.3M, Advances against Customer Contracts of $5.3M, and Due from Clearing Brokers of $21.6M.
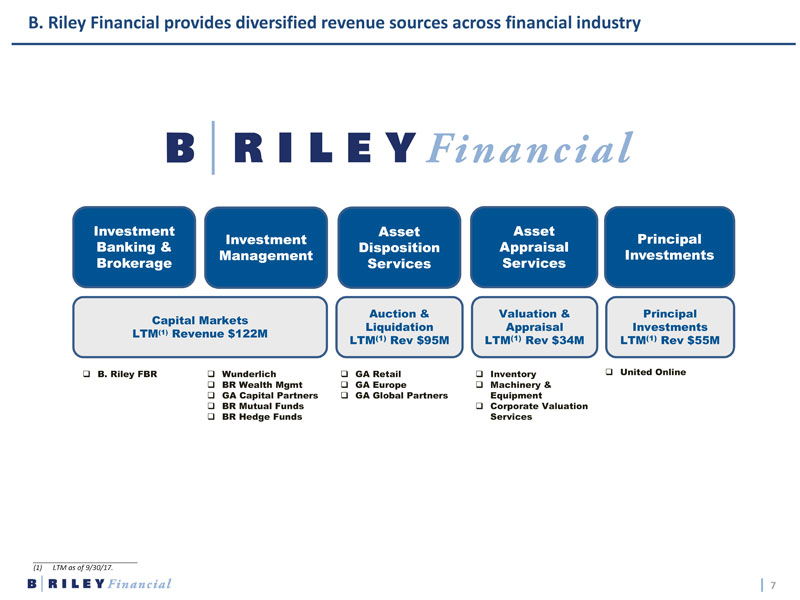
7 B. Riley Financial provides diversified revenue sources across financial industry Investment Banking & Brokerage Investment Management Asset Disposition Services Asset Appraisal Services Principal Investments Capital Markets LTM (1) Revenue $122M Auction & Liquidation LTM (1 ) Rev $95M Valuation & Appraisal LTM (1) Rev $34M Principal Investments LTM (1 ) Rev $55M □ B. Riley FBR □ Wunderlich □ BR Wealth Mgmt □ GA Capital Partners □ BR Mutual Funds □ BR Hedge Funds □ GA Retail □ GA Europe □ GA Global Partners □ Inventory □ Machinery & Equipment □ Corporate Valuation Services □ United Online ___________________________ (1) LTM as of 9/30/17.
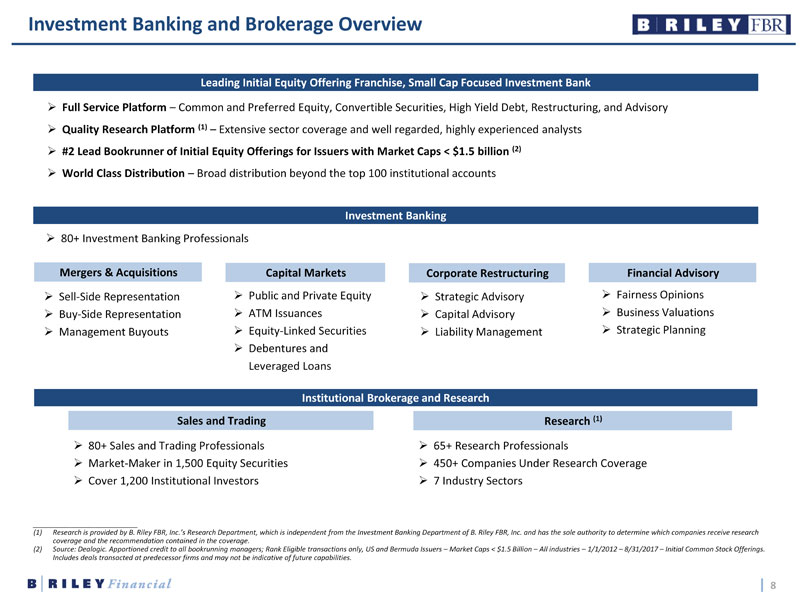
8 » Strategic Advisory » Capital Advisory » Liability Management Corporate Restructuring » Public and Private Equity » ATM Issuances » Equity - Linked Securities » Debentures and Leveraged Loans » Fairness Opinions » Business Valuations » Strategic Planning Financial Advisory » 80+ Sales and T rading P rofessionals » Market - Maker in 1,500 Equity Securities » Cover 1,200 Institutional Investors » 65+ Research Professionals » 450+ C ompanies Under R esearch C overage » 7 Industry Sectors » Full Service Platform – Common and Preferred Equity, Convertible Securities, High Yield Debt, Restructuring, and Advisory » Quality Research Platform (1) – Extensive sector coverage and well regarded, highly experienced analysts » #2 Lead Bookrunner of Initial Equity Offerings for Issuers with Market Caps < $1.5 billion (2) » World Class Distribution – Broad distribution beyond the top 100 institutional accounts Investment Banking and Brokerage Overview ___________________________ (1) Research is provided by B. Riley FBR, Inc.’s Research Department, which is independent from the Investment Banking Department of B. Riley FBR, Inc. and has the sole authority to determine which companies receive research coverage and the recommendation contained in the coverage. (2) Source : Dealogic. Apportioned credit to all bookrunning managers; Rank Eligible transactions only, US and Bermuda Issuers – Market Cap s < $1.5 Billion – All industries – 1/1/2012 – 8/31/2017 – Initial Common Stock Offerings. Includes deals transacted at predecessor firms and may not be indicative of future capabilities. Capital Markets Sales and Trading Research (1) Leading Initial Equity Offering Franchise, Small Cap Focused Investment Bank Investment Banking Institutional Brokerage and Research Mergers & Acquisitions » Sell - Side Representation » Buy - Side Representation » Management Buyouts » 80+ Investment Banking Professionals
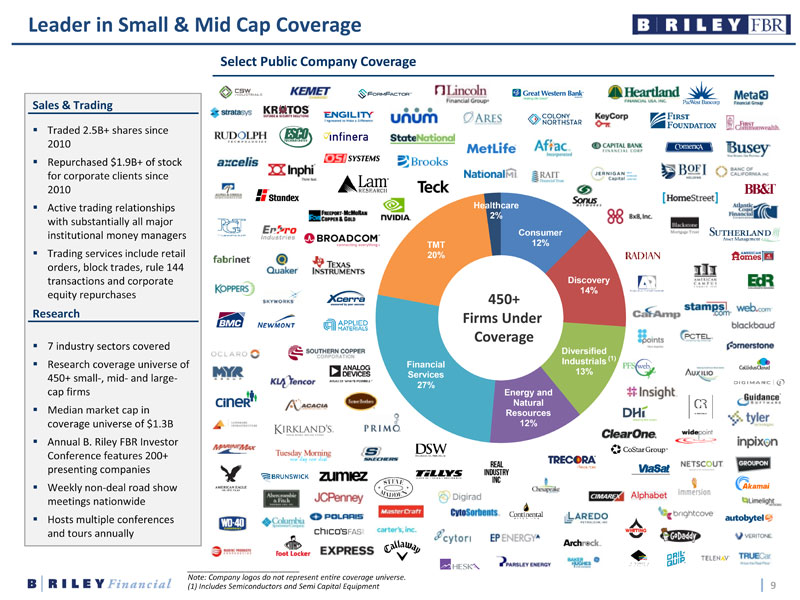
9 Consumer 12% Discovery 14% [CATEGORY NAME] [PERCENTAGE] Energy and Natural Resources 12% Financial Services 27% TMT 20% Healthcare 2% Sales & Trading ▪ Traded 2.5B+ shares since 2010 ▪ Repurchased $1.9B+ of stock for corporate clients since 2010 ▪ Active trading relationships with substantially all major institutional money managers ▪ Trading services include retail orders, block trades, rule 144 transactions and corporate equity repurchases Research ▪ 7 industry sectors covered ▪ Research coverage universe of 450 + small - , mid - and large - cap firms ▪ Median market cap in coverage universe of $1.3B ▪ Annual B. Riley FBR Investor Conference features 200+ presenting companies ▪ Weekly non - deal road show meetings nationwide ▪ Hosts multiple conferences and tours annually Select Public Company Coverage ___________________________ Note: Company logos do not represent entire coverage universe. (1) Includes Semiconductors and Semi Capital Equipment B. Riley & Co. Equities Capabilities 450 + Firms Under Coverage Leader in Small & Mid Cap Coverage (1)
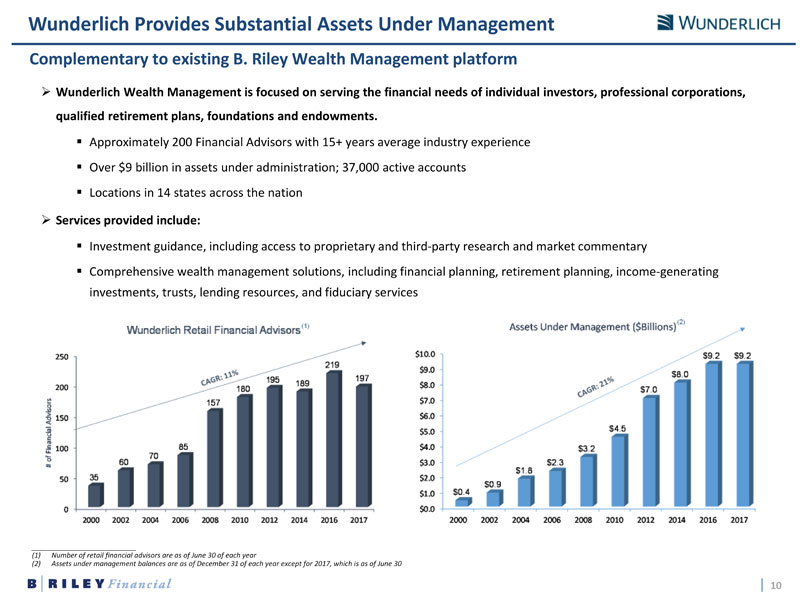
10 » Wunderlich Wealth Management is focused on serving the financial needs of individual investors, professional corporations, qualified retirement plans, foundations and endowments. ▪ Approximately 200 Financial Advisors with 15+ years average industry experience ▪ Over $9 billion in assets under administration; 37,000 active accounts ▪ Locations in 14 states across the nation » Services provided include: ▪ Investment guidance, including access to proprietary and third - party research and market commentary ▪ Comprehensive wealth management solutions, including financial planning, retirement planning, income - generating investments, trusts, lending resources, and fiduciary services Complementary to existing B. Riley Wealth Management platform Wunderlich Provides Substantial Assets Under Management ___________________________ (1) Number of retail financial advisors are as of June 30 of each year (2) Assets under management balances are as of December 31 of each year except for 2017, which is as of June 30 (1) (2) $0.0 $1.0 $2.0 $3.0 $4.0 $5.0 $6.0 $7.0 $8.0 $9.0 $10.0 2000 2002 2004 2006 2008 2010 2012 2014 2016 2017 $0.4 $0.9 $1.8 $2.3 $3.2 $4.5 $7.0 $8.0 $9.2 $9.2 Assets Under Management ($Billions) 0 50 100 150 200 250 2000 2002 2004 2006 2008 2010 2012 2014 2016 2017 35 60 70 85 157 180 195 189 219 197 # of Financial Advisors Wunderlich Retail Financial Advisors
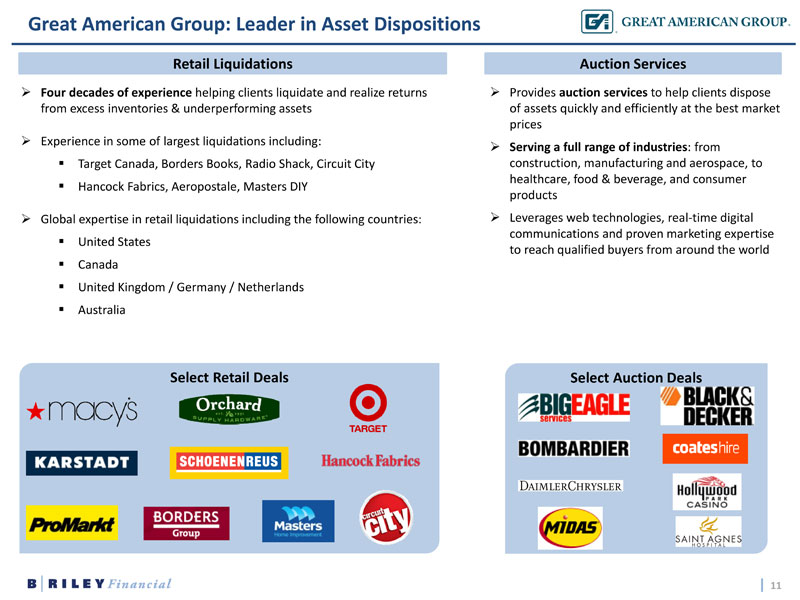
11 Retail Liquidations Auction Services » Four decades of experience helping clients liquidate and realize returns from excess inventories & underperforming assets » Experience in some of largest liquidations including: ▪ Target Canada, Borders Books, Radio Shack, Circuit City ▪ Hancock Fabrics, Aeropostale, Masters DIY » Global expertise in retail liquidations including the following countries: ▪ United States ▪ Canada ▪ United Kingdom / Germany / Netherlands ▪ Australia » P rovides auction services to help clients dispose of assets quickly and efficiently at the best market prices » Serving a full range of industries : from construction, manufacturing and aerospace, to healthcare, food & beverage, and consumer products » L everages web technologies, real - time digital communications and proven marketing expertise to reach qualified buyers from around the world Select Retail Deals Select Auction Deals Great American Group: Leader in Asset Dispositions
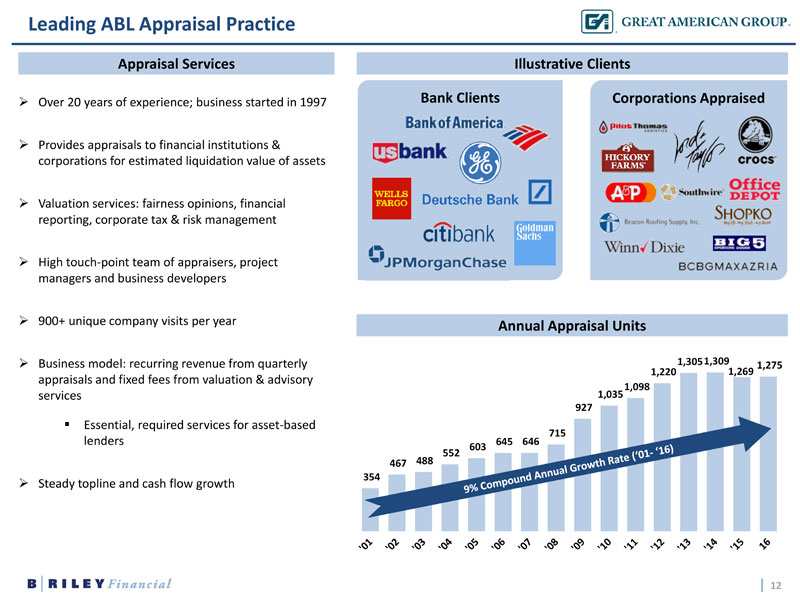
12 Bank Clients Corporations Appraised 354 467 488 552 603 645 646 715 927 1,035 1,098 1,220 1,305 1,309 1,269 1,275 Illustrative Clients Annual Appraisal Units » Over 20 years of experience; business started in 1997 » Provides appraisals to financial institutions & corporations for estimated liquidation value of assets » Valuation services: fairness opinions, financial reporting, corporate tax & risk management » High touch - point team of appraisers, project managers and business developers » 900+ unique company visits per year » Business model: recurring revenue from quarterly appraisals and fixed fees from valuation & advisory services ▪ Essential, required services for asset - based lenders » Steady topline and cash flow growth Leading ABL Appraisal Practice Appraisal Services
13 Provider of asset based financing to liquidity constrained companies SELECT TRANSACTIONS Great American Capital Partners » GACP manages a direct lending fund ($150+ million) focused on providing financing to asset - rich companies seeking capital in addition to traditional debt » Proprietary business leveraging GA’s deep experience in liquidation values and asset appraisals across a spectrum of industries » Typical loans are senior secured, first or second lien loans; may be issued in combination with first - out senior bank ABL lender s » Underwriting analysis based upon recovery from liquidating assets typically in bankruptcy process
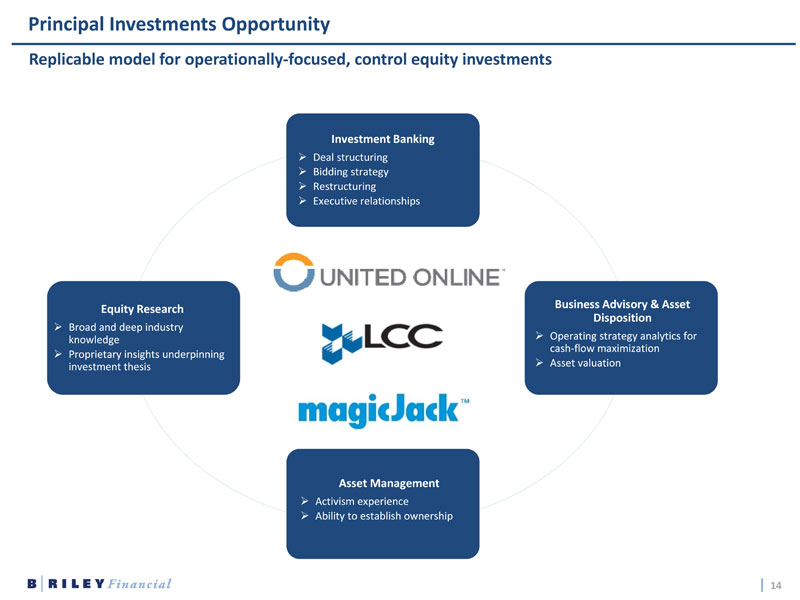
14 Investment Banking » Deal structuring » Bidding strategy » Restructuring » Executive relationships Business Advisory & Asset Disposition » Operating strategy analytics for cash - flow maximization » Asset valuation Asset Management » Activism experience » Ability to establish ownership Equity Research » Broad and deep industry knowledge » Proprietary insights underpinning investment thesis Principal Investments Opportunity Replicable model for operationally - focused, control equity investments
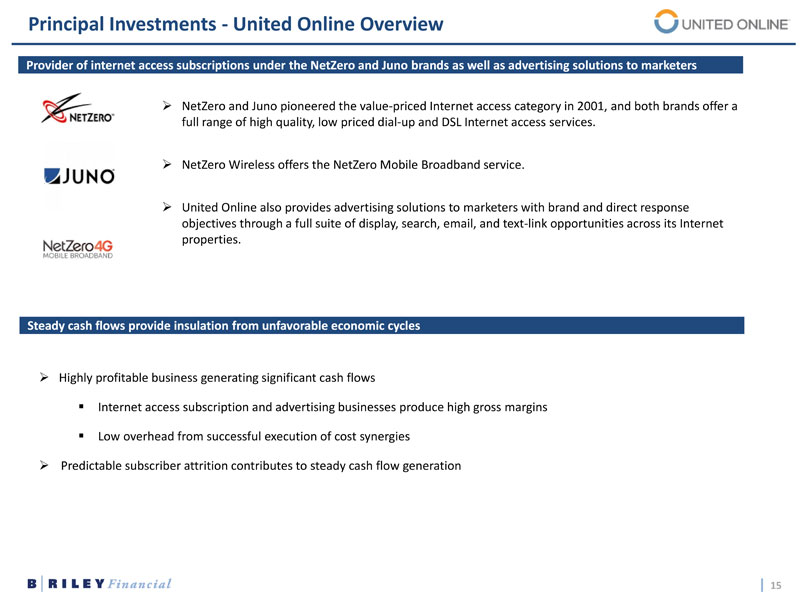
15 Principal Investments - United Online Overview » NetZero and Juno pioneered the value - priced Internet access category in 2001, and both brands offer a full range of high quality, low priced dial - up and DSL Internet access services. » NetZero Wireless offers the NetZero Mobile Broadband service. » United Online also provides advertising solutions to marketers with brand and direct response objectives through a full suite of display, search, email, and text - link opportunities across its Internet properties. Provider of internet access subscriptions under the NetZero and Juno brands as well as advertising solutions to marketers Steady cash flows provide insulation from unfavorable economic cycles » Highly profitable business generating significant cash flows ▪ Internet access subscription and advertising businesses produce high gross margins ▪ Low overhead from successful execution of cost synergies » Predictable subscriber attrition contributes to steady cash flow generation
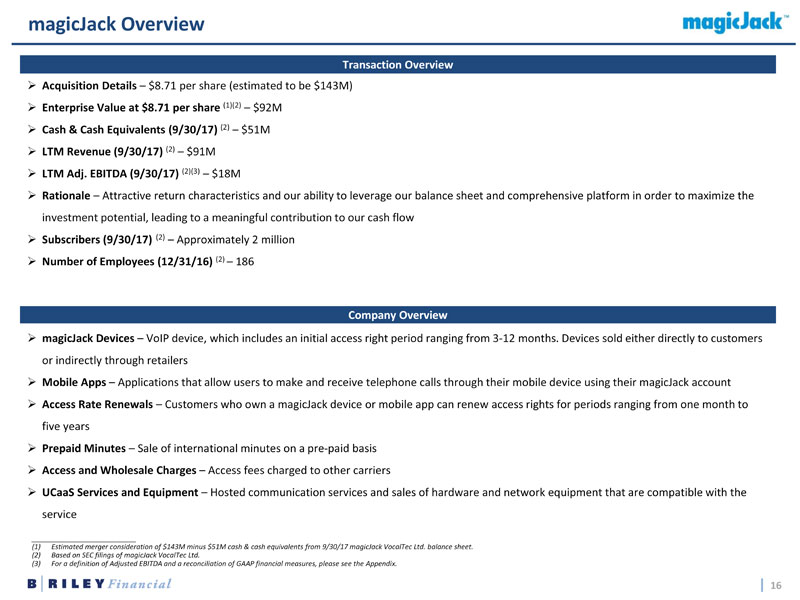
16 » magicJack Devices – VoIP device, which includes an initial access right period ranging from 3 - 12 months. Devices sold either directly to customers or indirectly through retailers » Mobile Apps – Applications that allow users to make and receive telephone calls through their mobile device using their magicJack account » Access Rate Renewals – Customers who own a magicJack device or mobile app can renew access rights for periods ranging from one month to five years » Prepaid Minutes – Sale of international minutes on a pre - paid basis » Access and Wholesale Charges – Access fees charged to other carriers » UCaaS Services and Equipment – Hosted communication services and sales of hardware and network equipment that are compatible with the service m agicJack Overview Company Overview Transaction Overview » Acquisition Details – $8.71 per share (estimated to be $143M) » Enterprise Value at $8.71 per share (1 )(2) – $ 92M » Cash & Cash Equivalents (9/30/17) ( 2) – $ 51M » LTM Revenue (9/30/17) (2 ) – $91M » LTM Adj. EBITDA (9/30/17) (2)(3) – $18M » Rationale – Attractive return characteristics and our ability to leverage our balance sheet and comprehensive platform in order to maximi z e the investment potential, leading to a meaningful contribution to our cash flow » Subscribers (9/30/17) (2) – Approximately 2 million » Number of Employees (12/31/16) ( 2 ) – 186 ___________________________ (1) Estimated merger consideration of $143M minus $51M cash & cash equivalents from 9/30/17 magicJack VocalTec Ltd. balance sheet. (2) Based on SEC filings of magicJack VocalTec Ltd. (3) For a definition of Adjusted EBITDA and a reconciliation of GAAP financial measures, please see the Appendix.

FINANCIAL OVERVIEW
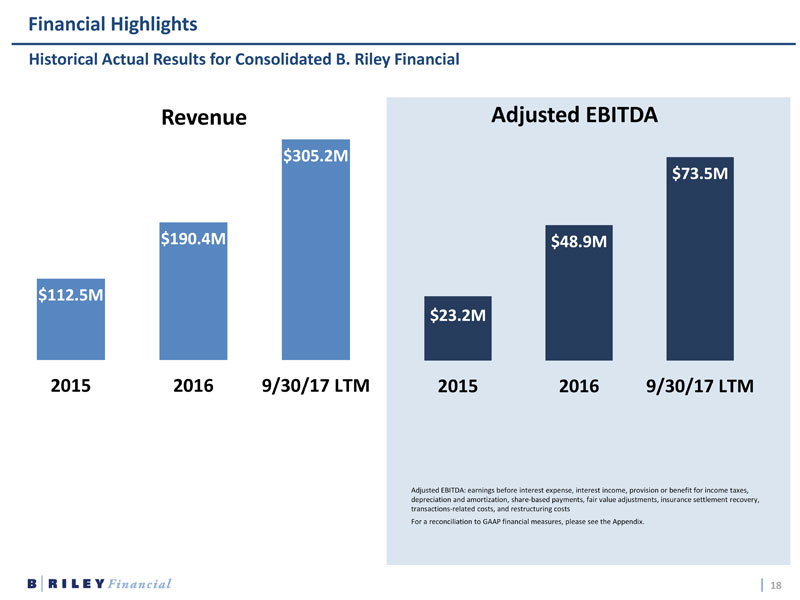
18 Financial Highlights $112.5M $190.4M $305.2M 2015 2016 9/30/17 LTM Revenue $23.2M $48.9M $73.5M 2015 2016 9/30/17 LTM Adjusted EBITDA Adjusted EBITDA: earnings before interest expense, interest income, provision or benefit for income taxes, depreciation and amortization, share - based payments, fair value adjustments, insurance settlement recovery, transactions - related costs, and restructuring costs For a reconciliation to GAAP financial measures, please see the Appendix. Historical Actual Results for Consolidated B. Riley Financial
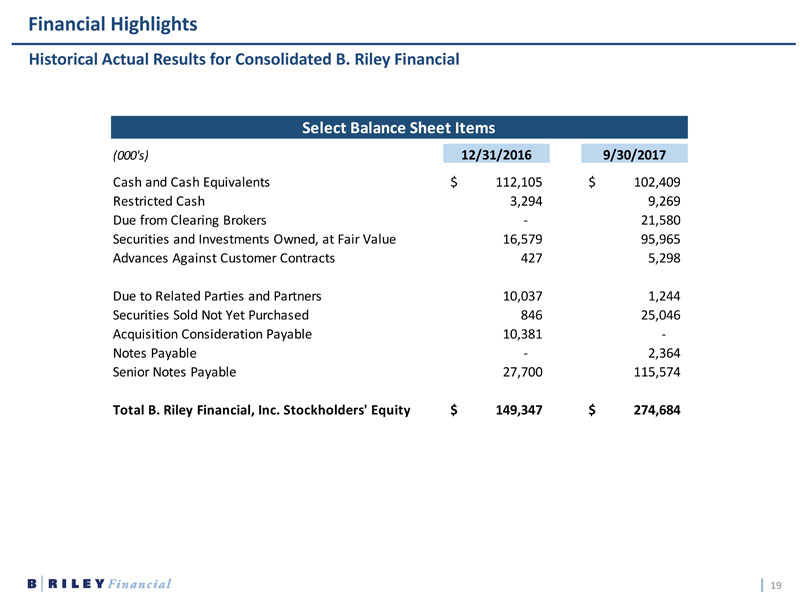
19 Financial Highlights Historical Actual Results for Consolidated B. Riley Financial Select Balance Sheet Items (000's) 12/31/2016 9/30/2017 Cash and Cash Equivalents 112,105$ 102,409$ Restricted Cash 3,294 9,269 Due from Clearing Brokers - 21,580 Securities and Investments Owned, at Fair Value 16,579 95,965 Advances Against Customer Contracts 427 5,298 Due to Related Parties and Partners 10,037 1,244 Securities Sold Not Yet Purchased 846 25,046 Acquisition Consideration Payable 10,381 - Notes Payable - 2,364 Senior Notes Payable 27,700 115,574 Total B. Riley Financial, Inc. Stockholders' Equity 149,347$ 274,684$
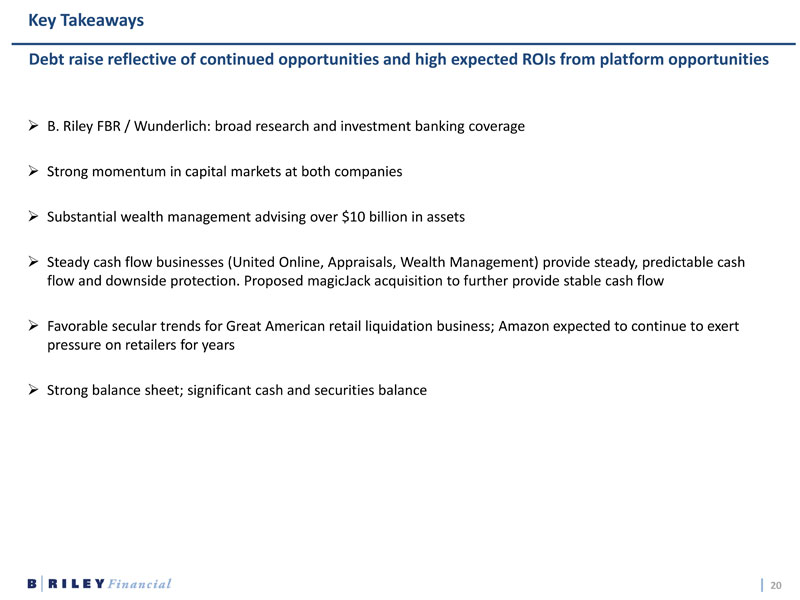
20 Key Takeaways » B. Riley FBR / Wunderlich: broad research and investment banking coverage » Strong momentum in capital markets at both companies » Substantial wealth management advising over $10 billion in assets » Steady cash flow businesses (United Online, Appraisals, Wealth Management) provide steady, predictable cash flow and downside protection. Proposed magicJack acquisition to further provide stable cash flow » Favorable secular trends for Great American retail liquidation business; Amazon expected to continue to exert pressure on retailers for years » Strong balance sheet; significant cash and securities balance Debt raise reflective of continued opportunities and high expected ROIs from platform opportunities
APPENDIX
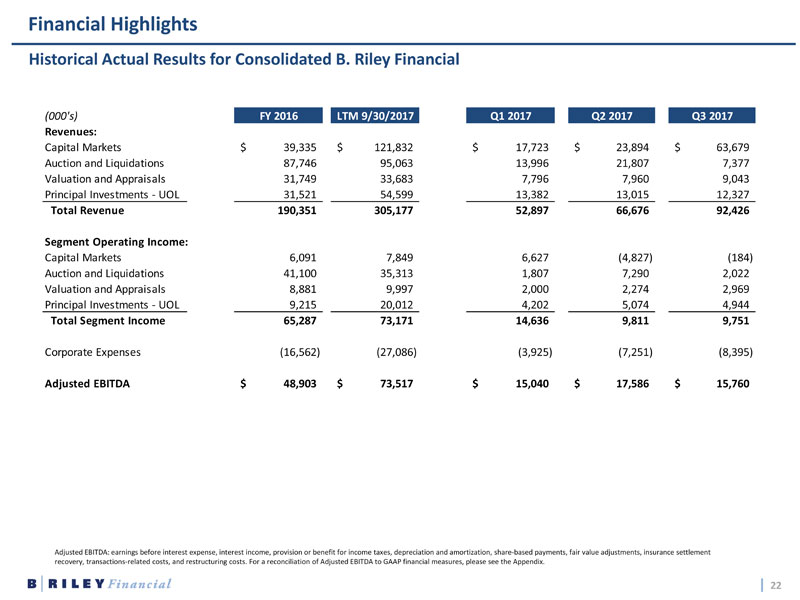
22 Financial Highlights Historical Actual Results for Consolidated B. Riley Financial Adjusted EBITDA: earnings before interest expense, interest income, provision or benefit for income taxes, depreciation and amortization, share - based payments, fair value adjustments, insurance settlement recovery, transactions - related costs, and restructuring costs. For a reconciliation of Adjusted EBITDA to GAAP financial measures, please see the Appendix. (000's) FY 2016 LTM 9/30/2017 Q1 2017 Q2 2017 Q3 2017 Revenues: Capital Markets 39,335$ 121,832$ 17,723$ 23,894$ 63,679$ Auction and Liquidations 87,746 95,063 13,996 21,807 7,377 Valuation and Appraisals 31,749 33,683 7,796 7,960 9,043 Principal Investments - UOL 31,521 54,599 13,382 13,015 12,327 Total Revenue 190,351 305,177 52,897 66,676 92,426 Segment Operating Income: Capital Markets 6,091 7,849 6,627 (4,827) (184) Auction and Liquidations 41,100 35,313 1,807 7,290 2,022 Valuation and Appraisals 8,881 9,997 2,000 2,274 2,969 Principal Investments - UOL 9,215 20,012 4,202 5,074 4,944 Total Segment Income 65,287 73,171 14,636 9,811 9,751 Corporate Expenses (16,562) (27,086) (3,925) (7,251) (8,395) Adjusted EBITDA 48,903$ 73,517$ 15,040$ 17,586$ 15,760$
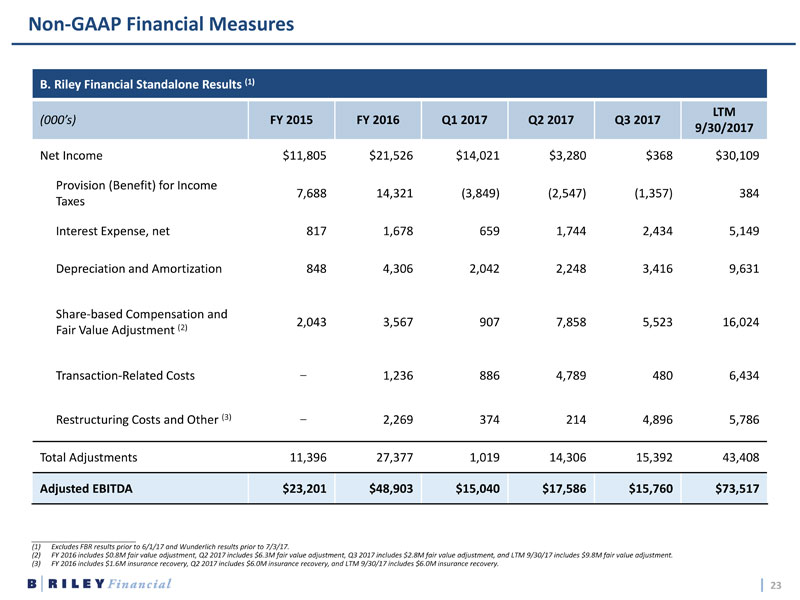
23 Non - GAAP Financial Measures ___________________________ (1) Excludes FBR results prior to 6/1/17 and Wunderlich results prior to 7/3/17. (2) FY 2016 includes $0.8M fair value adjustment, Q2 2017 includes $6.3M fair value adjustment, Q3 2017 includes $2.8M fair value ad justment, and LTM 9/30/17 includes $9.8M fair value adjustment. (3) FY 2016 includes $1.6M insurance recovery, Q2 2017 includes $6.0M insurance recovery, and LTM 9/30/17 includes $6.0M insuranc e r ecovery. B. Riley Financial Standalone Results (1) (000’s) FY 2015 FY 2016 Q1 2017 Q2 2017 Q3 2017 LTM 9/30/2017 Net Income $11,805 $21,526 $14,021 $3,280 $368 $30,109 Provision (Benefit ) for Income T axes 7,688 14,321 (3,849) (2,547) (1,357) 384 Interest Expense, net 817 1,678 659 1,744 2,434 5,149 Depreciation and Amortization 848 4,306 2,042 2,248 3,416 9,631 Share - based Compensation and Fair Value Adjustment (2) 2,043 3,567 907 7,858 5,523 16,024 Transaction - Related Costs − 1,236 886 4,789 480 6,434 Restructuring Costs and Other (3) − 2,269 374 214 4,896 5,786 Total Adjustments 11,396 27,377 1,019 14,306 15,392 43,408 Adjusted EBITDA $23,201 $48,903 $15,040 $17,586 $15,760 $73,517
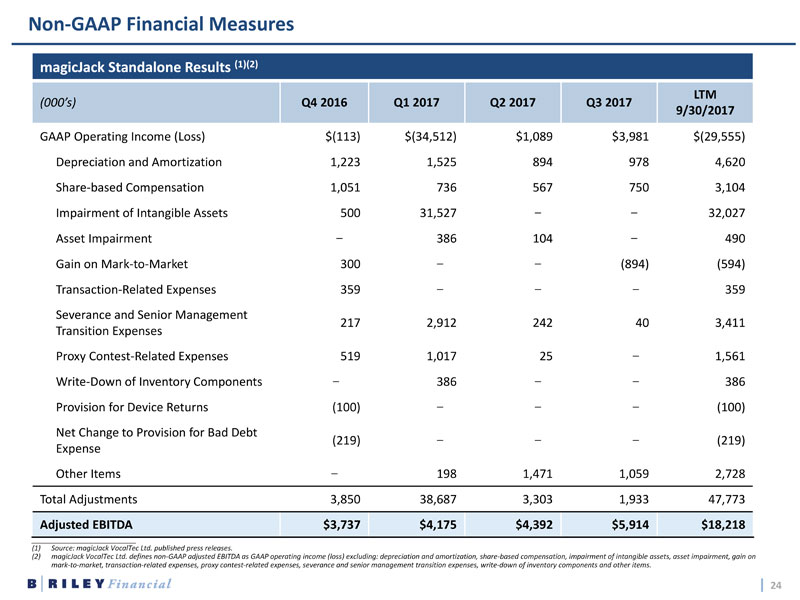
24 Non - GAAP Financial Measures ___________________________ (1) Source: magicJack VocalTec Ltd. published press releases. (2) magicJack VocalTec Ltd. defines non - GAAP adjusted EBITDA as GAAP operating income (loss) excluding: depreciation and amortization, share - based compensation, impairment of intangible assets, asset impairment, gain on mark - to - market, transaction - related expenses, proxy contest - related expenses, severance and senior management transition expenses, write - down of inventory components and other items . magicJack Standalone Results (1)(2) (000’s) Q4 2016 Q1 2017 Q2 2017 Q3 2017 LTM 9/30/2017 GAAP Operating Income (Loss) $(113) $(34,512) $1,089 $3,981 $(29,555) Depreciation and Amortization 1,223 1,525 894 978 4,620 Share - based Compensation 1,051 736 567 750 3,104 Impairment of Intangible Assets 500 31,527 − − 32,027 Asset Impairment − 386 104 − 490 Gain on Mark - to - Market 300 − − (894) (594) Transaction - Related Expenses 359 − − − 359 Severance and Senior Management Transition Expenses 217 2,912 242 40 3,411 Proxy Contest - Related Expenses 519 1,017 25 − 1,561 Write - Down of Inventory Components − 386 − − 386 Provision for Device Returns (100) − − − (100) Net Change to Provision for Bad Debt Expense (219) − − − (219) Other Items − 198 1,471 1,059 2,728 Total Adjustments 3,850 38,687 3,303 1,933 47,773 Adjusted EBITDA $3,737 $4,175 $4,392 $5,914 $18,218
25 Bryant Riley Chairman & CEO B. Riley Financial, Inc. brriley@brileyfin.com Tel (310) 966 - 1444 Phillip Ahn COO & CFO B. Riley Financial, Inc. pahn@brileyfin.com Tel (818) 884 - 3737 Liolios Group Investor Relations Scott Liolios or Matt Glover Newport Beach, CA 92660 Tel (949) 574 - 3860 RILY@liolios.com 11100 Santa Monica Blvd., Suite 800 Los Angeles, CA 90025 Tel (310) 966 - 1444 www.brileyfin.com Contact Us