Attached files
| file | filename |
|---|---|
| EX-32.2 - EX-32.2 - HENNESSY ADVISORS INC | d442534dex322.htm |
| EX-32.1 - EX-32.1 - HENNESSY ADVISORS INC | d442534dex321.htm |
| EX-31.2 - EX-31.2 - HENNESSY ADVISORS INC | d442534dex312.htm |
| EX-31.1 - EX-31.1 - HENNESSY ADVISORS INC | d442534dex311.htm |
| EX-23.1 - EX-23.1 - HENNESSY ADVISORS INC | d442534dex231.htm |
Table of Contents
UNITED STATES
SECURITIES AND EXCHANGE COMMISSION
WASHINGTON, D.C. 20549
FORM 10-K
| ☒ | ANNUAL REPORT PURSUANT TO SECTION 13 OR 15(d) OF THE SECURITIES EXCHANGE ACT OF 1934 |
For the Fiscal Year Ended September 30, 2017
or
| ☐ | TRANSITION REPORT PURSUANT TO SECTION 13 OR 15(d) OF THE SECURITIES EXCHANGE ACT OF 1934 |
For the Transition Period From to
Commission File Number 001-36423
HENNESSY ADVISORS, INC.
(Exact name of registrant as specified in its charter)
| California | 68-0176227 | |
| (State or other jurisdiction of incorporation or organization) |
(IRS Employer Identification No.) | |
| 7250 Redwood Blvd., Suite 200 Novato, California |
94945 | |
| (Address of principal | (Zip Code) | |
| executive office) | ||
(415) 899-1555
(Registrant’s telephone number, including area code)
Securities registered pursuant to Section 12(b) of the Act:
| Title of Each Class |
Name of Each Exchange on Which Registered | |
| Common Stock, no par value | The NASDAQ Stock Market LLC |
Securities registered pursuant to Section 12(g) of the Act: None.
Indicate by check mark if the registrant is a well-known seasoned issuer, as defined in Rule 405 of the Securities Act. Yes ☐ No ☒
Indicate by check mark if the registrant is not required to file reports pursuant to Section 13 or Section 15(d) of the Act. Yes ☐ No ☒
Indicate by check mark whether the registrant (1) has filed all reports required to be filed by Section 13 or 15(d) of the Securities Exchange Act of 1934 during the preceding 12 months (or for such shorter period that the registrant was required to file such reports), and (2) has been subject to such filing requirements for the past 90 days. Yes ☒ No ☐
Indicate by check mark whether the registrant has submitted electronically and posted on its corporate Web site, if any, every Interactive Data File required to be submitted and posted pursuant to Rule 405 of Regulation S-T during the preceding 12 months (or for such shorter period that the registrant was required to submit and post such files). Yes ☒ No ☐
Indicate by check mark if disclosure of delinquent filers pursuant to 405 of Regulation S-K is not contained herein, and will not be contained, to the best of registrant’s knowledge, in definitive proxy or information statements incorporated by reference in Part III of this Form 10-K or any amendment to this Form 10-K. ☒
Indicate by check mark whether the registrant is a large accelerated filer, an accelerated filer, a non-accelerated filer, a smaller reporting company, or an emerging growth company. See definition of “large accelerated filer,” “accelerated filer,” “smaller reporting company,” and “emerging growth company” in Rule 12b-2 of the Exchange Act:
| Large accelerated filer | ☐ | Accelerated filer | ☒ | |||
| Non-accelerated filer | ☐ (do not check if a smaller reporting company) | Smaller reporting company | ☐ | |||
| Emerging Growth Company | ☐ | |||||
If an emerging growth company, indicate by check mark if the registrant has elected not to use the extended transition period for complying with any new or revised financial accounting standards provided pursuant to Section 13(a) of the Exchange Act ☐
Indicate by check mark whether the registrant is a shell company (as defined in Rule 12b-2 of the Exchange Act). Yes ☐ No ☒
The aggregate market value of Common Stock held by non-affiliates (as affiliates are defined in Rule 12b-2 of the Exchange Act) of the Registrant, based on the closing price of $16.81 on March 31, 2017, was $76,181,962.
Indicate the number of shares outstanding of each of the registrant’s classes of common stock, as of the latest practicable date:
As of November 28, 2017, there were 7,802,995 shares of Common Stock (no par value) issued and outstanding.
DOCUMENTS INCORPORATED BY REFERENCE:
Portions of the registrant’s definitive proxy statement for its 2018 annual meeting of stockholders will be, when filed, incorporated by reference in Part III, Items 10, 11, 12, 13, and 14.
Table of Contents
HENNESSY ADVISORS, INC.
2
Table of Contents
GENERAL
Hennessy Advisors, Inc. (the “Company,” “we,” “us,” or “our”) is a publicly traded investment management firm whose primary business activity is managing, servicing and marketing 14 open-end mutual funds branded as the Hennessy Funds. We are committed to employing a consistent and repeatable investment process for the Hennessy Funds, combining time-tested stock selection strategies with a highly disciplined, team-managed approach, and to providing superior service to investors. Our goal is to provide products that investors can have confidence in, knowing their money is invested as promised, with their best interest in mind. Our firm was founded on these principles over 28 years ago and the same principles guide us today.
We earn revenues primarily by providing investment advisory services to the Hennessy Funds. We also provide shareholder services to the Hennessy Funds, but we have only earned shareholder service fees from all of (versus only some of) the Hennessy Funds since March 1, 2015. Investment advisory services include managing the composition of each fund’s portfolio (including the purchase, retention, and disposition of portfolio securities in accordance with each fund’s investment objectives, policies, and restrictions), conducting investment research, monitoring compliance with each fund’s investment restrictions and applicable laws and regulations, overseeing the selection and continued employment of sub-advisors and monitoring such sub-advisors’ investment performance and adherence to investment policies and compliance procedures, overseeing other service providers, maintaining public relations and marketing programs for each fund, preparing and distributing regulatory reports, and overseeing distribution through third-party financial intermediaries. Shareholder services include maintaining an “800” number that the current investors of the Hennessy Funds may call to ask questions about the funds or their accounts, or to get help with processing exchange and redemption requests or changing account options. The fees we receive for investment advisory and shareholder services are calculated as a percentage of the average daily net asset values of the Hennessy Funds. Accordingly, our revenues increase or decrease as our average assets under management rises or falls. The percentage amount of the investment advisory fees varies from fund to fund, but the percentage amount of the shareholder service fees is consistent across all funds.
For four of the Hennessy Funds whose assets related to fund management were acquired through asset purchases, we have delegated the day-to-day portfolio management responsibilities to sub-advisors. In exchange for these sub-advisory services, we pay each sub-advisor a fee out of our own assets, which is calculated as a percentage of the average daily net asset values of the sub-advised funds. Accordingly, the sub-advisor fees we pay increase or decrease as our average assets under management in our sub-advised funds increases or decreases, respectively.
Our average assets under management for fiscal year 2017 was $6.6 billion. As of the end of fiscal year 2017, our total assets under management was $6.6 billion, an increase of almost 1,660% from $375 million as of the end of our first fiscal year as a public company, which was September 30, 2002.
Our business strategy centers on (i) organic growth through our marketing and sales efforts and (ii) growth through strategic purchases of management-related assets.
HISTORICAL TIMELINE
| 1989 | In February, we were founded as a California corporation under our previous name, Edward J. Hennessy, Inc., and registered as a broker-dealer with the National Association of Securities Dealers (now known as the Financial Industry Regulatory Authority). | |
| 1996 | In March, we launched our first mutual fund, the Hennessy Balanced Fund. | |
3
Table of Contents
| 1998 | In October, we launched our second mutual fund, the Hennessy Total Return Fund. | |
| 2000 | In June, we successfully completed our first asset purchase by purchasing the assets related to the management of two funds previously managed by Netfolio, Inc. (formerly known as O’Shaughnessy Capital Management, Inc.), named the O’Shaughnessy Cornerstone Growth Fund and O’Shaughnessy Cornerstone Value Fund, which are now called the Hennessy Cornerstone Growth Fund and the Hennessy Cornerstone Value Fund. The amount of the purchased assets as of the closing date totaled approximately $197 million. | |
| 2002 | In May, we successfully completed a self-underwritten initial public offering of our stock by raising $5.7 million at a split-adjusted price of $1.98 (HNNA.OB) and changed our firm name to Hennessy Advisors, Inc. Our total assets under management at the time of our initial public offering was approximately $358 million. | |
| 2003 | In September, we purchased the assets related to the management of a fund previously managed by SYM Financial Corporation, named the SYM Select Growth Fund, and reorganized the assets of such fund into the Hennessy Cornerstone Mid Cap 30 Fund. The amount of the purchased assets as of the closing date was approximately $35 million. | |
| 2004 | In March, we purchased the assets related to the management of five funds previously managed by Lindner Asset Management, Inc. and reorganized the assets of such funds into four of our existing Hennessy Funds. The amount of the purchased assets as of the closing date totaled approximately $301 million. | |
| 2005 | In July, we purchased the assets related to the management of a fund previously managed by Landis Associates LLC, named The Henlopen Fund, and changed the fund name to the Hennessy Cornerstone Growth, Series II Fund. The amount of the purchased assets as of the closing date was approximately $299 million. | |
| 2007 | In November, we launched the Hennessy Micro Cap Growth Fund, LLC, a non-registered private pooled investment fund. | |
| 2009 | In March, we purchased the assets related to the management of two funds previously managed by RBC Global Asset Management (U.S.) Inc., named the Tamarack Large Growth Fund and the Tamarack Value Fund, and reorganized the assets of such funds into the Hennessy Cornerstone Large Growth Fund and the Hennessy Large Value Fund, respectively. In conjunction with the completion of the transaction, RBC Global Asset Management (U.S.) Inc. became the sub-advisor to the Hennessy Large Value Fund. The amount of the purchased assets as of the closing date totaled approximately $158 million.
In September, we purchased the assets related to the management of two funds previously managed by SPARX Investment & Research, USA, Inc. and sub-advised by SPARX Asset Management Co., Ltd., named the SPARX Japan Fund and the SPARX Japan Smaller Companies Fund, which are now called the Hennessy Japan Fund and the Hennessy Japan Small Cap Fund, respectively. In conjunction with the completion of the transaction, SPARX Asset Management Co., Ltd. became the sub-advisor to the Hennessy Japan Fund and the Hennessy Japan Small Cap Fund. The amount of the purchased assets as of the closing date totaled approximately $74 million. | |
| 2011 | In October, we reorganized the assets of the Hennessy Cornerstone Growth, Series II Fund into the Hennessy Cornerstone Growth Fund. | |
4
Table of Contents
| 2012 | In October, we purchased the assets related to the management of 10 funds previously managed by FBR Fund Advisers (the “FBR Funds”). We reorganized the assets of three of the FBR Funds into our existing Hennessy Funds and changed the fund names of the other seven FBR Funds to become part of our product offerings. In conjunction with the completion of the transaction, Broad Run Investment Management, LLC became the sub-advisor to the Hennessy Focus Fund, Financial Counselors, Inc. became the sub-advisor to the Hennessy Equity and Income Fund (fixed income allocation) and the Hennessy Core Bond Fund, and The London Company of Virginia, LLC became the sub-advisor to the Hennessy Equity and Income Fund (equity allocation). The amount of the purchased assets as of the closing date was approximately $2.2 billion.
In December, we closed the Hennessy Micro Cap Growth Fund, LLC. | |
| 2014 | In April, our common stock began trading on The NASDAQ Capital Market. | |
| 2015 | In September, we completed a self-tender offer, under which we repurchased 1,500,000 shares of our common stock at $16.67 per share. | |
| 2016 | In September, we purchased the assets related to the management of two funds previously managed by Westport Advisers, LLC, named the Westport Fund and the Westport Select Cap Fund, and reorganized the assets of such funds into the Hennessy Cornerstone Mid Cap 30 Fund. The amount of the purchased assets as of the closing date totaled approximately $435 million. | |
| 2017 | In February, we liquidated the Hennessy Core Bond Fund and reorganized the Hennessy Large Value Fund into the Hennessy Cornerstone Value Fund. Additionally, for the Hennessy Technology Fund, we implemented changes to the investment strategy and the portfolio management team, decreased the investment advisory fee from 0.90% to 0.74%, and adopted an expense limitation agreement.
In March, we launched Institutional Class shares for the Hennessy Gas Utility Fund.
In May, we signed a definitive agreement with Manning & Napier Group, LLC and Rainier Investment Management, LLC to purchase the assets related to the management of three Rainier Funds – the Rainier Large Cap Equity Fund, the Rainier Small/Mid Cap Equity Fund, and the Rainier Mid Cap Equity Fund. Upon completion of the transaction, which is subject to the approval of the shareholders of the Rainier Funds, the assets related to the Rainier Large Cap Equity Fund will merge into the Hennessy Cornerstone Large Growth Fund and the assets related to the Rainier Mid Cap Equity Fund and the Rainier Small/Mid Cap Equity Fund will merge into the Hennessy Cornerstone Mid Cap 30 Fund. | |
5
Table of Contents
PRODUCT INFORMATION
Investment Strategies of the Hennessy Funds
We manage 14 mutual funds that have each been categorized as Domestic Equity, Multi-Asset, or Sector and Specialty, as shown below:
The Hennessy Funds’ Family
| Domestic Equity |
Multi-Asset |
Sector and Specialty | ||
| Hennessy Cornerstone Growth Fund | Hennessy Total Return Fund | Hennessy Gas Utility Fund | ||
| Hennessy Focus Fund | Hennessy Equity and Income Fund | Hennessy Small Cap Financial Fund | ||
| Hennessy Cornerstone Mid Cap 30 Fund | Hennessy Balanced Fund | Hennessy Large Cap Financial Fund | ||
| Hennessy Cornerstone Large Growth Fund | Hennessy Technology Fund | |||
| Hennessy Cornerstone Value Fund | Hennessy Japan Fund | |||
| Hennessy Japan Small Cap Fund |
Domestic Equity Funds
Five of the Hennessy Funds are categorized as Domestic Equity products. Of those five funds, four utilize a quantitative investment strategy, and one is actively managed, but they all employ a highly disciplined, team-managed approach to investing. Following is a brief description of the investment objectives and principal investment strategies of the Hennessy Funds in the Domestic Equity product category:
| • | Hennessy Cornerstone Growth Fund (Investor Class symbol HFCGX and Institutional Class symbol HICGX). The Hennessy Cornerstone Growth Fund seeks long-term growth of capital by investing in growth-oriented common stocks using a highly disciplined, quantitative formula. While a majority of the companies generally selected by the Cornerstone Growth formula are small-cap companies, the Cornerstone Growth formula may also select mid- and large-cap companies. This fund screens for stocks with a market capitalization of more than $175 million, a price-to-sales ratio of less than 1.5, higher annual earnings than in the previous year, and stock price appreciation, or positive relative strength, over the prior three- and six-month periods. The fund then invests in the 50 common stocks with the highest one-year price appreciation. |
| • | Hennessy Focus Fund (Investor Class symbol HFCSX and Institutional Class symbol HFCIX). The Hennessy Focus Fund seeks capital appreciation by employing a fundamental, bottom-up investment approach that concentrates the fund’s holdings in companies most attractive to its portfolio managers. This fund seeks high-quality, growth-oriented companies with demonstrated strong competitive positions, predictable cash earnings growth, high return on invested capital, excellent management, and modest valuation. It maintains a concentrated portfolio of 20 to 30 stocks that are conviction-weighted with 60% to 80% of the fund’s assets invested in the fund’s top 10 holdings. |
| • | Hennessy Cornerstone Mid Cap 30 Fund (Investor Class symbol HFMDX and Institutional Class symbol HIMDX). The Hennessy Cornerstone Mid Cap 30 Fund seeks long-term growth of capital by investing in mid-cap, growth-oriented companies using a highly disciplined, quantitative formula. This fund screens for stocks with a market capitalization of between $1 billion and $10 billion, excluding American Depository Receipts (“ADRs”), a price-to-sales ratio of less than 1.5, higher annual earnings than in the previous year, and positive stock price appreciation, or positive relative strength, over the three- and six-month periods. The fund then invests in the 30 common stocks with the highest one-year price appreciation. |
6
Table of Contents
| • | Hennessy Cornerstone Large Growth Fund (Investor Class symbol HFLGX and Institutional Class symbol HILGX). The Hennessy Cornerstone Large Growth Fund seeks long-term growth of capital by investing in growth-oriented common stocks of larger companies using a highly disciplined, quantitative formula. This fund screens for stocks with a market capitalization exceeding the average of the relevant database, excluding ADRs, a price-to-cash flow ratio less than the median of the relevant database, and positive total capital. The fund then invests in the 50 common stocks with the highest one-year return on total capital. |
| • | Hennessy Cornerstone Value Fund (Investor Class symbol HFCVX and Institutional Class symbol HICVX). The Hennessy Cornerstone Value Fund seeks total return, consisting of capital appreciation and current income, by investing in larger, dividend-paying companies using a highly disciplined, quantitative formula. This fund screens for stocks with a market capitalization that exceeds the average of the relevant database, shares outstanding that exceeds the average of the relevant database, cash flow that exceeds the average of the relevant database, and 12-month sales that are 50% greater than the average of the relevant database. The fund then invests in the 50 common stocks with the highest dividend yield, which is calculated as the annual dividends paid by a company divided by the per share price of its stock. |
Multi-Asset Funds
Three of the Hennessy Funds are categorized as Multi-Asset products. Of those three funds, two utilize a quantitative investment strategy and one is actively managed. These funds follow a more conservative investment strategy focused on generating income and providing an alternative to mutual funds containing only equity stocks. Following is a brief description of the investment objectives and principal investment strategies of the Hennessy Funds in the Multi-Asset product category:
| • | Hennessy Total Return Fund (Investor Class symbol HDOGX). The Hennessy Total Return Fund seeks total return, consisting of capital appreciation and current income, by investing approximately 50% of its assets in the 10 highest dividend-yielding common stocks of the Dow Jones Industrial Average (commonly referred to as the “Dogs of the Dow”) and the remaining 50% in U.S. Treasury securities with a maturity of less than one year. The fund then utilizes a borrowing strategy that allows the fund’s performance to approximate what it would be if the fund had an asset allocation of roughly 75% Dogs of the Dow stocks and 25% U.S. Treasury securities. |
| • | Hennessy Equity and Income Fund (Investor Class symbol HEIFX and Institutional Class symbol HEIIX). The Hennessy Equity and Income Fund seeks long-term capital growth and current income by investing in stocks, bonds and other fixed income securities designed to provide a balanced portfolio, with broad market exposure and low volatility. Under normal circumstances, the fund invests approximately 60% of its assets in equities, focusing on high-quality, dividend-paying stocks, and approximately 40% of its assets in high-quality, domestic corporate, agency and government bonds. |
| • | Hennessy Balanced Fund (Investor Class symbol HBFBX). The Hennessy Balanced Fund seeks a combination of capital appreciation and current income by investing approximately 50% of its assets in the Dogs of the Dow stocks and approximately 50% of its assets in U.S. Treasury securities with a maturity of less than one year. |
7
Table of Contents
Sector and Specialty Funds
Six of the Hennessy Funds are categorized as Sector and Specialty products. Of those six funds, one is designed as an index fund and the other five are actively managed, but they all focus on a niche sector of the stock market. Following is a brief description of the investment objectives and principal investment strategies of the Hennessy Funds in the Sector and Specialty product category:
| • | Hennessy Gas Utility Fund (Investor Class symbol GASFX and Institutional Class symbol HGASX). The Hennessy Gas Utility Fund seeks income and capital appreciation by investing in the companies that deliver natural gas and are members of the American Gas Association (“AGA”). The fund owns all of the publicly traded companies that comprise the AGA Stock Index. The AGA Stock Index is market cap weighted and adjusted for the percentage of natural gas assets on each company’s balance sheet. The fund invests in companies approximately in the same proportion as its weighting in the AGA Stock Index, with no company representing greater than 5% of its assets. |
| • | Hennessy Small Cap Financial Fund (Investor Class symbol HSFNX and Institutional Class symbol HISFX). The Hennessy Small Cap Financial Fund seeks capital appreciation by investing in companies with market capitalizations under $3 billion principally engaged in the business of providing financial services. This fund invests in financial services companies that the portfolio managers believe demonstrate a high-quality management team with a long-term view, a well-balanced and uncomplicated business model, a conservative lending culture with high-quality liabilities, sustainable earnings growth opportunities, a low-cost operating structure, and attractive valuations relative to the industry. |
| • | Hennessy Large Cap Financial Fund (Investor Class symbol HLFNX and Institutional Class symbol HILFX). The Hennessy Large Cap Financial Fund seeks capital appreciation by investing in companies with market capitalizations over $3 billion principally engaged in the business of providing financial services. This fund invests in financial services companies that the portfolio managers believe demonstrate a high-quality management team with a long-term view, a well-balanced and uncomplicated business model, a conservative lending culture with high-quality liabilities, sustainable earnings growth opportunities, a low-cost operating structure, and attractive valuations relative to the industry. |
| • | Hennessy Technology Fund (Investor Class symbol HTECX and Institutional Class symbol HTCIX). The Hennessy Technology Fund seeks long-term capital appreciation by investing in high-quality companies that the portfolio management team believes have the potential to participate in the growth and innovation of the technology sector. This fund utilizes several metrics to analyze technology companies, selecting the top 60 that demonstrate sector-leading cash flows and profits with the ability to sustain profitability and that have a history of delivering returns in excess of cost of capital, an attractive balance sheet risk profile, an attractive relative valuation, and the ability to generate cash. |
| • | Hennessy Japan Fund (Investor Class symbol HJPNX and Institutional Class symbol HJPIX). The Hennessy Japan Fund seeks long-term capital appreciation by investing in securities of Japanese companies regardless of market capitalization. This fund screens for companies that the portfolio managers believe have strong businesses and management, and are trading at an attractive price. Through in-depth and rigorous analysis and on-site research, the portfolio managers identify stocks with a “value gap.” The portfolio is limited to its portfolio managers’ best ideas and maintains a concentrated number of holdings. |
8
Table of Contents
| • | Hennessy Japan Small Cap Fund (Investor Class symbol HJPSX and Institutional Class symbol HJSIX). The Hennessy Japan Small Cap Fund seeks long-term capital appreciation by investing in securities of smaller Japanese companies, defined as those with market capitalizations in the bottom 15% of all Japanese companies. This fund screens for small caps that the portfolio managers believe have strong businesses and management, and are trading at an attractive price. Through in-depth and rigorous analysis and on-site research, the portfolio managers identify stocks with a “value gap.” The portfolio is limited to its portfolio managers’ best ideas and is unconfined to benchmarks. |
Historical Investment Performance of the Hennessy Funds
The following table presents the average annualized returns for each of the Hennessy Funds and their relevant benchmark indices for the one-year, three-year, five-year, ten-year and since inception periods ended September 30, 2017.
Returns are presented net of all expenses borne by mutual fund shareholders, but are not net of fees waived or expenses borne by us. The past investment performance of the Hennessy Funds is no guarantee of future performance and all of the Hennessy Funds have experienced negative performance over various time periods in the past and may do so again in the future.
Hennessy Funds Performance as of September 30, 2017:
| Hennessy Cornerstone Growth Fund* |
One Year | Three Years | Five Years | Ten Years | Since Inception (11/01/96) |
|||||||||||||||
| Institutional Class Share - HICGX** |
18.15 | % | 9.81 | % | 13.87 | % | 3.89 | % | 9.57 | % | ||||||||||
| Investor Class Share - HFCGX |
17.79 | % | 9.53 | % | 13.55 | % | 3.59 | % | 9.42 | % | ||||||||||
| Russell 2000 Index (1) |
20.74 | % | 12.18 | % | 13.79 | % | 7.85 | % | 8.76 | % | ||||||||||
| S&P 500 Index (2) |
18.61 | % | 10.81 | % | 14.22 | % | 7.44 | % | 8.30 | % | ||||||||||
| Hennessy Focus Fund* |
One Year | Three Years | Five Years | Ten Years | Since Inception (1/03/97) |
|||||||||||||||
| Institutional Class Share - HFCIX** |
16.20 | % | 11.42 | % | 14.95 | % | 9.68 | % | 13.42 | % | ||||||||||
| Investor Class Share - HFCSX |
15.76 | % | 11.01 | % | 14.56 | % | 9.34 | % | 13.24 | % | ||||||||||
| Russell 3000 Index (2) |
18.71 | % | 10.74 | % | 14.23 | % | 7.57 | % | 8.21 | % | ||||||||||
| Russell Midcap Growth Index (3) |
17.82 | % | 9.96 | % | 14.18 | % | 8.20 | % | 8.75 | % | ||||||||||
| Hennessy Cornerstone Mid Cap 30 Fund |
One Year | Three Years | Five Years | Ten Years | Since Inception (9/17/03) |
|||||||||||||||
| Institutional Class Share - HIMDX** |
14.99 | % | 8.47 | % | 13.06 | % | 8.16 | % | 11.26 | % | ||||||||||
| Investor Class Share - HFMDX |
14.58 | % | 8.14 | % | 12.70 | % | 7.81 | % | 11.00 | % | ||||||||||
| Russell Midcap Index (4) |
15.32 | % | 9.54 | % | 14.26 | % | 8.08 | % | 10.62 | % | ||||||||||
| S&P 500 Index (2) |
18.61 | % | 10.81 | % | 14.22 | % | 7.44 | % | 8.83 | % | ||||||||||
| Hennessy Cornerstone Large Growth Fund |
One Year | Three Years | Five Years | Ten Years | Since Inception (3/20/09) |
|||||||||||||||
| Institutional Class Share - HILGX |
16.40 | % | 7.28 | % | 12.87 | % | — | 16.88 | % | |||||||||||
| Investor Class Share - HFLGX |
16.08 | % | 7.10 | % | 12.65 | % | — | 16.60 | % | |||||||||||
| Russell 1000 Index (5) |
18.54 | % | 10.63 | % | 14.27 | % | — | 17.57 | % | |||||||||||
| S&P 500 Index (2) |
18.61 | % | 10.81 | % | 14.22 | % | 7.44 | % | 17.39 | % | ||||||||||
9
Table of Contents
| Hennessy Cornerstone Value Fund* |
One Year | Three Years | Five Years | Ten Years | Since Inception (11/01/96) |
|||||||||||||||
| Institutional Class Share - HICVX** |
18.09 | % | 7.88 | % | 11.55 | % | 5.90 | % | 7.21 | % | ||||||||||
| Investor Class Share - HFCVX |
17.77 | % | 7.68 | % | 11.32 | % | 5.65 | % | 7.09 | % | ||||||||||
| Russell 1000 Value Index (6) |
15.12 | % | 8.53 | % | 13.20 | % | 5.92 | % | 8.64 | % | ||||||||||
| S&P 500 Index (2) |
18.61 | % | 10.81 | % | 14.22 | % | 7.44 | % | 8.30 | % | ||||||||||
| Hennessy Total Return Fund |
One Year | Three Years | Five Years | Ten Years | Since Inception (7/29/98) |
|||||||||||||||
| Investor Class Share - HDOGX |
9.50 | % | 6.96 | % | 8.30 | % | 4.56 | % | 5.01 | % | ||||||||||
| 75/25 Blended DJIA/Treasury Index (7) |
18.83 | % | 9.33 | % | 10.19 | % | 6.07 | % | 6.25 | % | ||||||||||
| Dow Jones Industrial Average (2) |
25.45 | % | 12.35 | % | 13.57 | % | 7.72 | % | 7.41 | % | ||||||||||
| Hennessy Equity and Income Fund* |
One Year | Three Years | Five Years | Ten Years | Since Inception (6/03/97) |
|||||||||||||||
| Institutional Class Share - HEIIX |
11.96 | % | 5.74 | % | 8.00 | % | 6.36 | % | 7.08 | % | ||||||||||
| Investor Class Share - HEIFX*** |
11.53 | % | 5.34 | % | 7.64 | % | 6.05 | % | 6.88 | % | ||||||||||
| Blended Balanced Index (8) |
10.96 | % | 7.40 | % | 9.14 | % | 6.21 | % | 6.72 | % | ||||||||||
| S&P 500 Index (2) |
18.61 | % | 10.81 | % | 14.22 | % | 7.44 | % | 7.52 | % | ||||||||||
| Hennessy Balanced Fund |
One Year | Three Years | Five Years | Ten Years | Since Inception (3/08/96) |
|||||||||||||||
| Investor Class Share - HBFBX |
7.60 | % | 4.78 | % | 5.17 | % | 3.33 | % | 4.49 | % | ||||||||||
| 50/50 Blended DJIA/Treasury Index (9) |
12.46 | % | 6.40 | % | 6.93 | % | 4.61 | % | 6.29 | % | ||||||||||
| Dow Jones Industrial Average (2) |
25.45 | % | 12.35 | % | 13.57 | % | 7.72 | % | 9.23 | % | ||||||||||
| Hennessy Gas Utility Fund* |
One Year | Three Years | Five Years | Ten Years | Since Inception (5/10/89) |
|||||||||||||||
| Institutional Class Share - HGASX** |
7.36 | % | 4.70 | % | 10.67 | % | 8.97 | % | 9.87 | % | ||||||||||
| Investor Class Share - GASFX |
7.16 | % | 4.64 | % | 10.62 | % | 8.95 | % | 9.87 | % | ||||||||||
| AGA Stock Index (11) |
8.43 | % | 5.88 | % | 11.79 | % | 9.77 | % | 11.01 | % | ||||||||||
| S&P 500 Index (2) |
18.61 | % | 10.81 | % | 14.22 | % | 7.44 | % | 10.06 | % | ||||||||||
| Hennessy Small Cap Financial Fund* |
One Year | Three Years | Five Years | Ten Years | Since Inception (1/03/97) |
|||||||||||||||
| Institutional Class Share - HISFX** |
24.99 | % | 17.37 | % | 15.72 | % | 9.46 | % | 11.38 | % | ||||||||||
| Investor Class Share - HSFNX |
24.50 | % | 16.94 | % | 15.31 | % | 9.16 | % | 11.23 | % | ||||||||||
| Russell 2000 Financial Services Index (12) |
22.48 | % | 15.38 | % | 15.12 | % | 6.75 | % | 9.24 | % | ||||||||||
| Russell 2000 Index (1) |
20.74 | % | 12.18 | % | 13.79 | % | 7.85 | % | 8.49 | % | ||||||||||
| Hennessy Large Cap Financial Fund* |
One Year | Three Years | Five Years | Ten Years | Since Inception (1/03/97) |
|||||||||||||||
| Institutional Class Share - HILFX** |
35.76 | % | 8.65 | % | 13.88 | % | 6.26 | % | 8.20 | % | ||||||||||
| Investor Class Share - HLFNX |
35.16 | % | 8.27 | % | 13.64 | % | 6.15 | % | 8.15 | % | ||||||||||
| Russell 1000 Financial Services Index (13) |
27.41 | % | 12.81 | % | 16.65 | % | 2.68 | % | 7.01 | % | ||||||||||
| Russell 1000 Index (5) |
18.54 | % | 10.63 | % | 14.27 | % | 7.55 | % | 8.22 | % | ||||||||||
| Hennessy Technology Fund* |
One Year | Three Years | Five Years | Ten Years | Since Inception (2/01/02) |
|||||||||||||||
| Institutional Class Share - HTCIX** |
11.16 | % | 7.15 | % | 10.12 | % | 4.84 | % | 6.34 | % | ||||||||||
| Investor Class Share - HTECX |
10.80 | % | 6.79 | % | 9.78 | % | 4.62 | % | 6.20 | % | ||||||||||
| NASDAQ Composite Index (14) |
23.68 | % | 14.41 | % | 17.31 | % | 10.43 | % | 9.27 | % | ||||||||||
| S&P 500 Index (2) |
18.61 | % | 10.81 | % | 14.22 | % | 7.44 | % | 7.46 | % | ||||||||||
10
Table of Contents
| Hennessy Japan Fund* |
One Year | Three Years | Five Years | Ten Years | Since Inception (10/31/03) |
|||||||||||||||
| Institutional Class Share - HJPIX |
13.59 | % | 14.28 | % | 15.35 | % | 6.97 | % | 9.52 | % | ||||||||||
| Investor Class Share - HJPNX |
13.14 | % | 13.92 | % | 15.02 | % | 6.74 | % | 9.30 | % | ||||||||||
| Russell/Nomura Total Market Index (15) |
16.04 | % | 9.46 | % | 11.68 | % | 2.76 | % | 5.30 | % | ||||||||||
| Tokyo Stock Price Index (TOPIX) (16) |
16.29 | % | 9.32 | % | 11.67 | % | 2.63 | % | 5.18 | % | ||||||||||
| Hennessy Japan Small Cap Fund* |
One Year | Three Years | Five Years | Ten Years | Since Inception (8/31/07) |
|||||||||||||||
| Institutional Class Share - HJSIX** |
31.31 | % | 16.20 | % | 20.81 | % | 10.95 | 11.07 | % | |||||||||||
| Investor Class Share - HJPSX |
31.02 | % | 15.97 | % | 20.68 | % | 10.88 | 11.01 | % | |||||||||||
| Russell/Nomura Small Cap Index (17) |
22.29 | % | 14.12 | % | 14.44 | % | 6.86 | 6.84 | % | |||||||||||
| Tokyo Stock Price Index (TOPIX) (16) |
16.29 | % | 9.32 | % | 11.67 | % | 2.63 | % | 2.81 | % | ||||||||||
| * | Performance information from the inception date of the fund through the date Hennessy began managing the fund is included because the previous investment manager(s) managed the fund using a similar investment strategy. |
| ** | Performance shown for periods prior to the inception of Institutional Class shares represents the performance of Investor Class shares of the fund and includes expenses that are not applicable to and are higher than those of Institutional Class shares. |
| *** | Performance shown for periods prior to the inception of Investor Class shares represents the performance of Institutional Class shares of the fund and includes expenses that are not applicable to and are lower than those of Investor Class shares. |
| (1) | The Russell 2000 Index is an unmanaged index commonly used to measure the performance of small-cap U.S. stocks. |
| (2) | The S&P 500 Index, Russell 3000 Index and Dow Jones Industrial Average are unmanaged, broad-based indices commonly used to measure the performance of U.S. stocks. |
| (3) | The Russell Midcap Growth Index is an unmanaged index commonly used to measure the performance of mid-cap, growth oriented U.S. stocks. |
| (4) | The Russell Midcap Index is an unmanaged index commonly used to measure the performance of mid-cap U.S. stocks. |
| (5) | The Russell 1000 Index is an unmanaged index commonly used to measure the performance of large-cap U.S. stocks. |
| (6) | The Russell 1000 Value Index is an unmanaged index commonly used to measure the performance of large-cap, value oriented U.S. stocks. |
| (7) | The 75/25 Blended DJIA/Treasury Index consists of 75% common stocks represented by the Dow Jones Industrial Average and 25% short-duration Treasury securities represented by the ICE BofAML US 3-Month Treasury Bill Index, which is an unmanaged index comprised of U.S. Treasury securities maturing in three months. |
| (8) | The Blended Balanced Index consists of 60% common stocks represented by the S&P 500 Index and 40% bonds represented by the Barclays Capital Intermediate U.S. Government/Credit Index, which is an unmanaged index commonly used to measure the performance of U.S. bonds. |
| (9) | The 50/50 Blended DJIA/Treasury Index consists of 50% common stocks represented by the Dow Jones Industrial Average and 50% short-duration Treasury securities represented by the ICE BofAML 1-Year U.S. Treasury Note Index, which is an unmanaged index comprised of U.S. Treasury securities maturing in approximately one year. |
| (10) | The Barclays Capital Intermediate U.S. Government/Credit Index is an unmanaged index commonly used to measure the performance of U.S. bonds. |
| (11) | The AGA Stock Index is a market capitalization weighted index, adjusted monthly, consisting of member companies of the American Gas Association (AGA). |
| (12) | The Russell 2000 Financial Services Index is an unmanaged index commonly used to measure the performance of U.S. small-cap financial sector stocks. |
| (13) | The Russell 1000 Financial Services Index is an unmanaged index commonly used to measure the performance of U.S. large-cap financial sector stocks. |
11
Table of Contents
| (14) | The NASDAQ Composite Index is a broad-based, capitalization-weighted index of all the NASDAQ National Market and Small Cap stocks. |
| (15) | The Russell/Nomura Total Market Index is a market capitalization-weighted index of Japanese equities and is presented in U.S. Dollar terms. |
| (16) | The Tokyo Stock Price Index (TOPIX) is a market capitalization-weighted index of all companies listed on the First Section of the Tokyo Stock Exchange and is presented in U.S. Dollar terms. |
| (17) | The Russell/Nomura Small Cap Index represents the universe of small-cap companies in the Japanese equity markets and is presented in U.S. Dollar terms. |
Investors cannot invest directly in an index. Performance data for an index does not reflect any deductions for fees, expenses, or taxes.
Development of New Investment Strategies and Expanding Our Product Offerings
We develop new investment strategies and expand our product offerings by identifying client needs and reviewing asset allocation tables to determine where we can augment our family of mutual funds. Once we identify an attractive market segment, we select one of the following methods to initiate the new strategy.
| • | We screen the appropriate universe of stocks with a set of parameters that we believe identifies stocks that will produce higher long-term returns with lower associated risk than their relative indices. We then introduce the new investment strategy into the marketplace by opening and directly marketing a new mutual fund. |
| • | We purchase the assets related to the management of an existing mutual fund that we then manage ourselves. |
| • | We purchase the assets related to the management of an existing mutual fund and then engage the existing portfolio managers or strategic firm to act as a sub-advisor to manage the fund. |
| • | We purchase the assets related to the management of an existing mutual fund and then employ the existing portfolio management team to manage the fund. |
ASSETS UNDER MANAGEMENT, SOURCES OF REVENUES, AND 12B-1 PLANS
We earn revenues primarily by providing investment advisory services to the Hennessy Funds and secondarily by providing shareholder services to shareholders of the Hennessy Funds. The fees we receive for these services are calculated as a percentage of the average daily net asset values of the Hennessy Funds. In addition, the sub-advisor fees that we pay are also calculated as a percentage of the average daily net asset values of the sub-advised Hennessy Funds. The amount of our assets under management fluctuates as a result of organic inflows (purchases of shares of the Hennessy Funds by new or existing shareholders), acquisition inflows, outflows (redemptions of shares of the Hennessy Funds by shareholders), and market appreciation or depreciation.
12
Table of Contents
The following table summarizes our assets under management for the past five fiscal years:
| Total Assets Under Management | ||||||||||||||||||||
| At Each Fiscal Year Ended 2013-2017 | ||||||||||||||||||||
| 9/30/2017 | 9/30/2016 | 9/30/2015 | 9/30/2014 | 9/30/2013 | ||||||||||||||||
| (In thousands) | ||||||||||||||||||||
| Beginning assets under management |
$ | 6,698,519 | $ | 5,987,985 | $ | 5,520,802 | $ | 4,034,181 | $ | 919,262 | ||||||||||
| Acquisition inflows |
434,530 | — | — | 2,222,961 | ||||||||||||||||
| Organic inflows |
1,150,462 | 2,168,840 | 2,603,428 | 2,052,286 | 1,441,677 | |||||||||||||||
| Redemptions |
(2,093,315 | ) | (2,417,384 | ) | (1,961,186 | ) | (1,215,493 | ) | (1,198,521 | ) | ||||||||||
| Market appreciation (depreciation) |
857,146 | 524,548 | (175,059 | ) | 649,828 | 648,802 | ||||||||||||||
|
|
|
|
|
|
|
|
|
|
|
|||||||||||
| Ending assets under management |
$ | 6,612,812 | $ | 6,698,519 | $ | 5,987,985 | $ | 5,520,802 | $ | 4,034,181 | ||||||||||
|
|
|
|
|
|
|
|
|
|
|
|||||||||||
As stated above, the fees we receive for providing investment advisory and shareholder services increase or decrease as our average assets under management rises or falls.
The following table summarizes our sources of revenues, net of sub-advisor fees, for the past five fiscal years.
| Revenues for Fiscal Years Ended 2013 - 2017 | ||||||||||||||||||||
| Years Ended September 30 | ||||||||||||||||||||
| 2017 | 2016 | 2015 | 2014 | 2013 | ||||||||||||||||
| (In thousands) | ||||||||||||||||||||
| Investment advisory fees |
$ | 48,296 | $ | 46,391 | $ | 41,177 | $ | 33,581 | $ | 23,423 | ||||||||||
| Shareholder service fees |
4,659 | 5,019 | 3,562 | 945 | 885 | |||||||||||||||
|
|
|
|
|
|
|
|
|
|
|
|||||||||||
| Subtotal |
52,955 | 51,410 | 44,739 | 34,526 | 24,308 | |||||||||||||||
| Sub-advisor fees |
(9,225 | ) | (8,743 | ) | (7,284 | ) | (5,910 | ) | (3,942 | ) | ||||||||||
|
|
|
|
|
|
|
|
|
|
|
|||||||||||
| Revenues, net of sub-advisor fees |
$ | 43,730 | $ | 42,667 | $ | 37,455 | $ | 28,616 | $ | 20,366 | ||||||||||
|
|
|
|
|
|
|
|
|
|
|
|||||||||||
Investment Advisory Agreements and Fees
We provide investment advisory services to the entire family of the 14 Hennessy Funds pursuant to management contracts with Hennessy Funds Trust. Under these management contracts, we are responsible for the provision of investment advisory services to the Hennessy Funds, subject to the oversight of the Board of Trustees of Hennessy Funds Trust (the “Funds’ Board of Trustees”) and according to each fund’s particular fundamental investment objectives and policies. The services that we provide to each Hennessy Fund pursuant to these management contracts include, among other things, the following:
| • | acting as portfolio manager for the fund or overseeing the sub-advisor acting as portfolio manager for the fund, which includes managing the composition of the fund’s portfolio (including the purchase, retention, and disposition of portfolio securities in accordance with the fund’s investment objectives, policies, and restrictions), ensuring compliance with “best execution” for the fund’s portfolio, managing the use of soft dollars for the fund, and managing proxy voting for the fund; |
13
Table of Contents
| • | performing a daily reconciliation of portfolio positions and cash for the fund; |
| • | monitoring the fund’s compliance with its investment objectives and restrictions and federal securities laws; |
| • | performing activities such as maintaining a compliance program, conducting ongoing reviews of the compliance programs of the fund’s service providers (including its sub-advisor, as applicable), conducting on-site visits to the fund’s service providers (including its sub-advisor, as applicable), monitoring incidents of abusive trading practices, reviewing fund expense accruals, payments, and fixed expense ratios, evaluating insurance providers for fidelity bond coverage, D&O/E&O and cybersecurity insurance coverage, conducting employee compliance training, reviewing reports provided by service providers, maintaining books and records, and preparing an annual compliance report to the Funds’ Board of Trustees; |
| • | overseeing the selection and continued employment of the fund’s sub-advisor, if applicable, monitoring such sub-advisor’s adherence to the fund’s investment objectives, policies, and restrictions, and reviewing the fund’s investment performance; |
| • | overseeing service providers that provide accounting, administration, distribution, transfer agency, custodial, sales and marketing, public relations, audit, information technology, and legal services to the fund; |
| • | maintaining in-house marketing and distribution departments on behalf of the fund; |
| • | being actively involved with preparing all regulatory filings for the fund, including writing and annually updating the fund’s prospectus and related documents; |
| • | preparing or reviewing a written summary of the fund’s performance for the most recent 12-month period for each annual report of the fund; |
| • | monitoring and overseeing the accessibility of the fund on third-party platforms; |
| • | paying the incentive compensation of the fund’s compliance officers and employing other staff such as legal, marketing, national accounts and distribution, sales, administrative, and trading oversight personnel, as well as management executives; |
| • | providing a quarterly compliance certification to Hennessy Funds Trust; and |
| • | preparing or reviewing materials for the Funds’ Board of Trustees, presenting or leading discussions to or with the Funds’ Board of Trustees, preparing or reviewing meeting minutes, and arranging for training and education of the Funds’ Board of Trustees. |
The management contracts also provide that we are responsible for performing any ordinary clerical and bookkeeping services needed by the Hennessy Funds that are not provided by the funds’ custodian, administrator, or transfer agent. The Funds’ Board of Trustees is comprised of our President, Chief Executive Officer and Chairman of the Board, Neil J. Hennessy, and three trustees who are not interested persons of the Hennessy Funds (the “disinterested trustees”). Under the Investment Company Act of 1940, a majority of the disinterested trustees must approve the entry into and continuation of our management contracts. The disinterested trustees also have sole responsibility for selecting and nominating other disinterested trustees.
14
Table of Contents
In exchange for the services described above, we receive an investment advisory fee from each of the Hennessy Funds, which is calculated as a percentage of each fund’s average daily net asset value. As of September 30, 2017, the percentages upon which the annual investment advisory fees payable to us by the Hennessy Funds are based are as follows:
| Hennessy Fund |
Investment Advisory Fee (as a % of fund assets) |
|||
| All Class Shares |
||||
| Hennessy Cornerstone Growth Fund |
0.74 | % | ||
| Hennessy Focus Fund |
0.90 | % | ||
| Hennessy Cornerstone Mid Cap 30 Fund |
0.74 | % | ||
| Hennessy Cornerstone Large Growth Fund |
0.74 | % | ||
| Hennessy Cornerstone Value Fund |
0.74 | % | ||
| Hennessy Total Return Fund |
0.60 | % | ||
| Hennessy Equity and Income Fund |
0.80 | % | ||
| Hennessy Balanced Fund |
0.60 | % | ||
| Hennessy Gas Utility Fund |
0.40 | % | ||
| Hennessy Small Cap Financial Fund |
0.90 | % | ||
| Hennessy Large Cap Financial Fund |
0.90 | % | ||
| Hennessy Technology Fund* |
0.74 | % | ||
| Hennessy Japan Fund |
0.80 | % | ||
| Hennessy Japan Small Cap Fund |
0.80 | % | ||
| * | The investment advisory fee for the Hennessy Technology Fund was reduced from 0.90% to 0.74% effective as of February 28, 2017. |
Effective February 28, 2017, the Company waives fees with respect to the Hennessy Technology Fund to comply with a contractual expense ratio limitation. The fee waiver is calculated daily by the Hennessy Funds’ accountants at U.S. Bancorp Fund Services, LLC and is charged to expense monthly by the Company as an offset to revenues. The waived fee is deducted from investment advisory fee income and reduces the aggregate amount of advisory fees received by the Company in the subsequent month. To date, the Company has only waived fees based on contractual obligations, but the Company has the ability to waive fees at its discretion. Any decision to waive fees voluntarily would not apply to previous periods, but would only apply on a going forward basis.
Our management contracts must be renewed annually (except in limited circumstances) by (i) the Funds’ Board of Trustees or the vote of a majority of the outstanding shares of the applicable Hennessy Fund and (ii) the vote of a majority of the trustees of Hennessy Funds Trust who are not interested persons of the Hennessy Funds. If the management contracts are not renewed annually as described above, they will terminate automatically. There are two additional circumstances in which the management contracts would terminate. First, the management contracts would automatically terminate if the Company assigned them to another advisor (assignment includes “indirect assignment,” which is the transfer of the Company’s common stock in sufficient quantities deemed to constitute a controlling block). Second, each management contract may be terminated prior to its expiration upon 60 days’ notice by either the Company or the applicable Hennessy Fund.
Sub-advisory Agreements and Fees
For four of the Hennessy Funds whose assets related to fund management were acquired through asset purchases, we have delegated the day-to-day portfolio management responsibilities to sub-advisors. In each case, the sub-advisor entity or the individuals working at the sub-advisor entity are the same entities or individuals who advised the fund prior to our purchase of the assets related to the management of such fund. The services that each sub-advisor provides to the applicable Hennessy Fund pursuant to the terms of the sub-advisory agreement we have with such sub-advisor include:
15
Table of Contents
| • | acting as portfolio manager for the fund, which includes managing the composition of the fund’s portfolio (including the purchase, retention, and disposition of portfolio securities in accordance with the fund’s investment objectives, policies, and restrictions), seeking best execution for the fund’s portfolio, managing the use of soft dollars for the fund, and managing proxy voting for the fund; |
| • | ensuring that its compliance programs include policies and procedures relevant to the fund and the sub-advisor’s duties as a portfolio manager to the fund; |
| • | preparing a written summary of the fund’s performance for the most recent 12-month period for each annual report of the fund; and |
| • | providing a quarterly certification to Hennessy Funds Trust regarding trading and allocation practices, supervisory matters, the sub-advisor’s compliance program (including its code of ethics), compliance with the fund’s policies, and general firm updates. |
These sub-advisory services must be delivered in accordance with the terms of the sub-advisory agreement and the sub-advised fund’s Prospectus and Statement of Additional Information, all as subject to the direction, supervision and control of us and the Funds’ Board of Trustees. In exchange for sub-advisory services, we pay sub-advisor fees to the sub-advisors out of our own assets. Sub-advisor fees are calculated as a percentage of the applicable sub-advised fund’s average daily net asset value. The following table lists each of our sub-advised funds, the sub-advisor entity for each fund, and the percentage upon which the annual sub-advisor fees payable by us to the applicable sub-advisor are based:
| Hennessy Fund |
Sub-Advisor (for all class shares) |
Sub-Advisor Fee (as a % of fund assets) |
||||
| Hennessy Focus Fund |
Broad Run Investment Management, LLC | 0.29 | % | |||
| Hennessy Equity and Income Fund |
Financial Counselors, Inc. (fixed income allocation) | 0.27 | % | |||
| The London Company of Virginia, LLC (equity allocation) | 0.33 | % | ||||
| Hennessy Japan Fund |
SPARX Asset Management Co. Ltd. | 0.35 | % | |||
| Hennessy Japan Small Cap Fund |
SPARX Asset Management Co. Ltd. | 0.20 | % | |||
The sub-advisory agreements must be renewed annually in the same manner and are subject to the same termination provisions as the management contracts.
16
Table of Contents
Shareholder Servicing Agreements and Fees
We provide shareholder services to the entire family of the Hennessy Funds pursuant to a shareholder servicing agreement with Hennessy Funds Trust covering Investor Class shares of such funds, although we have only earned shareholder service fees from Investor Class shares of all of (versus only some of) the Hennessy Funds since March 1, 2015. The shareholder services that we provide for the Hennessy Funds include, among other things, the following:
| • | maintaining an “800” number that the current investors of the Hennessy Funds may call to ask questions about the Hennessy Funds or their accounts with the Hennessy Funds; |
| • | assisting the investors in the Hennessy Funds with processing exchange and redemption requests; |
| • | assisting the investors in the Hennessy Funds with changing dividend options, account designations, and addresses; |
| • | responding generally to questions from investors in the Hennessy Funds; and |
| • | providing other similar services that the Hennessy Funds may request. |
In exchange for the services described above, we receive a shareholder service fee from each of the Hennessy Funds, which is calculated as a percentage of the average daily net asset value of each fund’s Investor Class shares. The following table lists each of the Hennessy Funds and the percentages upon which the annual shareholder service fees paid to us by the Hennessy Funds are based:
| Hennessy Fund Investor Class Shares Only |
Shareholder Servicing Fee (as a % of fund assets) |
|||
| Hennessy Cornerstone Growth Fund |
0.10 | % | ||
| Hennessy Focus Fund* |
0.10 | % | ||
| Hennessy Cornerstone Mid Cap 30 Fund |
0.10 | % | ||
| Hennessy Cornerstone Large Growth Fund |
0.10 | % | ||
| Hennessy Cornerstone Value Fund |
0.10 | % | ||
| Hennessy Total Return Fund |
0.10 | % | ||
| Hennessy Equity and Income Fund* |
0.10 | % | ||
| Hennessy Balanced Fund |
0.10 | % | ||
| Hennessy Gas Utility Fund* |
0.10 | % | ||
| Hennessy Small Cap Financial Fund* |
0.10 | % | ||
| Hennessy Large Cap Financial Fund* |
0.10 | % | ||
| Hennessy Technology Fund* |
0.10 | % | ||
| Hennessy Japan Fund |
0.10 | % | ||
| Hennessy Japan Small Cap Fund |
0.10 | % | ||
| * | Commenced March 1, 2015. |
12b-1 Plans
All of the Hennessy Funds have adopted a 12b-1 plan. These plans are named after Rule 12b-1 of the Investment Company Act of 1940, which permits mutual funds to adopt a plan that allows them to collect fees that can be used to make payments to third parties in connection with the distribution of their fund shares. Amounts paid under the plans may be spent on any activities or expenses primarily intended to result in sale of shares of the funds, including, but not limited to, (i) advertising, (ii) compensation paid to financial institutions, broker-dealers, and others for sales and marketing, (iii) shareholder accounting servicing, (iv) the printing and mailing of prospectuses to possible new shareholders, and (v) the printing and mailing of sales literature. Mutual funds may also employ a distributor to distribute and market their fund shares and use 12b-1 fees to pay the distributor for expenses incurred for telephone costs, overhead costs, costs of employees who engage in or support the distribution of the fund shares, the printing of prospectuses and other reports for possible new shareholders, advertising, and the preparation and distribution of sales literature.
17
Table of Contents
The 12b-1 fees for each of the Hennessy Funds is calculated as a percentage of such fund’s average daily net asset value. The following table lists each of the Hennessy Funds and the percentage upon which the 12b-1 fees are based:
| Hennessy Fund Investor Class Shares Only |
12b-1 Fee (as a % of fund assets) |
|||
| Hennessy Cornerstone Growth Fund* |
0.15 | % | ||
| Hennessy Focus Fund |
0.15 | % | ||
| Hennessy Cornerstone Mid Cap 30 Fund* |
0.15 | % | ||
| Hennessy Cornerstone Large Growth Fund* |
0.15 | % | ||
| Hennessy Cornerstone Value Fund* |
0.15 | % | ||
| Hennessy Total Return Fund |
0.15 | % | ||
| Hennessy Equity and Income Fund |
0.15 | % | ||
| Hennessy Balanced Fund |
0.15 | % | ||
| Hennessy Gas Utility Fund |
0.15 | % | ||
| Hennessy Small Cap Financial Fund |
0.15 | % | ||
| Hennessy Large Cap Financial Fund |
0.15 | % | ||
| Hennessy Technology Fund |
0.15 | % | ||
| Hennessy Japan Fund** |
0.15 | % | ||
| Hennessy Japan Small Cap Fund** |
0.15 | % | ||
| * | Effective November 1, 2015. |
| ** | Effective March 1, 2016. |
CUSTODIAL AND BROKERAGE ARRANGEMENTS
A third-party custodian acts as custodian for all of our assets under management.
All trades for the Hennessy Funds are executed by independent brokerage firms following our direction or that of our sub-advisors. When selecting brokers, we and our sub-advisors are required to seek “best execution.” Although there is no single statutory definition, Securities and Exchange Commission (“SEC”) releases and other legal guidelines make clear that the duty to seek best execution requires us to seek “the most advantageous terms reasonably available under the circumstances for a customer’s account.” The lowest possible commission, while important, is not the sole determinative factor. We and our sub-advisors also consider factors such as order size and market depth, availability of competing markets and liquidity, trading characteristics of the security, financial responsibility of the broker-dealer, and the broker’s ability to address current market conditions.
Currently, we participate in “soft dollar” arrangements with some of our brokers. This means that we receive research reports and real-time electronic research to assist us in trading and managing the Hennessy Funds. Under these soft dollar arrangements, the Hennessy Funds pay brokerage commissions for securities trades at the regular, market rate, and some or all of the value of those commissions is received by us in the form of research or other services that benefit the Hennessy Funds. Our soft dollar arrangements comply with SEC guidance regarding soft dollars.
18
Table of Contents
LICENSE AGREEMENT
Our ability to use the names and formulaic investment strategies of the Hennessy Cornerstone Growth Fund and the Hennessy Cornerstone Value Fund are governed by the terms and conditions of a license agreement, dated as of April 10, 2000, with Netfolio, Inc. (formerly known as O’Shaughnessy Capital Management, Inc.). Under the license agreement, Netfolio, Inc. granted us a perpetual, paid-up, royalty-free, exclusive license to use certain trademarks, such as “Strategy Indexing,” “Cornerstone Growth,” and “Cornerstone Value,” as well as the formula investment strategies used by the Hennessy Cornerstone Growth Fund and the Hennessy Cornerstone Value Fund. All of our advertising, marketing, promotional, and other materials incorporating or referring to the trademarks are subject to the prior written approval of Netfolio, Inc., except that we do not need Netfolio, Inc.’s prior written approval to use the trademarks in a manner that is not substantially unchanged from any prior use by Netfolio, Inc. in its own business or from any prior use by us previously approved by Netfolio, Inc. We have the right to assign the license to another person or entity if the assignee agrees in writing to be bound by the terms of the license agreement. There are no ongoing licensing fees associated with this license agreement, and Netfolio, Inc. does not have any contractual rights to terminate the license agreement.
BUSINESS STRATEGY
From the time we launched our first mutual fund in 1996 through the end of fiscal year 2017, we have grown our assets under management to approximately $6.6 billion. During that time, we have consistently pursued a growth strategy centered on organic growth through our marketing and sales efforts and growth through strategic purchases of management-related assets. The implementation of this business strategy is described below.
| • | Delivering strong investment performance of the Hennessy Funds |
One of the most effective ways we can grow the assets of the Hennessy Funds is by delivering strong investment performance, which we believe should:
| • | result in an increase in the value of existing assets of the Hennessy Funds; |
| • | encourage more investors to buy shares of the Hennessy Funds and decrease the number of investors who redeem their shares and leave the Hennessy Funds; and |
| • | motivate current investors to invest additional money in the Hennessy Funds. |
| • | Utilizing our branding and marketing campaign to attract assets |
We believe we can attract investors to the Hennessy Funds by effectively marketing our consistent and repeatable investment process that combines time-tested stock selection strategies with a highly disciplined, team-managed approach. We offer both quantitative funds and actively managed funds. We believe our quantitative funds will attract investors who want to understand exactly how their investments are managed and who favor statistical analysis and empirical evidence as the basis for investment decisions. Alternatively, we believe that our actively managed funds will attract investors who appreciate a fundamental, hands-on investment management approach and talented portfolio managers. We also believe our more conservative, income-generating funds will attract investors seeking an alternative to mutual funds invested entirely in equities.
We run a comprehensive and far reaching public relations program designed to disseminate our message through frequent television appearances, radio spots, feature articles, and print media mentions to a wide variety of potential investors. Our public relations program has consistently resulted in the Hennessy Funds being mentioned in national print and broadcast media an average of once every two to three days on media such as CNBC, Fox News, Bloomberg radio and TV, The Wall Street Journal, Kiplinger, and Barron’s, among others. To facilitate our presence in the media, we utilize LiveStudio, an in-house studio providing a direct link to media broadcasts, at our office in Novato, California. Along with our primary spokesperson, Neil J. Hennessy, who is our President, Chief Executive Officer and Chairman of the Board and President, Chief Investment Officer and a Portfolio Manager of the Hennessy Funds, we also utilize the following Portfolio Managers of the Hennessy Funds as spokespersons: Brian Peery, David Ellison, Winsor (Skip) Aylesworth, and Ryan Kelley. These additional spokespersons have enabled us to further expand our public relations program. We also include our sub-advisors for media coverage to promote our sub-advised funds.
19
Table of Contents
We maintain and regularly update a robust website. We also utilize more focused marketing efforts, such as sending informational and promotional communications, fund performance updates, news articles pertaining to the Hennessy Funds, and Portfolio Manager commentaries to investors and prospective investors. We also participate in exhibitions at select investment advisor trade shows throughout the year. Additionally, we attend strategic industry-related conferences, and Mr. Hennessy participates as a moderator or guest speaker on industry-related panels whenever the opportunity arises.
| • | Expanding our distribution network to additional mutual fund platforms |
One of the ways investors may purchase shares of the Hennessy Funds is through mutual fund supermarkets, such as Schwab, Fidelity, TD Ameritrade and Pershing. Mutual fund supermarkets generally offer funds of many different investment companies to investors, in exchange for a services fee paid by the applicable fund or that fund’s investment advisor. This ability to purchase various mutual funds in a single location is very attractive to investors. The majority of our $6.6 billion of assets under management as of September 30, 2017, is held at mutual fund supermarkets.
Investments in the Hennessy Funds are also available through national wire houses and broker-dealers, as well as independent and regional broker-dealers. We see continued opportunities to form new relationships with these financial institutions, thereby enhancing the accessibility of our no-load mutual funds to investors.
| • | Increasing our current base of financial advisors and investment professionals |
Investment professionals generally have access to a wide variety of investment products they may recommend to their investors. A recommendation by an investment professional to an investor to buy one of the Hennessy Funds may greatly influence that investor. Thus, we believe that expanding our current base of investment professionals who utilize no-load funds for their investors will help us increase our assets under management, which will in turn increase our revenues.
| • | Securing participation on the platforms of national, full-service firms |
We continually strive to develop relationships with national full-service firms that permit their investment professionals to offer no-load funds to their investors as a way to increase the amount of assets that we manage, which will in turn increase our revenues.
| • | Pursuing strategic purchases of management agreements for additional mutual funds |
A primary component of our growth strategy is to selectively pursue strategic purchases of assets related to management of additional mutual funds. We believe the regulatory burden imposed upon the mutual fund industry, along with increased competition, has compressed the margins of smaller to mid-sized mutual fund managers, making those managers more receptive to an asset purchase. We believe that we are well prepared to benefit from these attractive asset purchase trends and from the increasing supply of potential targets. In addition, we believe there are a number of attractive asset purchase opportunities from mutual fund managers who are reaching retirement age or who are leaving the mutual fund management arena. We have generally been able to offer lower overall expense ratios to the shareholders of purchased funds. In some instances, we have also been able to improve performance.
20
Table of Contents
Through our asset purchase strategy, we have successfully completed eight asset purchases of management-related assets over a 17-year period, and we have efficiently integrated $3.7 billion of net assets of 25 different mutual funds into the Hennessy Funds family. Our most recent asset purchase was completed on September 23, 2016, when we purchased assets related to the management of The Westport Funds, adding an additional $435 million to our assets under management. In addition, we signed a definitive agreement with Manning & Napier Group, LLC and Rainier Investment Management, LLC to purchase the assets related to the management of three Rainier Funds – the Rainier Large Cap Equity Fund, the Rainier Small/Mid Cap Equity Fund, and the Rainier Mid Cap Equity Fund. Upon completion of the transaction, which is subject to the approval of the shareholders of the Rainier Funds, the assets related to the Rainier Large Cap Equity Fund will merge into the Hennessy Cornerstone Large Growth Fund and the assets related to the Rainier Mid Cap Equity Fund and the Rainier Small/Mid Cap Equity Fund will be merged into the Hennessy Cornerstone Mid Cap 30 Fund.
| • | Delivering strong, high-quality financial results. |
We seek to maintain a strong financial position and to manage our investment advisory business to meet the highest regulatory, ethical and business standards and to maintain continuity of service to all of the investors in the Hennessy Funds.
COMPETITION
The investment advisory industry is highly competitive, with new competitors continually entering the industry. We compete directly with numerous global and U.S. investment managers, commercial banks, savings and loans associations, brokerage and investment banking firms, broker-dealers, insurance companies, and other financial institutions that often provide investment products with similar features and objectives to those we offer. These institutions range from small boutique firms to large financial services complexes. We are considered a small investment advisory company. Many competing companies are part of larger financial services companies that conduct business in more markets and have greater marketing, financial, technical, research and distribution resources and other capabilities than we do. Most of the larger firms offer a broader range of financial services to the same retail and institutional investors we seek to serve. These factors may place us at a competitive disadvantage, and we can give no assurance that our strategies and efforts to maintain and enhance our current investor relationships, as well as to create new ones, will be successful. To grow our business, we must be able to compete effectively for assets under management. Key competitive factors include:
| • | the investment performance for the Hennessy Funds; |
| • | the expense ratios of the Hennessy Funds; |
| • | the array of our product offerings; |
| • | industry rankings for the Hennessy Funds; |
| • | the quality of our services; |
| • | our ability to further develop and market our brand; |
| • | our commitment to placing the interests of investors first; and |
| • | our general business reputation. |
Increased competition could reduce the demand for our products and services, which could have a material adverse effect on our business, results of operations, and financial condition.
Competition is an important risk that our business faces and should be considered along with other risk factors that we discuss in Item 1A, “Risk Factors,” below.
21
Table of Contents
REGULATORY ENVIRONMENT
We are subject to extensive and increasing federal and state laws and regulations intended to protect shareholders of mutual funds and investors of registered investment advisors. We believe we are in compliance in all material respects with all applicable laws and regulations.
We are registered as an investment advisor with the SEC and therefore must comply with the requirements of the Investment Advisers Act of 1940 and related SEC regulations. Such requirements relate to, among other things, fiduciary duties to investors, engaging in transactions with investors, maintaining an effective compliance program, solicitation arrangements, conflicts of interest, advertising, limitations on agency cross and principal transactions between an advisor and advisory investors, recordkeeping and reporting requirements, disclosure requirements and general anti-fraud provisions.
We manage accounts for the Hennessy Funds on a discretionary basis, with authority to buy and sell securities for each portfolio, select broker-dealers to execute trades, and negotiate brokerage commission rates. In connection with certain of these transactions, we receive soft dollar credits from broker-dealers that have the effect of reducing certain of our expenses. All of our soft dollar arrangements are intended to be within the safe harbor provided by Section 28(e) of the Securities Exchange Act of 1934, as amended (the “Exchange Act”). If our ability to use soft dollars were reduced or eliminated as a result of the implementation of statutory amendments or new regulations, our operating expenses would increase.
Our mutual funds are registered with the SEC under the Investment Company Act of 1940, which imposes additional obligations on both the funds and the advisor, including detailed operational requirements. While we exercise broad discretion over the day-to-day management of the business and affairs of the Hennessy Funds and the investment portfolios of the Hennessy Funds, our own operations are subject to oversight and management by the Funds’ Board of Trustees. Under the Investment Company Act of 1940, a majority of the trustees must not be “interested persons” with respect to us (sometimes referred to as the “independent trustee” requirement). The responsibilities of the Funds’ Board of Trustees include, among other things, annually approving the continuation of our investment management agreements with the Hennessy Funds, approving other service providers, determining the method of valuing assets, and monitoring transactions involving affiliates. The Investment Company Act of 1940 also imposes on the investment advisor to a mutual fund a fiduciary duty with respect to the receipt of the advisor’s investment advisory fees. That fiduciary duty may be enforced by the SEC, by administrative action, or by litigation by investors in the Hennessy Funds pursuant to a private right of action.
The SEC is authorized to institute proceedings and impose sanctions for violations of the Investment Advisers Act of 1940 and the Investment Company Act of 1940, ranging from fines and censures to the suspension of individual employees to termination of an investment advisor’s registration. A violation of applicable law or regulations could also subject us, our directors and our employees to civil actions brought by private parties. We believe we are in compliance in all material respects with all applicable SEC requirements.
EMPLOYEES
As of September 30, 2017, we employed 23 employees, 20 of whom were full-time employees.
The executive officers of the company are Neil J. Hennessy, President, Chief Executive Officer and Chairman of the Board of our Board of Directors; Teresa M. Nilsen, Executive Vice President, Chief Operating Officer, Chief Financial Officer, Secretary and a member of our Board of Directors; and Daniel B. Steadman, Executive Vice President in charge of expansion, Chief Compliance Officer and a member of our Board of Directors. In addition to our executive officers’ responsibilities at Hennessy Advisors, Inc., Mr. Hennessy serves as President, Chief Investment Officer, and a Portfolio Manager of the Hennessy Funds and is a member of the Funds’ Board of Trustees, Ms. Nilsen is an Executive Vice President and Treasurer of the Hennessy Funds, and Mr. Steadman is an Executive Vice President and Secretary of the Hennessy Funds.
22
Table of Contents
AVAILABLE INFORMATION
We make available free of charge through a link on our website, www.hennessyadvisors.com, our Annual Report on Form 10-K, Quarterly Reports on Form 10-Q, Current Reports on Form 8-K, and, if applicable, amendments to those reports filed or furnished pursuant to Section 13(a) or 15(d) of the Exchange Act as soon as reasonably practicable after we electronically file such material with, or furnish it to, the SEC. We are not including the information contained on our website as part of, or incorporating it by reference into, this Annual Report on Form 10-K.
| ITEM 1A. | RISK FACTORS |
We face many risks and uncertainties, several of which are inherent in the financial services industry and the investment advisory business. Investors should carefully consider the risks described below, together with all of the other information included in this Annual Report on Form 10-K, in evaluating us and our common stock. Our business, results of operations, financial condition, and stock price could be materially adversely affected by any of the risks we face, including those described below.
Volatility in and disruption of the capital markets and changes in the economy may significantly affect our revenues.
The securities markets are inherently volatile and may be affected by factors beyond our control, including global economic conditions, industry trends, interest and inflation rate fluctuations, and other factors that are difficult to predict. Because our assets under management is largely concentrated in equity products, our results are particularly susceptible to downturns in the equity markets. We derive all of our operating revenues from investment advisory fees and shareholder service fees paid to us by the Hennessy Funds. These fees are calculated as a percentage of the average daily net asset value of the Hennessy Funds. Accordingly, our revenues increase or decrease as our average assets under management increases or decreases, which is affected by market appreciation or depreciation and purchases and redemptions of shares of the Hennessy Funds. This risk is further discussed and quantified in Item 7A, “Quantitative and Qualitative Disclosures About Market Risk,” below.
Investors in the Hennessy Funds can redeem their investments at any time and for any reason, including poor investment performance. A decline in our assets under management adversely affects our revenues.
Investors in the Hennessy Funds may redeem their investments at any time and for any reason without prior notice. Success in the investment advisory and mutual fund business is largely dependent on investment performance, as well as client servicing and distribution. If the Hennessy Funds perform poorly compared to the mutual funds of other investment advisory firms, we may experience a decrease in purchases of shares and an increase in redemptions of shares of the Hennessy Funds, thereby reducing our assets under management and adversely affecting our revenues.
Adverse opinions of the Hennessy Funds by third parties, including rating agencies or industry analysts, could decrease new investments in, or accelerate redemptions from, the Hennessy Funds, which would adversely affect our revenues.
The Hennessy Funds are rated, ranked, and assessed by independent third parties, including rating agencies, industry analysts, distribution partners, and industry periodicals. These ratings, rankings, and assessments often influence the investment decisions of investors, but they can be affected by a number of factors that are not under our direct control, and they may change frequently. For example, a ranking agency like Morningstar may change its ranking designs and methodology, which could result in a decrease in the ratings of the Hennessy Funds without any action on our part. If the Hennessy Funds received an adverse rating, ranking, or assessment from a third party, it could result in an increase in the withdrawal of assets from the Hennessy Funds by existing investors and the inability to attract additional investments into the Hennessy Funds from existing and new investors, thereby reducing our assets under management and adversely affecting our revenues.
23
Table of Contents
Investor behavior is influenced by short-term investment performance of mutual funds.
Investor behavior may be based on many factors, including short-term investment performance. Poor short-term performance of the Hennessy Funds, irrespective of longer-term success, could potentially lead to a decrease in purchases of shares of the Hennessy Funds and an increase in redemptions, thereby reducing our assets under management and adversely affecting our revenues.
The failure or negative performance of products offered by competitors may have a negative impact on the Hennessy Funds within such similar product type, irrespective of our fund performance.
Many competitors offer similar products to the Hennessy Funds, and the failure or negative performance of competitors’ products could lead to a loss of confidence in the corresponding products in the Hennessy Funds lineup, irrespective of the performance of such funds. Any loss of confidence in a product type could lead to redemptions in the Hennessy Fund within such product type, which could have a material adverse effect on our business, results of operations, and financial condition.
We derive a substantial portion of our revenues from a limited number of the Hennessy Funds.
During fiscal year 2017, our average assets under management was concentrated in the following three Hennessy Funds: (i) the Hennessy Focus Fund (39% of average assets under management); (ii) the Hennessy Gas Utility Fund (22% of average assets under management); and (iii) the Hennessy Cornerstone Mid Cap 30 Fund (17% of average assets under management). Consequently, our revenues followed a similar pattern of concentration: (a) the Hennessy Focus Fund (46% of total revenue); (b) the Hennessy Cornerstone Mid Cap 30 Fund (16% of total revenue); and (c) the Hennessy Gas Utility Fund (14% of total revenue). As a result, our operating results are particularly dependent upon the performance of these funds and our ability to maintain and grow assets under management in these funds. If any of these funds were to experience a significant increase in redemptions for any reason, our assets under management would be reduced, adversely affecting our revenues.
We face intense competition in attracting investors and retaining net assets in the Hennessy Funds.
The investment advisory industry is intensely competitive, and new participants are continually entering the industry. We compete directly with numerous global and U.S. investment advisors, commercial banks, savings and loan associations, brokerage and investment banking firms, broker-dealers, insurance companies, and other financial institutions that often provide investment products with similar features and objectives to those we offer. These institutions range from small boutique firms to large financial services complexes. We are considered a small investment advisory company. Many competing companies are part of larger financial services companies that conduct business in more markets and have greater marketing, financial, technical, research, and distribution resources and other capabilities than we do. Most of the larger firms offer a broader range of financial services to the same retail and institutional investors we seek to serve. If we are unable to attract investors and retain net assets in the Hennessy Funds due to increased competition, our revenues could decline and we could experience a material adverse effect on our business, results of operations, and financial condition.
For more information regarding competitive factors, see the “Competition” subheading in Item 1, “Business,” above.
24
Table of Contents
Market consolidation and industry trends could negatively impact our business.
In recent years, there have been several instances of industry consolidation, both in the area of distributors and managers of investment products. Further consolidation may occur in these areas in the future. The increasing size and market influence of certain distributors of our products and of certain direct competitors may have a negative impact on our ability to compete at the same levels of profitability in the future. Additionally, the market environment in recent years has led some investors to increasingly favor lower–fee, passive products. As a result, investment advisors that emphasize passive products have gained, and may continue to gain, market share from active managers like us. While we cannot predict how much market share these competitors will gain, we believe there will always be demand for good active management.
Our investment advisory and shareholder servicing agreements can be terminated on short notice, are not freely assignable, and must be renewed annually; the loss of such agreements would reduce our revenues.
We generate all of our operating revenues from the investment advisory and shareholder servicing agreements with the Hennessy Funds. These agreements may be terminated without penalty on 60 days’ notice and may not be assigned without investor consent. In addition, they must be renewed annually by (i) the Funds’ Board of Trustees or the vote of a majority of the outstanding shares of the applicable Hennessy Fund and (ii) a majority of the disinterested trustees of Hennessy Funds Trust. The termination or non-renewal of these agreements, or the renegotiation of the terms of these agreements in a manner detrimental to us, could result in a substantial reduction of our revenues, which could have a material adverse effect on our business, results of operations, and financial condition.
We utilize unaffiliated sub-advisors to manage the portfolio composition of certain of the Hennessy Funds and any matters that have an adverse impact on their businesses, or any change in our relationships with our sub-advisors, could lead to a reduction in assets under management, which would adversely affect our revenues.
We utilize unaffiliated sub-advisors to manage the portfolio composition of four of the Hennessy Funds. Although we perform due diligence on our sub-advisors, we do not manage their day-to-day business activities. Our financial condition and profitability may be adversely affected by situations that are specific to such sub-advisors, such as a disruption of their operations, exposure to disciplinary action or reputational harm.
We periodically negotiate the terms and conditions of these sub-advisory relationships, and there can be no assurance that such terms will remain acceptable to us or our sub-advisors. These relationships may also be terminated by us or the applicable sub-advisor upon short notice without penalty. An interruption or termination of our sub-advisory relationships could affect our ability to market our sub-advised funds and result in a reduction in assets under management, which would adversely affect our revenues.
Assets invested through third-party intermediaries have a higher risk of redemption and are subject to changes in fee structures, which could reduce our revenues.
Investments in the Hennessy Funds made through third-party intermediaries, as opposed to direct investments in the Hennessy Funds, can be more easily moved to investments in funds outside of the Hennessy Fund family. Third-party intermediaries are attractive to investors because of the ease of accessibility to a variety of funds, but this causes the investments to be more sensitive to fluctuations in performance, especially in the short-term. If we were unable to retain the assets of the Hennessy Funds held through third-party intermediaries, our assets under management would be reduced. As a result, our revenues could decline and our business, results of operations and financial condition could be materially adversely affected.
25
Table of Contents
We depend on third-party investment professionals and the distribution channels they utilize to market the Hennessy Funds.
Our primary source of distribution of the Hennessy Funds is through intermediaries that include national, regional and independent broker-dealers, financial planners and registered investment advisors. Our success is highly dependent on access to these various distribution channels. We cannot guarantee we will be able to retain access to these channels at similar pricing or at all. Increasing competition for these distribution channels could cause our distribution costs to rise, which could have a material adverse effect on our net income. These distribution intermediaries can generally terminate their relationship with us on short notice. Moreover, new fiduciary regulations have led to, and may continue to lead to, significant shifts in distributors’ business models and more limited product offerings, potentially resulting in reduced distribution of certain of the Hennessy Funds. Our lack of access to these distribution channels could have a material adverse effect on our business because investment professionals may not distribute the Hennessy Funds if we are no longer participants on the platforms of firms that permit their investment professionals to utilize no-load funds for their investors. Either of these events could cause the net assets of the Hennessy Funds to decline, which would decrease our revenues and have a material adverse effect on our results of operations.
In addition, these intermediaries generally offer their customers a broad array of investment products that are in addition to, and compete with, the Hennessy Funds. The intermediaries or their customers may favor competing investment products over the Hennessy Funds. To the extent that current or future intermediaries or their customers prefer to do business with our competitors, our market share, revenues, and net income could decline.
Industry trends and market pressure to lower our investment advisory fees could reduce our profit margin.
Our profits are highly dependent on the fees we are able to charge to the Hennessy Funds for investment advisory services. To the extent we are forced to compete on the basis of the investment advisory fees we charge to the Hennessy Funds, we may not be able to maintain our current fee structures. We have historically competed primarily on the performance of the Hennessy Funds and not on the level of our investment advisory fees relative to those of our competitors. In recent years, however, there has been a trend toward lower fees in the investment advisory industry. In order for us to maintain our fee structure in a competitive environment, we must be able to provide our mutual fund investors with investment returns and service that will adequately compensate them for investing in our mutual funds with our current fee structures. We cannot be assured that we will succeed in maintaining our current fee structures. Fee reductions on existing or future business could have a material adverse effect on our results of operations.
We may be required to forego all or a portion of our fees under our management contracts covering the Hennessy Funds.
On an annual basis, the Funds’ Board of Trustees must conduct analysis regarding the reasonableness of our investment advisory fees. We regularly analyze the expense ratios of the Hennessy Funds and have the right to waive fees at our discretion to compete with other mutual funds with lower expense ratios (although in the past we have only waived fees based on contractual obligations). Any decision to waive fees voluntarily would not apply to previous periods, but would only apply on a going forward basis.
We utilize quantitative investment strategies for some of the Hennessy Funds that require us to invest in specific portfolios of securities and hold these positions for a specified period of time regardless of performance.
Our formula-driven funds adhere to specific investment strategies during the annual rebalancing period and throughout the course of the year. Adhering to our investment strategies may result in the sale of securities that have been performing well in the near term and the purchase of securities that have been performing less well in the near term. Additionally, we will maintain a position in a relatively poorly performing security throughout the course of the portfolio holding period. Either of these actions could, in theory, result in relatively low performance of the formula-driven Hennessy Funds and adversely affect the net assets of such Hennessy Funds. A decrease in the net assets of the Hennessy Funds would adversely affect our revenues.
26
Table of Contents
The Hennessy Japan Fund and the Hennessy Japan Small Cap Fund invest in the Japanese stock market in yen, which involves foreign exchange and economic uncertainties.
The Hennessy Japan Fund and the Hennessy Japan Small Cap Fund are invested in securities listed on the Japanese stock market, which exposes these funds to risks that are not typically associated with an investment in a U.S. issuer. The values of these funds fluctuate with changes in the value of the Japanese yen versus the U.S. dollar. Investments in Japanese securities also expose these funds to the economic uncertainties affecting Japan. Japanese financial accounting standards and practices may differ, and there may be less information on Japanese companies available publicly. If these circumstances result in a reduction of the total assets of the Hennessy Japan Fund and the Hennessy Japan Small Cap Fund, our assets under management would be reduced, which would adversely affect our revenues.
The terms of our loan agreement may restrict our current and future operations, particularly our ability to respond to certain changes or to take future actions. In addition, certain events could cause us to default on our loan agreement.
The gross amount outstanding under our loan agreement with U.S. Bank National Association (“U.S. Bank”) and California Bank & Trust, as of the end of fiscal year 2017, was $26.3 million (initially $35.0 million, consisting of a $20.0 million promissory note to U.S. Bank and a $15.0 million promissory note to California Bank & Trust). The loan agreement contains a number of covenants that collectively impose operating and financial restrictions on us, including restrictions that may limit our ability to engage in acts that may be in our long-term best interests. The loan agreement also contains a number of events that would constitute an event of default, such as a failure by us to comply with the covenants in the loan agreement or the termination or non-renewal of one or more of our management contracts if such termination or non-renewal would reasonably be expected to have a material adverse effect on us. The occurrence of an event of default would give the lenders the right to declare our borrowings, together with accrued and unpaid interest, to be immediately due and payable. In addition, the lenders would have the right to proceed against the collateral we granted to them, which consists of substantially all of our assets. If the debt under our loan agreement were accelerated, we might not have sufficient cash on hand or be able to sell sufficient collateral to repay this debt, which would have an immediate material adverse effect on our business, results of operations, and financial condition.
An increase in our borrowing costs may adversely affect our earnings and liquidity.
Under our current loan agreement with U.S. Bank and California Bank & Trust, our interest rate is effectively 4.237% as of the end of fiscal year 2017. Because the interest payable is a floating rate (see further discussion in Footnote 7 to the Financial Statements under Item 8, “Financial Statements and Supplementary Data,” below), the interest expense we incur will vary with changes in the applicable reference rate. As a result, an increase in short-term interest rates will increase our interest costs and could adversely affect our liquidity. Failure to maintain adequate liquidity could lead to unanticipated costs and force us to revise our strategic and business initiatives, materially adversely affecting our business, results of operations, and financial condition.
We depend on key personnel to manage our business, and the loss of any of their services, combined with our inability to identify and retain a suitable replacement for such person, could materially adversely affect us. Additionally, the cost to retain our key personnel could put pressure on our operating margins.
Our success is largely dependent on the skills, experience, and performance of our key personnel. The business acumen, investment advisory expertise, and business relationships of our key personnel are critical elements in operating and expanding our business. The loss of services of any of our key personnel for any reason, combined with our inability to identify and retain a suitable replacement for such person, could have a material adverse effect on our business, results of operations, and financial condition. Moreover, in order to retain key personnel, we may be required to increase compensation to such individuals, resulting in additional expense.
27
Table of Contents
Management contracts purchased by us are currently classified as an indefinite life asset subject to impairment analysis. The impairment analysis is based on subjective criteria, and an impairment loss could be recorded.
The investment management contracts that we have purchased, a $74.6 million asset on the balance sheet as of the end of fiscal year 2017, are considered an intangible asset with an indefinite useful life. Management reviews the classification of the asset as an asset with an “indefinite life” each reporting period. If our purchased investment management contracts are ever classified in the future as an asset with a definite life, we would begin amortizing such agreements over their remaining useful life. If the contracts continue to be classified as an indefinite life asset, we would continue to review the carrying value to determine if any impairment has occurred. The analysis has been based on anticipated future cash flows, which are calculated based on assets under management. Although the contracts are not currently impaired, there is always a possibility of impairment in the future, which could require us to write-off all or a portion of the contracts. A write-off, depending on the amount, could have operational risks and could have a significant impact on the value of our equity and our earnings per share.
We pursue strategic asset purchases as part of our regular business strategy, and such acquisitions involve inherent risks that could adversely affect our operating results and financial condition and potentially dilute the holdings of current shareholders.
As part of our regular business strategy, we pursue strategic purchases of assets related to management of additional mutual funds. This strategy is accompanied by risks including, among others, the possibility of the following:
| • | the potential unavailability of attractive acquisition opportunities; |
| • | a high level of competition from other companies that may have greater financial resources than we do; |
| • | our inability to value potential asset purchases accurately and negotiate acceptable purchase terms; |
| • | our inability to secure enough affirmative votes to gain approval from the target fund’s shareholders of the proposed fund reorganization related to the acquisition of the management assets; |
| • | the loss of mutual fund assets paid for in an asset purchase through redemptions by shareholders of the mutual funds involved in the asset purchase; |
| • | higher than anticipated asset purchase expenses; |
| • | our inability to successfully integrate and maintain adequate infrastructure to support business growth; |
| • | increasing our leverage; |
| • | the potential diversion of our management’s time and attention; |
| • | dilution to our shareholders if we fund an asset purchase in whole or in part with our common stock; and |
| • | adverse effects on our earnings if purchased intangible assets become impaired. |
28
Table of Contents
While we seek to mitigate these risks through, among other things, due diligence and indemnification provisions, these or other risk-mitigating measures that we put in place may not be sufficient to address these risks. If one or more of these risks occur, we may be unable to successfully complete a purchase of management-related assets (thereby requiring us to write-off any related expenses), we may experience an impairment of management contract valuations, we may receive negative publicity or suffer other negative impacts on our reputation, and we may not achieve the expected return on investment. Any of these results could have an adverse effect on our business, results of operations, and financial condition.
The potential future growth of our business may place significant demands on our resources and employees, and may increase our expenses, risks, and regulatory oversight.
The potential future growth of our business may place significant demands on our infrastructure and our investment team and other employees, which may increase our expenses. The potential inability of our systems to accommodate an increasing volume of transactions could constrain our ability to expand our businesses. We may face significant challenges in maintaining and developing adequate financial and operational controls, implementing new or updated information and financial systems, managing and appropriately sizing our work force, and updating other components of our business on a timely and cost-effective basis. There can be no assurance that we will be able to manage the growth of our business effectively, or that we will be able to continue to grow, and any failure to do so could adversely affect our ability to generate revenues and control our expenses.
Higher insurance premiums and increased insurance coverage risks could increase our costs and reduce our profitability.
While we carry insurance in amounts and under terms that we believe are appropriate, we cannot guarantee that our insurance will cover all liabilities and losses to which we may be exposed or, if covered, that such liabilities and losses will not exceed the limits of available insurance coverage, or that our insurers will remain solvent and meet their obligations. In addition, we cannot guarantee that our insurance policies will continue to be available at current terms and fees.
We are subject to regulatory and governmental inquiries and civil litigation. An adverse outcome of any such proceeding could involve substantial financial penalties. Various claims may also arise against us in the ordinary course of business, such as employment-related claims. There has been increased incidence of litigation and regulatory investigations in the financial services industry in recent years, including customer claims and class action suits alleging substantial monetary damages. Certain insurance coverage may not be available or may be prohibitively expensive in future periods. As our insurance policies come up for renewal, we may need to assume higher deductibles or co-insurance liabilities, or pay higher premiums, which would increase our expenses and have a material adverse effect on our results of operations.
We are highly dependent on various software applications and other technologies, as well as on third parties who utilize various software applications and other technologies, for our business to function properly and to safeguard confidential information; any significant limitation, failure, or security breach could constrain our operations.
We use software and related technologies throughout our business and also utilize third-party vendors who use software and related technologies to provide services to us and the Hennessy Funds. Although we take protective measures (including striving to understand the protective measures of our third-party vendors) and endeavor to modify them as circumstances warrant, we may experience system delays and interruptions as a result of natural disasters, power failures, acts of war, third-party failures, or other unexpected events. We cannot predict with certainty all of the adverse effects that could result from the failure to efficiently address and resolve these delays and interruptions. We could also be subject to losses if we fail to properly safeguard sensitive and confidential information. As part of our normal business operations, we and certain of our third-party vendors store and transmit confidential and proprietary information. Although we take protective measures, the security of our and our vendors’ computer systems, software, and networks may be vulnerable to hacking, breaches, unauthorized access, misuse, computer viruses, or other malicious code and other events that could have a security impact, such as an authorized employee or vendor inadvertently or intentionally causing us to release confidential or proprietary information. Finally, although we take precautions to password protect and encrypt our laptops and other mobile electronic hardware, if such hardware is stolen, misplaced, or left unattended, it may become vulnerable to hacking or other unauthorized use, creating a possible security risk and resulting in potentially costly actions.
29
Table of Contents
There have been a number of recent highly publicized cases involving financial services and consumer-based companies reporting the unauthorized disclosure of client or customer information, as well as cyber-attacks involving the dissemination, theft, and destruction of corporate information or other assets, as a result of failure to follow procedures by employees or contractors or as a result of actions by third parties, including actions by terrorist organizations and hostile foreign governments.
If any of these events occur, we could suffer a financial loss, a disruption of our business, liability to the Hennessy Funds and their investors, regulatory intervention, or reputational damage, any of which could have a material adverse effect on our business, results of operations and financial condition. In addition, we may be required to expend significant additional resources to modify our protective measures or to investigate and remediate vulnerabilities or other exposures.
We are exposed to legal risk and litigation, which could increase our expenses and reduce our profitability.
In recent years, the volume of claims and amount of damages claimed in litigation and regulatory proceedings against the financial services industry have been increasing. While we strive to conduct our business in accordance with the highest ethical standards, we nevertheless remain exposed to litigation risk. We could be sued by many different parties, including, by way of example, investors in the Hennessy Funds, our own shareholders, our employees or regulators. Lawsuits or investigations that we may become involved in could be very expensive and highly damaging to our reputation, even if the underlying claims are without merit.
In addition, the Dodd-Frank Wall Street Reform and Consumer Protection Act included “whistleblower” provisions that entitle persons who report alleged wrongdoing to the SEC to cash rewards. According to a recent annual report to Congress on the Dodd-Frank Whistleblower Program, whistleblower claims have increased significantly since the enactment of these provisions. Addressing such claims could generate significant expenses and take up significant management time, even for frivolous or non-meritorious claims.
Any damage to our reputation could harm our business and lead to a reduction in revenues and profitability.
Our success depends, in part, on maintaining a strong reputation in the investment community. Our reputation is vulnerable to many threats that can be difficult or impossible to control and costly or impossible to remediate, even if they are without merit or satisfactorily addressed. Our reputation may be impacted by many factors, including, but not limited to, litigation, regulatory inquiries or investigations, conflicts of interest, employee misconduct, and rumors. Any damage to our reputation could result in redemptions by investors in the Hennessy Funds, impede our ability to attract new investors, or negatively impact our relationships with third-party intermediaries, all of which could result in a material adverse effect to our business, results of operations, and financial condition.
Our business is extensively regulated, which increases our costs of doing business, and our failure to comply with regulatory requirements may harm our financial condition.
Our business is subject to extensive regulation in the United States, particularly by the SEC. We are subject to regulation under the Securities Act of 1933, as amended (the “Securities Act”), the Exchange Act, the Investment Company Act of 1940, the Investment Advisers Act of 1940, and various other statutes. The regulations we are subject to are designed primarily to protect investors in the Hennessy Funds as opposed to our shareholders. In addition to an increased number of applicable laws and regulations, the mutual fund industry has undergone increased scrutiny by the SEC and state regulators for the past several years, resulting in numerous enforcement actions, “sweep” examinations, and new rules and rule proposals. These actions have increased our costs in managing the Hennessy Funds, and we could continue to experience higher costs if new rules, regulations, or legislation require us to spend more time, hire additional personnel, or buy new technology to comply with these rules, regulations, and laws. The changes in rules, regulations, or laws could also have a material adverse effect on us by limiting the sources of our revenues and increasing our costs. Our business may be materially affected not only by securities regulations, but also by regulations of general application. For example, the amount of net assets in the Hennessy Funds in a given time period could be affected by, among other things, existing and proposed tax legislation and other governmental regulations and policies, including the interest rate policies of the Federal Reserve Board. As another example, federal legislation relating to cybersecurity could impose additional requirements on our operations.
30
Table of Contents
Although we strive to conduct our business in accordance with applicable rules, regulations, and laws, if we were found to have violated an applicable rule, regulation, or law, we could be subject to fines, suspensions of personnel, or other sanctions, including revocation of our registration as an investment advisor. If a sanction were imposed against us or our personnel, even if only for a small monetary amount, the adverse publicity related to such a sanction could harm our reputation, result in redemptions by investors in the Hennessy Funds and impede our ability to attract new investors, all of which could result in a material adverse effect to our business, results of operations, and financial condition.
The U.S. Department of Labor’s fiduciary rule could adversely affect our financial condition and results of operations.
In April 2016, the U.S. Department of Labor (the “DOL”) issued a final regulation redefining “investment advice fiduciary” under the Employee Retirement Income Security Act (“ERISA”) and the Internal Revenue Code. The final regulation significantly expands the class of advisers and the scope of investment advice that are subject to fiduciary standards, imposing the same fiduciary standards on advisers to individual retirement accounts that have historically only applied to plans covered by ERISA. The DOL also finalized certain prohibited transaction exemptions that allow investment advisers to receive compensation for providing investment advice under arrangements that would otherwise be prohibited due to conflicts of interest. Certain of the DOL regulation requirements became applicable on April 10, 2017, with certain additional requirements becoming applicable on July 1, 2019. Financial advisors and broker-dealers have made, or may make, significant operational changes as a result of the DOL regulation, including with respect to portions of their businesses that are not directly impacted by the DOL regulation. We continue to review and analyze the potential impact to our business of such operational changes. These operational changes may result in a decrease in purchases of shares or an increase in redemptions of shares of the Hennessy Funds, which would adversely affect our assets under management, and thus our revenues.
Our management contracts require us to adhere to the investment policies and strategies of the Hennessy Funds; any failure to comply with such requirements could result in claims, losses or regulatory sanctions.
Our management contracts with the Hennessy Funds contain contractual provisions that require us to comply with the investment policies and strategies of the Hennessy Funds when we provide our investment advisory services. We are also required to comply with numerous investment, asset valuation, distribution, and tax requirements under applicable law and regulations. Any allegation of a failure to adhere to these requirements could result in investor claims, reputational damage, withdrawal of assets and potential regulatory sanctions, any of which could negatively impact our revenues and earnings. We have implemented procedures and utilize the services of experienced administrators, accountants, and lawyers to assist in satisfying these requirements, but there can be no assurance that these precautions will protect us from potential liabilities.
31
Table of Contents
Employee misconduct could harm us by impairing our ability to attract and retain investors in the Hennessy Funds and by subjecting us to significant legal liability, regulatory scrutiny, and reputational harm.
Our reputation is critical to attracting and retaining investors in the Hennessy Funds. In recent years, there have been a number of highly publicized cases involving fraud, conflicts of interest or other misconduct by individuals in the financial services industry. Although we strive to conduct our business in accordance with the highest ethical standards and emphasize the importance of doing so to our employees, there is a risk that our employees could engage in misconduct that adversely affects our business. For example, if an employee were to engage in, or be accused of engaging in, illegal or suspicious activity (such as improper trading, disclosure of confidential information, or breach of fiduciary duties), we could be subject to regulatory sanctions and suffer serious harm to our reputation, financial position, and ability to maintain and grow the number of investors in the Hennessy Funds.
Failure to maintain effective internal control over financial reporting in accordance with Section 404 of the Sarbanes-Oxley Act could have a material adverse effect on our business and our stock price.
As a public company, we are required to maintain effective internal control over financial reporting in accordance with Section 404 of the Sarbanes-Oxley Act of 2002. Internal control over financial reporting is complex and may be revised over time to adapt to changes in our business, or changes in applicable accounting rules and therefore we cannot assure you that our internal control over financial reporting will be effective at all times in the future. If our internal control over financial reporting were ineffective, we could be subjected to adverse regulatory consequences, including, among others, administrative cease and desist orders, injunctive orders or civil monetary penalties, or a negative reaction in the financial markets due to a loss of investor confidence in us and the reliability of our financial statements. Any of these potential consequences could have a material adverse effect on our business or result in a decline in our stock price.
We intend to pay regular dividends to our shareholders, but our ability to do so is subject to the discretion of our Board of Directors.
We have consistently paid dividends each year since 2005. The declaration, amount, and payment of dividends, if any, to our shareholders by us are subject to the discretion of our Board of Directors. Our Board of Directors will take into account such matters as general economic and business conditions, our strategic plans, our financial results and condition, contractual, legal, and regulatory restrictions on the payment of dividends by us, and such other factors as our Board of Directors may consider relevant.
The historical performance of the Hennessy Funds should not be considered indicative of the future results of the Hennessy Funds or of any returns expected on our common stock.
The historical and potential future returns of the Hennessy Funds are not directly linked to returns on our common stock, such that positive performance of the Hennessy Funds will not necessarily result in positive returns on our common stock. Nonetheless, poor performance of the Hennessy Funds will result in a reduction of our revenues and could therefore have a material adverse effect on our business, results of operations and financial condition. Moreover, the historical performance of the Hennessy Funds should not be considered indicative of the future results that should be expected from such funds.
We may need to raise additional capital to fund new business initiatives or refinance existing debt, and resources may not be available to us in sufficient amounts or on acceptable terms, which could have an adverse impact on our business.
Our ability to meet the future cash needs of the Company is dependent upon our ability to generate cash. Although the Company has been successful in generating sufficient cash in the past, it may not be successful in the future. We may need to raise additional capital to fund new business initiatives or refinance existing debt, and financing may not be available to us in sufficient amounts, on acceptable terms, or at all. Our ability to access capital markets efficiently depends on a number of factors, including the state of credit and equity markets, interest rates, and credit spreads. If we are unable to access sufficient capital on acceptable terms, our business could be adversely impacted.
32
Table of Contents
Equity markets and our common stock have historically been volatile.
The market price of our common stock historically has experienced, and may continue to experience, volatility, and the broader equity markets have experienced, and may again experience, significant price and volume fluctuations. In addition, our announcements of quarterly operating results, changes in general conditions in the economy or the financial markets, and other developments affecting us or our competitors could cause the market price of our common stock to fluctuate substantially.
Our common stock has relatively limited trading volume, and ownership of a large percentage is concentrated with a small number of shareholders, which could increase the volatility in our stock trading and significantly affect our share price.
We have a limited number of shareholders, and a large percentage of our common stock is held by an even smaller number of shareholders. If our larger shareholders were to decide to liquidate their ownership positions, it could cause significant fluctuations in the share price of our common stock. Public companies with a limited number of shareholders, such as we have, often have difficulty generating trading volume in their stock.
| ITEM 1B. | UNRESOLVED STAFF COMMENTS |
None.
| ITEM 2. | PROPERTIES. |
Our principal executive office is located at 7250 Redwood Boulevard, Suite 200, Novato, California 94945, where we occupy approximately 13,728 square feet and have the right to use all common areas. Pursuant to a lease amendment, dated as of August 30, 2016, the term of our lease expires on June 30, 2021, with one five-year extension available thereafter.
We also have an office located at 101 Federal Street, Suite 1900, Boston, Massachusetts 02110, where we occupy approximately 670 square feet and have the right to use all common areas. The initial term of our lease expired on November 30, 2015, but automatically renews for successive one-year periods unless either party terminates the lease by providing at least three months’ notice of termination to the other party prior to the next renewal date.
We also have an office located at 1340 Environ Way, #305, Chapel Hill, North Carolina 27517, where we occupy approximately 122 square feet and have the right to use all common areas. The initial term of our lease expired on November 30, 2014, but automatically renews for successive three-month periods unless either party terminates the lease by providing at least two months’ notice of termination to the other party prior to the next renewal date.
See Footnote 10 to the Financial Statements under Item 8, “Financial Statements and Supplementary Data,” below, for more detail on our leases.
| ITEM 3. | LEGAL PROCEEDINGS. |
None.
| ITEM 4. | MINE SAFETY DISCLOSURES. |
Not applicable.
33
Table of Contents
| ITEM 5. | MARKET FOR REGISTRANT’S COMMON EQUITY, RELATED STOCKHOLDER MATTERS, AND ISSUER PURCHASES OF EQUITY SECURITIES |
Our common stock has traded on The NASDAQ Capital Market under the stock symbol “HNNA” since April 28, 2014. Prior to that date, our common stock traded on the OTC Bulletin Board under the same symbol. Our stock began trading on the OTC Bulletin Board on July 15, 2002.
The following table sets forth the high and low sales prices for our common stock on The NASDAQ Capital Market for the periods indicated:
| Price Range | ||||||||||||
| Fiscal Year Ended September 30, 2017 |
High | Low | Dividends Paid per Share | |||||||||
| First Quarter |
$ | 24.13 | $ | 16.23 | $ | 0.067 | (1) | |||||
| Second Quarter |
21.60 | 16.07 | $ | 0.075 | (2) | |||||||
| Third Quarter |
19.87 | 13.88 | $ | 0.075 | (3) | |||||||
| Fourth Quarter |
16.95 | 14.29 | $ | 0.075 | (4) | |||||||
| Price Range | ||||||||||||
| Fiscal Year Ended September 30, 2016 |
High | Low | Dividends Paid per Share | |||||||||
| First Quarter |
$ | 22.00 | $ | 15.70 | $ | 0.040 | (5) | |||||
| Second Quarter |
20.00 | 16.13 | $ | 0.053 | (6) | |||||||
| Third Quarter |
26.33 | 17.73 | $ | 0.053 | (7) | |||||||
| Fourth Quarter |
26.31 | 21.67 | $ | 0.053 | (8) | |||||||
| (1) | We paid a cash dividend on December 8, 2016, to shareholders of record as of November 15, 2016, of $0.067 per share. |
| (2) | We paid a cash dividend on March 6, 2017, to shareholders of record as of February 10, 2017, of $0.075 per share. |
| (3) | We paid a cash dividend on June 8, 2017, to shareholders of record as of May 16, 2017, of $0.075 per share. |
| (4) | We paid a cash dividend on September 11, 2017, to shareholders of record as of August 17, 2017, of $0.075 per share. |
| (5) | We paid a cash dividend on December 9, 2015, to shareholders of record as of November 16, 2015, of $0.040 per share. |
| (6) | We paid a cash dividend on March 7, 2016, to shareholders of record as of February 12, 2016, of $0.053 per share. |
| (7) | We paid a cash dividend on June 13, 2016, to shareholders of record as of May 19, 2016, of $0.053 per share. |
| (8) | We paid a cash dividend on September 12, 2016, to shareholders of record as of August 18, 2016, of $0.053 per share. |
We intend to continue to pay regular dividends to our shareholders, but our ability to do so is subject to the discretion of our Board of Directors.
On November 28, 2017, the last reported sale price of our common stock on The NASDAQ Capital Market was $16.50 per share. As of the end of fiscal year 2017, we had 116 holders of record of our Common Stock. In addition to the 116 holders of record, there are 40 brokerage firm accounts that represent 1,262 additional individual shareholders for a total of 1,378 shareholders as of the end of fiscal year 2017.
The equity compensation plan information required by Item 201(d) of Regulation S-K is set forth in the “Equity Compensation Plan Information” subheading in Item 12, “Security Ownership of Certain Beneficial Owners and Management and Related Stockholder Matters.”
34
Table of Contents
STOCK PERFORMANCE GRAPH
The following graph compares the cumulative total stockholder return of our common stock from September 30, 2012, through September 30, 2017, with the cumulative total return of the S&P 500 and the SNL U.S. Asset Manager Index. The SNL U.S. Asset Manager Index is a composite of 42 publicly traded asset management companies prepared by S&P Global Market Intelligence LLC. The graph assumes the investment of $100 in our common stock and in each of the two indexes on September 30, 2012, and the reinvestment of all dividends.
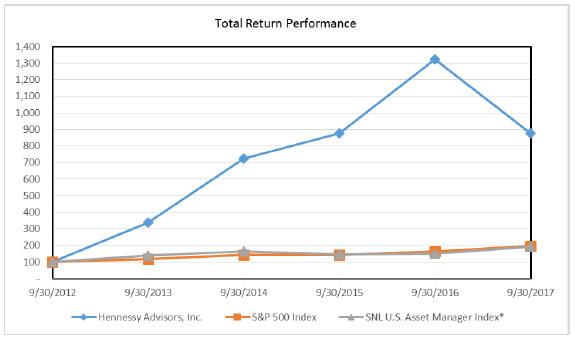
| Index |
9/30/2012 | 9/30/2013 | 9/30/2014 | 9/30/2015 | 9/30/2016 | 9/30/2017 | ||||||||||||||||||
| Hennessy Advisors, Inc. |
$ | 100.00 | $ | 339.07 | $ | 725.49 | $ | 876.66 | $ | 1,321.13 | $ | 877.22 | ||||||||||||
| S&P 500 Index |
$ | 100.00 | $ | 119.34 | $ | 142.89 | $ | 142.02 | $ | 163.93 | $ | 194.44 | ||||||||||||
| SNL U.S. Asset Manager Index* |
$ | 100.00 | $ | 140.41 | $ | 163.69 | $ | 145.16 | $ | 148.73 | $ | 192.37 | ||||||||||||
| * | The SNL U.S. Asset Manager Index, Copyright © 2017, S&P Global Market Intelligence (and its affiliates, as applicable), includes all publicly traded (NYSE, NYSE MKT, NASDAQ, OTC) Asset Managers in SNL’s coverage universe. As of September 29, 2017, the SNL U.S. Asset Manager Index included the following: |
35
Table of Contents
| Affiliated Managers Group Inc. | Fifth Street Asset Management Inc. | Och-Ziff Capital Management Group LLC | ||
| AllianceBernstein Holding L.P. | Financial Engines Inc. | OM Asset Management plc | ||
| Apollo Global Management LLC | Fortress Investment Group LLC | Pzena Investment Management Inc. | ||
| Ares Management L.P. | Franklin Resources Inc. | Safeguard Scientifics Inc. | ||
| Artisan Partners Asset Management Inc. | GAMCO Investors Inc. | SEI Investments Co. | ||
| Ashford Inc. | Hamilton Lane Inc. | Silvercrest Asset Management Group | ||
| Associated Capital Group Inc. | Hennessy Advisors, Inc. | T. Rowe Price Group Inc. | ||
| BlackRock Inc. | Invesco Ltd. | U.S. Global Investors Inc. | ||
| Blackstone Group L.P. | Janus Henderson Group Plc | Virtus Investment Partners Inc. | ||
| Carlyle Group L.P. | KKR & Co. L.P. | Waddell & Reed Financial Inc. | ||
| Cohen & Steers Inc. | Legg Mason Inc. | Westwood Holdings Group Inc. | ||
| Diamond Hill Investment Group | Manning & Napier Inc. | WisdomTree Investments Inc. | ||
| Eaton Vance Corp. | Medley Management Inc. | ZAIS Group Holdings Inc. | ||
| Federated Investors Inc. | Oaktree Capital Group LLC | |||
In accordance with the rules of the SEC, this section entitled “Stock Performance Graph” shall not be incorporated by reference into any future filings by us under the Securities Act of 1933 or the Securities Exchange Act of 1934 and shall not be deemed to be soliciting material or to be filed under the Securities Act of 1933 or the Securities Exchange Act of 1934.
PURCHASES OF EQUITY SECURITIES BY THE ISSUER AND AFFILIATED PURCHASERS
We purchased shares underlying vested RSUs from employees to provide withholding and tax payments on behalf of our employees. The stock repurchases are presented in the following table for the three months ended September 30, 2017:
| Period |
Total number of shares purchased |
Average price paid per share |
Total number of shares purchased as part of publicly announced plans or programs (3) |
Maximum number of shares that may yet be purchased under the plans or programs (3) |
||||||||||||
| (a) | (b) | (c) | (d) | |||||||||||||
|
|
|
|
|
|
|
|
|
|||||||||
| July 1-31, 2017 |
0 | $ | 0.00 | 0 | 908,807 | |||||||||||
| August 1-31, 2017 |
0 | $ | 0.00 | 0 | 908,807 | |||||||||||
| September 1-30, 2017 (1) |
32,375 | $ | 14.98 | 0 | 908,807 | |||||||||||
|
|
|
|
|
|
|
|
|
|||||||||
| Total (2) |
32,375 | $ | 14.98 | 0 | 908,807 | |||||||||||
|
|
|
|
|
|
|
|
|
|||||||||
| (1) | The shares repurchased on September 16, 2017, September 17, 2017, September 21, 2017, and September 23, 2017, were repurchased, according to the instructions of employees, to pay for tax expense and withholding on the compensation recognized for vested RSUs, granted on September 16, 2013, September 17, 2015, September 21, 2016, and September 23, 2014, respectively, and were not purchased pursuant to the stock buyback program described below. |
| (2) | The total shares repurchased were purchased at a weighted average price of $14.98 per share. |
| (3) | The share repurchases related to the RSUs were not completed pursuant to a plan or program and are therefore not subject to a maximum per a plan or program. The Company has adopted a stock buyback program, which it announced August 5, 2010. Pursuant to the program, the Company is authorized to purchase a maximum of 1,500,000 shares. The program has no expiration date. |
36
Table of Contents
| ITEM 6. | SELECTED FINANCIAL DATA |
The following financial information is derived from our audited financial statements, including the notes thereto, and Item 7, “Management’s Discussion and Analysis of Financial Condition and Results of Operations,” below, and should be read in conjunction therewith.
| Hennessy Advisors, Inc. Financial Highlights As of and For the Years Ended September 30, |
||||||||||||||||||||
| 2017 | 2016 | 2015 | 2014 | 2013 | ||||||||||||||||
| (In thousands, except per share amounts) | ||||||||||||||||||||
| Income Statement Data: |
||||||||||||||||||||
| Revenue |
$ | 52,955 | $ | 51,410 | $ | 44,739 | $ | 34,526 | $ | 24,308 | ||||||||||
| Net income |
$ | 14,942 | $ | 14,367 | $ | 11,389 | $ | 7,667 | $ | 4,820 | ||||||||||
| Balance Sheet Data: |
||||||||||||||||||||
| Total assets |
$ | 97,927 | $ | 84,939 | $ | 73,133 | $ | 75,315 | $ | 74,734 | ||||||||||
| Cash and cash equivalents |
$ | 15,700 | $ | 3,535 | $ | 3,086 | $ | 7,645 | $ | 8,406 | ||||||||||
| Long-term debt |
$ | 21,728 | $ | 25,956 | $ | 30,625 | $ | 22,972 | $ | 26,653 | ||||||||||
| Per Share Data: |
||||||||||||||||||||
| Earnings per share: |
||||||||||||||||||||
| Basic |
$ | 1.94 | $ | 1.89 | $ | 1.29 | $ | 0.87 | $ | 0.55 | ||||||||||
| Diluted |
$ | 1.92 | $ | 1.86 | $ | 1.27 | $ | 0.87 | $ | 0.55 | ||||||||||
| Cash dividends declared |
$ | 0.29 | $ | 0.20 | $ | 0.15 | $ | 0.10 | $ | 0.09 | ||||||||||
| ITEM 7. | MANAGEMENT’S DISCUSSION AND ANALYSIS OF FINANCIAL CONDITION AND RESULTS OF OPERATIONS |
FORWARD-LOOKING STATEMENTS
This report contains “forward-looking statements” within the meaning of the securities laws, for which we claim the protection of the safe harbor for forward-looking statements contained in the Private Securities Litigation Reform Act of 1995. In some cases, forward-looking statements can be identified by terminology such as “expect,” “anticipate,” “intend,” “may,” “plan,” “will,” “should,” “could,” “would,” “assume,” “believe,” “estimate,” “predict,” “potential,” “project,” “continue,” “seek,” and similar expressions, as well as statements in the future tense. We have based these forward-looking statements on our current expectations and projections about future events, based on information currently available to us. Forward-looking statements should not be read as a guarantee of future performance or results, and will not necessarily be accurate indications of the times at, or means by, which such performance or results will be achieved.
Forward-looking statements are subject to risks, uncertainties and assumptions, including those described in the section entitled “Risk Factors” and elsewhere in this Annual Report on Form 10-K. Unforeseen developments could cause actual performance or results to differ substantially from those expressed in or suggested by the forward-looking statements. Management does not assume responsibility for the accuracy or completeness of these forward-looking statements. There is no regulation requiring an update of any of the forward-looking statements after the date of this report to conform these statements to actual results or to changes in our expectations.
37
Table of Contents
Our business activities are affected by many factors, including, without limitation, redemptions by mutual fund shareholders, general economic and financial conditions, movement of interest rates, competitive conditions, industry regulation, and fluctuations in the stock market, many of which are beyond the control of our management. Further, the business and regulatory environments in which we operate remain complex, uncertain, and subject to change. We expect that regulatory requirements and developments will cause us to incur additional administrative and compliance costs. In addition, while domestic economic conditions are relatively stable, further increases in short-term interest rates, policy changes from the new administration in Washington, D.C., and developments in international financial markets could influence economic and financial conditions significantly. Notwithstanding the variability in our economic and regulatory environments, we remain focused on the investment performance of the Hennessy Funds and on providing high-quality customer service to investors.
Our business strategy centers on (i) the identification, completion and integration of future acquisitions and (ii) organic growth, through both the retention of the mutual fund assets we currently manage and the generation of inflows into the mutual funds we manage. The success of our business strategy may be influenced by the factors discussed in Item 1A, “Risk Factors,” above. All statements regarding our business strategy, as well as statements regarding market trends and risks and assumptions about changes in the marketplace, are forward-looking by their nature.
OVERVIEW
Our primary operating activity is providing investment advisory services to 14 open-end mutual funds branded as the Hennessy Funds. With respect to four of the funds, a sub-advisor acts as portfolio manager for the fund, subject to our oversight. We oversee the selection and continued employment of each sub-advisor, review each sub-advisor’s investment performance, and monitor each sub-advisor’s adherence to the applicable fund’s investment objectives, policies, and restrictions. In addition, we conduct ongoing reviews of the compliance programs of sub-advisors and make on-site visits to sub-advisors. Our secondary operating activity is providing shareholder services to Investor Class shares of each of the Hennessy Funds.
We derive our operating revenues from investment advisory fees and shareholder service fees paid to us by the Hennessy Funds. These fees are calculated as a percentage of the average daily net assets in each of the Hennessy Funds. The percentage amount of the investment advisory fees varies from fund to fund, but the percentage amount of the shareholder service fees is consistent across all funds. The dollar amount of the fees we receive fluctuates with changes in the average net asset value of each of the Hennessy Funds, which is affected by each fund’s investment performance, purchases and redemptions of shares, general market conditions and the success of our marketing, sales, and public relations efforts.
We completed several changes to the Hennessy Funds product lineup during fiscal year 2017. For the Hennessy Technology Fund, we changed its investment strategy and portfolio management team, decreased the investment advisory fee from 0.90% to 0.74%, and adopted an expense limitation agreement. Additionally, we launched Institutional Class shares for the Hennessy Gas Utility Fund, liquidated the Hennessy Core Bond Fund, and reorganized the Hennessy Large Value Fund into the Hennessy Cornerstone Value Fund.
U.S. equity markets posted strong gains during fiscal year 2017. At the start of the period, U.S. equities reacted positively to the election of President Trump, a Republican, to the White House, and to Republican majorities in both houses of Congress, buoyed by hopes of higher government infrastructure spending, tax reform, and a more pro-business attitude from our government. In the latter half of the fiscal year, evidence of continued steady domestic economic activity, a recovery in corporate earnings growth and relatively good economic conditions abroad kept equity prices rising. The Federal Reserve, feeling confident about the overall strength of the economy and the labor market, raised the federal funds rate three times during the fiscal year, by a quarter percentage point each time.
38
Table of Contents
The Japanese equity market rose significantly in local currency terms during fiscal year 2017. Early in the period, a fall in the Japanese yen underpinned the rise in equity prices, led by export-oriented Japanese companies. During the second half of the fiscal year, equities continued to rally, encouraged by an acceleration in corporate profits growth, broad evidence of stronger economic activity domestically, buoyant export markets, and a stable inflation rate.
U.S. government bond yields increased precipitously after the U.S. presidential elections in November 2016 in response to the perceived increased risks of faster economic growth and higher inflation. However, bond yields drifted gently downwards for the rest of the fiscal year, encouraged by more moderate inflation reports, continued modest increases in labor costs and the very gradual pace of interest rate increases by the Federal Reserve.
We seek to provide positive annualized returns to investors in the Hennessy Funds on average over a market cycle and to generate inflows into the Hennessy Funds through our marketing and sales efforts. We regularly target over 100,000 financial advisors through our marketing and sales program, and currently serve 19,000 advisors who utilize the Hennessy Funds for their clients. More than one in five of those advisors owns two or more of the Hennessy Funds. We continually seek to expand our team of sales professionals to serve our advisor community and to assist us with providing services to our over 320,000 mutual fund accounts across the country. In addition, we have an active public relations effort with the Hennessy brand name appearing on TV, radio, print or online media on average once every two and a half to three days.
Each of the 14 Hennessy Funds achieved positive annualized returns for the one-year, three-year, five-year, 10-year and since inception periods ended September 30, 2017. Total assets under management as of the end of fiscal year 2017 was $6.6 billion, a decrease of 1.3%, or $86 million, from $6.7 billion as of the end of fiscal year 2016, which was itself an increase of 11.9%, or $711 million, from $6.0 billion as of the end of fiscal year 2015. The decrease in total assets during fiscal year 2017 was attributable to $943 million in net outflows, offset by $857 million in market appreciation. The increase in total assets during fiscal year 2016 was attributable to market appreciation of $525 million and the purchase of assets related to the management of The Westport Funds of $435 million, and was offset by net outflows from the Hennessy Funds of $249 million. The following table illustrates the changes year by year in our assets under management since the beginning of fiscal year 2013:
| Total Assets Under Management | ||||||||||||||||||||
| At Each Fiscal Year Ended 2013-2017 | ||||||||||||||||||||
| 9/30/2017 | 9/30/2016 | 9/30/2015 | 9/30/2014 | 9/30/2013 | ||||||||||||||||
| (In thousands) | ||||||||||||||||||||
| Beginning assets under management |
$ | 6,698,519 | $ | 5,987,985 | $ | 5,520,802 | $ | 4,034,181 | $ | 919,262 | ||||||||||
| Acquisition inflows |
— | 434,530 | — | — | 2,222,961 | |||||||||||||||
| Organic inflows |
1,150,462 | 2,168,840 | 2,603,428 | 2,052,286 | 1,441,677 | |||||||||||||||
| Redemptions |
(2,093,315 | ) | (2,417,384 | ) | (1,961,186 | ) | (1,215,493 | ) | (1,198,521 | ) | ||||||||||
| Market appreciation (depreciation) |
857,146 | 524,548 | (175,059 | ) | 649,828 | 648,802 | ||||||||||||||
|
|
|
|
|
|
|
|
|
|
|
|||||||||||
| Ending assets under management |
$ | 6,612,812 | $ | 6,698,519 | $ | 5,987,985 | $ | 5,520,802 | $ | 4,034,181 | ||||||||||
|
|
|
|
|
|
|
|
|
|
|
|||||||||||
The principal asset on our balance sheet, management contracts, represents the capitalized costs incurred in connection with the purchase of assets related to the management of mutual funds. As of the end of fiscal year 2017, this asset had a net balance of $74.6 million, compared to $74.4 million as of the end of fiscal year 2016. The increase was mainly due to payments for legal, printing, and proxy solicitation costs in connection with the pending purchase of assets related to the management of three of the Rainier Funds.
39
Table of Contents
The principal liability on our balance sheet is the bank debt incurred in connection with the purchase of assets related to the management of mutual funds and the repurchase of 1,000,000 shares of the Company’s common stock pursuant to the completion of its self-tender offer in September 2015. As of the end of fiscal year 2017, this liability had a gross balance of $26.3 million ($26.0 million net of reclassed deferred loan fees of $0.3 million, further discussed in Footnote 7), compared to $30.6 million as of the end of fiscal year 2016. The decrease was the result of making monthly loan payments on our bank debt.
RESULTS OF OPERATIONS
The following table sets forth items in our statements of income and comprehensive income as dollar amounts and as percentages of total revenue for fiscal years 2017, 2016, and 2015:
| Fiscal Year Ended September 30, | ||||||||||||||||||||||||
| 2017 | 2016 | 2015 | ||||||||||||||||||||||
| Amounts | Percent of Total Revenue |
Amounts | Percent of Total Revenue |
Amounts | Percent of Total Revenue |
|||||||||||||||||||
| (In thousands, except percentages) | ||||||||||||||||||||||||
| Revenue: |
||||||||||||||||||||||||
| Investment advisory fees |
$ | 48,297 | 91.2 | % | $ | 46,391 | 90.2 | % | $ | 41,177 | 92.0 | % | ||||||||||||
| Shareholder service fees |
4,658 | 8.8 | 5,019 | 9.8 | 3,562 | 8.0 | ||||||||||||||||||
|
|
|
|
|
|
|
|
|
|
|
|
|
|||||||||||||
| Total revenue |
52,955 | 100.0 | 51,410 | 100.0 | 44,739 | 100.0 | ||||||||||||||||||
|
|
|
|
|
|
|
|
|
|
|
|
|
|||||||||||||
| Operating expenses: |
||||||||||||||||||||||||
| Compensation and benefits |
12,862 | 24.3 | 11,943 | 23.2 | 9,750 | 21.8 | ||||||||||||||||||
| General and administrative |
5,882 | 11.1 | 5,806 | 11.3 | 5,223 | 11.7 | ||||||||||||||||||
| Mutual fund distribution |
274 | 0.5 | 775 | 1.5 | 2,403 | 5.4 | ||||||||||||||||||
| Sub-advisor fees |
9,225 | 17.4 | 8,743 | 17.0 | 7,284 | 16.3 | ||||||||||||||||||
| Amortization and depreciation |
366 | 0.7 | 353 | 0.7 | 265 | 0.5 | ||||||||||||||||||
|
|
|
|
|
|
|
|
|
|
|
|
|
|||||||||||||
| Total operating expenses |
28,609 | 54.0 | 27,620 | 53.7 | 24,925 | 55.7 | ||||||||||||||||||
|
|
|
|
|
|
|
|
|
|
|
|
|
|||||||||||||
| Operating income |
24,346 | 46.0 | 23,790 | 46.3 | 19,814 | 44.3 | ||||||||||||||||||
| Interest expense |
1,109 | 2.1 | 1,232 | 2.4 | 1,012 | 2.3 | ||||||||||||||||||
| Other income |
(12 | ) | (0.0 | ) | (2 | ) | (0.0 | ) | (1 | ) | (0.0 | ) | ||||||||||||
|
|
|
|
|
|
|
|
|
|
|
|
|
|||||||||||||
| Income before income tax expense |
23,249 | 43.9 | 22,560 | 50.4 | 18,803 | 42.0 | ||||||||||||||||||
| Income tax expense |
8,307 | 15.7 | 8,193 | 16.0 | 7,414 | 16.5 | ||||||||||||||||||
|
|
|
|
|
|
|
|
|
|
|
|
|
|||||||||||||
| Net income |
$ | 14,942 | 28.2 | % | $ | 14,367 | 27.9 | % | $ | 11,389 | 25.5 | % | ||||||||||||
|
|
|
|
|
|
|
|
|
|
|
|
|
|||||||||||||
Revenues – Investment Advisory Fees and Shareholder Service Fees
Total revenue is comprised of investment advisory fees and shareholder service fees. Total revenue increased 3.0% in fiscal year 2017 compared to fiscal year 2016 and increased 14.9% to $51.4 million in fiscal year 2016 compared to fiscal year 2015.
Investment advisory fees increased 4.1% in fiscal year 2017 compared to fiscal year 2016 and increased 12.7% to $46.4 million in fiscal year 2016 compared to fiscal year 2015. The increases in investment advisory fees in both fiscal years were mainly due to increased average daily net assets of the Hennessy Funds.
Average daily net assets of the Hennessy Funds for fiscal year 2017 increased by $238 million, or 3.8%, to $6.6 billion, compared to fiscal year 2016. In fiscal year 2016, average daily net assets increased by $319 million, or 5.3%, to $6.3 billion, compared to fiscal year 2015.
Shareholder service fees decreased 7.2% to $4.7 million in fiscal year 2017 compared to fiscal year 2016. The decrease in shareholder service fees was due to a change in the composition of average daily net assets. Assets held in Institutional Class shares of the Hennessy Funds are not subject to a shareholder service fee, whereas assets held in Investor Class shares of the Hennessy Funds are subject to a shareholder service fee. The average daily net assets held in Institutional Class shares increased, while the average daily net assets held in Investor Class shares decreased, versus fiscal year 2016.
40
Table of Contents
Shareholder service fees increased 40.9% to $5.0 million in fiscal year 2016 compared to fiscal year 2015. The increase in shareholder service fees from fiscal year 2015 to fiscal year 2016 was due both to increased average daily net assets of the Hennessy Funds and earning shareholder service fees from all of the Hennessy Funds as of March 1, 2015, instead of only some of the Hennessy Funds in fiscal year 2015.
The Company collects investment advisory fees from each of the Hennessy Funds at differing rates. These annual rates previously ranged between 0.40% and 1.20% of average daily net assets, but now range between 0.40% and 0.90% of average daily net assets because the annual rate of the investment advisory fee for the Hennessy Japan Fund was reduced from 1.00% to 0.80% and the annual rate of the investment advisory fee for the Hennessy Japan Small Cap Fund was reduced from 1.20% to 0.80%, each effective as of March 1, 2016.
The Hennessy Fund with the largest average daily net assets for fiscal year 2017 was the Hennessy Focus Fund, with $2.55 billion. The Company collects an investment advisory fee from the Hennessy Focus Fund at an annual rate of 0.90% of average daily net assets. However, the Company pays a sub-advisor fee at an annual rate of 0.29% to the fund’s sub-advisor, which reduces the net operating profit contribution of the fund to the Company’s financial operations. The Hennessy Fund with the second largest average daily assets for fiscal year 2017 was the Hennessy Gas Utility Fund, with $1.44 billion. The Company collects an investment advisory fee from the Hennessy Gas Utility Fund at an annual rate of 0.40% of average daily net assets.
Total assets under management as of the end of fiscal year 2017 was $6.6 billion, a decrease of 1.3%, or $0.09 billion, from $6.7 billion as of the end of fiscal year 2016. The decrease in total assets during fiscal year 2017 is attributable to aggregate net outflows from the Hennessy Funds of $943 million, partly offset by aggregate market appreciation of $857 million.
Total assets under management as of the end of fiscal year 2016 was $6.7 billion, an increase of 11.9% or $711 million, compared with $6.0 billion as of the end of fiscal year 2015. The increase in total assets under management during fiscal year 2016 was attributable to market appreciation of $525 million and the purchase of assets related to the management of The Westport Funds of $435 million, and was offset by net outflows from the Hennessy Funds of $249 million.
41
Table of Contents
The Hennessy Funds with the three largest amounts of net inflows and net outflows for fiscal year 2017 were as follows:
| Largest Net Inflows |
Largest Net Outflows | |||||||
| Fund Name |
Net Inflows |
Fund Name |
Net Outflows | |||||
| Hennessy Japan Fund | $90 million | Hennessy Mid Cap 30 Fund | $(545) million | |||||
| Hennessy Japan Small Cap Fund | $42 million | Hennessy Gas Utility Fund | $(195) million | |||||
| Hennessy Small Cap Financial Fund | $21 million | Hennessy Focus Fund | $(138) million | |||||
The Hennessy Funds with the three largest amounts of net inflows and net outflows for fiscal year 2016 were as follows:
| Largest Net Inflows |
Largest Net Outflows | |||||||
| Fund Name |
Net Inflows |
Fund Name |
Net Outflows | |||||
| Hennessy Focus Fund | $398 million | Hennessy Gas Utility Fund | $(311) million | |||||
| Hennessy Total Return Fund | $14 million | Hennessy Equity & Income Fund | $(126) million | |||||
| Hennessy Japan Fund | $4 million | Hennessy Small Cap Financial Fund | $(65) million | |||||
The Hennessy Funds with the three largest amounts of net inflows and net outflows for fiscal year 2015 were as follows:
| Largest Net Inflows |
Largest Net Outflows | |||||||
| Fund Name |
Net Inflows |
Fund Name |
Net Outflows | |||||
| Hennessy Mid Cap 30 Fund | $609 million | Hennessy Gas Utility Fund | $(400) million | |||||
| Hennessy Focus Fund | $375 million | Hennessy Small Cap Financial Fund | $(50) million | |||||
| Hennessy Equity & Income Fund | $96 million | Hennessy Cornerstone Value Fund | $(19) million | |||||
Redemptions as a percentage of assets under management decreased from an average of 3.2% per month during fiscal year 2016 to an average of 2.7% per month during fiscal year 2017. Redemptions as a percentage of assets under management increased from an average of 2.7% per month during fiscal year 2015 to an average of 3.2% per month during fiscal year 2016.
Operating Expenses
Total operating expenses increased 3.6% to $28.6 million in fiscal year 2017 from $27.6 million in fiscal year 2016. The increase was due primarily to increases in compensation and benefits expense and sub-advisor fee expense. As a percentage of total revenue, total operating expenses increased 0.3 percentage points to 54.0% in fiscal year 2017 as compared to fiscal year 2016.
Total operating expenses increased 10.8% to $27.6 million in fiscal year 2016, from $24.9 million in fiscal year 2015. The increase was due primarily to increases in compensation and benefits expense, general and administrative expense, and sub-advisor fee expense, but was partially offset by a decrease in mutual fund distribution expense. As a percentage of total revenue, Total operating expenses decreased 2.0 percentage points to 53.7% in fiscal year 2016 as compared to 55.7% in fiscal year 2015.
Compensation and Benefits Expense: Compensation and benefits expense increased 7.7% to $12.9 million in fiscal year 2017 compared to $11.9 million in fiscal year 2016. This increase was primarily due to equity compensation awards granted in the current year, as well as an increase in the Company’s incentive-based compensation expense related to the Company’s increased profitability in fiscal year 2017 compared to fiscal year 2016. As a percentage of total revenue, compensation and benefits expense increased 1.1 percentage points to 24.3% for fiscal year 2017 compared to 23.2% in fiscal year 2016.
42
Table of Contents
Compensation and benefits expense increased 22.5% to $11.9 million in fiscal year 2016 compared to $9.8 million in fiscal year 2015. The increase was due primarily to an increase in the Company’s incentive-based compensation expense related to the Company’s increased profitability in fiscal year 2016 compared to fiscal year 2015, as well as increased employment necessary to support the continued development of the Company. As a percentage of total revenue, compensation and benefits expense increased 1.4 percentage points to 23.2% for fiscal year 2016 compared to 21.8% in fiscal year 2015.
General and Administrative Expense: General and administrative expense increased 1.3% to $5.9 million in fiscal year 2017 from $5.8 million in fiscal year 2016. The increase resulted primarily from an increase in outside vendor support, including legal and audit work, during fiscal year 2017. As a percentage of total revenue, general and administrative expense decreased 0.2 percentage points to 11.1% for fiscal year 2017 compared to 11.3% in fiscal year 2016.
General and administrative expense increased 11.2% to $5.8 million in fiscal year 2016, from $5.2 million in fiscal year 2015. The increase resulted primarily from an increase in outside vendor support, including legal and tax work and cybersecurity consulting, during fiscal year 2016. As a percentage of total revenue, general and administrative expense decreased 0.4 percentage points to 11.3% in fiscal year 2016, from 11.7% in fiscal year 2015.
Mutual Fund Distribution Expense: Mutual fund distribution expense decreased 64.6% to $0.3 million in fiscal year 2017 from $0.8 million in fiscal year 2016. As a percentage of total revenue, mutual fund distribution expense decreased 1.0 percentage points to 0.5% for fiscal year 2017 compared to 1.5% in fiscal year 2016.
Mutual fund distribution expense decreased 67.7% to $0.8 million in fiscal year 2016, from $2.4 million in fiscal year 2015. As a percentage of total revenue, mutual fund distribution expense decreased 3.9 percentage points to 1.5% for fiscal year 2016 compared to 5.4% in fiscal year 2015.
Mutual fund distribution expense consists of fees paid to various financial institutions that offer the Hennessy Funds as potential investments to their clients. When the Hennessy Funds are purchased through one of these financial institutions, the institution typically charges an asset-based fee, which is recorded in “mutual fund distribution expense” in our statement of operations to the extent paid by us. When the Hennessy Funds are purchased directly, we do not incur any such expense. These fees generally increase or decrease in line with the net assets of the Hennessy Funds held through these financial institutions, which are affected by inflows, outflows, and fund performance.
The decrease in mutual fund distribution expense in fiscal year 2017 was primarily due to the timing of accruals made by the Company to financial intermediaries following the completion of contract negotiations in the prior period and also, to a lesser extent, the implementation of a Distribution (Rule 12b-1) Plan for each of the following Hennessy Funds as of the given dates:
| • November 1, 2015: |
Hennessy Cornerstone Growth Fund | |||
| Hennessy Cornerstone Mid Cap 30 Fund | ||||
| Hennessy Cornerstone Large Growth Fund | ||||
| Hennessy Cornerstone Value Fund | ||||
| Hennessy Large Value Fund* | ||||
| • March 1, 2016: |
Hennessy Japan Fund | |||
| Hennessy Japan Small Cap Fund | ||||
| * | The Hennessy Large Value Fund was reorganized into the Hennessy Cornerstone Value Fund as of February 28, 2017. |
These distribution plans charge their respective funds an annual rate of 0.15% (though 0.25% is the maximum allowable) of average daily net assets to pay for sales, distribution and other expenses. Each distribution plan therefore allows its fund to use its distribution plan fees to offset fees charged by financial institutions that offer the Hennessy Funds as potential investments to their clients. Therefore, as of the dates listed above, a portion of the mutual fund distribution expense previously paid by the Company began to be offset by payments made by the respective Hennessy Funds pursuant to their distribution plans.
43
Table of Contents
Sub-Advisor Fee Expense: Sub-advisor fee expense increased 5.5% to $9.2 million in fiscal year 2017 from $8.7 million in fiscal year 2016. The increase is a result of an increase in average assets under management in the sub-advised Hennessy Funds, with a slight offset as a result of the Company no longer paying sub-advisor fees with respect to the Hennessy Core Bond Fund following its liquidation as of February 17, 2017, or with respect to the Hennessy Large Value Fund following its reorganization into the Hennessy Cornerstone Value Fund as of February 28, 2017. As a percentage of total revenue, sub-advisor fee expense increased 0.4 percentage points to 17.4% for fiscal year 2017, compared to 17.0% in fiscal year 2016.
Sub-advisor fee expense increased 20.0% to $8.7 million in fiscal year 2016 from $7.3 million in fiscal year 2015. This increase was a result of the increase in average assets under management due to market appreciation in the portfolio securities held by the sub-advised Hennessy Funds and net inflows into certain sub-advised Hennessy Funds. As a percentage of total revenue, sub-advisor fee expense increased 0.7 percentage points to 17.0% for fiscal year 2016, compared to 16.3% in fiscal year 2015.
Amortization and Depreciation Expense: Amortization and depreciation expense increased 3.7% to $0.37 million in fiscal year 2017 from $0.35 million in fiscal year 2016. As a percentage of total revenue, amortization and depreciation expense remained the same at 0.7% for fiscal years 2017 and 2016.
Amortization and depreciation expense increased 33.2% to $0.35 million in fiscal year 2016, from $0.27 million in fiscal year 2015. As a percentage of total revenue, amortization and depreciation expense increased 0.2 percentage points to 0.7% for fiscal year 2016, compared to 0.5% in fiscal year 2015.
The increases in both fiscal years were mainly the result of a higher fixed asset base as compared to the prior fiscal year.
Interest Expense: Interest expense decreased 10.0% to $1.1 million in fiscal year 2017, from $1.2 million in fiscal year 2016. The decrease was due primarily to a decrease to the Company’s principal loan balance compared to fiscal year 2016. As a percentage of total revenue, interest expense decreased 0.3 percentage points to 2.1% for fiscal year 2017 compared to 2.4% in fiscal year 2016.
Interest expense increased 21.7% to $1.2 million in fiscal year 2016, from $1.0 million in fiscal year 2015. The increase was due primarily to an increase in the Company’s principal loan balance that occurred on September 17, 2015, and was used in part to fund the Company’s self-tender offer. As a percentage of total revenue, interest expense increased 0.1 percentage points to 2.4% for fiscal year 2016, compared to 2.3% in the prior comparable period.
Income Tax Expense: Income tax expense increased 1.4% to $8.3 million in fiscal year 2017 from $8.2 million in fiscal year 2016. The increase was due to increased income before income tax expense and was partially offset by a lower effective tax rate resulting from the early adoption of ASU 2016-09 (see further discussion in Footnote 12). As a percentage of total revenue, income tax expense decreased 0.3 percentage points to 15.7% for fiscal year 2017 compared to 16.0% in fiscal year 2016.
Income tax expense increased 10.5% to $8.2 million in fiscal year 2016 from $7.4 million in fiscal year 2015. This change was due to increased income before income tax expense during fiscal year 2016 and was partially offset by changes in state apportionment factors. As a percentage of total revenue, income tax expense decreased 0.5 percentage points to 16.0% for fiscal year 2016 compared to 16.5% in fiscal year 2015.
Net Income
Net income increased by 4.0% to $14.9 million in fiscal year 2017 from $14.4 million in fiscal year 2016 as a result of the factors discussed above. Net income increased by 26.1% to $14.4 million in fiscal year 2016 from $11.4 million in fiscal year 2015 as a result of the factors discussed above.
44
Table of Contents
OFF-BALANCE SHEET ARRANGEMENTS
We do not have and have not had any off-balance sheet arrangements.
LIQUIDITY AND CAPITAL RESOURCES
We continually review our capital requirements to ensure that we have funding available to support our business model. Management anticipates that cash and other liquid assets on hand as of September 30, 2017, will be sufficient to meet our short-term capital requirements. To the extent that liquid resources and cash provided by operations are not adequate to meet long-term capital requirements, management plans to raise additional capital by either, or both of, seeking to increase our borrowing capacity or accessing the capital markets. There can be no assurance that we will be able to raise additional capital.
Total assets under management as of the end of fiscal year 2017 was $6.6 billion, a decrease of 1.3%, or $0.1 billion, from $6.7 billion as of the end of fiscal year 2016, which was itself an increase of $711 million, or 11.9%, from the end of fiscal year 2015. The primary source of our revenues, liquidity, and cash flow are our investment advisory fees and shareholder service fees, which are based on and generated by our average assets under management. Property and equipment and management contracts purchased totaled $74.9 million as of the end of fiscal year 2017. Also as of the end of fiscal year 2017, we had cash and cash equivalents of $15.7 million.
The following table summarizes key financial data relating to our liquidity and use of cash for fiscal years 2017, 2016, and 2015:
| For the Fiscal Year Ended September 30, |
||||||||||||
| 2017 | 2016 | 2015 | ||||||||||
| (In thousands) | ||||||||||||
| Cash flow data: |
||||||||||||
| Operating cash flows |
$ | 19,193 | $ | 18,186 | $ | 14,444 | ||||||
| Investing cash flows |
(445 | ) | (11,862 | ) | (450 | ) | ||||||
| Financing cash flows |
(6,583 | ) | (5,875 | ) | (18,553 | ) | ||||||
|
|
|
|
|
|
|
|||||||
| Net increase (decrease) in cash and cash equivalents |
$ | 12,165 | $ | 449 | $ | (4,559 | ) | |||||
|
|
|
|
|
|
|
|||||||
The increase in cash provided by operating activities of $1.0 million from fiscal year 2016 to fiscal year 2017 was due mainly to increased net income and an increase in deferred restricted stock unit compensation. The increase in cash provided by operating activities of $3.7 million from fiscal year 2015 to fiscal year 2016 was due mainly to an increase in net income from fiscal year 2015.
The decrease in cash used for investing activities of $11.4 million from fiscal year 2016 to fiscal year 2017 was due to one-time costs associated with purchasing the assets related to the management of The Westport Funds in fiscal year 2016. The increase in cash used for investing activities from fiscal year 2015 to fiscal year 2016 was due to costs associated with purchasing the assets related to the management of The Westport Funds in fiscal year 2016.
The increase in cash used for financing activities of $0.7 million from fiscal year 2016 to fiscal year 2017 was due to an increased dividend in fiscal year 2017. The decrease in cash used for financing activities from fiscal year 2015 to fiscal year 2016 was due to the repurchase of 1,500,000 shares of our common stock at $16.67 per share pursuant to our self-tender offer in fiscal year 2015, adjusted for a 3-for-2 stock split effected on March 6, 2017.
45
Table of Contents
Dividend Payments. A quarterly cash dividend of $0.067 per share was paid on December 8, 2016, to shareholders of record as of November 15, 2016. Additionally, quarterly cash dividends of $0.075 per share were paid on March 6, 2017, to shareholders of record as of February 10, 2017; on June 8, 2017, to shareholders of record as of May 16, 2017; and on September 11, 2017, to shareholders of record as of August 17, 2017. The total payment from cash on hand was $2.2 million.
Our Bank Loan. We have an outstanding bank loan with U.S. Bank, as administrative agent and as a lender, and California Bank & Trust, as syndication agent and as a lender, which replaced and refinanced our bank loan previously entered into by Hennessy Advisors and U.S. Bank on October 26, 2012, and amended on November 1, 2013. Immediately prior to September 17, 2015, our bank loan had an outstanding principal balance of $23.0 million. On September 17, 2015, in anticipation of the repurchase of up to 1,500,000 shares of our common stock at $16.67 per share pursuant to our self-tender offer, we entered into a new term loan agreement to fund in part our self-tender, thereby increasing our total loan balance to $35.0 million. Then, on September 19, 2016, we entered into an amendment to our term loan agreement with U.S. Bank and California Bank & Trust to allow us to consummate the purchase of assets related to the management of the Westport Fund and the Westport Select Cap Fund. In addition, the amendment revised one of the financial covenants in the term loan agreement.
Our current term loan agreement requires 48 monthly payments of $364,583 plus interest based on, at our option:
(i) LIBOR plus a margin that ranges from 2.75% to 3.25%, depending on our ratio of consolidated debt to consolidated earnings before interest, taxes, depreciation, and amortization (excluding, among other things, certain non-cash gains and losses) (“EBITDA”), or
(ii) the sum of (a) the highest of the prime rate set by U.S. Bank from time to time, the Federal Funds Rate plus 0.50%, or one-month LIBOR plus 1.00%, and (b) a margin that ranges from 0.25% to 0.75%, depending on our ratio of consolidated debt to consolidated EBITDA.
From the effective date of the current term loan agreement through February 29, 2016, the interest rate in effect was U.S. Bank’s prime rate plus a margin based on the Company’s ratio of consolidated debt to consolidated EBITDA. Effective March 1, 2016, the Company converted $32.8 million of its principal loan balance to a one-month LIBOR contract, which has been renewed each subsequent month. As of September 30, 2017, the effective rate is 4.237%, which is comprised of the LIBOR rate of 1.237% as of September 1, 2017, plus a margin of 3.0% based on the Company’s ratio of consolidated debt to consolidated EBITDA as of June 30, 2017. The Company intends to renew the one-month LIBOR contract on a monthly basis provided that the LIBOR-based interest rate remains favorable to the prime rate-based interest rate.
All borrowings under the term loan agreement are secured by substantially all of the Company’s assets. The final installment of the then-outstanding principal of $17.9 million plus accrued interest is due September 17, 2019.
Our current term loan agreement includes certain reporting requirements and loan covenants requiring the maintenance of certain financial ratios. We are in compliance with our loan covenants as of September 30, 2017. As of September 30, 2017, we had $26.3 million currently outstanding under our bank loan.
46
Table of Contents
CONTRACTUAL OBLIGATIONS
The following table sets forth our contractual obligations as of September 30, 2017, consisting of loan payments, including the related interest payments due, and operating lease payments:
| Payments due by period (in thousands) | ||||||||||||||||||||
| Less Than | More Than | |||||||||||||||||||
| Total | 1 Year | 1 - 3 Years | 3 - 5 Years | 5 Years | ||||||||||||||||
| Principal on bank loan |
$ | 26,250 | $ | 4,010 | $ | 22,240 | $ | — | $ | — | ||||||||||
| Interest on bank loan (1) |
1,805 | 952 | 853 | — | — | |||||||||||||||
| Operating lease (2) |
1,430 | 350 | 794 | 286 | — | |||||||||||||||
| Operating lease (3) |
93 | 73 | 20 | — | — | |||||||||||||||
| Operating lease (4) |
9 | 9 | — | — | — | |||||||||||||||
|
|
|
|
|
|
|
|
|
|
|
|||||||||||
| Total |
$ | 29,587 | $ | 5,394 | $ | 23,907 | $ | 286 | $ | — | ||||||||||
|
|
|
|
|
|
|
|
|
|
|
|||||||||||
| (1) | The interest payable on the bank loan is calculated at the current effective rate as of September 30, 2017, of 4.237%, which is based on the one-month LIBOR rate of 1.237% plus 3.00%. |
| (2) | This lease is for our principal executive office located at 7250 Redwood Boulevard, Suite 200, Novato, California 94945. |
| (3) | This lease is for office space located at 101 Federal Street, Suite 1900, Boston, Massachusetts 02110. |
| (4) | This lease is for office space located at 1340 Environ Way, #305, Chapel Hill, North Carolina 27517. |
CRITICAL ACCOUNTING POLICIES
Our financial statements and accompanying notes are prepared in accordance with accounting principles generally accepted in the United States, which require the use of estimates, judgments, and assumptions that affect the reported amounts of assets and liabilities at the date of the financial statements and the reported amounts of revenues and expenses during the periods presented. These accounting policies, methods, and estimates are an integral part of the financial statements prepared by management and are based upon management’s current judgments. Those judgments are normally based on knowledge and experience with regard to past and current events and assumptions about future events. Certain accounting policies, methods, and estimates are particularly sensitive because of their significance to the financial statements and because of the possibility that future events affecting them may differ markedly from management’s current judgment. Described below are the accounting policies that we believe are most critical to understanding our results of operations and financial position.
Our operating revenues consist of contractual investment advisory and shareholder service fees. We earn our investment advisory fees through portfolio management of the Hennessy Funds, and we earn our shareholder service fees by assisting investors in purchases, sales, distribution, and customer service. These fee revenues are earned and calculated daily by the Hennessy Funds’ accountants. In accordance with the Financial Accounting Standards Board (“FASB”) guidance on revenue recognition, we recognize fee revenues monthly. Our contractual agreements provide persuasive evidence that an arrangement exists with fixed and determinable fees, and the services are rendered daily. The collectability is probable as the fees are received from the Hennessy Funds in the month subsequent to the month in which the services are provided.
47
Table of Contents
The management contracts we have purchased are considered intangible assets with an indefinite life and we account for them in accordance with Accounting Standards Update (“ASU”) No. 2012-02, “Testing Indefinite-Lived Intangible Assets for Impairment,” as amended. Pursuant to ASU No. 2012-02, an entity first assesses qualitative factors to determine whether it is more likely than not that an indefinite-lived intangible asset is impaired as a basis for determining whether it is necessary to perform a quantitative impairment test in accordance with Subtopic 350-30, “Intangibles—Goodwill and Other—General Intangibles Other than Goodwill.” The more-likely-than-not threshold is defined as having a likelihood of more than 50 percent. If an entity determines that it is more likely than not that an indefinite-lived intangible asset is impaired, then it must conduct an impairment analysis. We were able to forego the annual impairment analysis for fiscal year 2017 as the more-likely-than-not threshold is met as of September 30, 2017.
The costs related to our purchase of assets related to the management of mutual funds are capitalized as incurred. The costs are defined as an ‘intangible asset’ per FASB standard “Intangibles – Goodwill and Other.” The acquisition costs include legal fees, fees for soliciting shareholder approval, and a percent of asset costs to purchase the management contracts. The amounts are included in the management contract asset, totaling $74.6 million as of September 30, 2017.
RECENTLY ISSUED AND ADOPTED ACCOUNTING STANDARDS
In May 2014, the Financial Accounting Standards Board (FASB) issued Accounting Standards Update (ASU) No. 2014-09, Revenue from Contracts with Customers (ASU 2014-09). In addition, the FASB issued related revenue recognition guidance in five ASUs: principal versus agent considerations (ASU 2016-08), identifying performance obligations and licensing (ASU 2016-10), a revision of certain SEC staff observer comments (ASU 2016-11), implementation guidance (ASU 2016-12), and technical corrections and improvements (ASU 2016-20). ASU 2014-09 is a comprehensive new revenue recognition standard that supersedes nearly all revenue recognition guidance under GAAP, provides enhancements to the quality and consistency of how revenue is reported, and improves comparability in financial statements presented under GAAP and International Financial Reporting Standards. This new standard is effective for fiscal years and interim periods within those years beginning after December 15, 2017 (our fiscal year 2019). The adoption of this standard is not expected to have a material impact on our financial condition, results of operations, or cash flows.
In August 2015, the FASB issued ASU No. 2015-15, “Interest-Imputation of Interest (Subtopic 835-30): Presentation and Subsequent Measurement of Debt Issuance Cost Associated with Line-of-Credit Arrangements,” which simplifies the presentation of debt issuance costs. Under the new guidance, debt issuance costs related to term loans should be presented as a direct deduction from the carrying amount of the associated debt liability. This new standard is effective for annual reporting periods, and interim periods within those reporting periods, beginning after December 15, 2015 (our fiscal year 2017). The impact of adopting ASU 2015-15 on our financial statements was the classification of all deferred financing costs as a deduction to the corresponding debt in addition to the reclassification of deferred financing costs in other current and long-term assets to short and long-term notes payable as of September 30, 2016, within the balance sheets to conform to the new presentation. Other than these reclassifications and additional disclosures, the adoption of ASU 2015-15 did not have a material impact on our financial statements.
In November 2015, the FASB issued ASU No. 2015-17, “Balance Sheet Classifications of Deferred Taxes.” The standard simplifies the presentation of deferred income taxes under U.S. GAAP by requiring that all deferred tax assets and liabilities be classified as non-current. This new standard is effective for annual reporting periods, and interim periods within those reporting periods, beginning after December 15, 2016 (our fiscal year 2018). The adoption of this standard is not expected to have a material impact on our financial condition, results of operations or cash flows.
48
Table of Contents
In February 2016, the FASB issued ASU No. 2016-02, “Leases (Topic 842).” The amendments under this pronouncement will change the way all leases with duration of one year of more are treated. Under this guidance, lessees will be required to capitalize virtually all leases on the balance sheet as a right-of-use asset and an associated financing lease liability or capital lease liability. This update is effective for annual reporting periods, and interim periods within those reporting periods, beginning after December 15, 2018 (our fiscal year 2020). We are currently evaluating the impact this standard will have on our policies and procedures pertaining to our existing and future lease arrangements, disclosure requirements and on our financial statements.
In March 2016, the FASB issued ASU No. 2016-09 “Compensation—Stock Compensation (Topic 718): Improvements to Employee Share-Based Payment Accounting.” The standard simplifies several aspects of the accounting for share-based payment award transactions, including (i) income tax consequences, (ii) classification of awards as either equity or liabilities, and (iii) classification on the statement of cash flows. This new standard is effective for annual reporting periods, and interim periods within those reporting periods, beginning after December 15, 2016 (our fiscal year 2018). Early adoption is permitted for any interim or annual period. The changes in the new standard eliminate the recognition of excess tax benefits or tax deficiencies from the statement of stockholders’ equity. Under the new guidance, all excess tax benefits and tax deficiencies resulting from stock-based compensation awards vesting and exercises are recognized prospectively within income tax expense, and excess tax benefits are recognized regardless of whether they reduce current taxes payable. This will increase the volatility of our effective tax rate. As of March 31, 2017, we elected to early adopt ASU 2016-09, using a modified retrospective approach, effective as if adopted the first day of the fiscal year, October 1, 2016. As a result of early adoption of ASU 2016-09, income tax benefits of approximately $0.004 million and $0.2 million were recognized as discrete events in the quarterly periods ended March 31, 2017, and December 31, 2016, respectively. We have elected to continue to estimate the number of stock-based awards expected to vest, as permitted by ASU 2016-09, rather than electing to account for forfeitures as they occur. As such, this has no cumulative effect on retained earnings for the prior year. With the early adoption of 2016-09, we have elected to present the cash flow statement on a prospective transition method and no prior periods have been adjusted.
In August 2016, the FASB issued ASU 2016-15, “Statement of Cash Flows (Topic 230), a consensus of the FASB’s Emerging Issues Task Force,” which provides guidance intended to reduce diversity in practice in how certain transactions are classified in the statement of cash flows. This ASU is effective for annual reporting periods, and interim periods within those reporting periods, beginning after December 15, 2016 (our fiscal year 2018). The adoption of this standard is not expected to have a material impact on our financial condition, results of operations, or cash flows.
In January 2017, the FASB issued ASU No. 2017-01 “Business Combinations (Topic 805): Clarifying the Definition of a Business.” Based on feedback that the definition of business is being applied too broadly, the update adds guidance to assist entities with evaluating whether transactions should be accounted for as acquisitions (or disposals) of assets or businesses. This new standard is effective for annual reporting periods, and interim periods within those reporting periods, beginning after December 15, 2017 (our fiscal year 2019). The adoption of this standard is not expected to have a material impact on our financial condition, results of operations, or cash flows.
In May 2017, the FASB issued an update to ASU No. 2017-09 “Compensation—Stock Compensation (Topic 718): Scope of Modification Accounting.” The update was issued to provide clarity and reduce both (i) diversity in practice and (ii) cost and complexity when applying the guidance in Topic 718. This update is effective for annual reporting periods, and interim periods within those reporting periods, beginning after December 15, 2017 (our fiscal year 2019). It is not expected to have a material impact on our financial condition, results of operations, or cash flows.
| ITEM 7A. | QUANTITATIVE AND QUALITATIVE DISCLOSURES ABOUT MARKET RISK |
We are subjected to different types of risk, including market risk and interest rate risk.
49
Table of Contents
Market risk is the risk that we will be adversely affected by changes in the securities market, specifically changes in equity prices.
As discussed in Item 1A, “Risk Factors,” above, our revenues are calculated as a percentage of the average daily net asset values of the Hennessy Funds. Declines in the value of the securities held by the Hennessy Funds will negatively impact our revenues and net income. The following is a summary of the effect that a 10% increase or decrease in equity prices of the stocks within the Hennessy Funds would have on our assets under management, and therefore our revenues. The changes are compared to average asset values for fiscal year 2017, and values are based on an assumption that asset values are consistent throughout the year:
| Effects of Market Risk on Revenue (In thousands) |
||||||||||||
| Values Based on Average Net Assets for Fiscal Year ended September 30, 2017 |
Values Based on a 10% Increase in Average Assets |
Values Based on a 10% Decrease in Average Assets |
||||||||||
| Average Assets |
||||||||||||
| Under Management |
$ | 6,563,178 | $ | 7,219,496 | $ | 5,906,860 | ||||||
|
|
|
|
|
|
|
|||||||
| Investment Advisor Fees |
$ | 48,297 | $ | 53,127 | $ | 43,467 | ||||||
| Shareholder Service Fees |
4,658 | 5,134 | 4,200 | |||||||||
|
|
|
|
|
|
|
|||||||
| Total Revenue: |
$ | 52,955 | $ | 58,261 | $ | 47,667 | ||||||
|
|
|
|
|
|
|
|||||||
Interest rate risk is the risk that we will be adversely affected by changes in the floating interest rate on our outstanding debt.
As discussed in Item 1A, “Risk Factors,” above, an increase in our floating interest rate on our $26.3 million of gross debt would adversely affect our profitability. A decrease in short-term interest rates, however, could potentially increase our profitability. The following is a summary of the effect that a 10% increase or decrease in short-term interest rates would have on our interest expense:
| Effects of Interest Rate Changes on Expenses (In thousands) |
||||||||||||
| Values Based on Effective Interest Rate of 3.895% For Fiscal Year 2017 |
Values Based on a 10% Increase in Effective Interest Rate |
Values Based on a 10% Decrease in Effective Interest Rate |
||||||||||
| Gross Debt Owed at September 30, 2017 |
$ | 26,250 | $ | 26,250 | $ | 26,250 | ||||||
|
|
|
|
|
|
|
|||||||
| Interest Expense |
$ | 1,109 | $ | 1,227 | $ | 1,004 | ||||||
50
Table of Contents
| ITEM 8. | FINANCIAL STATEMENTS AND SUPPLEMENTARY DATA |
Index to Financial Statements:
| Management’s Annual Report on Internal Control over Financial Reporting |
52 | |||
| Report of Independent Registered Public Accounting Firm on Internal Control over Financial Reporting |
53 | |||
| 54 | ||||
| 55 | ||||
| 56 | ||||
| 57 | ||||
| 58 | ||||
| 59 | ||||
51
Table of Contents
Management’s Annual Report on Internal Control over Financial Reporting
Management of Hennessy Advisors, Inc. (the “Company”) is responsible for establishing and maintaining adequate internal control over financial reporting, as such term is defined in Rule 13a-15(f) under the Securities Exchange Act of 1934. The Company’s internal control over financial reporting is designed to provide reasonable assurance regarding the reliability of financial reporting and the preparation of financial statements for external purposes in accordance with U.S. generally accepted accounting principles.
Because of its inherent limitations, internal control over financial reporting may not prevent or detect misstatements. Also, projections of any evaluation of effectiveness to future periods are subject to risk that controls may become inadequate because of changes in conditions, or that the degree of compliance with the policies or procedures may deteriorate.
The Company’s management assessed the effectiveness of the Company’s internal control over financial reporting as of September 30, 2017, using the criteria set forth in 2013 Internal Control — Integrated Framework 2013 issued by the Committee of Sponsoring Organizations of the Treadway Commission. Based on this assessment, the Company’s management concluded that, as of September 30, 2017, the Company’s internal control over financial reporting was effective based on those criteria.
Our independent registered public accounting firm, Marcum LLP, audited the effectiveness of our internal control over financial reporting. Marcum LLP’s attestation report appears in Item 8, “Financial Statements and Supplementary Data.”
52
Table of Contents
Report of Independent Registered Public Accounting Firm
on Internal Control Over Financial Reporting
To the Audit Committee of the Board of Directors and Shareholders
of Hennessy Advisors, Inc.:
We have audited Hennessy Advisors, Inc.’s internal control over financial reporting as of September 30, 2017, based on criteria established in Internal Control-Integrated Framework 2013 issued by the Committee of Sponsoring Organizations of the Treadway Commission. Hennessy Advisors, Inc.’s management is responsible for maintaining effective internal control over financial reporting, and for its assessment of the effectiveness of internal control over financial reporting, included in the accompanying “Management Annual Report on Internal Control over Financial Reporting.” Our responsibility is to express an opinion on the Hennessy Advisors, Inc.’s internal control over financial reporting based on our audit.
We conducted our audit in accordance with the standards of the Public Company Accounting Oversight Board (United States). Those standards require that we plan and perform the audit to obtain reasonable assurance about whether effective internal control over financial reporting was maintained in all material respects. Our audit of internal control over financial reporting included obtaining an understanding of internal control over financial reporting, assessing the risk that a material weakness exists, and testing and evaluating the design and operating effectiveness of internal control based on the assessed risk. Our audit also included performing such other procedures as we considered necessary in the circumstances. We believe that our audit provides a reasonable basis for our opinion.
A company’s internal control over financial reporting is a process designed to provide reasonable assurance regarding the reliability of financial reporting and the preparation of financial statements for external purposes in accordance with generally accepted accounting principles. A company’s internal control over financial reporting includes those policies and procedures that (1) pertain to the maintenance of records that, in reasonable detail, accurately and fairly reflect the transactions and dispositions of the assets of the company; (2) provide reasonable assurance that transactions are recorded as necessary to permit preparation of financial statements in accordance with generally accepted accounting principles, and that receipts and expenditures of the company are being made only in accordance with authorizations of management and directors of the company; and (3) provide reasonable assurance regarding prevention or timely detection of unauthorized acquisition, use, or disposition of the company’s assets that could have a material effect on the financial statements.
Because of the inherent limitations, internal control over financial reporting may not prevent or detect misstatements. Also, projections of any evaluation of effectiveness to future periods are subject to the risk that controls may become inadequate because of changes in conditions, or that degree of compliance with the policies or procedures may deteriorate.
In our opinion, Hennessy Advisors, Inc. maintained, in all material aspects, effective internal control over financial reporting as of September 30, 2017, based on criteria established in Internal Control – Integrated Framework 2013 issued by the Committee of Sponsoring Organizations of the Treadway Commission.
We have also audited, in accordance with the standards of the Public Company Accounting Oversight Board (United States), the balance sheets as of September 30, 2017 and 2016, and the related statements of income, changes in stockholders’ equity, and cash flows for the three years ended September 30, 2017, of Hennessy Advisors, Inc. and our report dated December 4, 2017, expressed an unqualified opinion on those financial statements.
/s/ Marcum LLP
San Francisco, California
December 4, 2017
53
Table of Contents
Report of Independent Registered Public Accounting Firm
To the Audit Committee of the Board of Directors and Shareholders
of Hennessy Advisors, Inc.:
We have audited the accompanying balance sheets of Hennessy Advisors, Inc. as of September 30, 2017 and 2016, and the related statements of income, changes in stockholders’ equity and cash flows for the three years ended September 30, 2017. These financial statements are the responsibility of Hennessy Advisors, Inc.’s management. Our responsibility is to express an opinion on these financial statements based on our audits.
We conducted our audits in accordance with the standards of the Public Company Accounting Oversight Board (United States). Those standards require that we plan and perform the audit to obtain reasonable assurance about whether the financial statements are free of material misstatement. An audit also includes examining, on a test basis, evidence supporting the amounts and disclosures in the financial statements, assessing the accounting principles used and significant estimates made by management, as well as evaluating the overall financial statement presentation. We believe that our audits provide a reasonable basis for our opinion.
In our opinion, the financial statements referred to above present fairly, in all material respects, the financial position of Hennessy Advisors, Inc. as of September 30, 2017 and 2016, and the results of its operations and its cash flows for the three years ended September 30, 2017, in conformity with accounting principles generally accepted in the United States of America.
We have also audited, in accordance with the standards of the Public Company Accounting Oversight Board (United States), Hennessy Advisors, Inc.’s internal control over financial reporting as of September 30, 2017, based on the criteria established in Internal Control-Integrated Framework 2013 issued by the Committee of Sponsoring Organizations of the Treadway Commission and our report dated December 4, 2017, expressed an unqualified opinion on the effectiveness of Hennessy Advisors, Inc.’s internal control over financial reporting.
/s/ Marcum LLP
San Francisco, California
December 4, 2017
54
Table of Contents
Hennessy Advisors, Inc.
(In thousands, except share and per share amounts)
| September 30, 2017 |
September 30, 2016 |
|||||||
| Assets |
||||||||
| Current assets: |
||||||||
| Cash and cash equivalents |
$ | 15,700 | $ | 3,535 | ||||
| Investments in marketable securities, at fair value |
8 | 8 | ||||||
| Investment fee income receivable |
4,325 | 4,230 | ||||||
| Prepaid expenses |
1,614 | 1,175 | ||||||
| Deferred income tax asset |
669 | 607 | ||||||
| Other accounts receivable |
584 | 580 | ||||||
|
|
|
|
|
|||||
| Total current assets |
22,900 | 10,135 | ||||||
|
|
|
|
|
|||||
| Property and equipment, net of accumulated depreciation of $922 and $940, respectively |
254 | 296 | ||||||
| Management contracts |
74,628 | 74,359 | ||||||
| Other assets |
145 | 149 | ||||||
|
|
|
|
|
|||||
| Total assets |
$ | 97,927 | $ | 84,939 | ||||
|
|
|
|
|
|||||
| Liabilities and Stockholders’ Equity |
||||||||
| Current liabilities: |
||||||||
| Accrued liabilities and accounts payable |
$ | 7,353 | $ | 6,578 | ||||
| Income taxes payable |
676 | 383 | ||||||
| Deferred rent |
202 | 32 | ||||||
| Current portion of long-term debt, net of discount and debt issuance costs |
4,228 | 4,228 | ||||||
|
|
|
|
|
|||||
| Total current liabilities |
12,459 | 11,221 | ||||||
|
|
|
|
|
|||||
| Long-term debt, net of discount and debt issuance costs and current portion |
21,728 | 25,956 | ||||||
| Deferred income tax liability |
12,210 | 10,431 | ||||||
|
|
|
|
|
|||||
| Total liabilities |
46,397 | 47,608 | ||||||
|
|
|
|
|
|||||
| Commitments and Contingencies (Note 10) |
||||||||
| Stockholders’ equity: |
||||||||
| Common stock, no par value, 22,500,000 shares authorized: |
||||||||
| 7,776,563 shares issued and outstanding at September 30, 2017 and 7,661,969 at September 30, 2016 |
14,943 | 13,279 | ||||||
| Retained Earnings |
36,587 | 24,052 | ||||||
|
|
|
|
|
|||||
| Total stockholders’ equity |
51,530 | 37,331 | ||||||
|
|
|
|
|
|||||
| Total liabilities and stockholders’ equity |
$ | 97,927 | $ | 84,939 | ||||
|
|
|
|
|
|||||
See accompanying notes to financial statements
55
Table of Contents
Hennessy Advisors, Inc.
(In thousands, except share and per share amounts)
| Years Ended September 30, | ||||||||||||
| 2017 | 2016 | 2015 | ||||||||||
| Revenue |
||||||||||||
| Investment advisory fees |
$ | 48,297 | $ | 46,391 | $ | 41,177 | ||||||
| Shareholder service fees |
4,658 | 5,019 | 3,562 | |||||||||
|
|
|
|
|
|
|
|||||||
| Total revenue |
52,955 | 51,410 | 44,739 | |||||||||
|
|
|
|
|
|
|
|||||||
| Operating expenses |
||||||||||||
| Compensation and benefits |
12,862 | 11,943 | 9,750 | |||||||||
| General and administrative |
5,882 | 5,806 | 5,223 | |||||||||
| Mutual fund distribution |
274 | 775 | 2,403 | |||||||||
| Sub-advisor fees |
9,225 | 8,743 | 7,284 | |||||||||
| Amortization and depreciation |
366 | 353 | 265 | |||||||||
|
|
|
|
|
|
|
|||||||
| Total operating expenses |
28,609 | 27,620 | 24,925 | |||||||||
|
|
|
|
|
|
|
|||||||
| Net operating income |
24,346 | 23,790 | 19,814 | |||||||||
| Interest expense |
1,109 | 1,232 | 1,012 | |||||||||
| Other income |
(12 | ) | (2 | ) | (1 | ) | ||||||
|
|
|
|
|
|
|
|||||||
| Income before income tax expense |
23,249 | 22,560 | 18,803 | |||||||||
| Income tax expense |
8,307 | 8,193 | 7,414 | |||||||||
|
|
|
|
|
|
|
|||||||
| Net income |
$ | 14,942 | $ | 14,367 | $ | 11,389 | ||||||
|
|
|
|
|
|
|
|||||||
| Earnings per share: |
||||||||||||
| Basic |
$ | 1.94 | $ | 1.89 | $ | 1.29 | ||||||
|
|
|
|
|
|
|
|||||||
| Diluted |
$ | 1.92 | $ | 1.86 | $ | 1.27 | ||||||
|
|
|
|
|
|
|
|||||||
| Weighted average shares outstanding (prior periods restated for stock split, see Note 9): |
|
|||||||||||
| Basic |
7,691,937 | 7,600,583 | 8,831,094 | |||||||||
|
|
|
|
|
|
|
|||||||
| Diluted |
7,790,527 | 7,717,965 | 8,941,034 | |||||||||
|
|
|
|
|
|
|
|||||||
| Cash dividends declared per share: |
$ | 0.29 | $ | 0.20 | $ | 0.15 | ||||||
|
|
|
|
|
|
|
|||||||
See accompanying notes to financial statements
56
Table of Contents
Hennessy Advisors, Inc.
Statements of Changes in Stockholders’ Equity
Years Ended September 30, 2017, 2016 and 2015
(In thousands, except share data)
| Common Stock | Retained Earnings |
Total Stockholders’ Equity |
||||||||||||||
| Number | Amount | |||||||||||||||
| Balance at September 30, 2014 |
9,028,914 | $ | 10,852 | $ | 26,562 | $ | 37,414 | |||||||||
| Net income |
— | — | 11,389 | 11,389 | ||||||||||||
| Dividends paid |
— | — | (1,383 | ) | (1,383 | ) | ||||||||||
| Employee and director restricted stock vested |
51,113 | — | — | — | ||||||||||||
| Repurchase of common stock pursuant to self-tender offer, including costs of $55,655 |
(1,500,000 | ) | — | (25,056 | ) | (25,056 | ) | |||||||||
| Repurchase of vested employee restricted stock for tax withholding |
(10,280 | ) | (71 | ) | (68 | ) | (139 | ) | ||||||||
| Shares issued for auto-investments pursuant to the 2015 Dividend Reinvestment and Stock Purchase Plan |
18 | — | — | — | ||||||||||||
| Shares issued for dividend reinvestment pursuant to the 2015 Dividend Reinvestment and Stock Purchase Plan |
177 | 3 | (3 | ) | — | |||||||||||
| Stock-based compensation |
— | 692 | — | 692 | ||||||||||||
| Tax effect of restricted stock unit vesting |
— | 178 | — | 178 | ||||||||||||
|
|
|
|
|
|
|
|
|
|||||||||
| Balance at September 30, 2015 |
7,569,942 | $ | 11,654 | $ | 11,441 | $ | 23,095 | |||||||||
| Net income |
— | — | 14,367 | 14,367 | ||||||||||||
| Dividends paid |
— | — | (1,500 | ) | (1,500 | ) | ||||||||||
| Employee and director restricted stock vested |
119,250 | — | — | — | ||||||||||||
| Repurchase of vested employee restricted stock for tax withholding |
(28,872 | ) | (282 | ) | (236 | ) | (518 | ) | ||||||||
| Shares issued for auto-investments pursuant to the 2015 Dividend Reinvestment and Stock Purchase Plan |
735 | 15 | — | 15 | ||||||||||||
| Shares issued for dividend reinvestment pursuant to the 2015 Dividend Reinvestment and Stock Purchase Plan |
914 | 20 | (20 | ) | — | |||||||||||
| Stock-based compensation |
— | 1,416 | — | 1,416 | ||||||||||||
| Tax effect of restricted stock unit vesting |
— | 456 | — | 456 | ||||||||||||
|
|
|
|
|
|
|
|
|
|||||||||
| Balance at September 30, 2016 |
7,661,969 | $ | 13,279 | $ | 24,052 | $ | 37,331 | |||||||||
| Net income |
— | — | 14,942 | 14,942 | ||||||||||||
| Dividends paid |
— | — | (2,243 | ) | (2,243 | ) | ||||||||||
| Employee and director restricted stock vested |
152,322 | — | — | — | ||||||||||||
| Repurchase of vested employee restricted stock for tax withholding |
(39,820 | ) | (489 | ) | (164 | ) | (653 | ) | ||||||||
| Shares issued for auto-investments pursuant to the 2015 Dividend Reinvestment and Stock Purchase Plan |
183 | 3 | — | 3 | ||||||||||||
| Shares issued for dividend reinvestment pursuant to the 2015 Dividend Reinvestment and Stock Purchase Plan |
1,965 | 33 | — | 33 | ||||||||||||
| Stock-based compensation |
— | 2,118 | — | 2,118 | ||||||||||||
| Adjustment for fractional shares paid in cash in connection with stock split |
(56 | ) | (1 | ) | — | (1 | ) | |||||||||
|
|
|
|
|
|
|
|
|
|||||||||
| Balance at September 30, 2017 |
7,776,563 | $ | 14,943 | $ | 36,587 | $ | 51,530 | |||||||||
|
|
|
|
|
|
|
|
|
|||||||||
See accompanying notes to financial statements
57
Table of Contents
Hennessy Advisors, Inc.
(In thousands)
| Fiscal Year Ended September 30, | ||||||||||||
| 2017 | 2016 | 2015 | ||||||||||
| Cash flows from operating activities: |
||||||||||||
| Net income |
$ | 14,942 | $ | 14,367 | $ | 11,389 | ||||||
| Adjustments to reconcile net income to net cash provided by operating activities: |
||||||||||||
| Amortization and depreciation |
219 | 206 | 265 | |||||||||
| Deferred income taxes |
1,717 | 1,359 | 1,308 | |||||||||
| Tax effect from restricted stock units |
— | 456 | 178 | |||||||||
| Restricted stock units repurchased for employee tax withholding |
(653 | ) | (518 | ) | (139 | ) | ||||||
| Stock-based compensation |
2,118 | 1,416 | 692 | |||||||||
| Unrealized gains on marketable securities |
— | (1 | ) | — | ||||||||
| Amortization of loan fee payments |
147 | 147 | — | |||||||||
| Change in operating assets and liabilities: |
||||||||||||
| Investment fee income receivable |
(95 | ) | (178 | ) | (910 | ) | ||||||
| Prepaid expenses |
(439 | ) | (126 | ) | (448 | ) | ||||||
| Other accounts receivable |
(4 | ) | (45 | ) | (91 | ) | ||||||
| Other assets |
4 | — | (10 | ) | ||||||||
| Accrued liabilities and accounts payable |
775 | 1,879 | 1,161 | |||||||||
| Income taxes payable |
292 | (714 | ) | 1,097 | ||||||||
| Current portion of deferred rent |
170 | (62 | ) | (48 | ) | |||||||
|
|
|
|
|
|
|
|||||||
| Net cash provided by operating activities |
19,193 | 18,186 | 14,444 | |||||||||
|
|
|
|
|
|
|
|||||||
| Cash flows from investing activities: |
||||||||||||
| Purchases of property and equipment |
(176 | ) | (184 | ) | (258 | ) | ||||||
| Payments related to management contracts |
(269 | ) | (11,678 | ) | (192 | ) | ||||||
|
|
|
|
|
|
|
|||||||
| Net cash used in investing activities |
(445 | ) | (11,862 | ) | (450 | ) | ||||||
|
|
|
|
|
|
|
|||||||
| Cash flows from financing activities: |
||||||||||||
| Principal payments on bank loan |
(4,375 | ) | (4,375 | ) | (3,750 | ) | ||||||
| Payoff of previous bank loan |
— | — | (22,972 | ) | ||||||||
| Proceeds from new bank loan |
— | — | 35,000 | |||||||||
| Loan fee payments on bank loan |
— | (15 | ) | (392 | ) | |||||||
| Proceeds from shares issued pursuant to the 2015 Dividend Reinvestment and Stock Repurchase Plan |
3 | 15 | — | |||||||||
| Dividend payments |
(2,210 | ) | (1,500 | ) | (1,383 | ) | ||||||
| Repurchase of common stock pursuant to self-tender offer, including costs of $55,655 |
— | — | (25,056 | ) | ||||||||
| Cash paid for fractional shares in connection with stock split |
(1 | ) | — | — | ||||||||
|
|
|
|
|
|
|
|||||||
| Net cash used in financing activities |
(6,583 | ) | (5,875 | ) | (18,553 | ) | ||||||
|
|
|
|
|
|
|
|||||||
| Net increase (decrease) in cash and cash equivalents |
12,165 | 449 | (4,559 | ) | ||||||||
| Cash and cash equivalents at the beginning of the period |
3,535 | 3,086 | 7,645 | |||||||||
|
|
|
|
|
|
|
|||||||
| Cash and cash equivalents at the end of the period |
$ | 15,700 | $ | 3,535 | $ | 3,086 | ||||||
|
|
|
|
|
|
|
|||||||
| Supplemental disclosures of cash flow information: |
||||||||||||
| Cash paid for: |
||||||||||||
| Income taxes |
$ | 6,680 | $ | 6,960 | $ | 5,194 | ||||||
|
|
|
|
|
|
|
|||||||
| Interest |
$ | 1,109 | $ | 1,190 | $ | 1,004 | ||||||
|
|
|
|
|
|
|
|||||||
See accompanying notes to financial statements
58
Table of Contents
| (1) | Summary of the Organization, Description of Business and Significant Accounting Policies |
(a) Organization and Description of Business
Hennessy Advisors, Inc. was founded on February 1, 1989, as a California corporation under the name Edward J. Hennessy, Incorporated. In 1990, the Company became a registered investment advisor and on April 15, 2001, the Company changed its name to Hennessy Advisors, Inc.
The Company’s operating activities consist primarily of providing investment advisory services to 14 open-end mutual funds branded as the Hennessy Funds. The Company serves as the investment advisor to all classes of the Hennessy Cornerstone Growth Fund, the Hennessy Focus Fund, the Hennessy Cornerstone Mid Cap 30 Fund, the Hennessy Cornerstone Large Growth Fund, the Hennessy Cornerstone Value Fund, the Hennessy Total Return Fund, the Hennessy Equity and Income Fund, the Hennessy Balanced Fund, the Hennessy Gas Utility Fund, the Hennessy Small Cap Financial Fund, the Hennessy Large Cap Financial Fund, the Hennessy Technology Fund, the Hennessy Japan Fund, and the Hennessy Japan Small Cap Fund. The Company also provides shareholder services to the entire family of the Hennessy Funds. Prior to March 1, 2015, the Company only earned shareholder service fees from some of the Hennessy Funds.
The Company’s operating revenues consist of contractual investment advisory and shareholder service fees paid to it by the Hennessy Funds. The Company earns investment advisory fees from each Hennessy Fund by, among other things:
| • | acting as portfolio manager for the fund or overseeing the sub-advisor acting as portfolio manager for the fund, which includes managing the composition of the fund’s portfolio (including the purchase, retention, and disposition of portfolio securities in accordance with the fund’s investment objectives, policies, and restrictions), ensuring compliance with “best execution” for the fund’s portfolio, managing the use of soft dollars for the fund, and managing proxy voting for the fund; |
| • | performing a daily reconciliation of portfolio positions and cash for the fund; |
| • | monitoring the fund’s compliance with its investment objectives and restrictions and federal securities laws; |
| • | performing activities such as maintaining a compliance program, conducting ongoing reviews of the compliance programs of the fund’s service providers (including its sub-advisor, as applicable), conducting on-site visits to the fund’s service providers (including its sub-advisor, as applicable), monitoring incidents of abusive trading practices, reviewing fund expense accruals, payments, and fixed expense ratios, evaluating insurance providers for fidelity bond coverage, D&O/E&O and cybersecurity insurance coverage, conducting employee compliance training, reviewing reports provided by service providers, maintaining books and records, and preparing an annual compliance report to the Board of Trustees of Hennessy Funds Trust (the “Funds’ Board of Trustees”); |
| • | overseeing the selection and continued employment of the fund’s sub-advisor, if applicable, monitoring such sub-advisor’s adherence to the fund’s investment objectives, policies, and restrictions, and reviewing the fund’s investment performance; |
| • | overseeing service providers that provide accounting, administration, distribution, transfer agency, custodial, sales and marketing, public relations, audit, information technology, and legal services to the fund; |
59
Table of Contents
| • | maintaining in-house marketing and distribution departments on behalf of the fund; |
| • | being actively involved with preparing all regulatory filings for the fund, including writing and annually updating the fund’s prospectus and related documents; |
| • | preparing or reviewing a written summary of the fund’s performance for the most recent 12-month period for each annual report of the fund; |
| • | monitoring and overseeing the accessibility of the fund on third-party platforms; |
| • | paying the incentive compensation of the fund’s compliance officers and employing other staff such as legal, marketing, national accounts and distribution, sales, administrative, and trading oversight personnel, as well as management executives; |
| • | providing a quarterly compliance certification to Hennessy Funds Trust; and |
| • | preparing or reviewing materials for the Funds’ Board of Trustees, presenting or leading discussions to or with the Funds’ Board of Trustees, preparing or reviewing meeting minutes, and arranging for training and education of the Funds’ Board of Trustees. |
The Company earns shareholder service fees from Investor Class shares of the Hennessy Funds by, among other things, maintaining an “800” number that the current investors of the Hennessy Funds may call to ask questions about the Hennessy Funds or their accounts, or to get help with processing exchange and redemption requests or changing account options. These fee revenues are earned and calculated daily by the Hennessy Funds’ accountants at U.S. Bancorp Fund Services, LLC. The fees are computed and billed monthly, at which time they are recognized in accordance with Accounting Standard Codification 605 “Revenue Recognition.”
Effective February 28, 2017, the Company waives fees with respect to the Hennessy Technology Fund to comply with a contractual expense ratio limitation. The fee waiver is calculated daily by the Hennessy Funds’ accountants at U.S. Bancorp Fund Services, LLC and is charged to expense monthly by the Company as an offset to revenues. The waived fee is deducted from investment advisory fee income and reduces the aggregate amount of advisory fees received by the Company in the subsequent month. To date, the Company has only waived fees based on contractual obligations, but the Company has the ability to waive fees at its discretion. Any decision to waive fees voluntarily would not apply to previous periods, but would only apply on a going forward basis.
The Company’s contractual agreements for investment advisory and shareholder services provide persuasive evidence that an arrangement exists with fixed and determinable fees, and the services are rendered daily. The collectability is probable as the fees are received from the Hennessy Funds in the month subsequent to the month in which the services are provided.
(b) Cash and Cash Equivalents
Cash and cash equivalents include all cash balances and highly liquid investments with original maturities of three months or less that are readily convertible into cash.
(c) Investments
Investments in highly liquid financial instruments with remaining maturities of less than one year are classified as short-term investments. Financial instruments with remaining maturities of greater than one year are classified as long-term investments. A table of investments is included in Footnote 4.
60
Table of Contents
The Company holds investments in publicly traded mutual funds, which are accounted for as trading securities. Accordingly, unrealized gains of less than $1,000 per year were recognized in operations for fiscal years 2017, 2016, and 2015.
Dividend income is recorded on the ex-dividend date. Purchases and sales of marketable securities are recorded on a trade date basis, and realized gains and losses recognized on sale are determined on a specific identification/average cost basis.
(d) Management Contracts Purchased
Throughout its history, the Company has completed eight purchases of assets related to the management of 25 different mutual funds, some of which were reorganized into already existing Hennessy Funds. In accordance with FASB guidance, the Company periodically reviews the carrying value of its purchased management contracts to determine if any impairment has occurred. The fair value of management contracts are based on management estimates and assumptions, including third-party valuations that utilize appropriate valuation techniques. The fair value of the management contracts was estimated by applying the income approach. It is the opinion of the Company’s management that there was no impairment as of September 30, 2017, 2016, or 2015.
Under the FASB guidance on “Intangibles – Goodwill and Other,” intangible assets that have indefinite useful lives are not amortized but are tested at least annually for impairment. The Company reviews the life of the management contracts each reporting period to determine if they continue to have an indefinite useful life. The Company considers the mutual fund management contracts to be intangible assets with an indefinite useful life and are not impaired as of September 30, 2017.
The Company completed its most recent asset purchase on September 23, 2016, when it purchased the assets related to the management of the Westport Fund and the Westport Select Cap Fund. This asset purchase added approximately $435 million to the Company’s assets under management. The purchase was consummated in accordance with the terms and conditions of that certain Transaction Agreement, dated as of May 2, 2016, between the Company and Westport Advisers, LLC. The purchase price of $11.3 million was funded with available cash and was based on the aggregate average assets under management for the Westport Fund and the Westport Select Cap Fund as measured at the close of business on the effective date of the Transaction Agreement and on each of the two trading days immediately preceding the date of the Transaction Agreement. The total capitalized costs related to the purchase were $11.5 million.
(e) Fair Value of Financial Instruments
The FASB guidance on “Disclosures about Fair Value of Financial Instruments” requires disclosures regarding the fair value of all financial instruments for financial statement purposes. The estimates presented in these financial statements are based on information available to management as of September 30, 2017, 2016, and 2015. Accordingly, the fair values presented in the Company’s financial statements as of September 30, 2017, 2016, and 2015, may not be indicative of amounts that could be realized on disposition of the financial instruments. The fair value of receivables, accounts payable and notes payable has been estimated at carrying value due to the short maturity of these instruments. The fair value of purchased management contracts is estimated at the cost of the purchase. The fair value of marketable securities and money market accounts is based on closing net asset values as reported by securities exchanges registered with the SEC.
61
Table of Contents
(f) Property and Equipment
Property and equipment are stated at cost less accumulated depreciation. Depreciation is computed using the straight-line method over the estimated useful lives of the assets, generally one to 10 years.
(g) Income Taxes
The Company, under the FASB guidance on “Accounting for Uncertainty in Income Tax,” uses a recognition threshold and measurement attribute for the financial statement recognition and measurement of uncertain tax positions taken or expected to be taken in a company’s income tax return, and also provides guidance on derecognition, classification, interest and penalties, accounting in interim periods, disclosure, and transition. The Company utilizes a two-step approach for evaluating uncertain tax positions. Step one, recognition, requires a company to determine if the weight of available evidence indicates that a tax position is more likely than not to be sustained upon audit, including resolution of related appeals or litigation processes, if any. Step two, measurement, is based on the largest amount of benefit, which is more likely than not to be realized on ultimate settlement.
The Company believes the positions taken on the tax returns are fully supported, but tax authorities may challenge these positions, which may not be fully sustained on examination by the relevant tax authorities. Accordingly, the income tax provision includes amounts intended to satisfy assessments that may result from these challenges. Determining the income tax provision for these potential assessments and recording the related effects requires management judgement and estimates. The amounts ultimately paid on resolution of an audit could be materially different from the amounts previously included in the income tax provision, and, therefore, could have a material impact on our income tax provision, net income and cash flows. The accrual for uncertain tax positions is attributable primarily to uncertainties concerning the tax treatment of our domestic operations, including the allocation of income among different jurisdictions. For a further discussion on taxes, refer to Note 8 to the Financial Statements.
The Company files U.S. federal and state tax returns and has determined that its major tax jurisdictions are the United States, California, District of Columbia, Florida, Massachusetts, Texas, New Hampshire, North Carolina, Illinois, Maryland, Michigan, Minnesota, and New York. The tax years ended in 2014 through 2016 remain open and subject to examination by the appropriate governmental agencies in the U.S.; the tax years ended in 2013 through 2016 remain open in California; the tax years ended in 2014 through 2016 remain open in Massachusetts, North Carolina, and New Hampshire; the tax years ended 2015 and 2016 remain open for Illinois, District of Columbia, Maryland, Michigan, Minnesota, New York, and Texas. For any unfiled tax returns the statute of limitations will be open indefinitely.
The Company’s effective tax rate of 35.7%, 36.3%, and 39.4% for fiscal year 2017, 2016, and 2015, respectively, differ from the federal statutory rate primarily due to the effects of state income taxes. The effective income tax rate was lower for fiscal year 2017 due to recognition of uncertain tax position benefits from the finalization of state regulations.
(h) Earnings Per Share
Basic earnings per share is determined by dividing net earnings by the weighted average number of shares of common stock outstanding, while diluted earnings per share is determined by dividing net earnings by the weighted average number of shares of common stock outstanding adjusted for the dilutive effect of common stock equivalents.
All common stock equivalents were dilutive and therefore included in the diluted earnings per share calculation for fiscal years 2017, 2016, and 2015.
62
Table of Contents
On January 26, 2017, the Company’s Board of Directors declared a 3-for-2 stock split, which was effected on March 6, 2017, for shareholders of record as of February 10, 2017. All disclosures in this report relating to shares of common stock, restricted stock units, and per share data have been adjusted to reflect this stock split.
(i) Equity
Amended and Restated 2013 Omnibus Incentive Plan
Effective January 17, 2013, the Company established, and the Company’s shareholders approved, the 2013 Omnibus Incentive Plan providing for the issuance of options, stock appreciation rights, restricted stock, restricted stock units, performance awards, and other equity awards for the purpose of attracting and retaining executive officers, key employees, and outside directors and advisors and increasing shareholder value. On March 26, 2014, the Company adopted, and the Company’s shareholders approved, the Amended and Restated 2013 Omnibus Incentive Plan (the “Omnibus Plan”), pursuant to which amounts that a participant in the Omnibus Plan is entitled to receive with respect to certain types of awards were increased as compared to the limitations included in the prior 2013 Omnibus Incentive Plan. The maximum number of shares that may be issued under the Omnibus Plan is 50% of the number of outstanding shares of common stock of the Company, subject to adjustment by the compensation committee of the Board of Directors of the Company upon the occurrence of certain events. The 50% limitation does not invalidate any awards made prior to a decrease in the number of outstanding shares, even if such awards have result or may result in shares constituting more than 50% of the outstanding shares being available for issuance under the Omnibus Plan. Shares available under the Omnibus Plan that are not awarded in one particular year may be awarded in subsequent years.
The compensation committee of the Board of Directors of the Company has the authority to determine the awards granted under the Omnibus Plan, including among other things, the individuals who receive the awards, the times when they receive them, vesting schedules, performance goals, whether an option is an incentive or nonqualified option and the number of shares to be subject to each award. However, no participant may receive options or stock appreciation rights under the Omnibus Plan for an aggregate of more than 75,000 shares in any calendar year. The exercise price and term of each option or stock appreciation right is fixed by the compensation committee except that the exercise price for each stock option that is intended to qualify as an incentive stock option must be at least equal to the fair market value of the stock on the date of grant and the term of the option cannot exceed 10 years. In the case of an incentive stock option granted to a 10% or more shareholder, the exercise price must be at least 110% of the fair market value on the date of grant and cannot exceed five years. Incentive stock options may be granted only within 10 years from the date of adoption of the Omnibus Plan. The aggregate fair market value (determined at the time the option is granted) of shares with respect to which incentive stock options may be granted to any one individual, which stock options are exercisable for the first time during any calendar year, may not exceed $100,000. An optionee may, with the consent of the compensation committee, elect to pay for the shares to be received upon exercise of his or her options in cash, shares of common stock or any combination thereof.
Under the Omnibus Plan, participants may be granted restricted stock units (“RSUs”), representing an unfunded, unsecured right to receive a share of the Company’s common stock on the date specified in the recipient’s award. The Company issues new shares of its common stock when it is required to deliver shares to an RSU recipient. The RSUs granted under the Omnibus Plan vest over four years, at a rate of 25% per year. The Company recognizes compensation expense on a straight-line basis over the four-year vesting term of each award. There were 130,900, 132,300, and 273,750 RSUs granted during fiscal years 2017, 2016, and 2015, respectively.
All compensation costs related to RSUs vested during fiscal years 2017, 2016, and 2015 have been recognized in the financial statements.
63
Table of Contents
The Company has available up to 3,888,281 shares of the Company’s common stock in respect of granted stock awards, in accordance with terms of the Omnibus Plan.
RSU activity for fiscal years 2017, 2016, and 2015 was as follows:
| Restricted Stock Unit Activity | ||||||||
| Years Ended September 30, 2017, 2016, and 2015 | ||||||||
| Number of Restricted Share Units |
Weighted Avg. Fair Value at Each Date |
|||||||
| Non-vested Balance at September 30, 2014 |
169,445 | $ | 8.35 | |||||
| Granted |
273,750 | $ | 14.08 | |||||
| Vested (1) |
(75,054 | ) | $ | 9.22 | ||||
| Forfeited |
(900 | ) | $ | 6.01 | ||||
|
|
|
|
|
|||||
| Non-vested Balance at September 30, 2015 |
367,241 | $ | 12.45 | |||||
| Granted |
132,300 | $ | 21.67 | |||||
| Vested (1) |
(120,077 | ) | $ | 11.79 | ||||
| Forfeited |
— | $ | — | |||||
|
|
|
|
|
|||||
| Non-vested Balance at September 30, 2016 |
379,464 | $ | 16.19 | |||||
| Granted |
130,900 | $ | 14.38 | |||||
| Vested (1) |
(152,073 | ) | $ | 13.93 | ||||
| Forfeited |
— | $ | — | |||||
|
|
|
|
|
|||||
| Non-vested Balance at September 30, 2017 |
358,291 | $ | 16.48 | |||||
|
|
|
|
|
|||||
64
Table of Contents
| (1) | The restricted share units vested includes partially vested shares. Shares of common stock have not been issued for the partially vested shares, but the related compensation costs have been charged to expense. There were 112,503, 60,252, and 27,222 shares of common stock issued for restricted stock units vested in fiscal years 2017, 2016, and 2015, respectively. |
RSU Compensation
Fiscal Year Ended September 30, 2017
| (In Thousands) | ||||
| Total expected compensation expense related to RSUs |
$ | 12,490 | ||
| Compensation expense recognized as of September 30, 2017 |
(6,584 | ) | ||
|
|
|
|||
| Unrecognized compensation expense related to RSUs at September 30, 2017 |
$ | 5,906 | ||
|
|
|
|||
As of September 30, 2017, there was $5.9 million of total RSU compensation expense related to non-vested awards not yet recognized that is expected to be recognized over a weighted-average vesting period of 2.9 years.
Dividend Reinvestment and Stock Purchase Plan
In March 2015, the Company established a Dividend Reinvestment and Stock Purchase Plan (the “DRSPP”) to provide shareholders and new investors with a convenient and economical means of purchasing shares of the Company’s common stock and reinvesting cash dividends paid on the Company’s common stock. Under the DRSPP, the Company issued 2,148, 1,649, and 195 shares of common stock in fiscal years 2017, 2016, and 2015, respectively. The maximum number of shares that may be issued under the DRSPP is 1,500,000 shares, of which 1,496,008 shares remain available for issuance.
(j) Use of Estimates
The preparation of financial statements in conformity with accounting principles generally accepted in the United States requires management to make estimates and assumptions that affect the reported amounts of assets and liabilities and disclosure of contingent assets and liabilities at the date of the financial statements and the reported amounts of revenues and expenses during the reporting periods. Actual results could differ from those estimates.
| (2) | Investment Advisory Agreements |
The Company has management contracts with Hennessy Funds Trust, under which it provides investment advisory services to all classes of the 14 Hennessy Funds.
The management contracts must be renewed annually (except in limited circumstances) by (i) the Funds’ Board of Trustees or by the vote of a majority of the outstanding shares of the applicable Hennessy Fund and (ii) by the vote of a majority of the trustees of Hennessy Funds Trust who are not interested persons of the Hennessy Funds (the “disinterested trustees”). If the management contracts are not renewed annually as described above, they will terminate automatically. There are two additional circumstances in which the management contracts would terminate. First, the management contracts would automatically terminate if the Company assigned them to another advisor (assignment includes “indirect assignment,” which is the transfer of the Company’s common stock in sufficient quantities deemed to constitute a controlling block). Second, each management contract may be terminated prior to its expiration upon 60 days’ notice by either the Company or the applicable Hennessy Fund.
65
Table of Contents
As provided in the management contracts with the 14 Hennessy Funds, the Company receives investment advisory fees monthly based on a percentage of the respective fund’s average daily net assets.
The Company has entered into sub-advisory agreements for the Hennessy Focus Fund, the Hennessy Equity and Income Fund, the Hennessy Japan Fund, and the Hennessy Japan Small Cap Fund. Under each of these sub-advisory agreements, the sub-advisor is responsible for the investment and re-investment of the assets of the applicable Hennessy Fund in accordance with the terms of such agreement and the applicable Hennessy Fund’s Prospectus and Statement of Additional Information. The sub-advisors are subject to the direction, supervision, and control of the Company and the Funds’ Board of Trustees. The sub-advisory agreements must be renewed annually in the same manner as, and are subject to the same termination provisions as, the management contracts.
In exchange for the sub-advisory services, the Company (not the Hennessy Funds) pays sub-advisor fees to the sub-advisors based on the amount of each applicable Hennessy Fund’s average daily net assets.
| (3) | Fair Value Measurement |
The Company applies the FASB standard “Fair Value Measurements” for all financial assets and liabilities, which establishes a framework for measuring fair value and expands disclosures about fair value measurements. The standard defines fair value as “the price that would be received to sell an asset or paid to transfer a liability in an orderly transaction between market participants at the measurement date.” It also establishes a fair value hierarchy consisting of the following three “levels” that prioritize the inputs to the valuation techniques used to measure fair value:
| • | Level 1 – Unadjusted, quoted prices in active markets for identical assets or liabilities that an entity has the ability to access at the measurement date. |
| • | Level 2 – Other significant observable inputs (including, but not limited to, quoted prices in active markets for similar assets or liabilities, quoted prices in markets that are not active for identical or similar assets or liabilities, and model-derived valuations in which all significant inputs and significant value drivers are observable in active markets). |
| • | Level 3 – Significant unobservable inputs (including the entity’s own assumptions about what market participants would use to price the asset or liability based on the best available information) when observable inputs are not available. |
66
Table of Contents
Based on the definitions, the following table represents the Company’s assets categorized in the Level 1 to 3 hierarchies as of the end of fiscal years 2017, 2016, and 2015:
| Fair Value Measurements at September 30, 2017 | ||||||||||||||||
| (In thousands) | ||||||||||||||||
| Level 1 | Level 2 | Level 3 | Total | |||||||||||||
| Money market fund deposits |
$ | 13,832 | $ | — | $ | — | $ | 13,832 | ||||||||
| Mutual fund investments |
8 | — | — | 8 | ||||||||||||
|
|
|
|
|
|
|
|
|
|||||||||
| Total |
$ | 13,840 | $ | — | $ | — | $ | 13,840 | ||||||||
|
|
|
|
|
|
|
|
|
|||||||||
| Amounts included in: |
||||||||||||||||
| Cash and cash equivalents |
$ | 13,832 | $ | — | $ | — | $ | 13,832 | ||||||||
| Investments in marketable securities |
8 | — | — | 8 | ||||||||||||
|
|
|
|
|
|
|
|
|
|||||||||
|
|
|
|
|
|
|
|
|
|||||||||
| Total |
$ | 13,840 | $ | — | $ | — | $ | 13,840 | ||||||||
|
|
|
|
|
|
|
|
|
|||||||||
| Fair Value Measurements at September 30, 2016 | ||||||||||||||||
| (In thousands) | ||||||||||||||||
| Level 1 | Level 2 | Level 3 | Total | |||||||||||||
| Money market fund deposits |
$ | 320 | $ | — | $ | — | $ | 320 | ||||||||
| Mutual fund investments |
8 | — | — | 8 | ||||||||||||
|
|
|
|
|
|
|
|
|
|||||||||
| Total |
$ | 328 | $ | — | $ | — | $ | 328 | ||||||||
|
|
|
|
|
|
|
|
|
|||||||||
| Amounts included in: |
||||||||||||||||
| Cash and cash equivalents |
$ | 320 | $ | — | $ | — | $ | 320 | ||||||||
| Investments in marketable securities |
8 | — | — | 8 | ||||||||||||
|
|
|
|
|
|
|
|
|
|||||||||
| Total |
$ | 328 | $ | — | $ | — | $ | 328 | ||||||||
|
|
|
|
|
|
|
|
|
|||||||||
| Fair Value Measurements at September 30, 2015 | ||||||||||||||||
| (In thousands) | ||||||||||||||||
| Level 1 | Level 2 | Level 3 | Total | |||||||||||||
| Money market fund deposits |
$ | 1,592 | $ | — | $ | — | $ | 1,592 | ||||||||
| Mutual fund investments |
7 | — | — | 7 | ||||||||||||
|
|
|
|
|
|
|
|
|
|||||||||
| Total |
$ | 1,599 | $ | — | $ | — | $ | 1,599 | ||||||||
|
|
|
|
|
|
|
|
|
|||||||||
| Amounts included in: |
||||||||||||||||
| Cash and cash equivalents |
$ | 1,592 | $ | — | $ | — | $ | 1,592 | ||||||||
| Investments in marketable securities |
7 | — | — | 7 | ||||||||||||
|
|
|
|
|
|
|
|
|
|||||||||
| Total |
$ | 1,599 | $ | — | $ | — | $ | 1,599 | ||||||||
|
|
|
|
|
|
|
|
|
|||||||||
There were no transfers between levels during any of such fiscal years.
67
Table of Contents
| (4) | Investments |
The cost, gross unrealized gains, gross unrealized losses, and fair market value of the Company’s trading investments at the end of fiscal years 2017, 2016, and 2015 was as follows:
| Cost | Gross Unrealized Gains |
Gross Unrealized Losses |
Total | |||||||||||||
| (In thousands) | ||||||||||||||||
| 2017 |
||||||||||||||||
| Mutual fund investments |
$ | 4 | $ | 18 | $ | (14 | ) | $ | 8 | |||||||
|
|
|
|
|
|
|
|
|
|||||||||
| Total |
4 | 18 | (14 | ) | 8 | |||||||||||
|
|
|
|
|
|
|
|
|
|||||||||
| 2016 |
||||||||||||||||
| Mutual fund investments |
$ | 4 | $ | 18 | $ | (14 | ) | $ | 8 | |||||||
|
|
|
|
|
|
|
|
|
|||||||||
| Total |
4 | 18 | (14 | ) | 8 | |||||||||||
|
|
|
|
|
|
|
|
|
|||||||||
| 2015 |
||||||||||||||||
| Mutual fund investments |
4 | 16 | (13 | ) | 7 | |||||||||||
|
|
|
|
|
|
|
|
|
|||||||||
| Total |
$ | 4 | $ | 16 | $ | (13 | ) | $ | 7 | |||||||
|
|
|
|
|
|
|
|
|
|||||||||
The mutual fund investments are included as a separate line item in current assets on the Company’s balance sheets.
| (5) | Property and Equipment |
Property and equipment were comprised of the following for fiscal years 2017 and 2016:
| September 30, | ||||||||
| 2017 | 2016 | |||||||
| (In thousands) | ||||||||
| Equipment |
$ | 214 | $ | 343 | ||||
| Leasehold improvements |
123 | 123 | ||||||
| Furniture and fixtures |
371 | 349 | ||||||
| IT Infrastructure |
61 | 61 | ||||||
| Software |
407 | 360 | ||||||
|
|
|
|
|
|||||
| 1,176 | 1,236 | |||||||
| Less: accumulated depreciation |
(922 | ) | (940 | ) | ||||
|
|
|
|
|
|||||
| $ | 254 | $ | 296 | |||||
|
|
|
|
|
|||||
During fiscal years 2017 and 2016, depreciation expense was $0.22 million and $0.21 million, respectively.
68
Table of Contents
| (6) | Management Contracts |
The costs related to the Company’s purchase of assets related to management contracts are capitalized as incurred. The management contract asset was $74.6 million as of the end of fiscal year 2017, compared to $74.4 million at the end of fiscal year 2016. The costs are defined as an “intangible asset” per FASB standard “Intangibles – Goodwill and Other.” The management contract purchase costs include legal fees, shareholder vote fees and percent of asset costs to purchase the assets related to management contracts.
| (7) | Bank Loan |
The Company has an outstanding bank loan with U.S. Bank National Association (“U.S. Bank”), as administrative agent and as a lender, and California Bank & Trust, as syndication agent and as a lender, which replaced and refinanced the bank loan previously entered into by the Company and U.S. Bank on October 26, 2012, and amended on November 1, 2013. Immediately prior to September 17, 2015, the Company’s bank loan with U.S. Bank had an outstanding principal balance of $23.0 million. On September 17, 2015, in anticipation of the repurchase of up to 1,000,000 shares of the Company’s common stock at $25 per share pursuant to its self-tender offer, the Company entered into a new term loan agreement to fund in part its self-tender offer, thereby increasing its total loan balance to $35.0 million (consisting of a $20.0 million promissory note to U.S. Bank and a $15.0 million promissory note to California Bank & Trust). Then, on September 19, 2016, the Company entered into an amendment to its term loan agreement with U.S. Bank and California Bank & Trust to allow it to consummate the purchase of assets related to the management of the Westport Fund and the Westport Select Cap Fund. In addition, the amendment revised one of the financial covenants in the term loan agreement.
The current term loan agreement requires 48 monthly payments of $364,583 plus interest based on, at our option:
(1) LIBOR plus a margin that ranges from 2.75% to 3.25%, depending on the Company’s ratio of consolidated debt to consolidated earnings before interest, taxes, depreciation and amortization (excluding, among other things, certain non-cash gains and losses) (“EBITDA”), or
(2) the sum of (a) the highest of the prime rate set by U.S. Bank from time to time, the Federal Funds Rate plus 0.50%, or one-month LIBOR plus 1.00%, and (b) a margin that ranges from 0.25% to 0.75%, depending on the Company’s ratio of consolidated debt to consolidated EBITDA.
From the effective date of the current term loan agreement through February 29, 2016, the interest rate in effect was U.S. Bank’s prime rate plus a margin based on the Company’s ratio of consolidated debt to consolidated EBITDA. Effective March 1, 2016, the Company converted $32.8 million of its principal loan balance to a one-month LIBOR contract, which has been renewed each subsequent month. As of September 30, 2017, the effective rate is 4.237%, which is comprised of the LIBOR rate of 1.237% as of September 1, 2017, plus a margin of 3.0% based on the Company’s ratio of consolidated debt to consolidated EBITDA as of June 30, 2017. The Company intends to renew the one-month LIBOR contract on a monthly basis provided that the LIBOR-based interest rate remains favorable to the prime rate-based interest rate.
69
Table of Contents
All borrowings under the term loan agreement are secured by substantially all of the Company’s assets. The final installment of the then-outstanding principal and interest is due September 17, 2019. The note maturity schedule is as follows:
| Years ended September 30: |
||||
| (In thousands) | ||||
| 2018 |
$ | 4,375 | ||
| 2019 |
21,875 | |||
|
|
|
|||
| Total |
$ | 26,250 | ||
|
|
|
|||
The previous amended loan agreement included, and the current term loan agreement includes, certain reporting requirements and loan covenants requiring the maintenance of specified financial ratios. The Company was in compliance for fiscal years 2017, 2016, and 2015.
The Company did an evaluation of the debt modification and determined that the portion of the loan refinanced with the same creditor (the $20.0 million with U.S. Bank) is not considered “substantially different” from the original loan with U.S. Bank per the conditions set forth in ASC 470-50 — Debt; Modifications and Extinguishments. Furthermore, due to the variable nature of the interest rate, this feature of the loan was examined for potential bifurcation as an embedded derivative, and it was determined that the feature does not require bifurcation from the host contract.
In connection with securing the financings discussed above, the Company incurred loan costs in the amount of $0.41 million. These costs were reclassified to offset debt liability per ASU 2015-03 as of March 31, 2017, and the balance is being amortized on a straight-line basis, which approximates the effective interest basis, over 48 months. Amortization expense during for fiscal years 2017, 2016, and 2015 was $0.1 million for each period. The unamortized balance of the loan fees was $0.3 million as of September 30, 2017. The following is a reconciliation of the reclassification:
| Gross Debt at September 30, 2017 |
Debt Issuance Cost |
Debt, Net of Discount, September 30, 2017 |
||||||||||
| (In thousands) | ||||||||||||
| Current portion of debt |
$ | 4,375 | $ | (147 | ) | $ | 4,228 | |||||
| Long-term portion of debt |
21,875 | (147 | ) | 21,728 | ||||||||
|
|
|
|
|
|
|
|||||||
| Total Debt |
$ | 26,250 | $ | (294 | ) | $ | 25,956 | |||||
|
|
|
|
|
|
|
|||||||
| Gross Debt at September 30, 2016 |
Debt Issuance Cost |
Debt, Net of Discount, at September 30, 2016 |
||||||||||
| (In thousands) | ||||||||||||
| Current portion of debt |
$ | 4,375 | $ | (147 | ) | $ | 4,228 | |||||
| Long-term portion of debt |
26,250 | (294 | ) | 25,956 | ||||||||
|
|
|
|
|
|
|
|||||||
| Total Debt |
$ | 30,625 | $ | (441 | ) | $ | 30,184 | |||||
|
|
|
|
|
|
|
|||||||
70
Table of Contents
| (8) | Income Taxes |
As of both September 30, 2017 and 2016, the Company’s gross liability for unrecognized tax benefits related to uncertain tax positions was $0.35 million and $0.5 million, respectively, of which $0.2 million and $0.3 million would decrease the Company’s effective income tax rate if the tax benefits were recognized. The Company has recognized $0.14 million of the gross liability due to finalization of state regulations. A reconciliation of the activity related to the liability for gross unrecognized tax benefits during fiscal year 2017 are as follows:
| 2017 | ||||
| (In thousands) | ||||
| Beginning year balance |
$ | 493 | ||
| Decrease related to prior year tax positions |
(140 | ) | ||
| Increase related to current year tax positions |
— | |||
| Settlements |
— | |||
| Lapse of statutes of limitations |
— | |||
|
|
|
|||
| Ending year balance |
$ | 353 | ||
|
|
|
|||
The Company’s net liability for accrued interest and penalties was $0.14 million as of September 30, 2017. The Company has elected to recognize interest and penalties related to unrecognized tax benefits as a component of income tax expense.
The total amount of unrecognized tax benefits can change due to final regulations, audit settlements, tax examinations activities, lapse of applicable statutes of limitations and the recognition and measurement criteria under the guidance related to accounting for uncertainly in income taxes. The Company is unable to estimate what this change could be within the next 12 months, but does not believe it would be material to its financial statements.
Income tax expense was comprised of the following for fiscal years 2017, 2016, and 2015:
| 2017 | 2016 | 2015 | ||||||||||
| (In thousands) | ||||||||||||
| Current |
||||||||||||
| Federal |
$ | 6,088 | $ | 6,324 | $ | 5,017 | ||||||
| State |
493 | 511 | 1,089 | |||||||||
|
|
|
|
|
|
|
|||||||
| 6,581 | 6,835 | 6,106 | ||||||||||
|
|
|
|
|
|
|
|||||||
| Deferred |
||||||||||||
| Federal |
1,606 | 1,539 | 1,444 | |||||||||
| State |
120 | (181 | ) | (136 | ) | |||||||
|
|
|
|
|
|
|
|||||||
| 1,726 | 1,358 | 1,308 | ||||||||||
|
|
|
|
|
|
|
|||||||
| Total |
$ | 8,307 | $ | 8,193 | $ | 7,414 | ||||||
|
|
|
|
|
|
|
|||||||
71
Table of Contents
The principal reasons for the differences from the federal statutory rate are as follows:
| 2017 | 2016 | 2015 | ||||||||||
| Federal tax at statutory rate |
35.0 | % | 35.0 | % | 35.0 | % | ||||||
| True-up of prior year’s tax provision |
-0.1 | -1.8 | -2.1 | |||||||||
| State tax at statutory rate |
2.5 | 2.6 | 3.9 | |||||||||
| Permanent and other differences |
0.2 | 0.3 | 0.2 | |||||||||
| Uncertain tax position allowance |
-0.5 | 0.2 | 2.4 | |||||||||
| Amendment of prior period tax return |
-0.7 | — | — | |||||||||
| Early adoption of ASU 2016-09 |
-0.7 | — | — | |||||||||
|
|
|
|
|
|
|
|||||||
| Effective Tax Rate |
35.7 | % | 36.3 | % | 39.4 | % | ||||||
|
|
|
|
|
|
|
|||||||
The tax effects of temporary differences that give rise to significant portions of deferred tax assets and liabilities as of September 30, 2017, 2016, and 2015, are presented below:
| 2017 | 2016 | 2015 | ||||||||||
| (In thousands) | ||||||||||||
| Current deferred tax assets: |
||||||||||||
| Accrued compensation |
$ | 130 | $ | 61 | $ | 69 | ||||||
| Stock Compensation |
140 | 138 | 137 | |||||||||
| State taxes |
399 | 408 | 476 | |||||||||
| Capital loss carryforward |
10 | 10 | 11 | |||||||||
|
|
|
|
|
|
|
|||||||
| Total deferred tax assets |
679 | 617 | 693 | |||||||||
| Less: disallowed capital loss |
(10 | ) | (10 | ) | (10 | ) | ||||||
|
|
|
|
|
|
|
|||||||
| Net deferred tax assets |
669 | 607 | 683 | |||||||||
| Noncurrent deferred tax liabilities: |
||||||||||||
| Property and equipment |
(24 | ) | (50 | ) | (55 | ) | ||||||
| Management contracts |
(12,186 | ) | (10,381 | ) | (9,093 | ) | ||||||
|
|
|
|
|
|
|
|||||||
| Total deferred tax liabilities |
(12,210 | ) | (10,431 | ) | (9,148 | ) | ||||||
|
|
|
|
|
|
|
|||||||
| Net deferred tax liabilities |
$ | (11,541 | ) | $ | (9,824 | ) | $ | (8,465 | ) | |||
|
|
|
|
|
|
|
|||||||
The Company elected to early adopt ASU 2016-09 using a modified retrospective approach, effective as if adopted the first day of the fiscal year, October 1, 2016. As a result of the early adoption, income tax benefits of approximately $0.4 million were recognized. The Company has elected to continue to estimate the number of stock-based awards expected to vest, as permitted by ASU 2016-09, rather than electing to account for forfeitures as they occur. As such, this has no cumulative effect on retained earnings for the prior year. With the early adoption of ASU 2016-09, the Company has elected to present the cash flow statement on a prospective transition method and no prior periods have been adjusted.
72
Table of Contents
| (9) | Earnings Per Share |
The weighted average common shares outstanding used in the calculation of basic earnings per share and weighted average common shares outstanding, adjusted for common stock equivalents, used in the computation of diluted earnings per share were as follows for fiscal years 2017, 2016, and 2015:
| September 30, | ||||||||||||
| 2017 | 2016 | 2015 | ||||||||||
| Weighted average common stock outstanding |
7,691,937 | 7,600,583 | 8,831,094 | |||||||||
| Common stock equivalents - stock options and RSU’s |
98,590 | 117,382 | 109,940 | |||||||||
|
|
|
|
|
|
|
|||||||
| 7,790,527 | 7,717,965 | 8,941,034 | ||||||||||
|
|
|
|
|
|
|
|||||||
All common stock equivalents were dilutive and therefore included in the diluted earnings per share calculation for fiscal years 2017, 2016, and 2015.
On January 26, 2017, the Company’s Board of Directors declared a 3-for-2 stock split, which was effected on March 6, 2017, for shareholders of record as of February 10, 2017. All disclosures in this report relating to shares of common stock, restricted stock units, and per share data have been adjusted to reflect this stock split.
| (10) | Commitments and Contingencies |
The Company’s headquarters is located in leased office space under a single non-cancelable operating lease at 7250 Redwood Boulevard, Suite 200, in Novato, California. The lease expires on June 30, 2021, with one five-year extension available thereafter. The minimum future rental commitment as of September 30, 2017, is $1.8 million for the remaining term of the current and amended leases. The rent expense is $31,787 per month for the remaining term of the current and amended leases.
The Company also has office space under a single non-cancelable operating lease at 101 Federal Street, Suite 1900, Boston, Massachusetts 02110. The initial term of our lease expired on November 30, 2015, but automatically renews for successive one-year periods unless either party terminates the lease by providing at least three months’ notice of termination to the other party prior to the next renewal date. The future rental commitment under this lease, as of September 30, 2017, is $13,251 for the remaining term of the most recent automatic renewal and $79,503 for the next automatic renewal. The rent expense is $6,625 per month for the remaining term of the most recent automatic renewal.
The Company also has office space under a single non-cancelable operating lease at 1340 Environ Way, #305, Chapel Hill, North Carolina 27517. The initial term of our lease expired on November 30, 2014, but automatically renews for successive three-month periods unless either party terminates the lease by providing at least two months’ notice of termination to the other party prior to the next renewal date. The future rental commitment under this lease, as of September 30, 2017, is $3,421 for the remaining term of the most recent automatic renewal and $5,131 for the next automatic renewal. The rent expense is $1,710 per month for the remaining term of the most recent automatic renewal.
73
Table of Contents
The annual minimum future rental commitments under the foregoing leases as of September 30, 2017, are as follows:
| Fiscal Year |
||||
| (In thousands) | ||||
| 2018 |
$ | 469 | ||
| 2019 |
395 | |||
| 2020 |
382 | |||
| 2021 |
286 | |||
|
|
|
|||
| Total |
$ | 1,532 | ||
|
|
|
|||
| (11) | Retirement Plan |
The Company has a 401(k) retirement plan covering eligible employees. Employees are eligible to participate if they are over 21 years of age and have completed a minimum of 1 month of service with 80 hours in that month. The Company has also made discretionary profit sharing contributions of $180,233, $158,865, and $137,608 in fiscal years 2017, 2016, and 2015, respectively. To be eligible for the discretionary profit sharing contribution, an employee must be over 21 years of age and have completed a minimum of 6 consecutive months of service with 80 hours of service in each month.
| (12) | Concentration of Credit Risk |
The Company maintains its cash accounts with three commercial banks that, at times, may exceed federally insured limits. The amount on deposit at September 30, 2017, exceeded the insurance limits of the Federal Deposit Insurance Corporation by approximately $1.6 million. In addition, total cash and cash equivalents include $13.7 million held in the First American U.S. Government Money Market Fund that is not federally insured. The Company believes it is not exposed to any significant credit risk on cash and cash equivalents.
| (13) | Recently Issued and Adopted Accounting Standards |
In May 2014, the Financial Accounting Standards Board (FASB) issued Accounting Standards Update (ASU) No. 2014-09, Revenue from Contracts with Customers (ASU 2014-09). In addition, the FASB issued related revenue recognition guidance in five ASUs: principal versus agent considerations (ASU 2016-08), identifying performance obligations and licensing (ASU 2016-10), a revision of certain SEC staff observer comments (ASU 2016-11), implementation guidance (ASU 2016-12), and technical corrections and improvements (ASU 2016-20). ASU 2014-09 is a comprehensive new revenue recognition standard that supersedes nearly all revenue recognition guidance under GAAP, provides enhancements to the quality and consistency of how revenue is reported, and improves comparability in financial statements presented under GAAP and International Financial Reporting Standards. This new standard is effective for fiscal years and interim periods within those years beginning after December 15, 2017 (our fiscal year 2019). The adoption of this standard is not expected to have a material impact on our financial condition, results of operations, or cash flows.
74
Table of Contents
In August 2015, the FASB issued ASU No. 2015-15, “Interest-Imputation of Interest (Subtopic 835-30): Presentation and Subsequent Measurement of Debt Issuance Cost Associated with Line-of-Credit Arrangements,” which simplifies the presentation of debt issuance costs. Under the new guidance, debt issuance costs related to term loans should be presented as a direct deduction from the carrying amount of the associated debt liability. This new standard is effective for annual reporting periods, and interim periods within those reporting periods, beginning after December 15, 2015 (our fiscal year 2017). The impact of adopting ASU 2015-15 on our financial statements was the classification of all deferred financing costs as a deduction to the corresponding debt in addition to the reclassification of deferred financing costs in other current and long-term assets to short and long-term notes payable as of September 30, 2016, within the balance sheets to conform to the new presentation. Other than these reclassifications and additional disclosures, the adoption of ASU 2015-15 did not have a material impact on our financial statements.
In November 2015, the FASB issued ASU No. 2015-17 “Balance Sheet Classifications of Deferred Taxes.” The standard simplifies the presentation of deferred income taxes under U.S. GAAP by requiring that all deferred tax assets and liabilities be classified as non-current. This new standard is effective for annual reporting periods, and interim periods within those reporting periods, beginning after December 15, 2016 (our fiscal year 2018). The adoption of this standard is not expected to have a material impact on our financial condition, results of operations or cash flows.
In February 2016, the FASB issued ASU No. 2016-02, “Leases (Topic 842).” The amendments under this pronouncement will change the way all leases with duration of one year of more are treated. Under this guidance, lessees will be required to capitalize virtually all leases on the balance sheet as a right-of-use asset and an associated financing lease liability or capital lease liability. This update is effective for annual reporting periods, and interim periods within those reporting periods, beginning after December 15, 2018 (our fiscal year 2020). We are currently evaluating the impact this standard will have on our policies and procedures pertaining to our existing and future lease arrangements, disclosure requirements and on our financial statements.
In March 2016, the FASB issued ASU No. 2016-09 “Compensation—Stock Compensation (Topic 718): Improvements to Employee Share-Based Payment Accounting.” The standard simplifies several aspects of the accounting for share-based payment award transactions, including (1) income tax consequences, (2) classification of awards as either equity or liabilities, and (3) classification on the statement of cash flows. This new standard is effective for annual reporting periods, and interim periods within those reporting periods, beginning after December 15, 2016 (our fiscal year 2018). Early adoption is permitted for any interim or annual period. The changes in the new standard eliminate the recognition of excess tax benefits or tax deficiencies from the statement of stockholders’ equity. Under the new guidance, all excess tax benefits and tax deficiencies resulting from stock-based compensation awards vesting and exercises are recognized prospectively within income tax expense, and excess tax benefits are recognized regardless of whether they reduce current taxes payable. This will increase the volatility of our effective tax rate. As of March 31, 2017, we elected to early adopt ASU 2016-09, using a modified retrospective approach, effective as if adopted the first day of the fiscal year, October 1, 2016. As a result of early adoption of ASU 2016-09, income tax benefits of approximately $0.004 million and $0.2 million were recognized as discrete events in the quarterly periods ended March 31, 2017, and December 31, 2016, respectively. We have elected to continue to estimate the number of stock-based awards expected to vest, as permitted by ASU 2016-09, rather than electing to account for forfeitures as they occur. As such, this has no cumulative effect on retained earnings for the prior year. With the early adoption of 2016-09, we have elected to present the cash flow statement on a prospective transition method and no prior periods have been adjusted.
In August 2016, the FASB issued ASU 2016-15, “Statement of Cash Flows (Topic 230), a consensus of the FASB’s Emerging Issues Task Force,” which provides guidance intended to reduce diversity in practice in how certain transactions are classified in the statement of cash flows. This ASU is effective for annual reporting periods, and interim periods within those reporting periods, beginning after December 15, 2016 (our fiscal year 2018). The adoption of this standard is not expected to have a material impact on our financial condition, results of operations, or cash flows.
75
Table of Contents
In January 2017, the FASB issued ASU No. 2017-01 “Business Combinations (Topic 805): Clarifying the Definition of a Business.” Based on feedback that the definition of business is being applied too broadly, the update adds guidance to assist entities with evaluating whether transactions should be accounted for as acquisitions (or disposals) of assets or businesses. This new standard is effective for annual reporting periods, and interim periods within those reporting periods, beginning after December 15, 2017 (our fiscal year 2019). The adoption of this standard is not expected to have a material impact on our financial condition, results of operations, or cash flows.
In May 2017, the FASB issued an update to ASU No. 2017-09 “Compensation—Stock Compensation (Topic 718): Scope of Modification Accounting.” The update was issued to provide clarity and reduce both (1) diversity in practice and (2) cost and complexity when applying the guidance in Topic 718. This update is effective for annual reporting periods, and interim periods within those reporting periods, beginning after December 15, 2017 (our fiscal year 2019). It is not expected to have a material impact on our financial condition, results of operations, or cash flows.
There have been no other significant changes in the Company’s critical accounting policies and estimates during fiscal year 2017.
76
Table of Contents
| (14) | Quarterly Financial Data Schedule (Unaudited) |
| Hennessy Advisors. Inc. | ||||||||||||||||||||
| Quarterly Financial Data | ||||||||||||||||||||
| (In thousands, except per share amounts) | ||||||||||||||||||||
| Year Ended September 30, 2017 | ||||||||||||||||||||
| 12/31/16 | 3/31/17 | 6/30/17 | 9/30/17 | Fiscal Year | ||||||||||||||||
| Revenue |
$ | 13,294 | $ | 13,236 | $ | 13,178 | $ | 13,247 | $ | 52,955 | ||||||||||
| Operating expense |
7,052 | 7,125 | 6,908 | 7,524 | 28,609 | |||||||||||||||
|
|
|
|
|
|
|
|
|
|
|
|||||||||||
| Operating income |
6,242 | 6,111 | 6,270 | 5,723 | 24,346 | |||||||||||||||
|
|
|
|
|
|
|
|
|
|
|
|||||||||||
| Interest Expense |
266 | 278 | 281 | 284 | 1,109 | |||||||||||||||
| Other (income) expense, net |
— | — | (3 | ) | (9 | ) | (12 | ) | ||||||||||||
|
|
|
|
|
|
|
|
|
|
|
|||||||||||
| Income before income tax expense |
5,976 | 5,833 | 5,992 | 5,448 | 23,249 | |||||||||||||||
|
|
|
|
|
|
|
|
|
|
|
|||||||||||
| Income tax expense |
1,980 | 2,205 | 2,032 | 2,090 | 8,307 | |||||||||||||||
|
|
|
|
|
|
|
|
|
|
|
|||||||||||
| Net Income |
3,996 | 3,628 | 3,960 | 3,358 | 14,942 | |||||||||||||||
|
|
|
|
|
|
|
|
|
|
|
|||||||||||
| Earnings per share: |
||||||||||||||||||||
| Basic |
$ | 0.52 | $ | 0.47 | $ | 0.51 | $ | 0.44 | $ | 1.94 | ||||||||||
| Diluted |
0.52 | 0.47 | 0.51 | 0.42 | 1.92 | |||||||||||||||
| Year Ended September 30, 2016 | ||||||||||||||||||||
| 12/31/15 | 3/31/16 | 6/30/16 | 9/30/16 | Fiscal Year | ||||||||||||||||
| Revenue |
$ | 13,153 | $ | 12,192 | $ | 12,995 | $ | 13,070 | $ | 51,410 | ||||||||||
| Operating expense |
6,892 | 6,740 | 6,862 | 7,126 | 27,620 | |||||||||||||||
|
|
|
|
|
|
|
|
|
|
|
|||||||||||
| Operating income |
6,261 | 5,452 | 6,133 | 5,944 | 23,790 | |||||||||||||||
|
|
|
|
|
|
|
|
|
|
|
|||||||||||
| Interest Expense |
361 | 309 | 279 | 283 | 1,232 | |||||||||||||||
| Other (income) expense, net |
— | (1 | ) | (1 | ) | — | (2 | ) | ||||||||||||
|
|
|
|
|
|
|
|
|
|
|
|||||||||||
| Income before income tax expense |
5,900 | 5,144 | 5,855 | 5,661 | 22,560 | |||||||||||||||
|
|
|
|
|
|
|
|
|
|
|
|||||||||||
| Income tax expense |
2,250 | 1,861 | 1,961 | 2,121 | 8,193 | |||||||||||||||
|
|
|
|
|
|
|
|
|
|
|
|||||||||||
| Net Income |
3,650 | 3,283 | 3,894 | 3,540 | 14,367 | |||||||||||||||
|
|
|
|
|
|
|
|
|
|
|
|||||||||||
| Earnings per share: |
||||||||||||||||||||
| Basic |
$ | 0.48 | $ | 0.43 | $ | 0.51 | $ | 0.47 | $ | 1.89 | ||||||||||
| Diluted |
0.48 | 0.43 | 0.50 | 0.45 | 1.86 | |||||||||||||||
| (15) | Pending Asset Purchase of the Rainier U.S. Funds |
On May 11, 2017, the Company announced that it signed a definitive agreement with Manning & Napier Group, LLC and Rainier Investment Management, LLC to purchase the assets related to the management of three Rainier Funds, including the Rainier Mid Cap Equity Fund, the Rainier Small/Mid Cap Equity Fund, and the Rainier Large Cap Equity Fund (collectively, the “Rainier U.S. Funds”). The Company filed a Current Report on Form 8-K regarding this transaction on each of May 11, 2017, and September 27, 2017.
The definitive agreement includes customary representations, warranties and covenants of the Company and Rainier Investment Management, LLC, and provides for a payment upon closing based on the net assets of the Rainier U.S. Funds at the close of business on the trading day immediately preceding the closing date (yet to be determined).
77
Table of Contents
Upon completion of the transaction, which is subject to the approval of the shareholders of the Rainier Funds, the assets related to the Rainier Large Cap Equity Fund will merge into the Hennessy Cornerstone Large Growth Fund and the assets related to the Rainier Mid Cap Equity Fund and the Rainier Small/Mid Cap Equity Fund will merge into the Hennessy Cornerstone Mid Cap 30 Fund. The transaction is subject to customary closing conditions, including the approval of the Rainier U.S. Funds’ shareholders.
| (16) | Subsequent Events |
As of the file date of December 4, 2017, management evaluated the existence of events occurring subsequent to the fiscal year end of September 30, 2017, and determined the following to be subsequent events:
On October 31, 2017, the Company announced an additional cash dividend of $0.075 per share to be paid on December 8, 2017, to shareholders of record as of November 15, 2017. The declaration and payment of dividends to holders of our common stock by us, if any, are subject to the discretion of our Board of Directors. Our Board of Directors will take into account such matters as general economic and business conditions, our strategic plans, our financial results and condition, contractual, legal and regulatory restrictions on the payment of dividends by us, and such other factors as our Board of Directors may consider relevant.
On November 16, 2017, we entered into an amendment to our term loan agreement with U.S. Bank and California Bank & Trust to revise the excess cash flow prepayment requirements.
On November 30, 2017, we entered into an amendment to our term loan agreement with U.S. Bank and California Bank & Trust to allow us to consummate the purchase of assets related to the management of the Rainier U.S. Funds.
On December 1, 2017, the Company purchased the assets related to the management of the Rainier Large Cap Equity Fund and the Rainier Mid Cap Equity Fund, adding approximately $122 million in assets under management. The purchase was consummated in accordance with the terms and conditions of that certain Transaction Agreement, dated as of May 11, 2017, as amended, between the Company and Manning & Napier Group, LLC and Rainier Investment Management, LLC. The purchase price of $1.0 million was funded with available cash and was based on the total net assets under management of the Rainier Large Cap Equity Fund and the Rainier Mid Cap Equity Fund as measured at the close of business on November 30, 2017. The shareholder meeting for the Rainier Small/Mid Cap Equity Fund has been adjourned to December 26, 2017.
| ITEM 9. | CHANGES IN AND DISAGREEMENTS WITH ACCOUNTANTS ON ACCOUNTING AND FINANCIAL DISCLOSURE |
None.
| ITEM 9A. | CONTROLS AND PROCEDURES |
MANAGEMENT’S ANNUAL REPORT ON INTERNAL CONTROL OVER FINANCIAL REPORTING
Management’s report on internal control over financial reporting set forth in Item 8, “Financial Statements and Supplementary Data,” above, is incorporated herein by reference.
78
Table of Contents
ATTESTATION REPORT OF INDEPENDENT REGISTERED PUBLIC ACCOUNTING FIRM
The attestation report of our independent registered public accounting firm regarding internal control over financial reporting set forth in Item 8, “Financial Statements and Supplementary Data,” above, is incorporated herein by reference.
EVALUATION OF DISCLOSURE CONTROLS AND PROCEDURES
Under the supervision and with the participation of our management, including our principal executive officer and principal financial officer, we conducted an evaluation of our disclosure controls and procedures, as such term is defined under Rule 13a-15(e) and 15d-15(e) of the Securities Exchange Act of 1934, as amended, as of the end of the period covered by this report. Based on such evaluation, our principal executive officer and principal financial officer have concluded that our disclosure controls and procedures as of September 30, 2017, were effective to provide reasonable assurance that the information required to be disclosed by us in reports filed under the Securities Exchange Act of 1934 is (1) recorded, processed, summarized, and reported within the time periods specified in the rules and forms of the SEC, and (2) accumulated and communicated to management, including the principal executive and principal financial officers, as appropriate, to allow timely decisions regarding required disclosure.
CHANGES IN INTERNAL CONTROLS
There have been no changes in internal control over financial reporting as defined in Rules 13a-15(f) under the Securities Exchange Act of 1934 that occurred during the fiscal quarter ended September 30, 2017, that have materially affected, or are reasonably likely to materially affect, our internal control over financial reporting.
| ITEM 9B. | OTHER INFORMATION |
None.
| ITEM 10. | DIRECTORS, EXECUTIVE OFFICERS, AND CORPORATE GOVERNANCE |
Information regarding our executive officers and directors, Section 16 compliance, and the members of the Audit Committee and the Audit Committee financial expert can be found in our Proxy Statement for our 2018 Annual Meeting (“Proxy Statement”) under the captions “Election of Directors,” “Corporate Governance” and “Executive Officers,” respectively. Such information is incorporated by reference as if fully set forth herein.
CODE OF ETHICS
The Company has adopted a Code of Ethics that applies to its principal executive officer, principal financial officer, executive vice presidents, directors, and all employees. The code has been designed in accordance with the Sarbanes-Oxley Act of 2002 to promote honest and ethical conduct. The code also applies to Hennessy Funds Trust. The Code of Ethics is posted on our website at www.hennessyadvisors.com. In the event the Company amends or waives any of the provisions of the Code of Ethics, the Company intends to disclose these actions on its website. We are not including the information contained on our website as part of, or incorporating it by reference into, this report.
79
Table of Contents
Any person may obtain a copy of the Hennessy Advisors, Inc. Code of Ethics, at no cost, by forwarding a written request to:
Hennessy Advisors, Inc.
7250 Redwood Blvd., Suite 200
Novato, CA 94945
Attention: Teresa Nilsen
| ITEM 11. | EXECUTIVE COMPENSATION |
Information regarding compensation committee interlocks and compensation we paid to our directors and our “named executive officers” during our most recent fiscal year can be found in the Proxy Statement under the captions “Compensation Committee Interlocks and Insider Participation,” “Compensation Committee Report,” “Compensation Discussion and Analysis,” and “Compensation of Executive Officers and Directors.” Such information is incorporated by reference as if fully set forth herein.
| ITEM 12. | SECURITY OWNERSHIP OF CERTAIN BENEFICIAL OWNERS AND MANAGEMENT AND RELATED STOCKHOLDER MATTERS |
SECURITY OWNERSHIP OF CERTAIN BENEFICIAL OWNERS AND MANAGEMENT
Information regarding our principal securities holders and the security holdings of our directors and executive officers can be found in the Proxy Statement under the caption “Voting Securities.” Such information is incorporated by reference as if fully set forth herein.
EQUITY COMPENSATION PLAN INFORMATION
The following table sets forth information as of September 30, 2017, with respect to our equity compensation plans pursuant to which shares of our common stock may be issued. We do not have any equity compensation plans that have not been approved by our shareholders:
| Number of securities to be issued upon exercise of outstanding options, warrants and rights (2) |
Weighted-average exercise price of outstanding options, warrants and rights (2) |
Number of securities remaining for issuance under compensation plans (excluding securities reflected in column (a)) (1) |
||||||||||
| Plan Category |
(a) | (b) | (c) | |||||||||
| Equity compensation plans approved by security holders |
395,313 | $ | 0.00 | 1,879,401 | ||||||||
| Equity compensation plans not approved by security holders |
0 | 0 | 0 | |||||||||
|
|
|
|
|
|
|
|||||||
| Total |
395,313 | $ | 0.00 | 1,879,401 | ||||||||
|
|
|
|
|
|
|
|||||||
| (1) | The maximum number of shares of common stock that may be issued under the Omnibus Plan is 50% of our outstanding common stock, or 3,888,282 shares, as of fiscal year 2017. |
| (2) | The number of securities to be issued includes 395,313 shares relating to RSUs to be issued according to the vesting schedule of 25% per year. The exercise price for RSUs is zero, which is included in the weighted average exercise price of outstanding securities. |
80
Table of Contents
| ITEM 13. | CERTAIN RELATIONSHIPS AND RELATED TRANSACTIONS AND DIRECTOR INDEPENDENCE |
Information regarding the Company’s related person transactions, related person transactions policy, and director independence can be found in the Proxy Statement under the caption “Corporate Governance.” Such information is incorporated by reference as if fully set forth herein.
| ITEM 14. | PRINCIPAL ACCOUNTING FEES AND SERVICES |
Information regarding the fees billed to the Company by Marcum LLP for professional services can be found in the Proxy Statement under the caption “Independent Registered Public Accounting Firm.” Such information is incorporated by reference as if fully set forth herein.
| ITEM 15. | EXHIBITS AND FINANCIAL STATEMENT SCHEDULES |
The financial statements and financial statement schedules for Hennessy Advisors, Inc. are included under Item 8, “Financial Statements and Supplementary Data,” above.
Exhibit Index
Set forth below is a listing of all exhibits to this Annual Report on Form 10-K, including those incorporated by reference.
Exhibits
81
Table of Contents
82
Table of Contents
Notes:
| * | The related schedules to the agreement are not being filed herewith. The registrant agrees to furnish supplementally a copy of any such schedules to the Securities and Exchange Commission upon request. |
| (1) | Management contract or compensatory plan or arrangement. |
| (2) | Incorporated by reference from the Company’s Form SB-2 registration statement (SEC File No. 333-66970) filed August 6, 2001. |
| (3) | Incorporated by reference from the Company’s Form 10-K for the fiscal year ended September 30, 2009 (SEC File No. 000-49872), filed December 4, 2009. |
| (4) | Incorporated by reference from the Company’s Form 10-Q for the quarter ended December 31, 2012 (SEC File No. 000-49872), filed January 17, 2013. |
| (5) | Incorporated by reference from the Company’s Current Report on Form 8-K (SEC File No. 000-49872) filed September 18, 2013. |
| (6) | Incorporated by reference to Annex A of the Company’s definitive proxy statement on Schedule 14A for the Company’s Special Meeting of Shareholders held on March 26, 2015 (SEC File No. 000-49872), filed February 21, 2014. |
| (7) | Incorporated by reference from the Company’s Form 10-Q for the quarter ended June 30, 2014 (SEC File No. 001-36423), filed August 6, 2014. |
| (8) | Incorporated by reference from the Company’s Current Report on Form 8-K (SEC File No. 001-36423) filed September 23, 2015. |
| (9) | Incorporated by reference from the Company’s Current Report on Form 8-K (SEC File No. 001-36423) filed November 2, 2015. |
83
Table of Contents
| (10) | Incorporated by reference from the Company’s Form 10-K for the fiscal year ended September 30, 2015 (SEC File No. 001-36423), filed November 30, 2015. |
| (11) | Incorporated by reference from the Company’s Current Report on Form 8-K (SEC File No. 001-36423) filed May 3, 2016. |
| (12) | Incorporated by reference from the Company’s Current Report on Form 8-K (SEC File No. 001-36423) filed September 23, 2016. |
| (13) | Incorporated by reference from the Company’s Current Report on Form 8-K (SEC File No. 001-36423) filed October 13, 2016. |
| (14) | Incorporated by reference from the Company’s Form 10-K for the fiscal year ended September 30, 2016 (SEC File No. 001-36423), filed December 1, 2016. |
| (15) | Incorporated by reference from the Company’s Current Report on Form 8-K (SEC File No. 001-36423) filed March 7, 2017. |
| (16) | Incorporated by reference from the Company’s Current Report on Form 8-K (SEC File No. 001-36423) filed May 11, 2017. |
| (17) | Incorporated by reference from the Company’s Current Report on Form 8-K (SEC File No. 001-36423) filed November 20, 2017. |
| (18) | Incorporated by reference from the Company’s Current Report on Form 8-K (SEC File No. 001-36423) filed December 4, 2017. |
| ITEM 16. | FORM 10-K SUMMARY |
None.
84
Table of Contents
Pursuant to the requirements of Section 13 or 15(d) of the Securities Exchange Act of 1934, the Registrant has duly caused this report to be signed on its behalf by the undersigned, thereunto duly authorized:
Hennessy Advisors, Inc.
(Registrant)
| By: | /s/ Neil J. Hennessy Neil J. Hennessy Chief Executive Officer and President (As a duly authorized Officer on behalf of the Registrant and as Principal Executive Officer and Chairman of the Board of Directors) |
Dated: December 4, 2017 |
Pursuant to the requirements of the Securities Exchange Act of 1934, this report has been signed below by the following persons on behalf of the registrant and in the capacities and on the dates indicated:
| By: | /s/ Teresa M. Nilsen Teresa M. Nilsen Chief Financial Officer, Secretary and Director (Principal Financial and Accounting Officer) |
Dated: December 4, 2017 | ||||
| By: | /s/ Daniel B. Steadman Daniel B. Steadman Executive Vice President and Director |
Dated: December 4, 2017 | ||||
| By: | /s/ Kathryn R. Fahy Kathryn R. Fahy Director of Finance |
Dated: December 4, 2017 | ||||
| By: | /s/ Henry Hansel Henry Hansel Director |
Dated: December 4, 2017 | ||||
| By: | /s/ Brian A. Hennessy Brian A. Hennessy Director |
Dated: December 4, 2017 | ||||
| By: | /s/ Daniel G. Libarle Daniel G. Libarle Director |
Dated: December 4, 2017 | ||||
| By: | /s/ Rodger Offenbach Rodger Offenbach Director |
Dated: December 4, 2017 | ||||
| By: | /s/ Susan Pomilia Susan Pomilia Director |
Dated: December 4, 2017 | ||||
| By: | /s/ Thomas L. Seavey Thomas L. Seavey Director |
Dated: December 4, 2017 | ||||
85