Attached files
| file | filename |
|---|---|
| 8-K - 8-K - FIRST BANCORP /NC/ | form8k-19124_fbnc.htm |
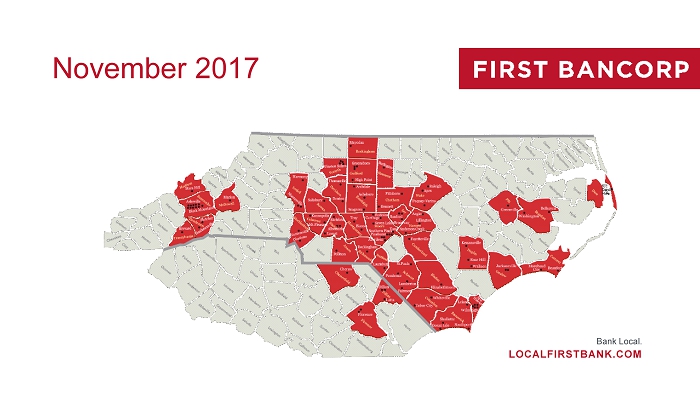
Bank Local. LOCALFIRSTBANK.COM November 2017
2 FORWARD LOOKING STATEMENTS Information in this presentation contains forward - looking statements within the meaning of the Private Securities Litigation Ref orm Act of 1995. These statements involve risks and uncertainties that could cause actual results to differ materially, including without limitation, reduced earnings due to larger than expec ted credit losses in the sectors of our loan portfolio secured by real estate due to economic factors, including declining real estate values, increasing interest rates, increasing unemployment, or changes in payment behavior or other factors; reduced earnings due to larger credit losses because our loans are concentrated by loan type, industry segment, borrower type, or location of the borrower or collateral; the rate of delinquencies and amount of loans charged - off; the adequacy of the level of our allowance for loan losses and the amount of loan loss provisions required in future periods; costs or difficulties related to the integration of the companies we acquired or may acquire may be greater than expected; factors related to our proposed acquisition of ASB Bancorp , I nc. (“ASBB”), including our ability to obtain regulatory approvals and meet other closing conditions to the merger, including approval by ASBB’s shareholders, on the expected terms and schedule; delay in closing the proposed acquisition of ASBB; difficulties and delays in integrating the businesses or fully realizing cost savings and other benefits; business disruption fo llowing the proposed transaction; the reaction to the transaction of the companies' customers, employees and counterparties; results of examinations by our regulatory authorities, including the poss ibi lity that the regulatory authorities may, among other things, require us to increase our allowance for loan losses or write down assets; the amount of our loan portfolio collateralized by re al estate, and weakness in the commercial real estate market; our ability to maintain appropriate levels of capital; adverse changes in asset quality and resulting credit risk - related losses and expenses; increased funding costs due to market illiquidity, increased competition for funding, and increased regulatory requirements with regard to funding; significant increases in competitive p res sure in the banking and financial services industries; changes in political conditions or the legislative or regulatory environment, including the effect of financial reform legislation on th e b anking industry; general economic conditions, either nationally or regionally and especially in our primary service area, becoming less favorable than expected resulting in, among other things , a deterioration in credit quality; our ability to retain our existing customers, including our deposit relationships; changes occurring in business conditions and inflation; changes in monetary a nd tax policies; ability of borrowers to repay loans; risks associated with a failure in or breach of our operational or security systems or infrastructure, or those of our third party vendors and ot her service providers or other third parties, including as a result of cyber - attacks, which could disrupt our businesses, result in the disclosure or misuse of confidential or proprietary informatio n, damage our reputation, increase our costs and cause losses; changes in accounting principles, policies or guidelines; changes in the assessment of whether a deferred tax valuation allow anc e is necessary; our reliance on secondary sources such as FHLB advances, sales of securities and loans, federal funds lines of credit from correspondent banks and out - of - marker time depo sits, to meet our liquidity needs; loss of consumer confidence and economic disruptions resulting from terrorist activities or other military actions; and changes in the securities markets . Additional factors that could cause actual results to differ materially are discussed in the Company's filings with the Securities and E xch ange Commission ("SEC"), including without limitation its Annual Report on Form 10 - K, its Quarterly Reports on Form 10 - Q, and its Current Reports on Form 8 - K. The forward - looking stateme nts in this presentation speak only as of the date of the presentation and the Company does not assume any obligation to update such forward - looking statements. NON - GAAP MEASURES Statements included in this presentation include non - GAAP measures and should be read along with the earnings release and accomp anying Financial Summary for the quarter and period ended September 30, 2017 which provide a reconciliation of non - GAAP measures to GAAP measures. Management believes that these no n - GAAP measures provide additional useful information that allows readers to evaluate the ongoing performance of the Company. Non - GAAP measures should not be considered a s an alternative to any measure of performance or financial condition as promulgated under GAAP, and investors should consider the Company's performance and financial conditio n a s reported under GAAP and all other relevant information when assessing the performance or financial condition of the Company. Non - GAAP measures have limitations as analytical tools, an d investors should not consider them in isolation or as a substitute for analysis of the Company's results or financial condition as reported under GAAP. IMPORTANT INFORMATION
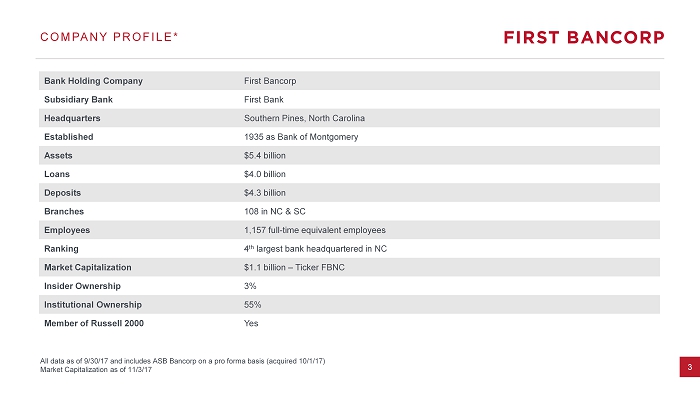
3 COMPANY PROFILE* All data as of 9/30/17 and includes ASB Bancorp on a pro forma basis (acquired 10/1/17) Market Capitalization as of 11/3/17 Bank Holding Company First Bancorp Subsidiary Bank First Bank Headquarters Southern Pines, North Carolina Established 1935 as Bank of Montgomery Assets $5.4 billion Loans $4.0 billion Deposits $4.3 billion Branches 108 in NC & SC Employees 1,157 full - time equivalent employees Ranking 4 th largest bank headquartered in NC Market Capitalization $1.1 billion – Ticker FBNC Insider Ownership 3% Institutional Ownership 55% Member of Russell 2000 Yes
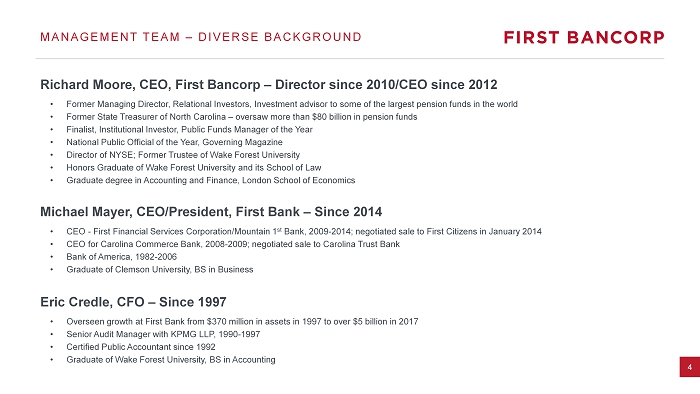
4 MANAGEMENT TEAM – DIVERSE BACKGROUND Richard Moore, CEO, First Bancorp – Director since 2010 /CEO since 2012 • Former Managing Director, Relational Investors, Investment advisor to some of the largest pension funds in the world • Former State Treasurer of North Carolina – oversaw more than $80 billion in pension funds • Finalist, Institutional Investor, Public Funds Manager of the Year • National Public Official of the Year, Governing Magazine • Director of NYSE; Former Trustee of Wake Forest University • Honors Graduate of Wake Forest University and its School of Law • Graduate degree in Accounting and Finance, London School of Economics Michael Mayer, CEO/President, First Bank – Since 2014 • CEO - First Financial Services Corporation/Mountain 1 st Bank, 2009 - 2014; negotiated sale to First Citizens in January 2014 • CEO for Carolina Commerce Bank, 2008 - 2009; negotiated sale to Carolina Trust Bank • Bank of America, 1982 - 2006 • Graduate of Clemson University, BS in Business Eric Credle, CFO – Since 1997 • Overseen growth at First Bank from $370 million in assets in 1997 to over $5 billion in 2017 • Senior Audit Manager with KPMG LLP, 1990 - 1997 • Certified Public Accountant since 1992 • Graduate of Wake Forest University, BS in Accounting
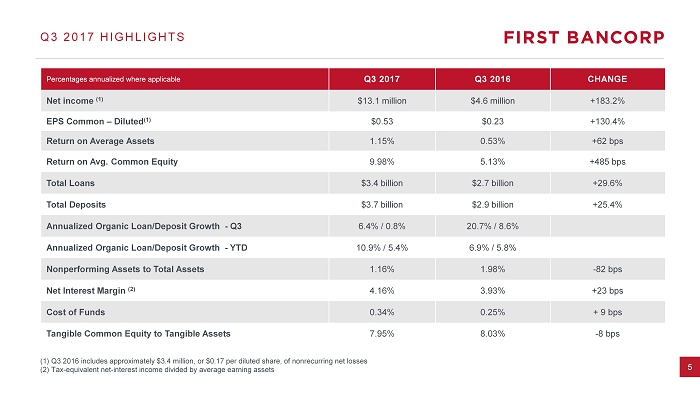
5 Percentages annualized where applicable Q3 2017 Q3 2016 CHANGE Net income (1) $13.1 million $4.6 million +183.2% EPS Common – Diluted (1) $0.53 $0.23 +130.4% Return on Average Assets 1.15% 0.53% +62 bps Return on Avg. Common Equity 9.98% 5.13% +485 bps Total Loan s $3.4 billion $2.7 billion +29.6% Total Deposit s $3.7 billion $2.9 billion +25.4% Annualized Organic Loan/Deposit Growth - Q3 6.4% / 0.8% 20.7% / 8.6% Annualized Organic Loan/Deposit Growth - YTD 10.9% / 5.4% 6.9% / 5.8% Nonperforming Assets to Total Assets 1.16% 1.98% - 82 bps Net Interest Margin (2) 4.16% 3.93% +23 bps Cost of Funds 0.34% 0.25% + 9 bps Tangible Common Equity to Tangible Assets 7.95% 8.03% - 8 bps Q3 2017 HIGHLIGHTS (1) Q3 2016 includes approximately $3.4 million, or $0.17 per diluted share, of nonrecurring net losses (2) Tax - equivalent net - interest income divided by average earning assets
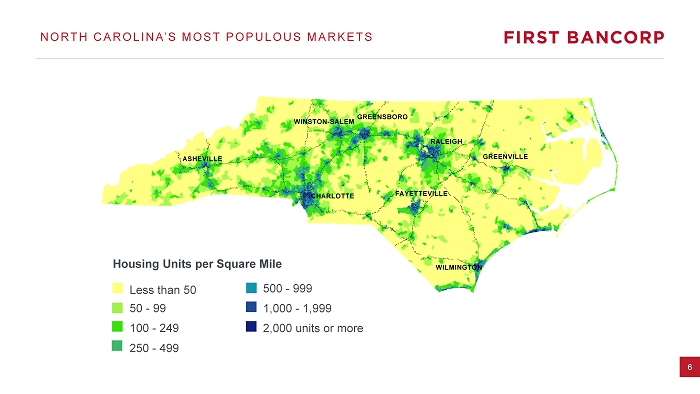
6 ASHEVILLE CHARLOTTE RALEIGH WINSTON - SALEM GREENSBORO FAYETTEVILLE GREENVILLE Less than 50 50 - 99 100 - 249 250 - 499 500 - 999 1,000 - 1,999 2,000 units or more Housing Units per Square Mile WILMINGTON NORTH CAROLINA’S MOST POPULOUS MARKETS
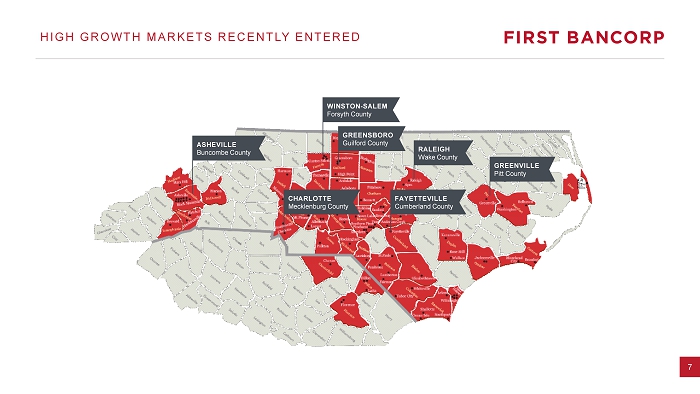
7 HIGH GROWTH MARKETS RECENTLY ENTERED ASHEVILLE Buncombe County WINSTON - SALEM Forsyth County GREENSBORO Guilford County RALEIGH Wake County GREENVILLE Pitt County FAYETTEVILLE Cumberland County CHARLOTTE Mecklenburg County
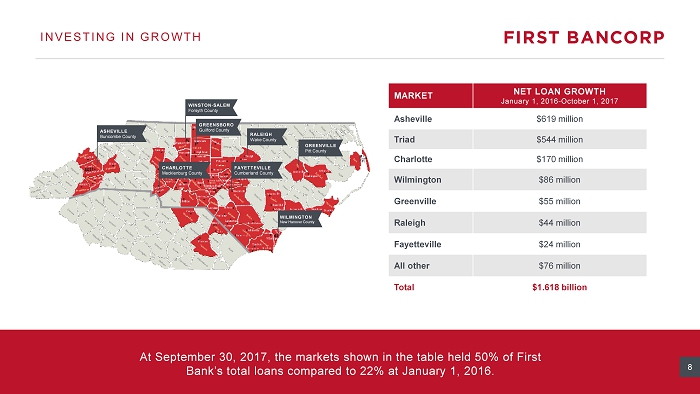
8 ASHEVILLE Buncombe County WINSTON - SALEM Forsyth County GREENSBORO Guilford County RALEIGH Wake County GREENVILLE Pitt County FAYETTEVILLE Cumberland County CHARLOTTE Mecklenburg County At September 30, 2017, the markets shown in the table held 50% of First Bank’s total loans compared to 22% at January 1, 2016. INVESTING IN GROWTH MARKET NET LOAN GROWTH January 1, 2016 - October 1, 2017 Asheville $619 million Triad $544 million Charlotte $170 million Wilmington $86 million Greenville $55 million Raleigh $44 million Fayetteville $24 million All other $76 million Total $1.618 billion 8 GREENVILLE Pitt County WILMINGTON New Hanover County
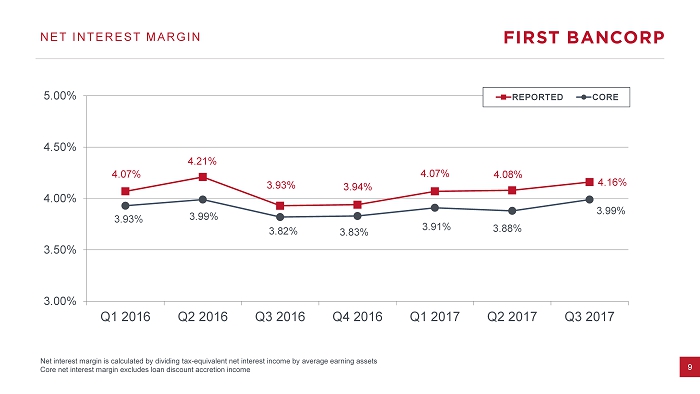
9 4.07% 4.21% 3.93% 3.94% 4.07% 4.08% 4.16% 3.93% 3.99% 3.82% 3.83% 3.91% 3.88% 3.99% 3.00% 3.50% 4.00% 4.50% 5.00% Q1 2016 Q2 2016 Q3 2016 Q4 2016 Q1 2017 Q2 2017 Q3 2017 REPORTED CORE NET INTEREST MARGIN Net interest margin is calculated by dividing tax - equivalent net interest income by average earning assets Core net interest margin excludes loan discount accretion income
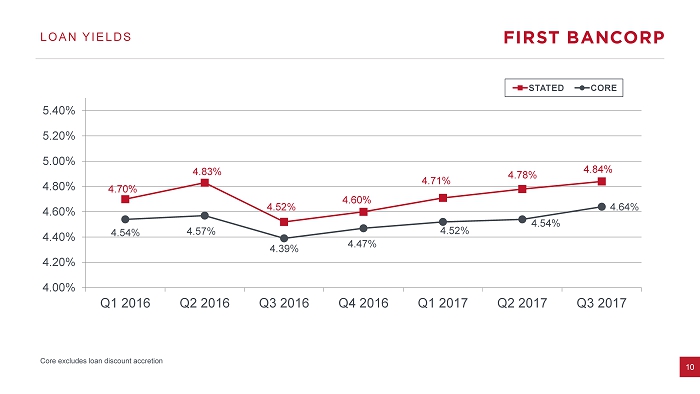
10 4.70% 4.83% 4.52% 4.60% 4.71% 4.78% 4.84% 4.54% 4.57% 4.39% 4.47% 4.52% 4.54% 4.64% 4.00% 4.20% 4.40% 4.60% 4.80% 5.00% 5.20% 5.40% Q1 2016 Q2 2016 Q3 2016 Q4 2016 Q1 2017 Q2 2017 Q3 2017 STATED CORE LOAN YIELDS Core excludes loan discount accretion
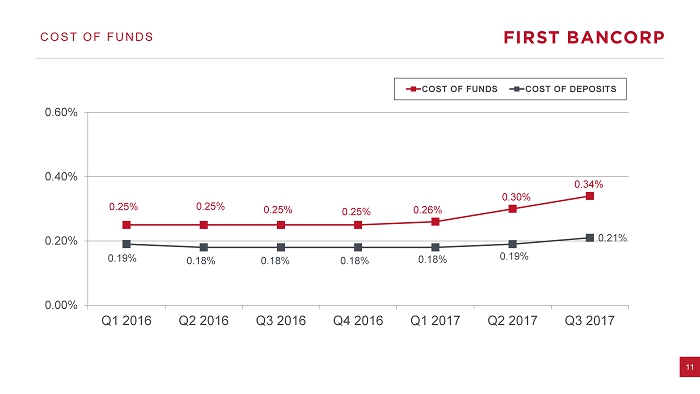
11 0.25% 0.25% 0.25% 0.25% 0.26% 0.30% 0.34% 0.19% 0.18% 0.18% 0.18% 0.18% 0.19% 0.21% 0.00% 0.20% 0.40% 0.60% Q1 2016 Q2 2016 Q3 2016 Q4 2016 Q1 2017 Q2 2017 Q3 2017 COST OF FUNDS COST OF DEPOSITS COST OF FUNDS
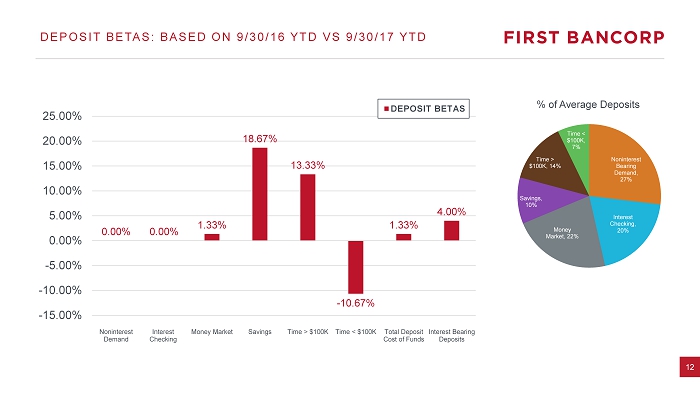
12 0.00% 0.00% 1.33% 18.67% 13.33% - 10.67% 1.33% 4.00% -15.00% -10.00% -5.00% 0.00% 5.00% 10.00% 15.00% 20.00% 25.00% Noninterest Demand Interest Checking Money Market Savings Time > $100K Time < $100K Total Deposit Cost of Funds Interest Bearing Deposits DEPOSIT BETAS Noninterest Bearing Demand, 27% Interest Checking, 20% Money Market, 22% Savings, 10% Time > $100K, 14% Time < $100K, 7% % of Average Deposits DEPOSIT BETAS: BASED ON 9/30/16 YTD VS 9/30/17 YTD
Asheville Savings Bank Acquisition A perfect opportunity in a state of change.
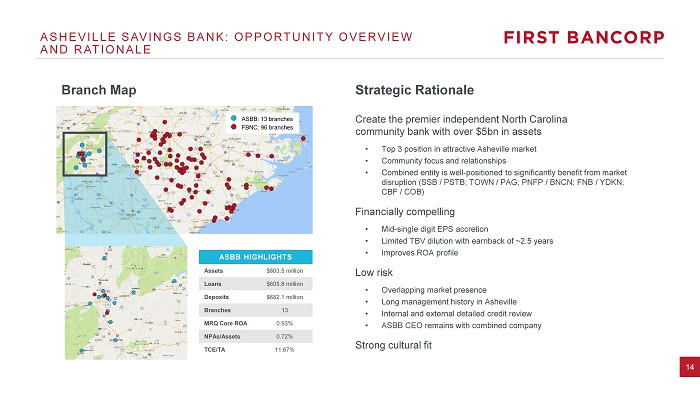
14 Create the premier independent North Carolina community bank with over $5bn in assets • Top 3 position in attractive Asheville market • Community focus and relationships • Combined entity is well - positioned to significantly benefit from market disruption (SSB / PSTB; TOWN / PAG; PNFP / BNCN; FNB / YDKN; CBF / COB) Financially compelling • Mid - single digit EPS accretion • Limited TBV dilution with earnback of ~2.5 years • Improves ROA profile Low risk • Overlapping market presence • Long management history in Asheville • Internal and external detailed credit review • ASBB CEO remains with combined company Strong cultural fit ASBB: 13 branches FBNC: 96 branches ASHEVILLE SAVINGS BANK: OPPORTUNITY OVERVIEW AND RATIONALE ASBB HIGHLIGHTS Assets $803.5 million Loans $605.8 million Deposits $682.1 million Branches 13 MRQ Core ROA 0.93% NPAs/Assets 0.72% TCE/TA 11.67% Branch Map Strategic Rationale
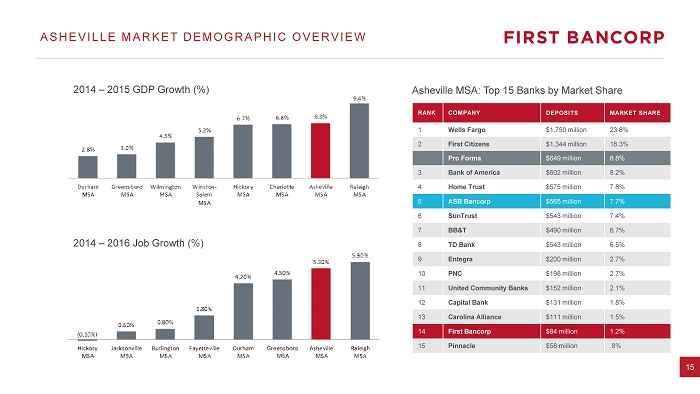
15 ASHEVILLE MARKET DEMOGRAPHIC OVERVIEW 2014 – 2015 GDP Growth (%) 2014 – 2016 Job Growth (%) RANK COMPANY DEPOSITS MARKET SHARE 1 Wells Fargo $1,750 million 23.8% 2 First Citizens $1,344 million 18.3% Pro Forma $649 million 8.8% 3 Bank of America $602 million 8.2% 4 Home Trust $575 million 7.8% 5 ASB Bancorp $565 million 7.7% 6 SunTrust $543 million 7.4% 7 BB&T $490 million 6.7% 8 TD Bank $543 million 6.5% 9 Entegra $200 million 2.7% 10 PNC $198 million 2.7% 11 United Community Banks $152 million 2.1% 12 Capital Bank $131 million 1.8% 13 Carolina Alliance $111 million 1.5% 14 First Bancorp $84 million 1.2% 15 Pinnacle $58 million .8% Asheville MSA: Top 15 Banks by Market Share
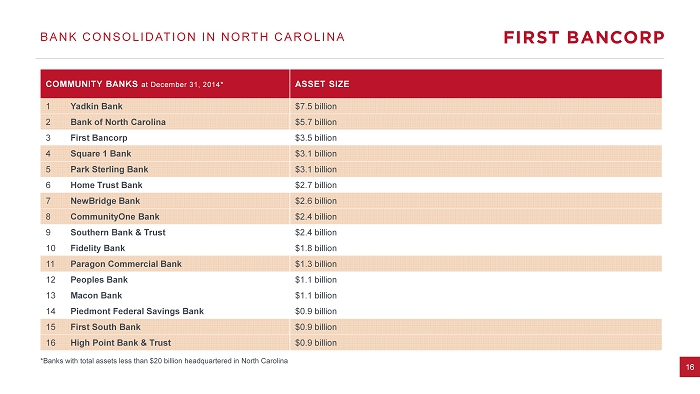
16 BANK CONSOLIDATION IN NORTH CAROLINA *Banks with total assets less than $20 billion headquartered in North Carolina COMMUNITY BANKS at December 31, 2014* ASSET SIZE 1 Yadkin Bank $7.5 billion 2 Bank of North Carolina $5.7 billion 3 First Bancorp $3.5 billion 4 Square 1 Bank $3.1 billion 5 Park Sterling Bank $3.1 billion 6 Home Trust Bank $2.7 billion 7 NewBridge Bank $2.6 billion 8 CommunityOne Bank $2.4 billion 9 Southern Bank & Trust $2.4 billion 10 Fidelity Bank $1.8 billion 11 Paragon Commercial Bank $1.3 billion 12 Peoples Bank $1.1 billion 13 Macon Bank $1.1 billion 14 Piedmont Federal Savings Bank $0.9 billion 15 First South Bank $0.9 billion 16 High Point Bank & Trust $0.9 billion
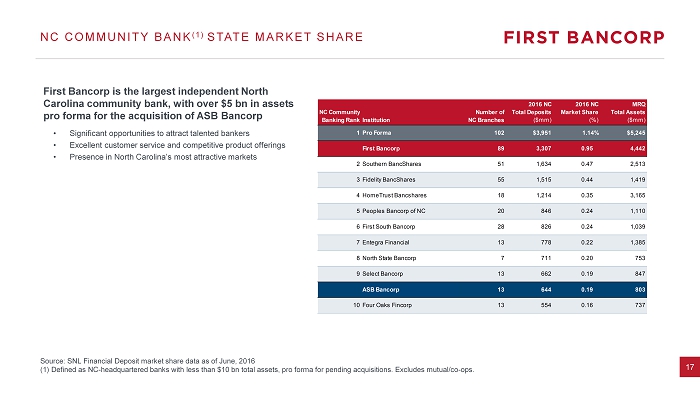
17 NC COMMUNITY BANK (1) STATE MARKET SHARE Source: SNL Financial Deposit market share data as of June, 2016 (1) Defined as NC - headquartered banks with less than $10 bn total assets, pro forma for pending acquisitions. Excludes mutual/co - ops. First Bancorp is the largest independent North Carolina community bank, with over $5 bn in assets pro forma for the acquisition of ASB Bancorp • Significant opportunities to attract talented bankers • Excellent customer service and competitive product offerings • Presence in North Carolina’s most attractive markets NC Community Banking RankInstitution Number of NC Branches 2016 NC Total Deposits ($mm) 2016 NC Market Share (%) MRQ Total Assets ($mm) 1Pro Forma 102 $3,951 1.14% $5,245 First Bancorp 89 3,307 0.95 4,442 2Southern BancShares 51 1,634 0.47 2,513 3Fidelity BancShares 55 1,515 0.44 1,419 4HomeTrust Bancshares 18 1,214 0.35 3,165 5Peoples Bancorp of NC 20 846 0.24 1,110 6First South Bancorp 28 826 0.24 1,039 7Entegra Financial 13 778 0.22 1,385 8North State Bancorp 7 711 0.20 753 9Select Bancorp 13 662 0.19 847 ASB Bancorp 13 644 0.19 803 10Four Oaks Fincorp 13 554 0.16 737
18 Bankingport Insurance NON - INTEREST INCOME GROWTH Added incremental revenue of $5.6 million in 2016 and $8.2 million in the first three quarters of 2017. 18
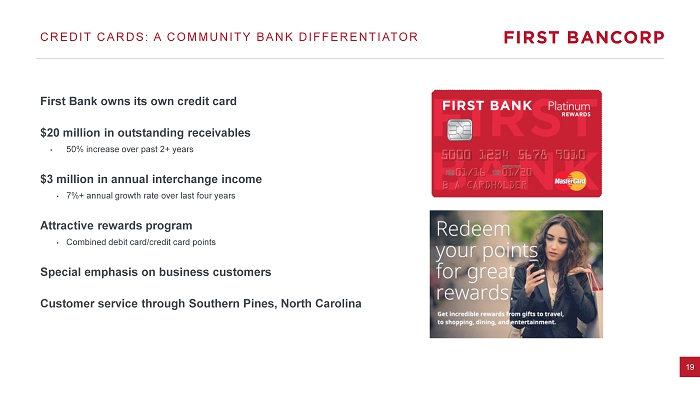
19 CREDIT CARDS: A COMMUNITY BANK DIFFERENTIATOR First Bank owns its own credit card $20 million in outstanding receivables • 50% increase over past 2+ years $3 million in annual interchange income • 7%+ annual growth rate over last four years Attractive rewards program • Combined debit card/credit card points Special emphasis on business customers Customer service through Southern Pines, North Carolina
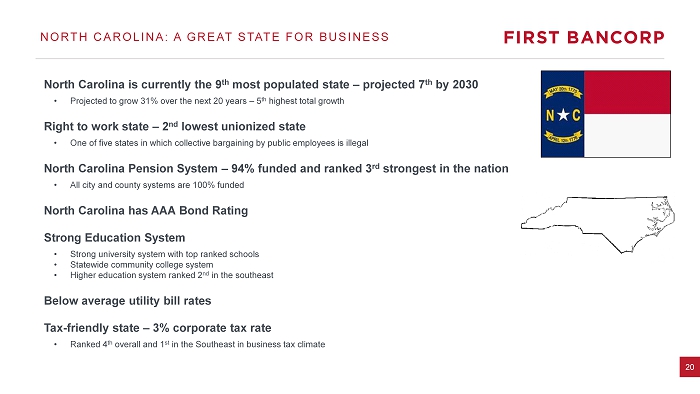
20 NORTH CAROLINA: A GREAT STATE FOR BUSINESS North Carolina is currently the 9 th most populated state – projected 7 th by 2030 • Projected to grow 31% over the next 20 years – 5 th highest total growth Right to work state – 2 nd lowest unionized state • One of five states in which collective bargaining by public employees is illegal North Carolina Pension System – 94% funded and ranked 3 rd strongest in the nation • All city and county systems are 100% funded North Carolina has AAA Bond Rating Strong Education System • Strong university system with top ranked schools • Statewide community college system • Higher education system ranked 2 nd in the southeast Below average utility bill rates Tax - friendly state – 3% corporate tax rate • Ranked 4 th overall and 1 st in the Southeast in business tax climate

Our Promise to Service Excellence We help our customers realize their dreams by providing financial solutions and building trusted relationships.
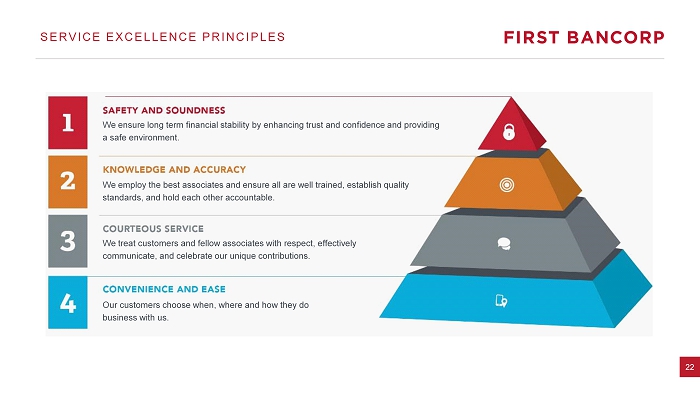
22 SERVICE EXCELLENCE PRINCIPLES We treat customers and fellow associates with respect, effectively communicate, and celebrate our unique contributions. We employ the best associates and ensure all are well trained, establish quality standards, and hold each other accountable. Our customers choose when, where and how they do business with us. We ensure long term financial stability by enhancing trust and confidence and providing a safe environment.
23 INVESTMENT THESIS Bank that offers many of the product capabilities found in larger regional banks but delivers those services with a local community bank focus • Strong culture • Mobile Banking, Wealth Management, Trust Services, Credit Card, Treasury Services, Insurance, and Mortgage Banking Centered in one of the fastest - growing regions in the U.S. Focused on high growth markets Stable, low cost core deposit franchise • Built over 80 years of serving our communities • Strength of rural markets • 2016 cost of funds was 0.25%, 0.30% for year to date September 2017 Strong and Improving Performance Metrics Conservative Balance Sheet • Minimal credit risk in investment portfolio • Core funded • In market loan portfolio – almost no participations Market disruptions provide opportunity
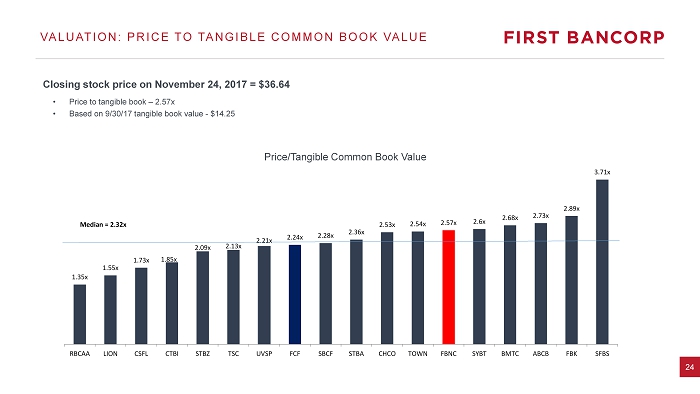
24 VALUATION: PRICE TO TANGIBLE COMMON BOOK VALUE Closing stock price on November 24, 2017 = $36.64 • Price to tangible book – 2.57x • Based on 9/30/17 tangible book value - $14.25 Price/Tangible Common Book Value 1.35x 1.55x 1.73x 1.85x 2.09x 2.13x 2.21x 2.24x 2.28x 2.36x 2.53x 2.54x 2.57x 2.6x 2.68x 2.73x 2.89x 3.71x RBCAA LION CSFL CTBI STBZ TSC UVSP FCF SBCF STBA CHCO TOWN FBNC SYBT BMTC ABCB FBK SFBS Median = 2.32x
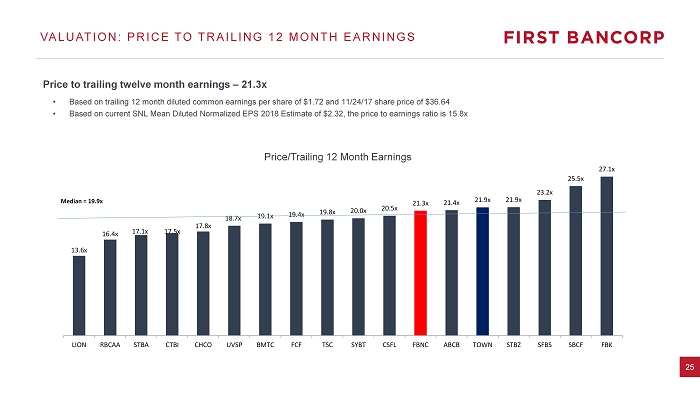
25 VALUATION: PRICE TO TRAILING 12 MONTH EARNINGS Price to trailing twelve month earnings – 21.3x • Based on trailing 12 month diluted common earnings per share of $1.72 and 11/24/17 share price of $36.64 • Based on current SNL Mean Diluted Normalized EPS 2018 Estimate of $2.32, the price to earnings ratio is 15.8x Price/Trailing 12 Month Earnings 13.6x 16.4x 17.1x 17.5x 17.8x 18.7x 19.1x 19.4x 19.8x 20.0x 20.5x 21.3x 21.4x 21.9x 21.9x 23.2x 25.5x 27.1x LION RBCAA STBA CTBI CHCO UVSP BMTC FCF TSC SYBT CSFL FBNC ABCB TOWN STBZ SFBS SBCF FBK Median = 19.9x
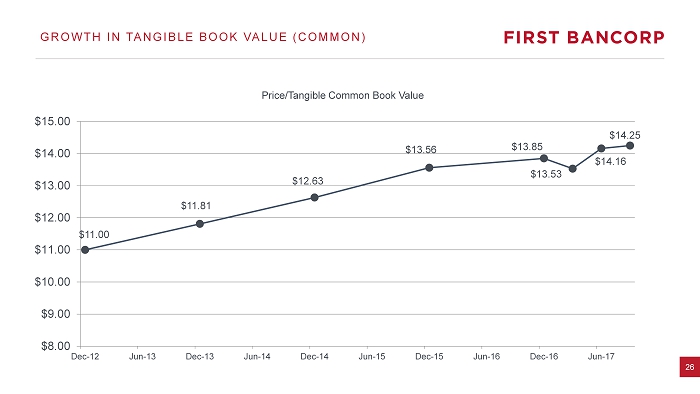
26 $11.00 $11.81 $12.63 $13.56 $13.85 $13.53 $14.16 $14.25 $8.00 $9.00 $10.00 $11.00 $12.00 $13.00 $14.00 $15.00 Dec-12 Jun-13 Dec-13 Jun-14 Dec-14 Jun-15 Dec-15 Jun-16 Dec-16 Jun-17 GROWTH IN TANGIBLE BOOK VALUE (COMMON) Price/Tangible Common Book Value
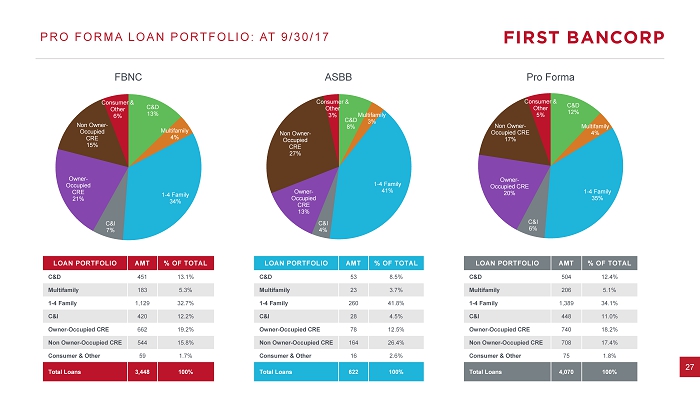
27 C&D 13% Multifamily 4% 1 - 4 Family 34% C&I 7% Owner - Occupied CRE 21% Non Owner - Occupied CRE 15% Consumer & Other 6% C&D 8% Multifamily 3% 1 - 4 Family 41% C&I 4% Owner - Occupied CRE 13% Non Owner - Occupied CRE 27% Consumer & Other 3% C&D 12% Multifamily 4% 1 - 4 Family 35% C&I 6% Owner - Occupied CRE 20% Non Owner - Occupied CRE 17% Consumer & Other 5% PRO FORMA LOAN PORTFOLIO: AT 9/30/17 FBNC ASBB Pro Forma LOAN PORTFOLIO AMT % OF TOTAL C&D 53 8.5% Multifamily 23 3.7% 1 - 4 Family 260 41.8% C&I 28 4.5% Owner - Occupied CRE 78 12.5% Non Owner - Occupied CRE 164 26.4% Consumer & Other 16 2.6% Total Loans 622 100% LOAN PORTFOLIO AMT % OF TOTAL C&D 451 13.1% Multifamily 183 5.3% 1 - 4 Family 1,129 32.7% C&I 420 12.2% Owner - Occupied CRE 662 19.2% Non Owner - Occupied CRE 544 15.8% Consumer & Other 59 1.7% Total Loans 3,448 100% LOAN PORTFOLIO AMT % OF TOTAL C&D 504 12.4% Multifamily 206 5.1% 1 - 4 Family 1,389 34.1% C&I 448 11.0% Owner - Occupied CRE 740 18.2% Non Owner - Occupied CRE 708 17.4% Consumer & Other 75 1.8% Total Loans 4,070 100%