Attached files
| file | filename |
|---|---|
| EX-99.4 - UNAUDITED PRO FORMA FINANCIAL STATEMENTS - Baker Hughes Holdings LLC | ss69708_ex9904.htm |
| EX-99.3 - GE OG 8K RESTATED FINANCIALS - Baker Hughes Holdings LLC | ss69708_ex9903.htm |
| EX-99.1 - GE OG REVISED BUSINESS DESCRIPTION - Baker Hughes Holdings LLC | ss69708_ex9901.htm |
| 8-K - CURRENT REPORT - Baker Hughes Holdings LLC | ss69708_8k.htm |
Exhibit 99.2
MANAGEMENT’S DISCUSSION AND ANALYSIS OF FINANCIAL CONDITION AND
RESULTS OF OPERATIONS OF GE O&G
Baker Hughes, a GE company, LLC, a Delaware limited liability company (the Company, BHGE LLC, we, us, or our ) and the successor to Baker Hughes Incorporated, a Delaware corporation (Baker Hughes) is a fullstream oilfield technology provider that has a unique mix of equipment and service capabilities. On July 3, 2017, we closed our previously announced business combination (the Transactions) to combine the oil and gas business (GE O&G) of General Electric Company (GE) and Baker Hughes. In connection with the Transactions, we entered into and are governed by an Amended & Restated Operating Agreement, dated as of July 3, 2017 (the BHGE LLC Agreement). Under the BHGE LLC Agreement, EHHC Newco, LLC (EHHC), a wholly owned subsidiary of Baker Hughes, a GE company (BHGE), is our sole managing member and BHGE is the sole managing member of EHHC. As our managing member, EHHC conducts, directs and exercises full control over all our activities, including our day-to-day business affairs and decision-making, without the approval of any other member. As such, EHHC is responsible for all our operational and administrative decisions and the day-to-day management of our business. GE owns approximately 62.5% of our common units and BHGE owns approximately 37.5% of our common units indirectly through two wholly owned subsidiaries.
The Transactions were treated as a “reverse acquisition” for accounting purposes and, as such, the historical financial statements of the accounting acquirer, GE O&G, are the historical financial statements of the Company. The Company’s financial statements have been prepared on a consolidated basis, effective July 3, 2017. For all periods prior to July 3, 2017, the Company’s financial statements were prepared on a combined basis. The combined financial statements included in Exhibit 99.3 to this Current Report on Form 8-K combine certain accounts of GE and its subsidiaries that were historically managed as part of its Oil & Gas business. The historical financial results in the combined financial statements presented may not be indicative of the results that would have been achieved had GE O&G operated as a separate, stand-alone entity during those periods. The GE O&G numbers in the combined statements of income (loss) and the combined statements of cash flows have been reclassified to conform to the presentation included in BHGE LLC’s Quarterly Report on Form 10-Q for the period ended September 30, 2017. We believe that the reclassified presentation is a more appropriate presentation of the combined businesses.
The following management’s discussion and analysis of financial condition and results of operations of GE O&G was included in the definitive proxy statement/prospectus (Proxy Statement/Prospectus) filed by Baker Hughes on May 30, 2017 and has been recast to reflect a change in segment reporting following the Transactions and the reclassified presentation of the statements of income (loss) and the statements of cash flows. The discussion below is limited to the fiscal years ended December 31, 2016, 2015 and 2014 for GE O&G and does not include financial information for Baker Hughes. The information included in this section has been revised only to reflect the reporting changes described above and has not otherwise been updated or revised to reflect events or changes occurring after the date of the Proxy Statement/Prospectus. This information should be read in conjunction with BHGE LLC’s SEC filings. Following the Transactions, the majority of the legacy Baker Hughes business is included in the Oilfield Services segment, with a small component included in the Digital Services segment.
The following discussion and analysis summarizes the significant factors affecting the results of operations, financial condition and liquidity position of GE O&G as of and for the years ended December 31, 2016, 2015 and 2014, and should be read in conjunction with the combined financial statements and related notes of GE O&G included in Exhibit 99.3 to this Current Report on Form 8-K. Neither the following discussion and analysis nor the combined financial statements of GE O&G represent the financial position or results of operations of the Oil & Gas operating segment of GE. The following discussion and analysis of the financial condition and results of operations of GE O&G covers periods prior to the consummation of the Transactions and does not reflect its effect on future periods. The following discussion and analysis contain forward-looking statements that reflect GE O&G’s plans, estimates and beliefs. Actual results could differ materially from those discussed in the forward-looking statements. See “Cautionary Note Regarding Forward-Looking Statements” included in the Proxy Statement/Prospectus. Factors that could cause or contribute to these differences include those discussed below and in the section titled “Risk Factors” included in the Proxy Statement/Prospectus.
1
Presentation
The sum of the components reported in millions may not be equal to the total amount reported due to rounding. Percentages presented are calculated from the numbers in millions.
Executive Summary
GE O&G operates in more than 120 countries, offering its customers a leading portfolio of advanced technology and optimization support. GE O&G is active in all segments of the oil and gas industry; upstream to downstream, greenfield to brownfield, onshore and offshore. GE O&G also delivers pipeline integrity solutions, a wide range of sensing, inspection and monitoring technologies and industrial power generation and compression solutions for the midstream liquefied natural gas and pipeline segments and downstream refining and petro-chemical segments. GE O&G endeavors to continuously improve oil and gas industry performance, output and productivity.
GE O&G principally provides equipment and services to the oil and natural gas exploration and production industry, both on land and offshore, through its four business segments: Oilfield Services (OFS); Oilfield Equipment (OFE); Turbomachinery & Process Solutions (TPS); and Digital Solutions (DS), which are described below:
| • |
Oilfield Services provides equipment and services ranging from well evaluation to decommissioning. Products and services include diamond and tri-cone drill bits, drilling services (including directional drilling technology, measurement while drilling & logging while drilling), downhole completion tools and systems, wellbore intervention tools and services, wireline services, drilling and completions fluids, oilfield and industrial chemicals, pressure pumping, and artificial lift technologies (including electrical submersible pumps).
|
| • |
Oilfield Equipment provides a broad portfolio of products and services required to facilitate the safe and reliable flow of hydrocarbons from the subsea wellhead to the surface. Products and services include pressure control equipment and services, Subsea production systems and services, drilling equipment, and flexible pipeline systems. Oilfield Equipment operation designs and manufactures onshore and offshore drilling and production systems and equipment for floating production platforms and provides a full range of services related to onshore and offshore drilling activities.
|
| • |
Turbomachinery & Process Solutions provides equipment and related services for mechanical-drive, compression and power-generation applications across the oil and gas industry as well as products and services to serve the downstream segments of the industry including refining, petrochemical, distributed gas, flow and process control and other industrial applications. The Turbomachinery & Process Solutions portfolio includes drivers (aero-derivative gas turbines, heavy-duty gas turbines and synchronous and induction electric motors), compressors (centrifugal and axial, direct drive high speed, integrated, subsea compressors, turbo expanders and reciprocating), turn-key solutions (industrial modules and waste heat recovery), pumps, valves, and compressed natural gas (CNG) and small-scale liquefied natural gas (LNG) solutions used primarily for shale oil and gas field development.
|
| • |
Digital Solutions provides equipment and services for a wide range of industries, including oil & gas, power generation, aerospace, metals, and transportation. The offerings include sensor-based measurement, non-destructive testing and inspection, turbine, generator and plant controls and condition monitoring, as well as pipeline integrity solutions.
|
The years ended December 31, 2016 and 2015 were a challenging period for the oil and gas industry, primarily due to uncertainty and volatility in oil and gas prices. While there have been indications of positive trends in oil and gas prices, the industry generally continues to focus on cost rationalization and capital spending reductions to align its cost structure with current economic conditions. The challenging period continues and has led to lower capital spending across the oil and gas industry, which adversely affected GE O&G’s financial performance in 2016 and in 2015 as it experienced a reduction in volume and pricing pressure across most of its product lines.
2
The Transactions
On October 30, 2016, GE and Baker Hughes entered into the Transaction Agreement and Plan of Merger, as amended by the Amendment to the Transaction Agreement and Plan of Merger, dated as of March 27, 2017, which provided for the combination of GE O&G and Baker Hughes as described above. The combined product portfolio of GE O&G and Baker Hughes in drilling, completions, production and midstream/downstream equipment and services created a leading equipment, technology, and service provider in the oil and gas industry operating in more than 120 countries.
Factors Affecting Results of Operations
Oil and Gas Prices
The sharp decline experienced in oil and gas prices since 2014 and the prospect of a continuation of prevailing low oil and gas prices has caused GE O&G’s business to experience declines in orders, some project commencement delays and pricing pressures as capital spending by customers has been diminished, deferred or cancelled. Outside North America, customer spending is most heavily influenced by Brent oil prices and by regional or oil-linked natural gas prices, while in North America, customer spending is highly driven by WTI oil prices and natural gas prices, as measured by the Henry Hub Natural Gas Spot Price. In response to this uncertain industry outlook, GE O&G continues to realize cost saving actions with an increased focus on execution and productivity.
The following table sets forth average oil prices for the years indicated.
|
|
Average Daily Price
|
||||||||
|
Year Ended
|
WTI Crude
|
Brent Crude
|
Henry Hub
Natural Gas
|
||||||
|
December 31, 2016
|
$
|
43.29
|
$
|
43.67
|
$
|
2.52
|
|||
|
December 31, 2015
|
48.66
|
52.32
|
2.62
|
||||||
|
December 31, 2014
|
93.17
|
98.97
|
4.37
|
||||||
| (1) |
Source: U.S. Energy Information Administration (EIA). As of May 19, 2017, WTI crude, Brent crude and natural gas traded at approximately $48.86 per barrel, $51.29 per barrel and $3.26 per mmBtu, respectively.
|
Rig Counts and Contract Awards
The number of customer contracts awarded across key product lines in the calendar year is a key business barometer for GE O&G, as it is an indicator of the overall health of the oil and gas business. The number of contracts awarded is generally determined by the capital spending of our customers, which is directly influenced by oil and gas prices. The awards represent the amount of new business that was available for open bid within the industry and is a good indicator of customer spending over the period. These awards should not be the sole factor considered as there may be other conditions that impact the customer’s overall spending, particularly with respect to services. Rig counts are also a business barometer for GE O&G. When drilling rigs are active, they consume products and services. Rig count trends are governed by exploration and development spending by our customers, which in turn is influenced by current and future price expectations for oil and gas. Therefore, the counts may be reflective of the relative strength and stability of energy prices and overall market activity.
The following table sets forth rig counts and contract awards for the years indicated.
|
|
Calendar year ending
December 31, |
||||||||
|
|
2016
|
2015
|
2014
|
||||||
|
LNG awards(1)
|
4
|
23
|
38
|
||||||
|
Offshore blowout preventer awards(2)
|
-
|
-
|
8
|
||||||
|
Subsea tree awards(3)
|
75
|
156
|
239
|
||||||
|
U.S. onshore rigs(4)
|
490
|
948
|
1,804
|
||||||
|
International onshore rigs(4)(5)
|
855
|
1,072
|
1,385
|
||||||
| (1) |
Source: Internal GE database of publicly announced awards in million tons per annum.
|
| (2) |
Source: IHS Petrodata April 2017.
|
| (3) |
Source: WoodMac April 2017.
|
| (4) |
Source: Baker Hughes Rig Count, www.bakerhughes.com.
|
| (5) |
Does not include Russia, China or Central Asia.
|
3
Key Performance Indicators ($ millions)
Product services and backlog of product services
GE O&G’s Statement of Earnings displays sales and costs of sales in accordance with SEC regulations under which “goods” is required to include all sales of tangible products and “services” must include all other sales, including other service activities. For the amounts shown below, as well as in the orders and backlog charts included in the Business section in Exhibit 99.1 to this Current Report on Form 8-K and this Management’s Discussion and Analysis section, GE O&G distinguishes between “equipment” and “product services”, where product services refers to sales under product services agreements, including sales of both goods (such as spare parts and equipment upgrades) and related services (such as monitoring, maintenance and repairs), which is an important part of its operations. GE O&G refers to “product services” simply as “services” within the Business section in Exhibit 99.1 to this Current Report on Form 8-K and this Management’s Discussion and Analysis section.
Backlog is defined as unfilled customer orders for products and services believed to be firm. For product services, an amount is included for the expected life of the contract.
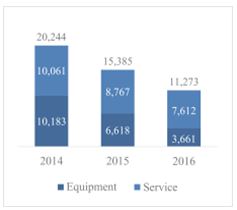
Historical orders and backlog by fiscal year ($ millions)
|
Orders
|
|
Backlog
|
 |
|
 |
Orders: In 2016, GE O&G recognized orders of $11,273 million, a decrease of $4,112 million from 2015. Driven by broader market conditions, GE O&G continued to see delays in final investment decisions on projects and pricing pressure.
Backlog: GE O&G’s backlog represents unfilled customer orders for products and services, with the value being defined as the expected life of contract sales for product services. In 2016, GE O&G’s backlog was $21,697 million, a decrease of $2,244 million from 2015 primarily driven by the decrease in equipment backlog of 32% as well as the strengthening of the U.S. dollar, which accounted for a decrease of $309 million. GE O&G’s services backlog increased by 5% to $15,223 million. Backlog remains relatively strong and provides an indication of long term revenues within GE O&G.
GE O&G’s book-to-bill ratio utilized to analyze the relationship between orders received and revenue recognized. Due to the market conditions, our book-to-bill ratio was 0.8:1 and 0.9:1 for the years ending December 31, 2016 and 2015, respectively. These ratios and the resulting reduction in backlog were primarily driven by the long-cycle nature of our equipment businesses and the aforementioned market conditions. Based on improving industry conditions, GE O&G expects this trend to stabilize, specifically in the equipment businesses, and as a result we do not expect it to have a material effect on our operations. GE O&G continues to monitor conditions and act accordingly, as an example, executing further restructuring and product cost-out efforts. GE O&G expects approximately 30% of the total $21,697 million December 31, 2016 year-end backlog to be fulfilled within the following fiscal year with the remainder expected to be completed in future years.
4
Results of Operations ($ millions)
The results of operations of GE O&G are evaluated by the chief executive officer of GE O&G on a combined and consolidated basis as well as at the segment level.
Revenue includes revenues related to the segment. Segment operating income is determined based on the internal performance measures used by the chief executive officer of GE O&G to assess the performance of each segment in a financial period. In assessing each segment’s performance, the chief executive officer of GE O&G may exclude certain items from the segment and include these items in the corporate items and eliminations line. The performance of our operating segments is evaluated based on segment operating income (loss), which is defined as income (loss) before income taxes and equity in loss of affiliate and before the following: net interest expense, net other non operating income (loss), corporate expenses, restructuring, impairment and other charges, inventory impairments, goodwill impairments, merger and related costs, and certain gains and losses not allocated to the operating segments.
In evaluating the segment performance, the chief executive officer of GE O&G uses the following metrics:
Volume & Price: Volume is the increase or decrease in products and/or services sold period-over-period excluding the impact of foreign exchange and price. The volume impact on profit is calculated by multiplying the prior period profit rate by the change in revenue volume between the current and prior period. Price is defined as the change in sales price for a comparable product or service period-over-period and is calculated as the period-over-period change in sales prices of comparable products and services.
Foreign Exchange (“FX”): FX measures the translational foreign exchange impact, or the translation impact of the period-over-period change on sales and costs directly attributable to change in the foreign exchange rate compared to the U.S. dollar. FX impact is calculated by multiplying the functional currency amounts (revenue or profit) with the period-over-period FX rate variance, using the average exchange rate for the respective period.
(Inflation)/Deflation: (Inflation)/deflation is defined as the increase or decrease in direct and indirect costs of the same type for an equal amount of volume. It is calculated as the year-over-year change in cost (i.e., price paid) of direct material, compensation & benefits and overhead costs.
Productivity: Productivity is measured by the remaining variance in profit, after adjusting for the period-over-period impact of volume & price, foreign exchange and (inflation)/deflation as defined above. Improved or lower period-over-period cost productivity is the result of cost efficiencies or inefficiencies, such as cost decreasing or increasing more than volume, or cost increasing or decreasing less than volume, or changes in sales mix among segments. This also includes the period-over-period variance of transactional foreign exchange, aside from those foreign currency devaluations that are reported separately for business evaluation purposes.
5
Revenue and Segment Operating Income (Loss) Before Tax
Revenue and segment operating income (loss) for each of our four operating segments is provided below.
|
GE O&G
Fiscal Year Ending December 31, |
||||||||||||
|
(in millions)
|
2016
|
2015
|
2014
|
|||||||||
|
Revenue
|
||||||||||||
|
Oilfield Services
|
799
|
1,411
|
2,232
|
|||||||||
|
Oilfield Equipment
|
3,547
|
5,060
|
5,927
|
|||||||||
|
Turbomachinery & Process Solutions
|
6,837
|
7,985
|
8,647
|
|||||||||
|
Digital Solutions
|
2,086
|
2,232
|
2,385
|
|||||||||
|
Total segment revenue
|
13,269
|
16,688
|
19,191
|
|||||||||
|
Segment operating income (loss)
|
||||||||||||
|
Oilfield Services
|
(204
|
)
|
(79
|
)
|
10
|
|||||||
|
Oilfield Equipment
|
320
|
677
|
764
|
|||||||||
|
Turbomachinery & Process Solutions
|
1,255
|
1,684
|
1,562
|
|||||||||
|
Digital Solutions
|
355
|
409
|
483
|
|||||||||
|
Total segment operating income (loss)
|
1,726
|
2,691
|
2,819
|
|||||||||
|
Corporate
|
(380
|
)
|
(260
|
)
|
(164
|
)
|
||||||
|
Inventory impairment
|
(138
|
)
|
(51
|
)
|
(8
|
)
|
||||||
|
Impairment of goodwill
|
-
|
(2,080
|
)
|
-
|
||||||||
|
Restructuring, impairment and other
|
(516
|
)
|
(411
|
)
|
(189
|
)
|
||||||
|
Merger and related costs
|
(33
|
)
|
(27
|
)
|
(67
|
)
|
||||||
|
Operating income (loss)
|
659
|
(138
|
)
|
2,391
|
||||||||
|
Other non operating income (loss), net
|
27
|
100
|
124
|
|||||||||
|
Interest expense, net
|
(102
|
)
|
(120
|
)
|
(179
|
)
|
||||||
|
Income (loss) before income taxes
|
584
|
(158
|
)
|
2,336
|
||||||||
|
Provision for Income Taxes
|
(250
|
)
|
(473
|
)
|
(484
|
)
|
||||||
|
Net income (loss)
|
334
|
(631
|
)
|
1,852
|
||||||||
6
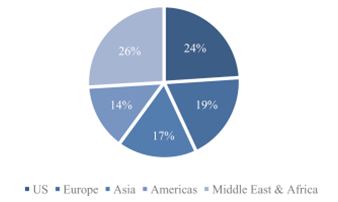
The following charts show historical segment revenues and segment operating income for each of our reportable segments for the years ended December 31, 2016, 2015 and 2014 as well as our revenues by geographic region for the year ended December 31, 2016:
Historical Segment Revenues and Segment Operating Income ($ millions)
|
Segment Revenues
|
|
Segment Operating Income
|
 |
|
 |
2016 Geographic Revenues ($13,269 million)
Fiscal Year 2016 to Fiscal Year 2015 Consolidated Performance
Revenue in 2016 was $13,269 million, a decrease of $3,419 million, or 20%, from 2015. This decrease was primarily due to the continued decline in customer activity across all product lines due to the continued weakness in oil prices. Oilfield Equipment decreased $1,513 million, Turbomachinery & Process Solutions decreased $1,148 million, Oilfield Services decreased $612 million, and Digital Solutions decreased $146 million.
Total segment operating income in 2016 was $1,726 million, a decrease of $965 million, or 36%, from 2015. This decrease was primarily driven by the combined impact of lower volume and pricing headwinds. Turbomachinery & Process Solutions decreased $429 million, Oilfield Equipment decreased $357 million, Oilfield Services decreased $125 million, and Digital Solutions decreased $54 million.
7
Oilfield Services
Oilfield Services 2016 revenue was $799 million, a decrease of $612 million, or 43%, from 2015. This decline was primarily driven by the impact of lower oil prices on customer purchasing decisions throughout the year.
Oilfield Services 2016 segment operating loss was $204 million, compared to a loss of $79 million in 2015. This decline in profitability was mainly due to lower cost productivity, partially offset by cost deflation.
Oilfield Equipment
Oilfield Equipment 2016 revenue was $3,547 million, a decrease of $1,513 million, or 30%, from 2015. This decline was primarily due to customers’ activity reductions, and to a lesser extent the strengthening of the U.S. dollar.
Oilfield Equipment 2016 segment operating income was $320 million, compared to $677 million in 2015. This decline in profitability was the result of lower revenues and negative pricing, as well as lower cost productivity, partially offset by deflation savings.
Turbomachinery & Process Solutions
Turbomachinery & Process Solutions 2016 revenue was $6,837 million, a decrease of $1,148 million, or 14%, from 2015. The decline was primarily attributable to decreases in volume and price driven by uncertainty in the broader market, and delays in equipment contracts.
Turbomachinery & Process Solutions 2016 segment operating income was $1,255 million, compared to $1,684 million in 2015. This decline in profitability was primarily due to the impact of lower volume and negative pricing.
Digital Solutions
Digital Solutions 2016 revenue was $2,086 million, a decrease of $146 million, or 7%, from 2015. This decline was due to lower sales volume driven by the delay of capital spending projects in the oil and gas sector.
Digital Solutions 2016 segment operating income was $355 million, compared to $409 million in 2015. This decline in profitability was driven by lower cost productivity and weaker sales volume.
Corporate
In 2016, Corporate expenses were $380 million, an increase of $120 million compared to 2015. This was primarily due to selective increases in R&D program investments and lower cost productivity.
Restructuring, Impairment and Other
In 2016, GE O&G recognized $516 million in restructuring and other charges, an increase of $105 million compared to 2015. This increase was driven by continued focus on cost rationalization to better align GE O&G’s operating structure to market conditions and significant currency devaluations in Angola and Nigeria.
Merger and Related Costs
GE O&G recorded $33 million of merger and related costs in 2016, an increase of $6 million from the prior year, primarily related to the acquisition of Baker Hughes.
Interest Expense, Net
In 2016, GE O&G incurred net interest expenses of $102 million, a decrease of $18 million from the prior year, primarily related to the factoring of accounts receivable, mainly with GE Capital.
8
Income Tax
In 2016, GE O&G income tax expense decreased by $223 million, to $250 million from $473 million in 2015. This decrease was primarily due to a decline in profit excluding the impairment of non-deductible goodwill of $453 million, partially offset by a decrease in the benefit from global operations including foreign tax credit benefits of $132 million. The 2015 effective tax rate was unfavorably impacted by this goodwill impairment, which was non-deductible for tax purposes and increased the tax provision by $713 million relative to income tax expense had it been deductible.
Fiscal Year 2015 to Fiscal Year 2014
Consolidated Performance
Revenue in 2015 was $16,688 million, a decrease of $2,503 million, or 13%, from 2014. This decrease was primarily due to the negative impact of the strengthening of the U.S. dollar on all segments along with lower volume due to weakness in oil prices. Oilfield Equipment decreased $867 million, Oilfield Services decreased $821 million, Turbomachinery & Process Solutions decreased by $662 million, and Digital Solutions decreased $153 million.
Total segment operating income in 2015 was $2,691 million, a decrease of $128 million, or 5%, from 2014. This decline was primarily driven by the strengthening of the U.S. dollar in comparison to other currencies and the impact of lower volumes. Oilfield Services decreased $89 million, Oilfield Equipment decreased $87 million and Digital Solutions decreased $74 million, partially offset by an increase in Turbomachinery & Process Solutions of $122 million.
Oilfield Services
Oilfield Services 2015 revenue was $1,411 million, a decrease of $821 million, or 37%, compared to 2014. This decrease was primarily driven by lower volumes and weaker price on equipment and services product lines due to the decline in oil prices throughout the year.
Oilfield Services 2015 segment operating loss was $79 million, compared to segment operating income of $10 million in 2014. This decline in profitability was mainly due to volume and price-related decreases.
Oilfield Equipment
Oilfield Equipment 2015 revenue was $5,060 million, a decrease of $867 million, or 15%, from 2014. The decrease was mainly attributable to the strengthening of the U.S. dollar.
Oilfield Equipment 2015 segment operating income was $677 million, a decrease of $87 million from 2014. This decline in profitability was mainly due to the strengthening of the U.S. dollar and weaker volumes, partially offset by cost deflation and cost productivity.
Turbomachinery & Process Solutions
Turbomachinery & Process Solutions 2015 revenue was $7,985 million, a decrease of $662 million, or 8%, from 2014. The decrease was driven by the negative impact of the strengthening of the U.S. dollar, which offset volume and price-related increases.
Turbomachinery & Process Solutions 2015 segment operating income was $1,684 million, an increase of $122 million from 2014. This increase in profitability was driven by strong cost productivity, volume and price increases and cost deflation.
Digital Solutions
Digital Solutions 2015 revenue was $2,232 million, a decrease of $153 million, or 6%, compared to 2014. This decrease was primarily driven by the impact of a stronger U.S. dollar and partially offset by an increase in volume.
9
Digital Solutions 2015 segment operating income was $409 million, compared to $483 million in 2014. The decline in profitability was mainly driven by the negative impact of the strengthening U.S. dollar, which more than offset strong cost productivity.
Corporate
In 2015, Corporate expenses were $260 million an increase of $96 million, compared to 2014. This increase was primarily due to selective increases in R&D program investments and localization efforts.
Restructuring, Impairment and Other
In 2015, GE O&G implemented various restructuring programs designed to better align its cost structure to the change in economic conditions driven by a significant decline in oil prices. This combined with significant currency devaluations in Angola and Nigeria, resulted in restructuring and other charges of $411 million, an increase of $222 million compared to 2014.
Merger and Related Costs
GE O&G recorded $27 million of merger and related costs in 2015, a decrease of $40 million from the prior year. This reduction was primarily related to non-recurring trailing costs related to the acquisition of Lufkin Industries in 2014.
Interest Expense, Net
In 2015, GE O&G incurred net interest expenses of $120 million, a decrease of $59 million from the prior year. This decrease was driven by an increase in interest income and a decrease in factoring expenses.
Income Tax
In 2015, GE O&G income tax expense decreased by $11 million, to $473 million from $484 million in 2014. This decrease was primarily due to a decrease in the benefit from global operations including foreign tax credit benefits of $174 million, partially offset by a decline in profit excluding the impairment of non-deductible goodwill of $160 million. The 2015 effective tax rate was unfavorably impacted by this goodwill impairment which was non-deductible for tax purposes and increased the tax provision by $713 million relative to income tax expense had it been deductible.
Financial Resources and Liquidity
GE O&G’s objective is to maintain sufficient liquidity and financial flexibility to fund its business operations. As of December 31, 2016, GE O&G had $981 million of cash and equivalents, compared to $1,432 million at December 31, 2015. As of December 31, 2016, approximately $878 million of the $981 million of cash and equivalents was held by GE O&G’s foreign subsidiaries and would be subject to United States tax if repatriated. GE O&G’s intent is to permanently reinvest these funds outside of the United States and current plans do not suggest a need to repatriate such funds to fund GE O&G’s United States operations.
GE O&G mainly generates its cash from its operating activities. Historically GE O&G has participated in GE’s cash pooling arrangements to access liquidity and fund its operations, the effect of which is treated as net parent investment for carve out financial statement purposes. GE O&G has accessed third party bank debt when needed to fill its short-term cash needs. GE O&G has not borrowed material amounts from third party banks or the capital markets to fund its operations.
GE O&G has committed credit lines of $200 million that have been extended to it by three banks as of December 31, 2016. As of December 31, 2016, $128 million of these credit facilities remained available for use.
10
GE O&G has undertaken certain transactions with related parties, primarily GE Capital, through which it can monetize its accounts receivable through the sale of these receivable to GE Capital’s Working Capital Solutions. GE O&G monetizes receivables, as and when needed, to generate liquidity without the use of the capital markets. GE O&G pays commission and servicing fees to GE Capital’s Working Capital Solutions for these transactions when they are consummated.
GE O&G believes that cash on hand, cash flows generated from operations and the available credit facility will provide sufficient liquidity to manage its global cash needs.
As of December 31, 2016, $752 million of cash and equivalents were held in bank accounts and cannot be released, transferred or otherwise converted into a currency that is regularly transacted internationally, due to lack of market liquidity, capital controls or similar monetary or exchange limitations limiting the flow of capital out of the jurisdiction.
Cash Flows
The following table summarizes cash flows generated from (used in) each type of activity for each period (in millions):
|
|
GE O&G Fiscal Year Ending
December 31, |
|||||||||||
|
|
2016
|
2015
|
2014
|
|||||||||
|
Operating activities
|
$
|
262
|
$
|
1,277
|
$
|
1,887
|
||||||
|
Investing activities
|
(472
|
)
|
(466
|
)
|
(836
|
)
|
||||||
|
Financing activities
|
(102
|
)
|
(515
|
)
|
(388
|
)
|
||||||
Operating Activities
GE O&G’s largest source of operating cash is payments from customers, of which the largest component is collecting cash related to product or services sales including advance payments or progress collections for work to be performed. The primary use of operating cash is to pay GE O&G’s suppliers, employees, tax authorities and others for a wide range of material and services.
Cash flows from operating activities generated $262 million and $1,277 million for the years ended December 31, 2016 and 2015, respectively. Cash flows from operating activities decreased $1,015 million in 2016 primarily due to the decrease in net income, partially offset by improvements in other working capital categories, due to improvements in the collection of past due receivables, improved inventory management and restructuring.
Cash flows from operating activities generated $1,277 million and $1,887 million for the years ended December 31, 2015 and 2014, respectively. Cash flows from operating activities decreased $610 million in 2015 primarily due to a decrease in progress collections driven by market conditions. This was offset by an improvement in the other working capital categories, primarily receivables and inventory, due to an improvement in collections of past due receivables, improved inventory management and restructuring efforts.
Investing Activities
Cash flows from investing activities used $472 million and $466 million for the years ended December 31, 2016 and 2015, respectively. GE O&G’s principal recurring investing activity is the funding of capital expenditures, including property plant and equipment and software, to support operations. Expenditures for capital assets were $424 million in 2016 and $607 million in 2015. There were no material acquisitions or dispositions in 2016; however, in 2015 GE O&G generated approximately $181 million from business dispositions and utilized $86 million cash in business acquisitions.
Cash flows from investing activities used $466 million and $836 million for the years ended December 31, 2015 and 2014, respectively. Expenditures for capital assets were $607 million and $686 million in 2015 and 2014, respectively. The decline in capital expenditures in 2015 is a result of GE O&G’s rationalization of investments aligned to the lower market activity. In 2014, $592 million was utilized to acquire businesses, primarily Cameron’s Reciprocating Compression division for $550 million. In addition, GE O&G recognized proceeds from the sale of assets of $441 million, primarily from the sale of the Wayne Fueling Systems business of $485 million.
11
Financing Activities
Cash utilized in financing activities for 2016 was $102 million, a decrease of $413 million compared to 2015. This was primarily driven by a net contribution to GE as part of the cash pooling activity that is included in the net transfer (to)/from parent component on the Statement of Cash Flows.
Cash utilized in financing activities for 2015 was $515 million, an increase of $127 million compared to 2014. This was primarily driven by a net transfer to GE as part of the cash pooling activity that is included in the net transfer (to)/from parent component on the Statement of Cash Flows $960 million, partially offset by a change in borrowings of $797 million.
Contractual Obligations
The following table summarizes GE O&G’s significant contractual obligations and other long-term liabilities as of December 31, 2016 (in millions):
|
|
Total
|
Less than
1 year |
2-3 years
|
4-5 years
|
More than
5 years |
|||||||||||||||
|
Long-Term Debt(a)
|
$
|
156
|
$
|
118
|
$
|
35
|
$
|
1
|
$
|
2
|
||||||||||
|
Operating leases(b)
|
516
|
94
|
159
|
109
|
154
|
|||||||||||||||
|
Purchase obligations(c)
|
489
|
479
|
10
|
—
|
—
|
|||||||||||||||
|
Other long term liabilities(d)
|
540
|
48
|
44
|
28
|
420
|
|||||||||||||||
| (a) |
Represents principal amount of long-term debt, including current maturities. The interest on this debt is between $1-2 million per year and reflected in the table above in long-term debt.
|
| (b) |
Amounts represent the future minimum payments under noncancelable operating leases with an initial term of one year or more. GE O&G does not include options unless exercise of that option is anticipated.
|
| (c) |
Represents purchase orders for goods and services utilized in the normal course of business.
|
| (d) |
Includes capital lease obligations, capital expenditures and pension funding obligations. The following non-current liabilities are excluded from the table above: derivatives, deferred revenue and other miscellaneous items. For further information on certain of these items, see Note 11, Borrowings, Note 13, All Other Liabilities, and Note 19, Commitments and Product Warranties to the GE O&G combined financial statements included in Exhibit 99.3 to this Current Report on Form 8-K. See Note 14, Income Taxes, to the GE O&G combined financial statements included in Exhibit 99.3 to this Current Report on Form 8-K for disclosures surrounding uncertain income tax positions. Additionally, liabilities for uncertain tax positions totaling $149 million, including interest and penalties, are not included in the table because the timing of their resolution cannot be estimated.
|
Other Factors Affecting Liquidity
Customer receivables: In line with industry practice, GE O&G may bill its customers for services provided in arrears dependent upon contractual terms. In a challenging economic environment, GE O&G may experience delays in the payment of its invoices due to customers’ lower cash flow from operations or their more limited access to credit markets. While historically there have not been material non-payment events, GE O&G attempts to mitigate this risk through the sale of its receivables in monetization programs or working with its customers to restructure their debts; however, not all countries and programs allow monetization on a non-recourse basis. A customer’s failure or delay in payment could have a material adverse effect on GE O&G’s short-term liquidity and results from operations. As of December 31, 2016, GE O&G has no customer balances which exceed 10% of GE O&G’s net customer receivables.
12
International operations: GE O&G’s cash that is held outside the United States, which comprised 90% of the total cash balance as of December 31, 2016, is in certain circumstances subject to exchange or cash controls that could make it challenging to quickly access. As a result, GE O&G’s cash balance may not represent its ability to quickly and efficiently use this cash.
Off Balance Sheet Commitments
In addition to the above-referenced contractual obligations, GE O&G has additional contractual commitments and other commitments that are not necessarily reflected in GE O&G’s consolidated balance sheet. Such commitments as of December 31, 2016 are as follows:
Guarantees Related to Operating Activities
Commitments relate mainly to guarantees or counter-guarantees given by banks and insurance companies to various customers in connection with ongoing contracts to secure due and proper performance of the contracts or following the payment of retention guarantees and advance billings of $48 million as of December 31, 2016.
Quantitative and Qualitative Disclosures about Market Risk
Cash Flow Hedges
GE O&G’s business involves buying, manufacturing and selling components and products across global markets. These activities expose GE O&G to changes in foreign currency exchange rates, commodity prices and interest rates which can adversely affect revenues earned and costs of its operating businesses. When the currency in which equipment is sold differs from the primary currency of the legal entity and the exchange rate fluctuates, it will affect the revenue earned on the sale. These sales and purchase transactions also create receivables and payables denominated in foreign currencies and exposure to foreign currency gains and losses based on changes in exchange rates. Changes in the price of raw materials used in manufacturing can affect the cost of manufacturing. GE O&G uses derivatives to mitigate or eliminate these exposures, where appropriate.
GE O&G uses cash flow hedging primarily to reduce or eliminate the effects of foreign currency exchange rate changes on purchase and sale contracts. Accordingly, most derivative activity in this category consists of currency exchange contracts. GE O&G had outstanding foreign currency forward contracts with notional amounts aggregating $6,430 million and $8,017 million to hedge exposure to currency fluctuations in various foreign currencies at December 31, 2016 and 2015, respectively. Based on quoted market prices as of December 31, 2016 or 2015 for forward contracts with similar terms and maturity dates, GE O&G recorded losses, both realized and unrealized in nature, of $273 million and $117 million, respectively, to adjust these forward contracts to their fair market value. As at December 31, 2016 GE O&G estimates that a 1% appreciation or depreciation in the U.S. dollar would result in impact of approximately $10 million to the financial results of GE O&G, as GE O&G is generally able to mitigate its foreign exchange exposure, where there are liquid financial markets, through use of foreign currency derivative transactions.
Changes in and Disagreements with Accountants and Financial Disclosure
None.
Critical Accounting Estimates
Accounting estimates and assumptions discussed in this section are those considered to be the most critical to an understanding of GE O&G’s financial statements because they involve significant judgments and uncertainties. Many of these estimates include determining fair value. These estimates reflect GE O&G’s best judgment about current, and for some estimates future, economic and market conditions and their potential effects based on information available as of the date of these financial statements. If these conditions change from those expected, it is reasonably possible that the judgments and estimates described below could change, which may result in future impairments of goodwill, intangibles and long-lived assets, increases in reserves for contingencies, establishment of valuation allowances on deferred tax assets and increased tax liabilities, among other effects. Also, see Note 2, Accounting Policies to the consolidated financial statements, which discusses GE O&G’s most significant accounting policies.
13
Revenue Recognition on Long-Term Product Services Agreements
Revenue recognition on long-term product services agreements requires estimates of profits over the multiple-year terms of such agreements, considering factors such as the frequency and extent of future monitoring, maintenance and overhaul events, the amount of personnel, spare parts and other resources required to perform the services, and future billing rate, cost changes and customers’ utilization of assets. GE O&G routinely reviews estimates under product services agreements and regularly revises them to adjust for changes in the outlook for revenue recognition.
GE O&G also regularly assesses customer credit risk inherent in the carrying amounts of receivables, contract costs and estimated earnings, including the risk that contractual penalties may not be sufficient to offset its accumulated investment in the event of customer termination. GE O&G gains insight into future utilization and cost trends, as well as credit risk, through its knowledge of the installed base of equipment and the close interaction with its customers that comes with supplying critical services and parts over extended periods. Revisions, after applying the cumulative catch-up basis of accounting, may affect a product services agreement’s total estimated profitability, resulting in an adjustment of earnings; such adjustments increased earnings by $293 million, $256 million and $145 million in the years ending December 31, 2016, 2015 and 2014, respectively. GE O&G provides for probable losses when they become evident. GE O&G continues to evaluate the provisions of ASC 605-35, Revenue from Contracts with Customers, and the assessment of the impact, on GE O&G’s combined financial statements and related disclosures. Also, see Note 2 to the consolidated financial statements for additional information and disclosure.
Goodwill and Other Identified Intangible Assets
GE O&G tests goodwill for impairment annually using data as of July 1 of that year. The impairment test consists of two different steps: in step one, the carrying value of the reporting unit is compared with its fair value; in step two, which is applied when the carrying value is more than its fair value, the amount of goodwill impairment, if any, is derived by deducting the fair value of the reporting unit’s assets and liabilities from the fair value of its equity and comparing that amount with the carrying amount of goodwill. GE O&G determines fair values of each of the reporting units using the market approach, when available and appropriate, or the income approach, or a combination of both. GE O&G assesses the valuation methodology based upon the relevance and availability of the data at the time the valuation is performed.
Pension Assumptions
Pension benefits are calculated using significant inputs to the actuarial models that measure pension benefit obligations and related effects on operations. Two assumptions, discount rate and expected return on assets, are important elements of plan expense and asset/liability measurement. GE O&G evaluates these critical assumptions at least annually on a plan- and country-specific basis. GE O&G periodically evaluates other assumptions involving demographic factors such as retirement age, mortality and turnover, and updates them to reflect its experience and expectations for the future. Actual results in any given year will often differ from actuarial assumptions because of economic and other factors.
Projected benefit obligations are measured as the present value of expected payments discounted using the weighted average of market-observed yields for high-quality fixed-income securities with maturities that correspond to the payment of benefits; lower discount rates increase present values and subsequent-year pension expense and higher discount rates decrease present values and subsequent-year pension expense.
GE O&G’s discount rates for principal pension plans at December 31, 2016, 2015 and 2014 were 3.41%, 3.83% and 3.69%, respectively, reflecting market interest rates. GE O&G’s expected return on assets at December 31, 2016, 2015 and 2014 were 6.86%, 6.91%, and 6.66%, respectively. The discount rate and expected return on assets have not changed significantly from our December 31, 2016 assumptions.
14
Income Taxes
We operate in more than 120 countries and our annual tax rate is based on our income, statutory tax rates and tax planning opportunities available to us in these various jurisdictions. Tax laws are complex and subject to different interpretations by the taxpayer and respective governmental taxing authorities. Our income tax rate is impacted by the tax rate on our global operations. In addition to local country tax laws and regulations, this rate depends on the extent earnings are indefinitely reinvested outside the United States. Indefinite reinvestment is determined by future operations of the Business. At December 31, 2016 and 2015, approximately $11,936 million and $11,204 million of earnings, respectively, have been indefinitely reinvested outside the United States. Most of these earnings have been reinvested in active non-U.S. business operations, and we do not intend to repatriate these earnings to fund U.S. operations. Because of the availability of U.S. foreign tax credits, it is not practicable to determine the U.S. federal income tax liability that would be payable if such earnings were not reinvested indefinitely.
Deferred income tax assets represent amounts available to reduce income taxes payable in future years. We evaluate the recoverability of these future deductions and credits by assessing the adequacy of future taxable income from all sources, including reversal of taxable temporary differences, forecasted operating earnings and available tax planning strategies. These sources of income rely heavily on estimates. We use our historical experience and short- and long-range business forecasts to provide insight. Further, our global business gives us the opportunity to employ various prudent and feasible tax planning strategies to facilitate the recoverability of future deductions.
Our tax filings routinely are subject to audit by the tax authorities in the jurisdictions where we conduct business. These audits may result in assessments of additional taxes that are resolved with the tax authorities or through the courts. We have provided for the amounts we believe will ultimately result from these proceedings, but settlements of issues raised in these audits may affect our tax rate.
GE O&G has $94 million of gross unrecognized tax benefits at December 31, 2016, of which an immaterial amount may require a cash payment. GE O&G is not able to reasonably estimate in which future periods these amounts ultimately will be settled and paid.
Derivatives and Hedging
GE O&G operates in more than 120 countries and are subject to market risks primarily associated with changes in foreign currency exchange rates. GE O&G maintains a foreign-currency risk management strategy that uses derivative instruments to protect its interests from unanticipated fluctuations in earnings and cash flows caused by volatility in currency exchange rates. Foreign currency forward contracts provide a hedge against currency fluctuations on monetary assets/liabilities and future committed cash flows denominated in other than a functional currency.
GE O&G had outstanding foreign currency forward contracts with notional amounts aggregating $6,430 million and $8,017 million to hedge exposure to currency fluctuations in various foreign currencies at December 31, 2016 and 2015, respectively. Based on quoted market prices as of December 31, 2016, 2015 and 2014, for forward contracts with similar terms and maturity dates, GE O&G records losses of $273 million, $117 million and $109 million, respectively, to adjust these forward contracts to their fair market value. Also, see Note 18, Derivatives to the consolidated financial statements, which has additional details on GE O&G’s strategy.
Other Loss Contingencies
Other loss contingencies are uncertain and unresolved matters that arise in the ordinary course of business and result from events or actions by others that have the potential to result in a future loss. Such contingencies include, but are not limited to, environmental obligations, litigation, regulatory proceedings, product quality and losses resulting from other events and developments.
When a loss is considered probable and reasonably estimable, a liability is recorded in the amount of GE O&G’s best estimate for the ultimate loss. When there appears to be a range of possible costs with equal likelihood, liabilities are based on the low end of such range. However, the likelihood of a loss, with respect to a contingency, is often difficult to predict and determining a meaningful estimate of the loss or a range of loss may not be practicable based on the information available and the potential effect of future events and decisions by third parties that will determine the ultimate resolution of the contingency.
15
Moreover, it is not uncommon for such matters to be resolved over many years, during which time relevant developments and new information must be continuously evaluated to determine both the likelihood of potential loss and whether it is possible to reasonably estimate a range of possible loss. When a loss is probable but a reasonable estimate cannot be made, disclosure is provided.
Disclosure is also provided when it is reasonably possible that a loss will be incurred or when it is reasonably possible that the amount of a loss will exceed the recorded provision. GE O&G regularly reviews all contingencies to determine whether the likelihood of loss has changed and to assess whether a reasonable estimate of the loss, or range of loss, can be made. As discussed above, development of a meaningful estimate of loss or a range of potential loss is complex when the outcome is directly dependent on negotiations with, or decisions by, third parties, such as regulatory agencies, the court system and other interested parties. Such factors bear directly on whether it is possible to reasonably estimate a range of potential loss and boundaries of high and low estimates.
16