Attached files
| file | filename |
|---|---|
| 10-K - FORM 10-K - ARETE INDUSTRIES INC | arete_10k-123116.htm |
| EX-32.2 - EXHIBIT 32.2 - ARETE INDUSTRIES INC | ex32x2.htm |
| EX-32.1 - EXHIBIT 32.1 - ARETE INDUSTRIES INC | ex32x1.htm |
| EX-31.2 - EXHIBIT 31.2 - ARETE INDUSTRIES INC | ex31x2.htm |
| EX-31.1 - EXHIBIT 31.1 - ARETE INDUSTRIES INC | ex31x1.htm |
Exhibit 99.1
Arete Industries, Inc.
Year-End 2016 Reserve Report
SEC Pricing
Prepared by:
Richard J. Morrow, PE
Pinnacle Energy Services, LLC
9420 Cedar Lake Ave
Oklahoma City, Oklahoma 73114


May 15, 2017
Arete Industries, Inc.
1410 High Street
Denver, CO 80218
Attn: Mr. Tristan Farel
|
|
Re:
|
Reserve and Economic Evaluation
Arete Industries, Inc.
Year-End 2016 SEC Pricing
|
Executive Summary
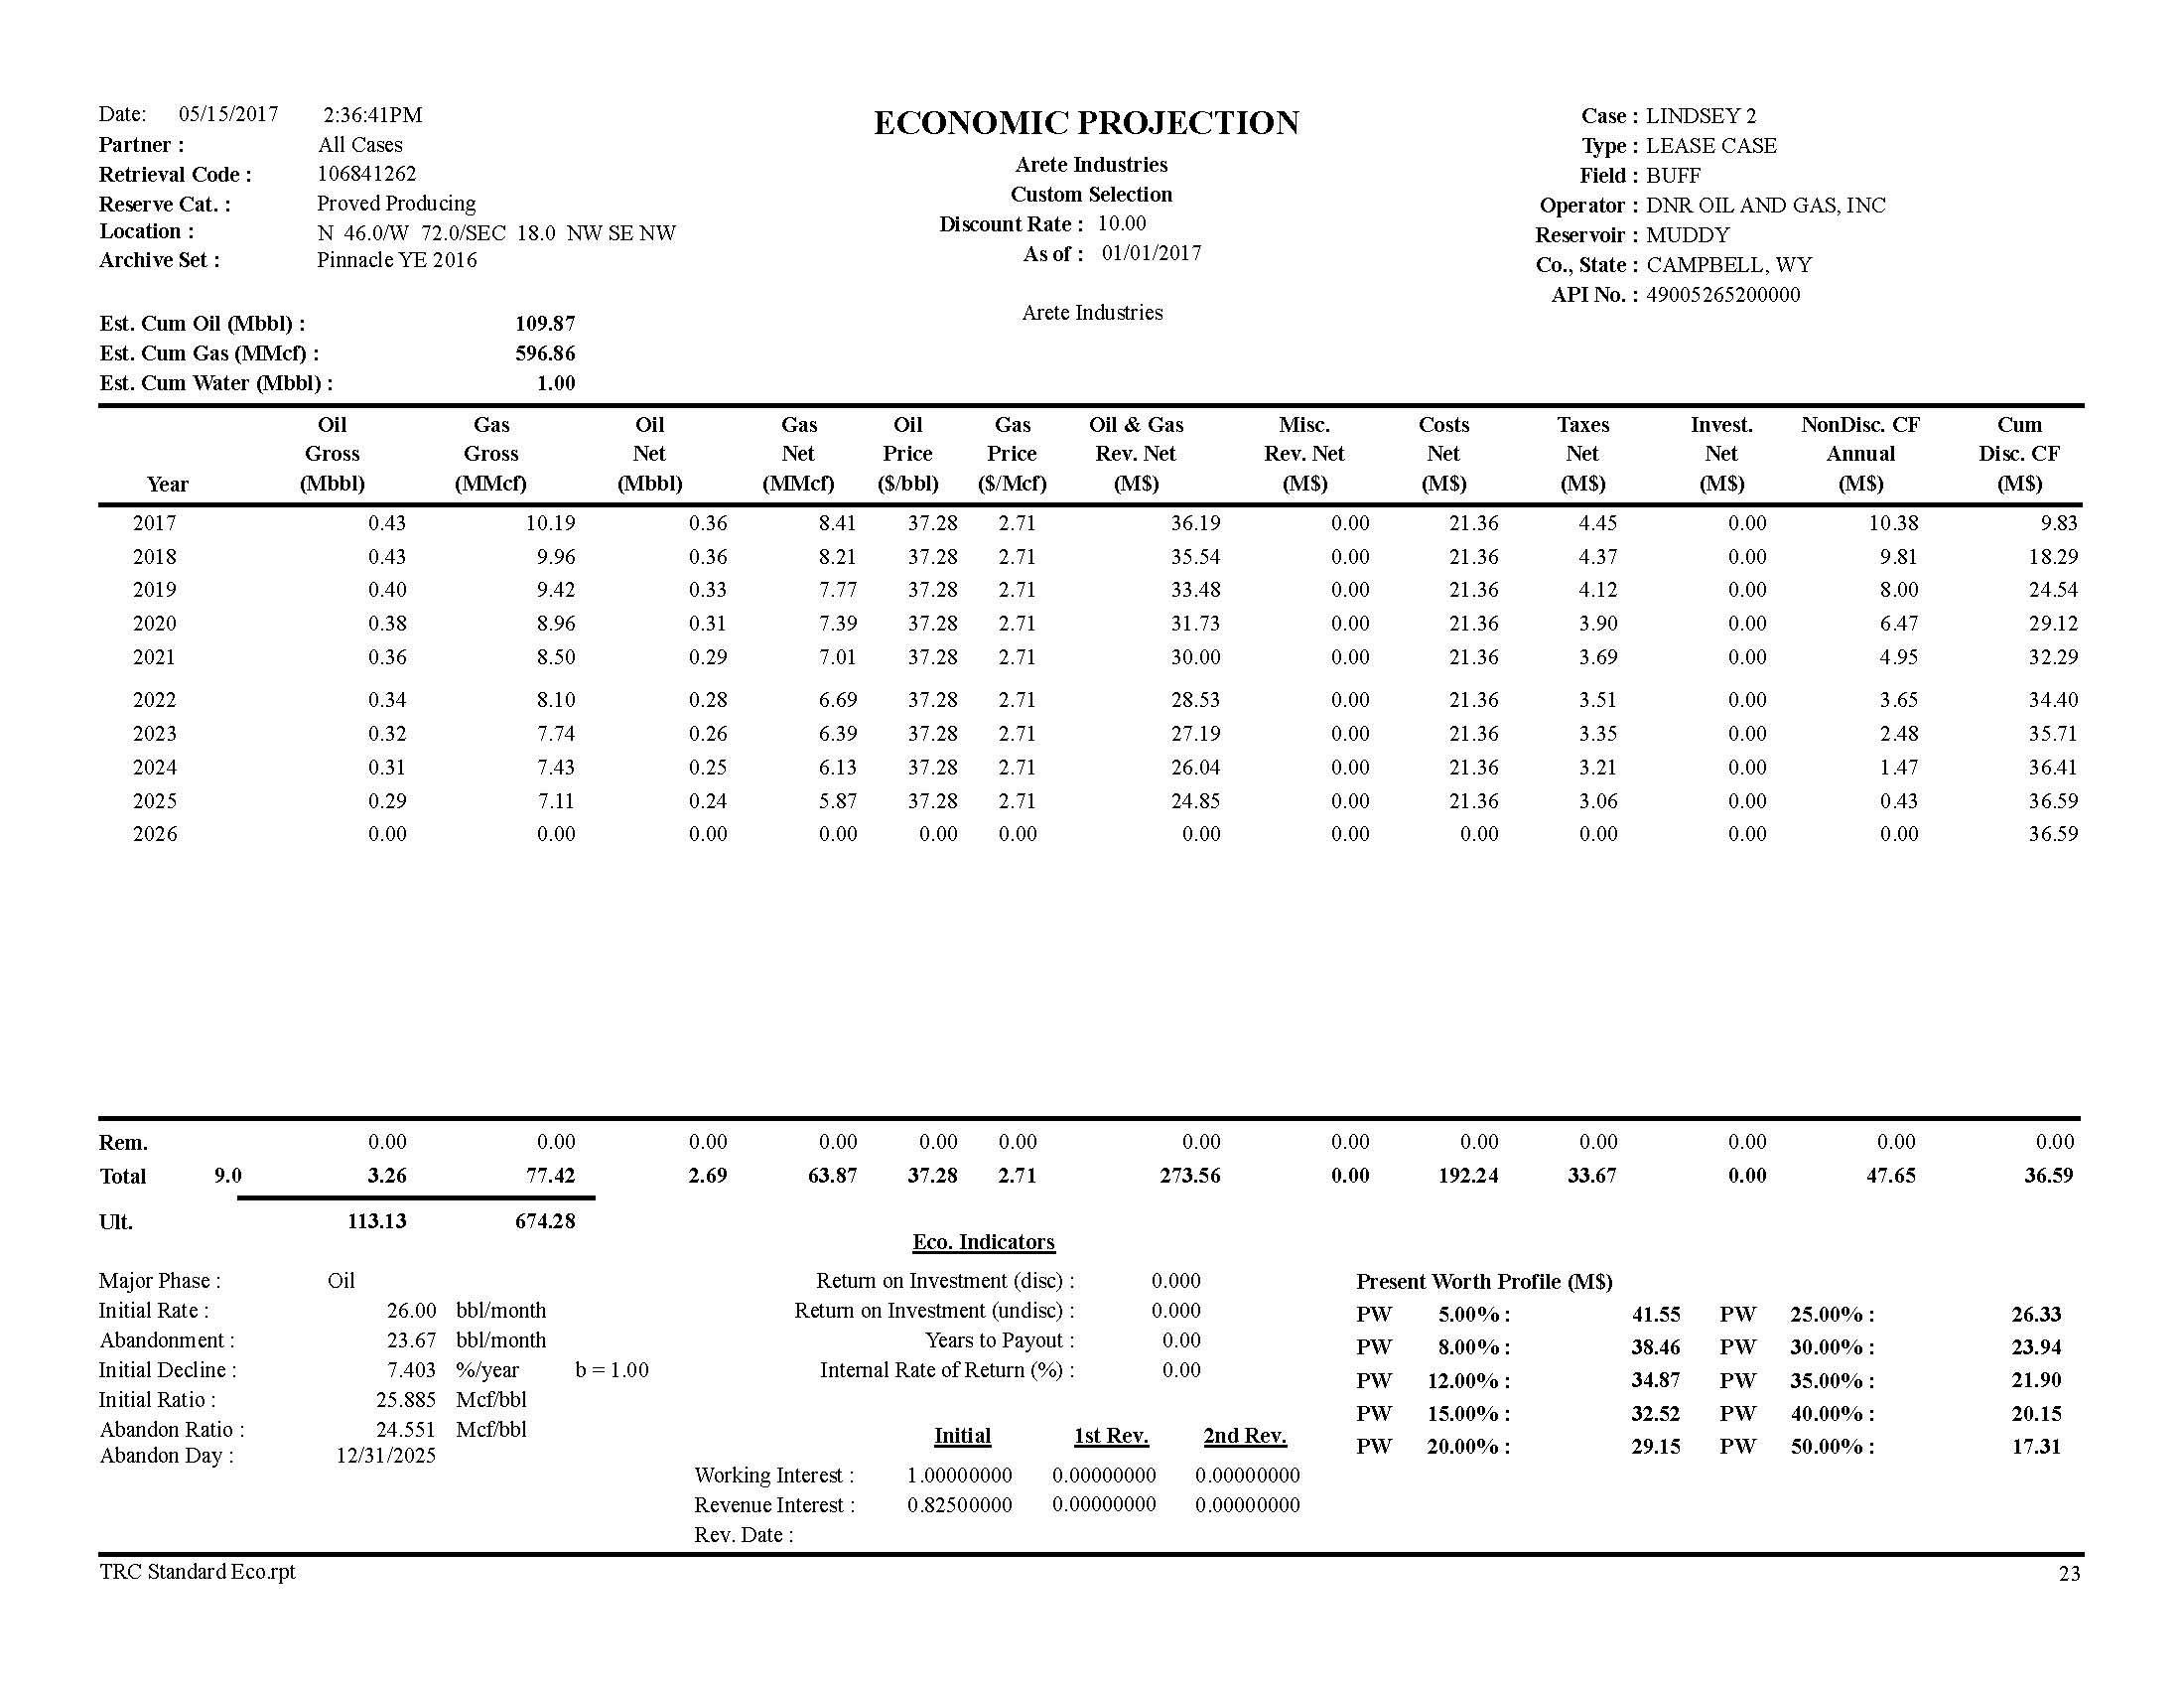
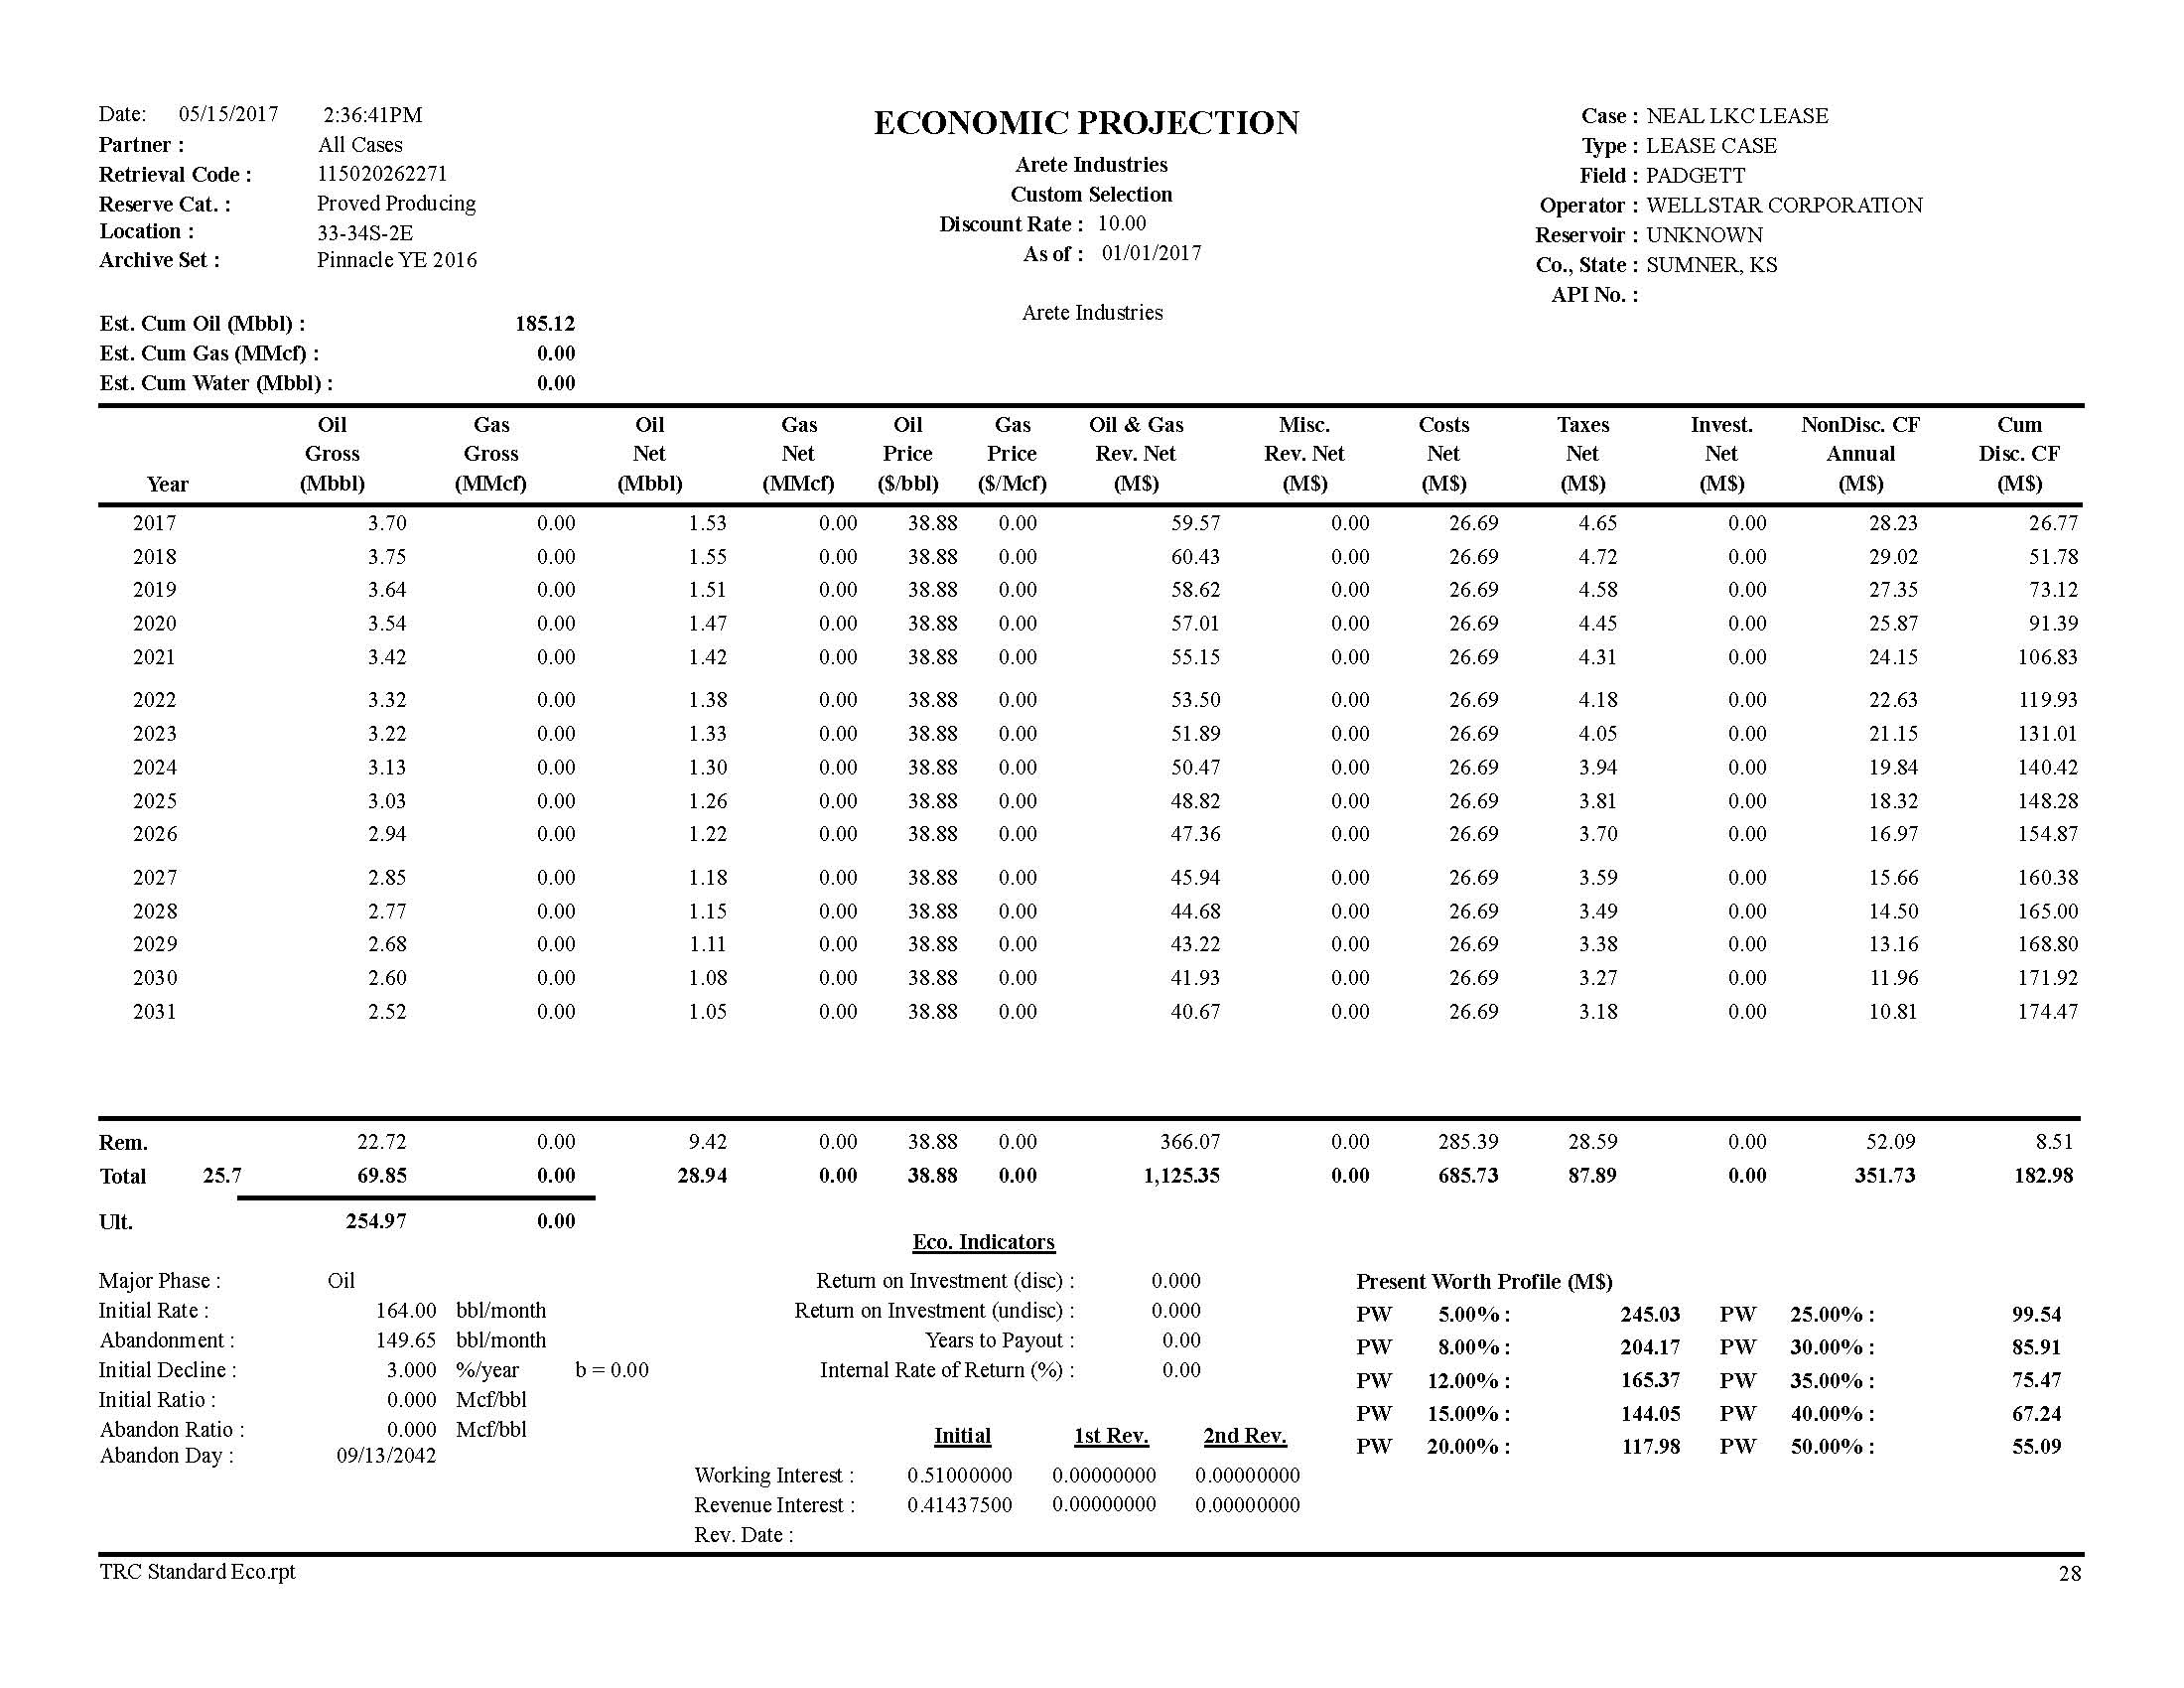
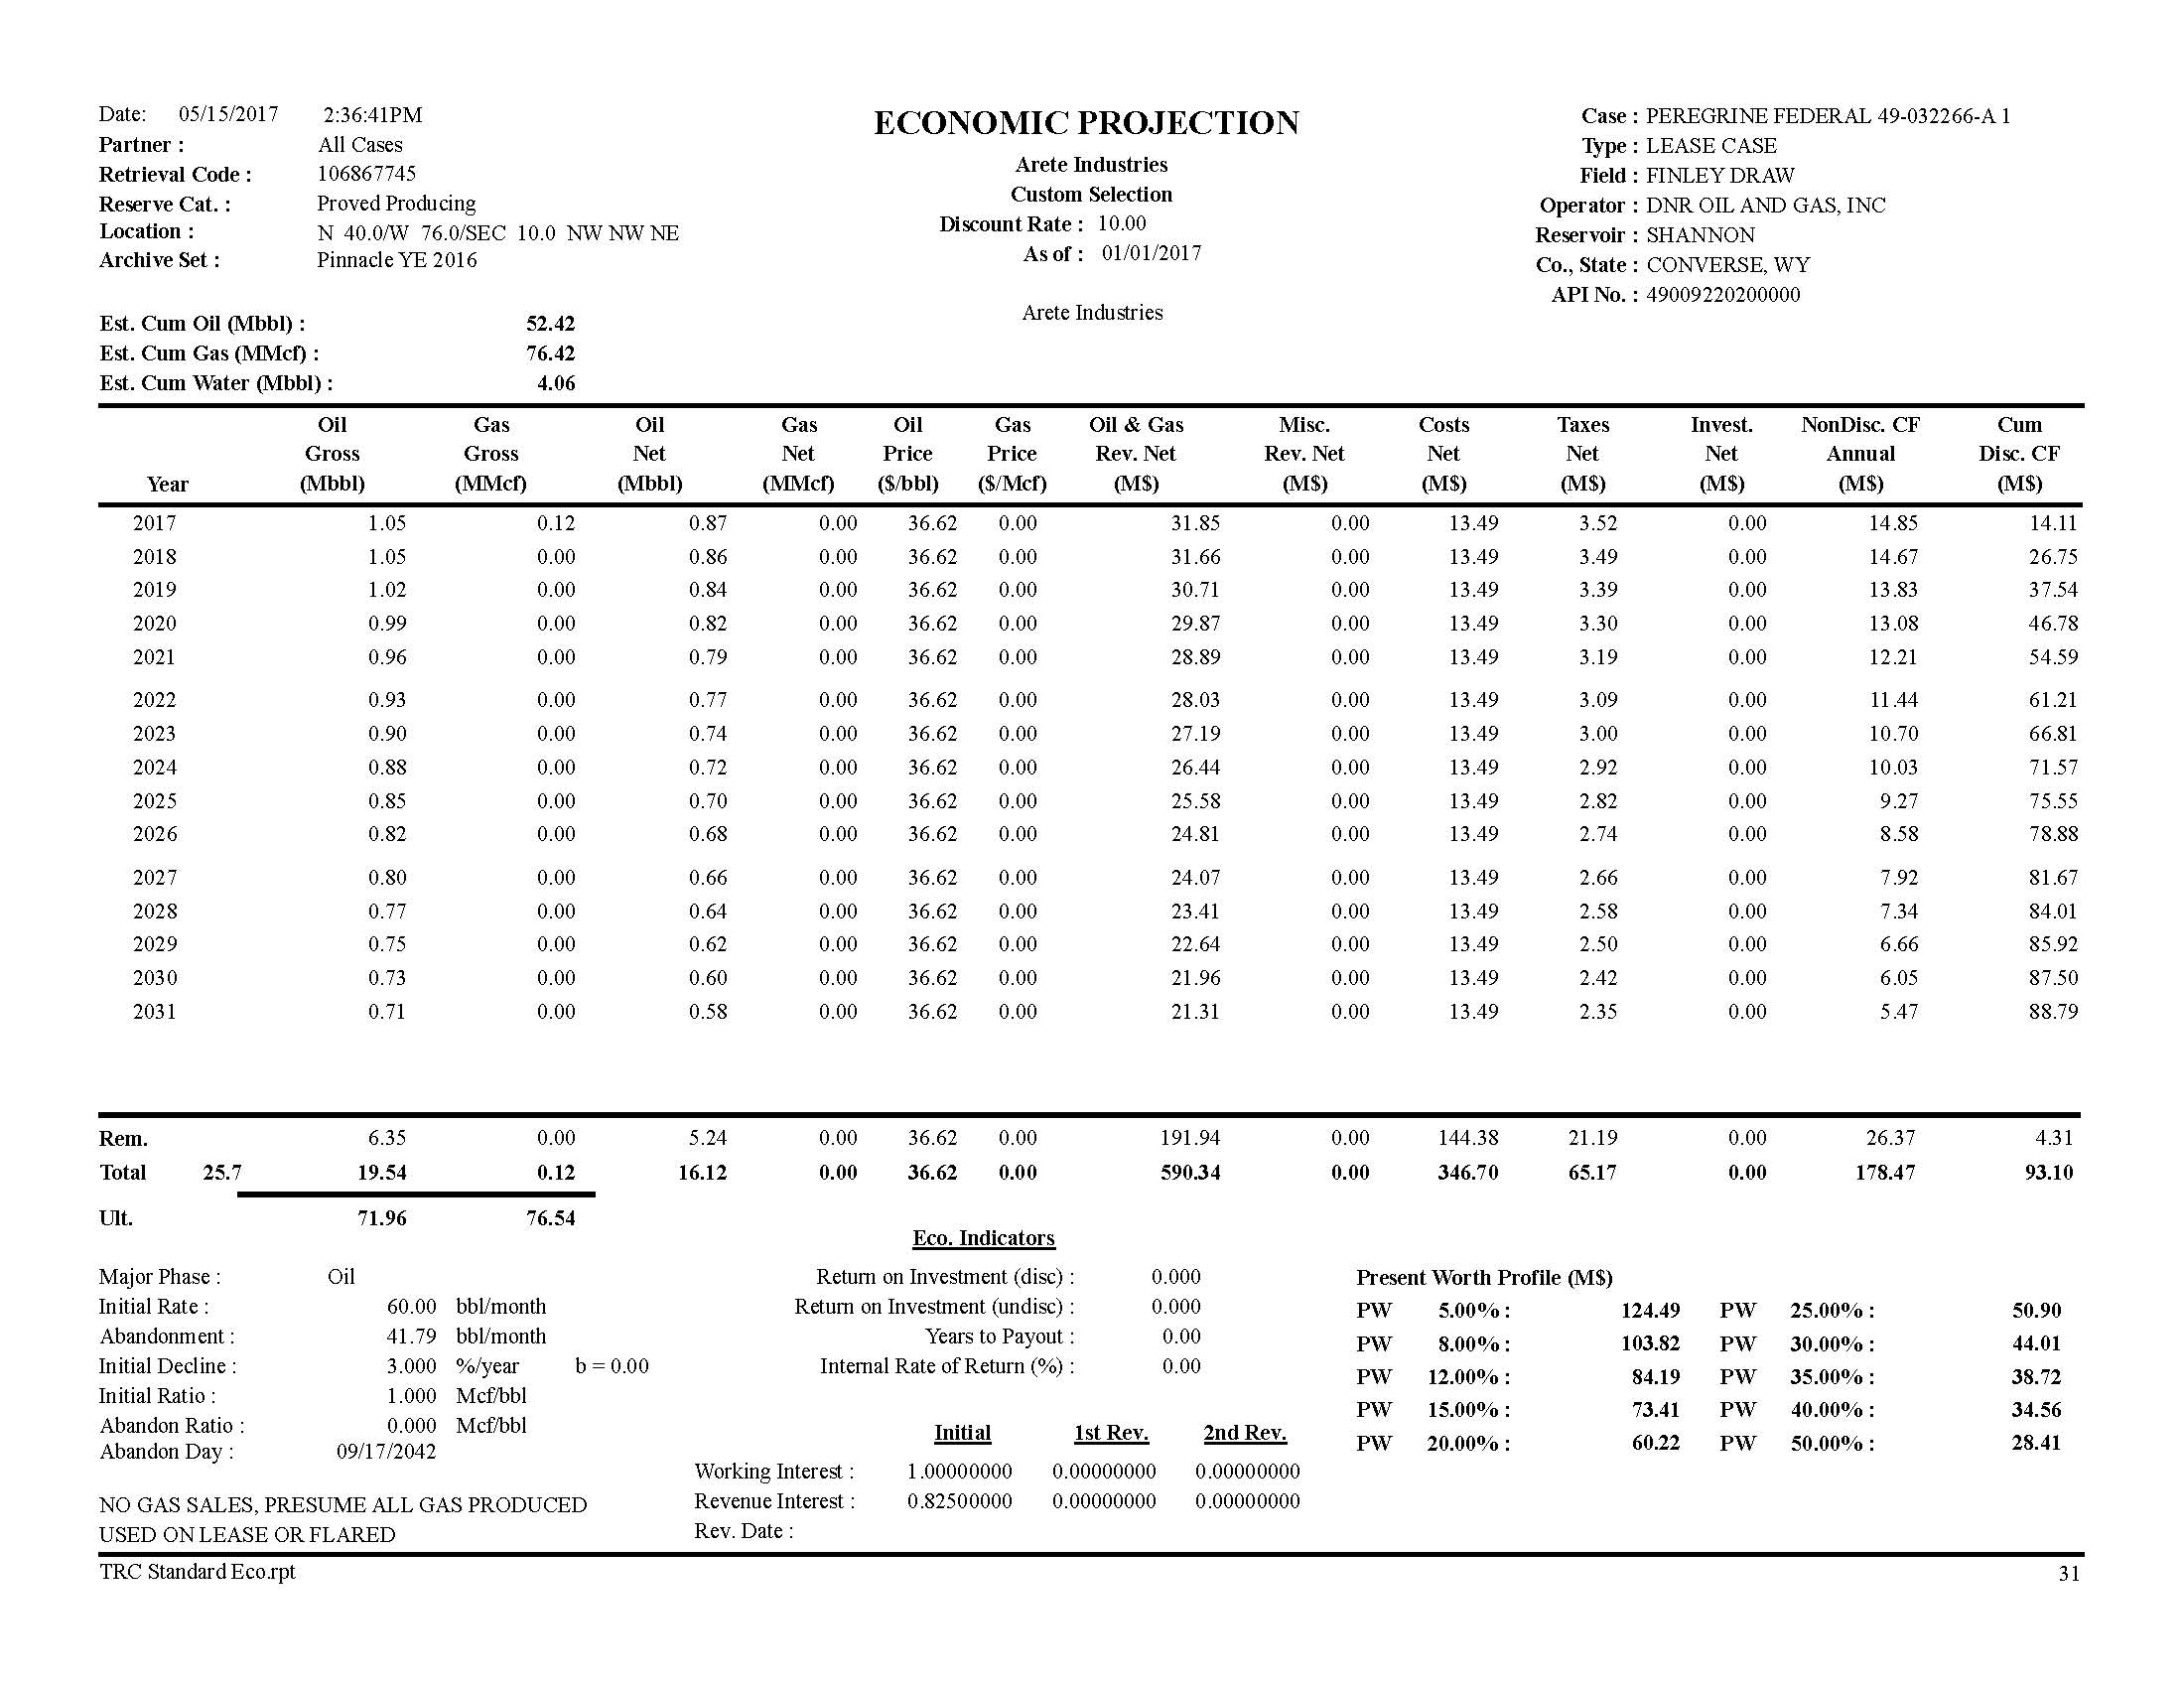
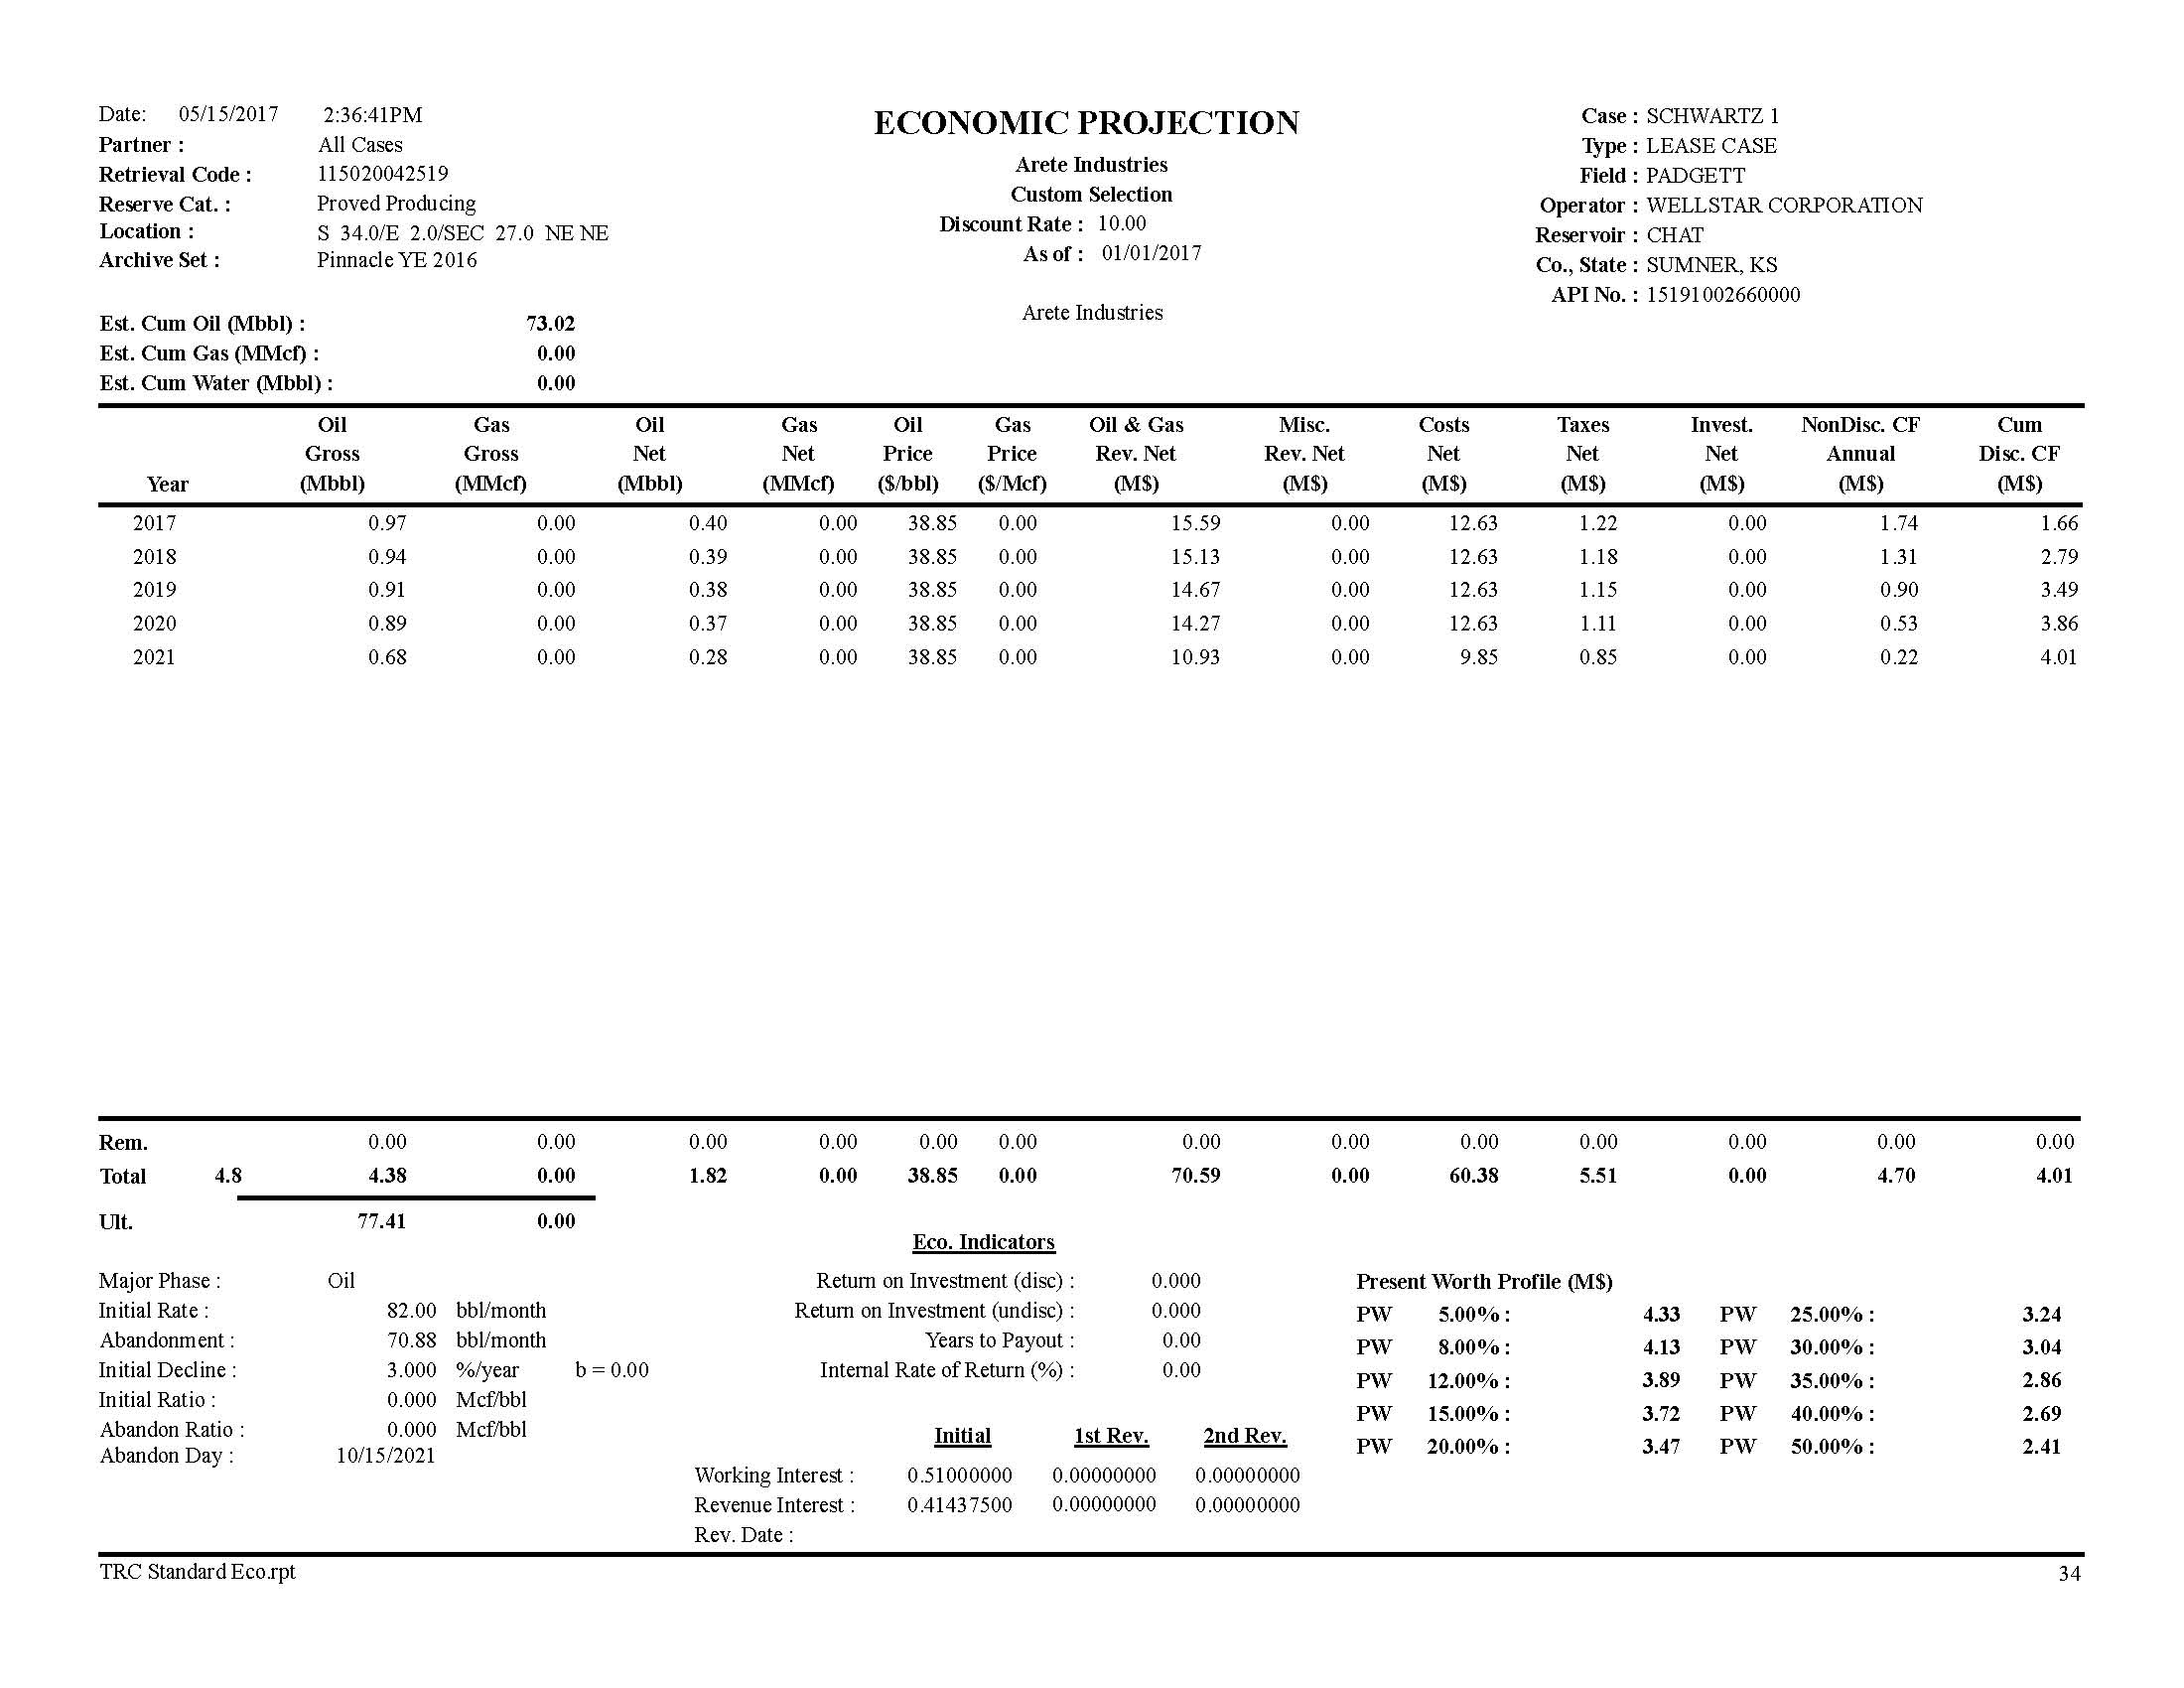
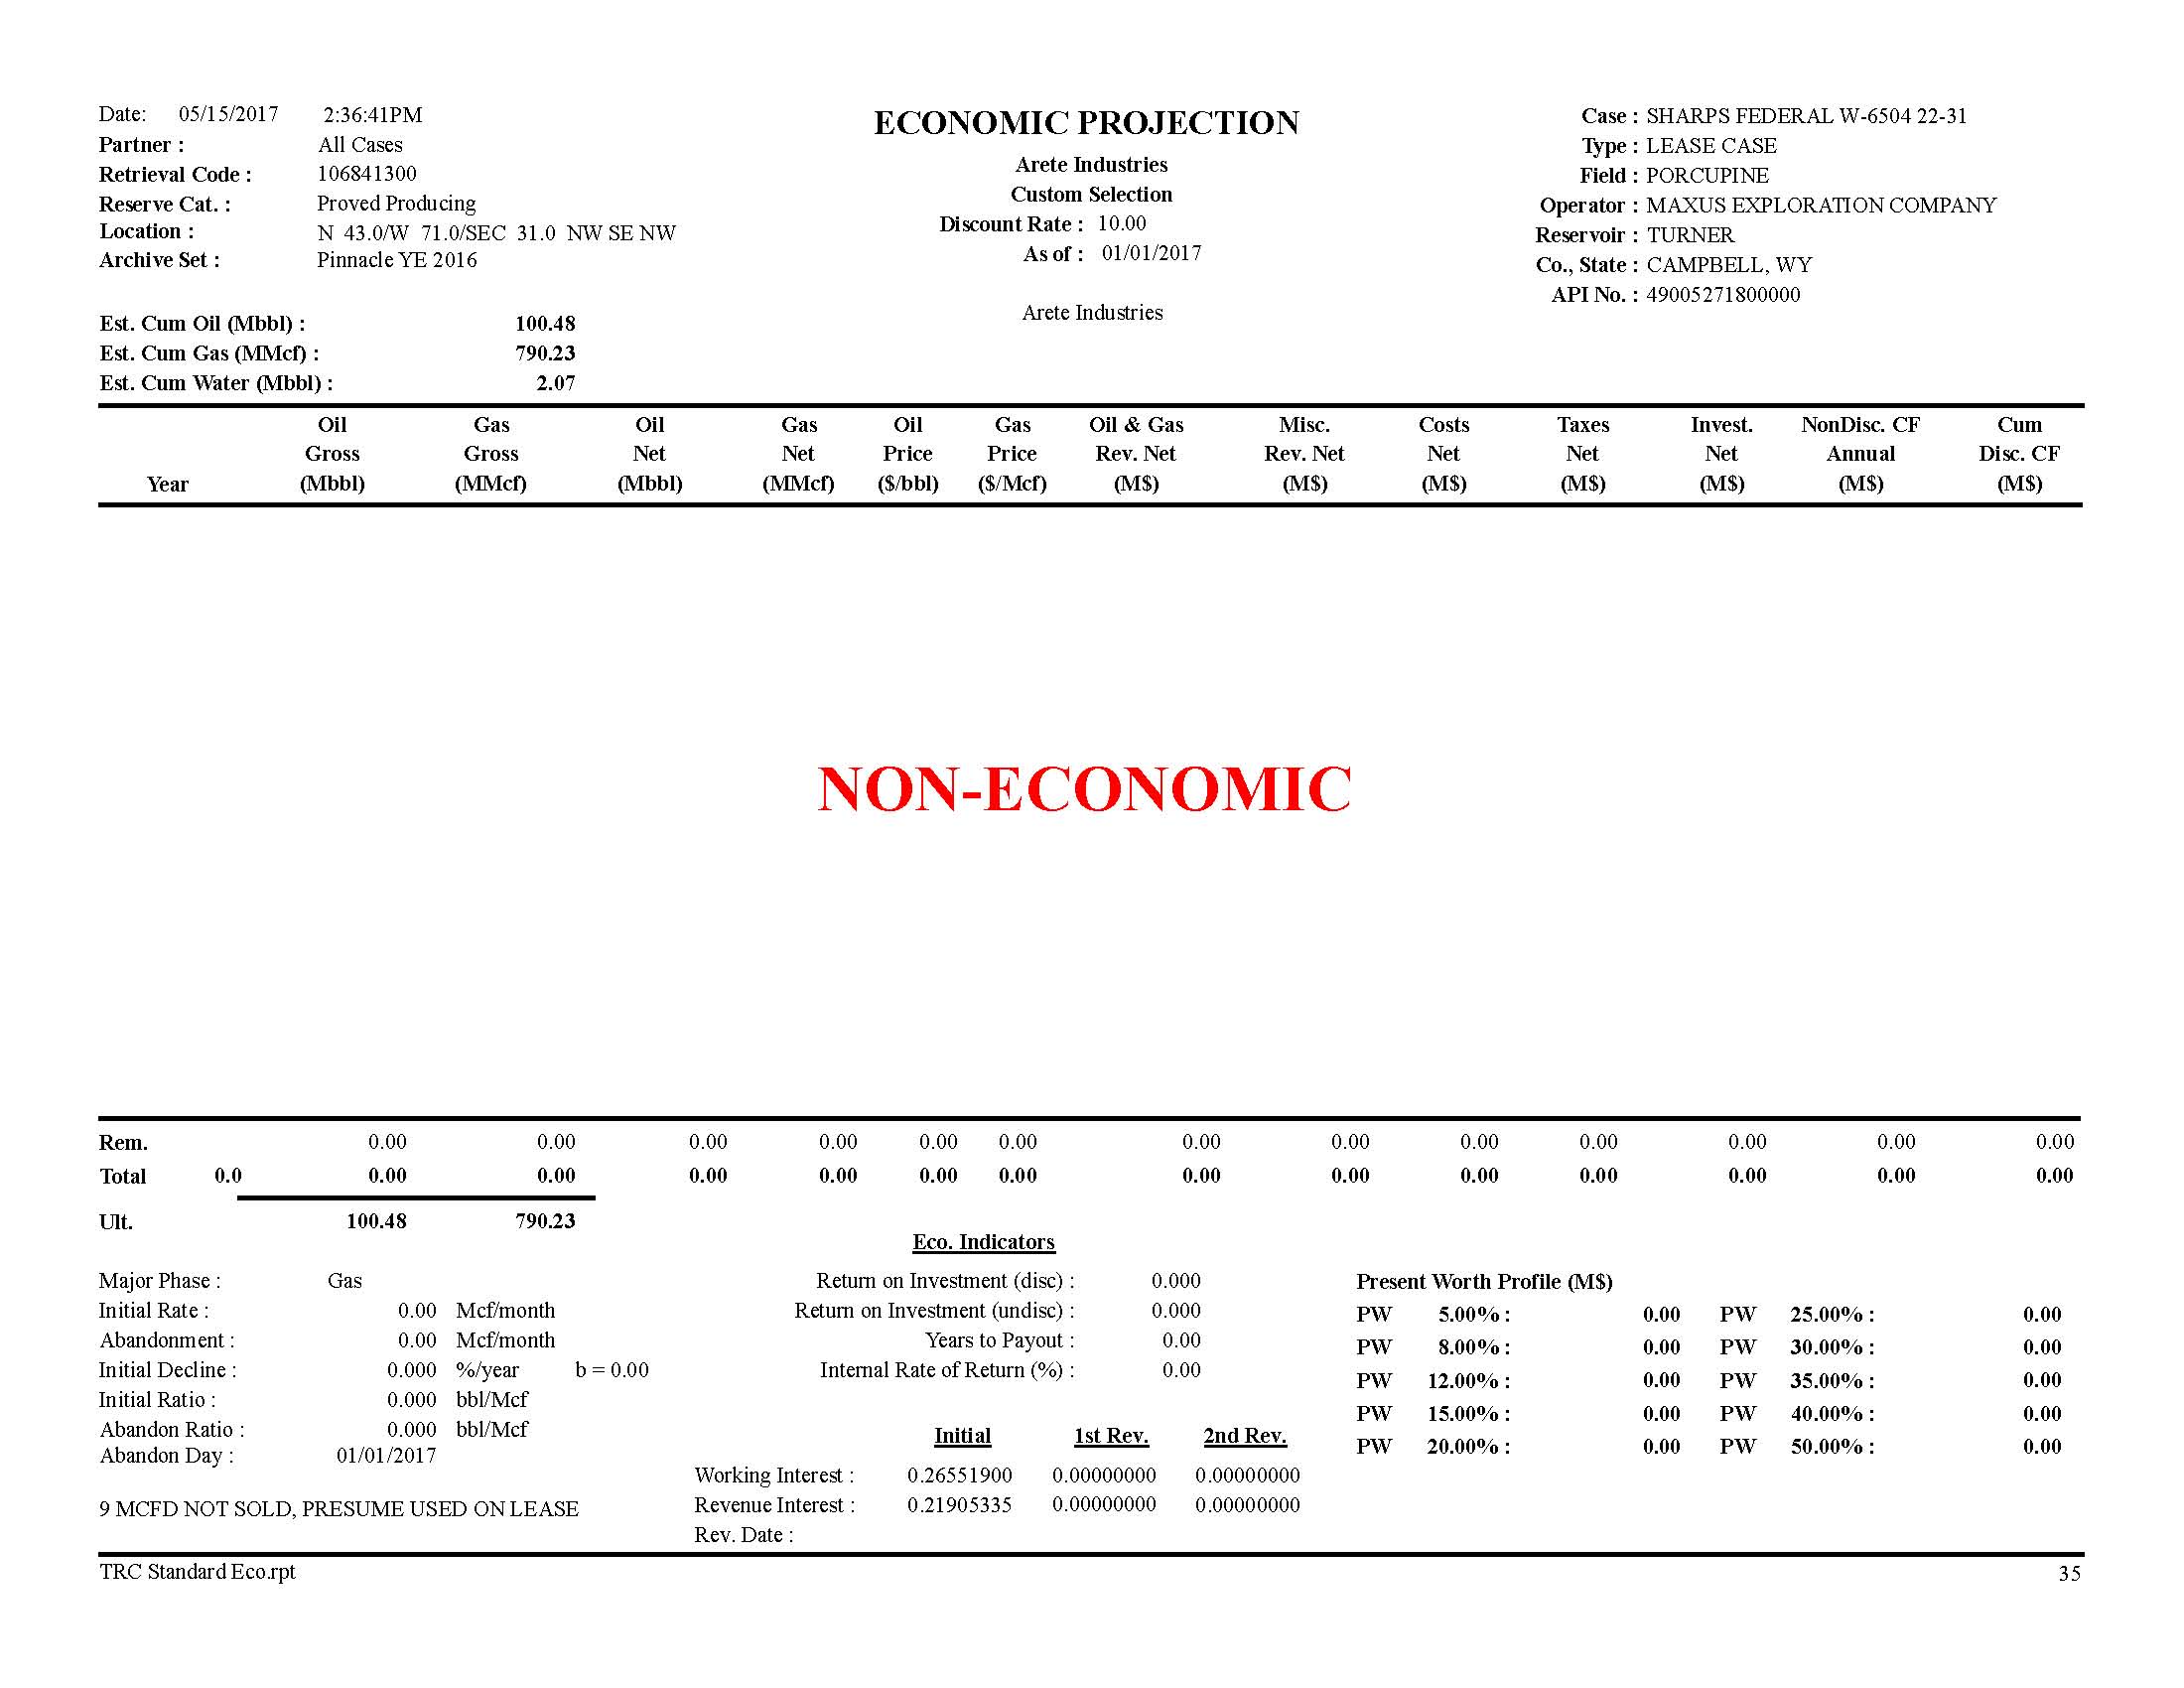
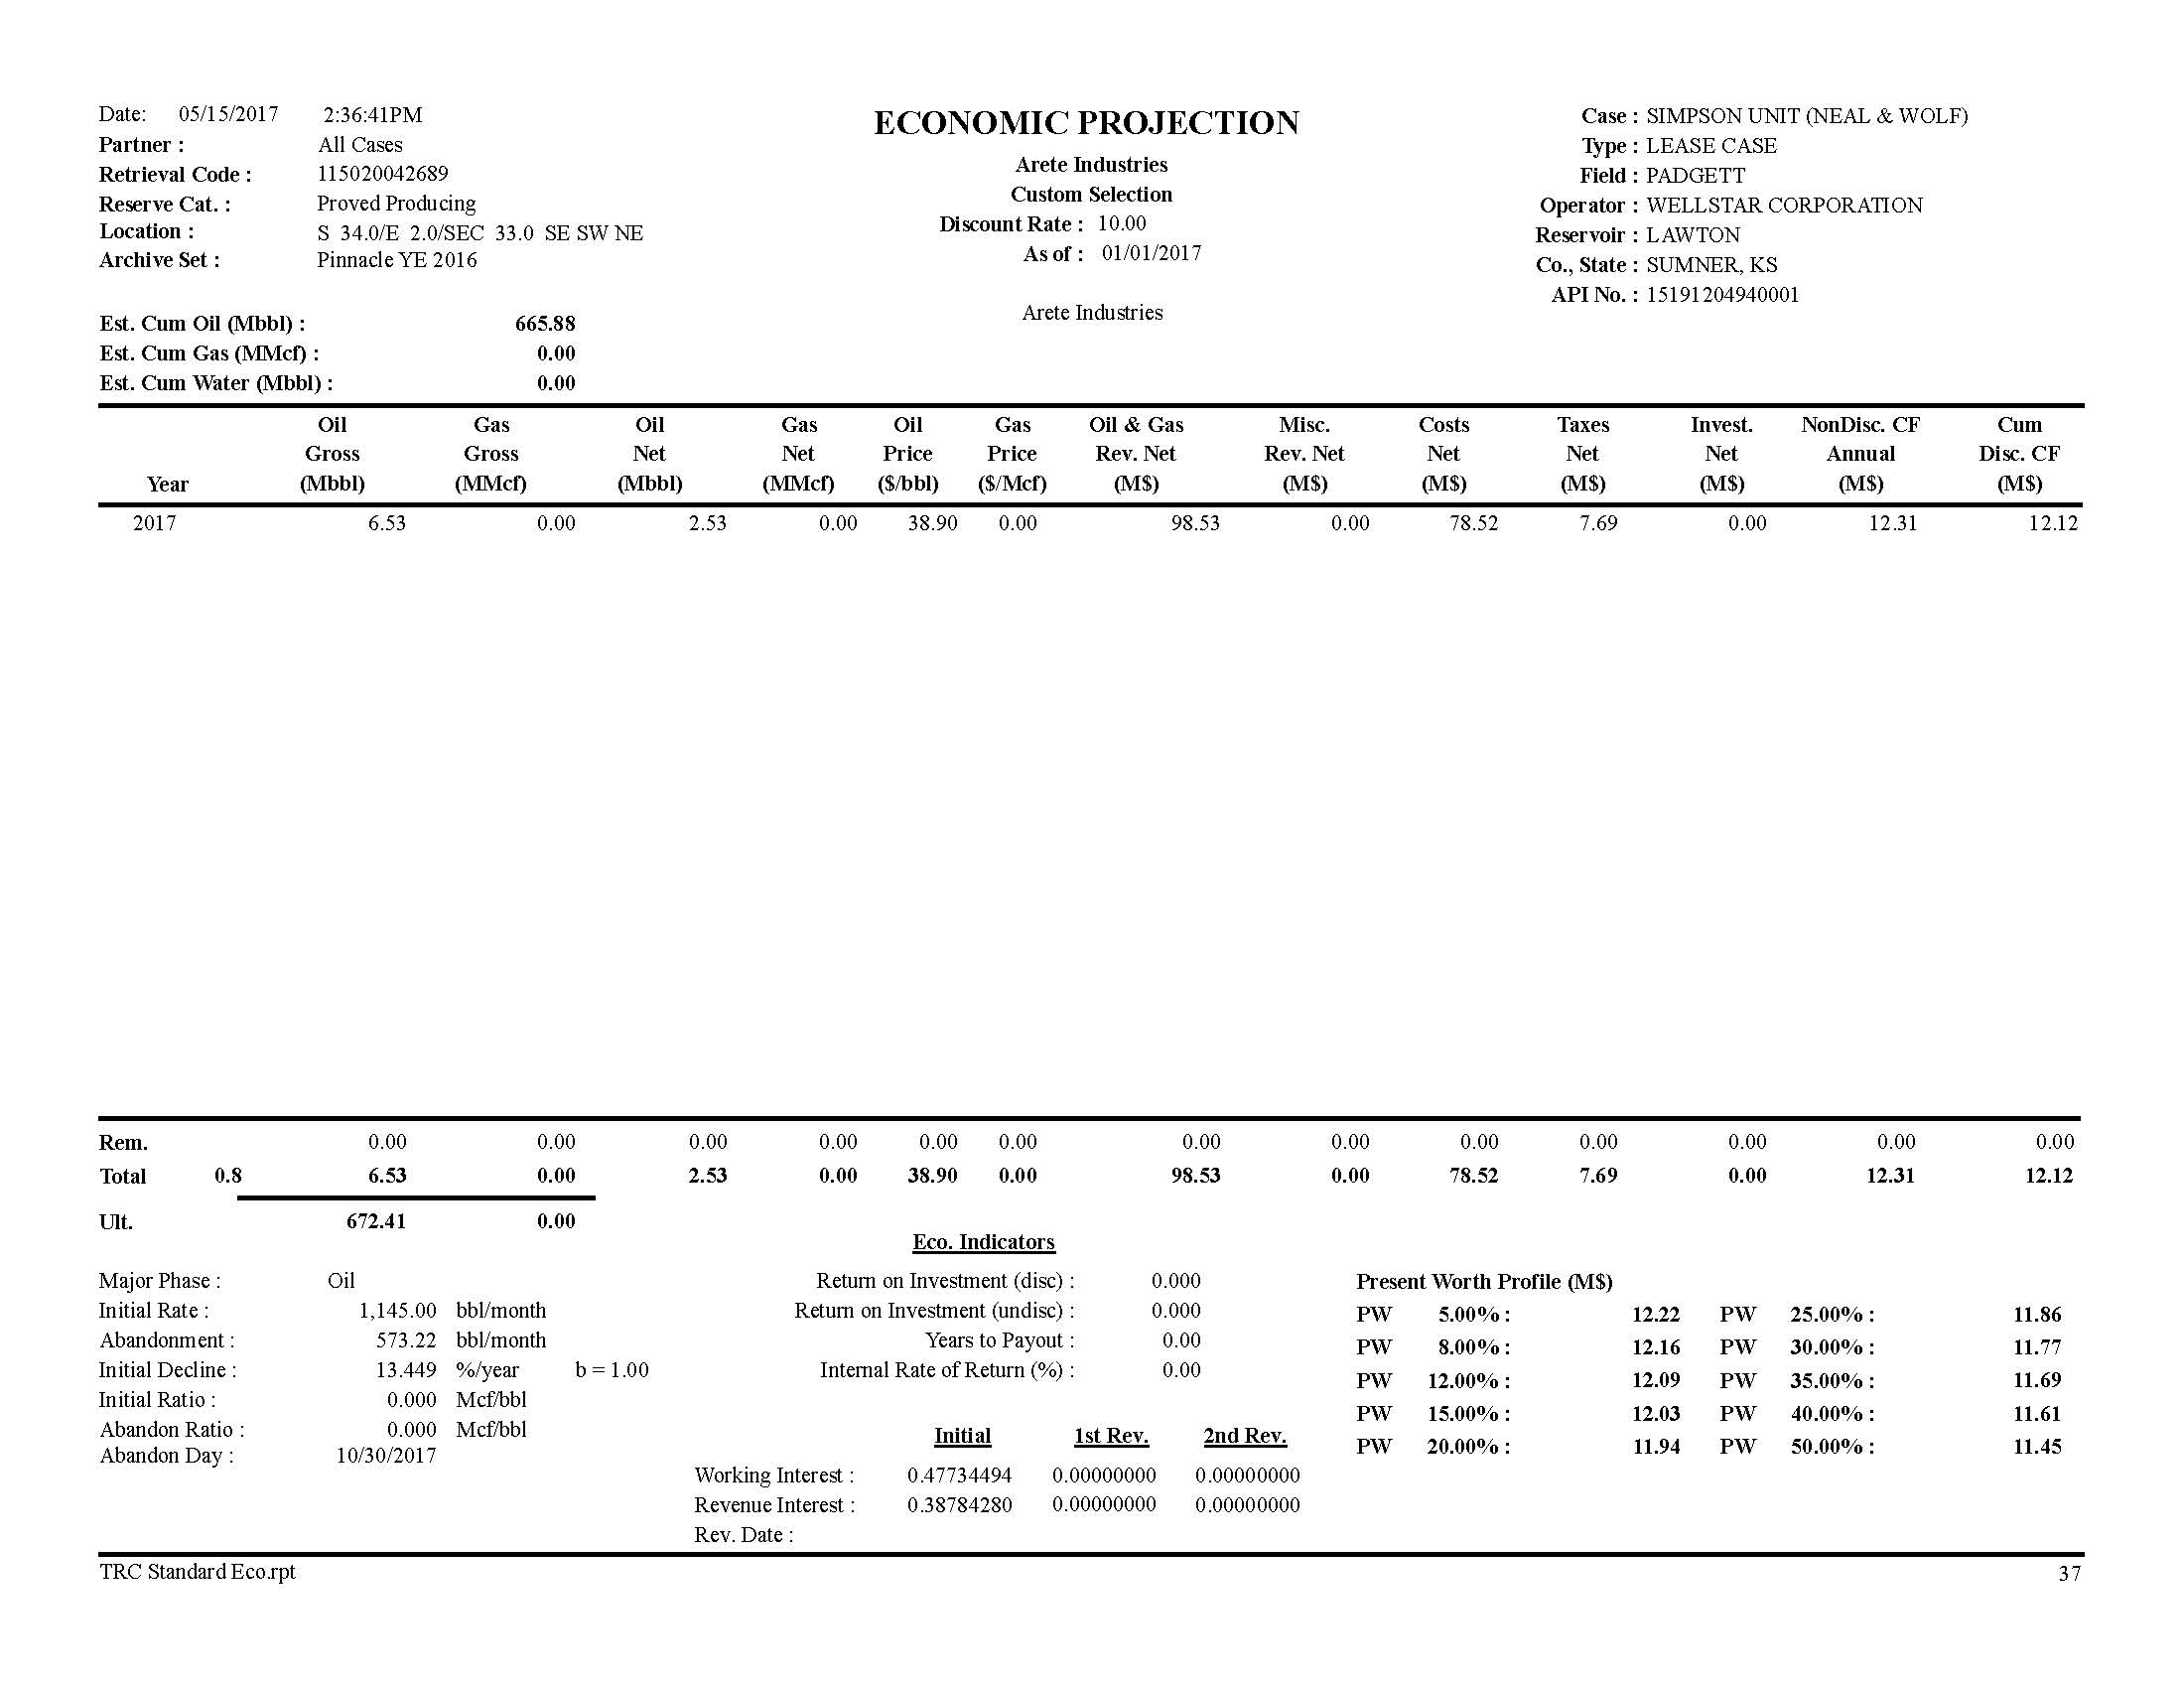
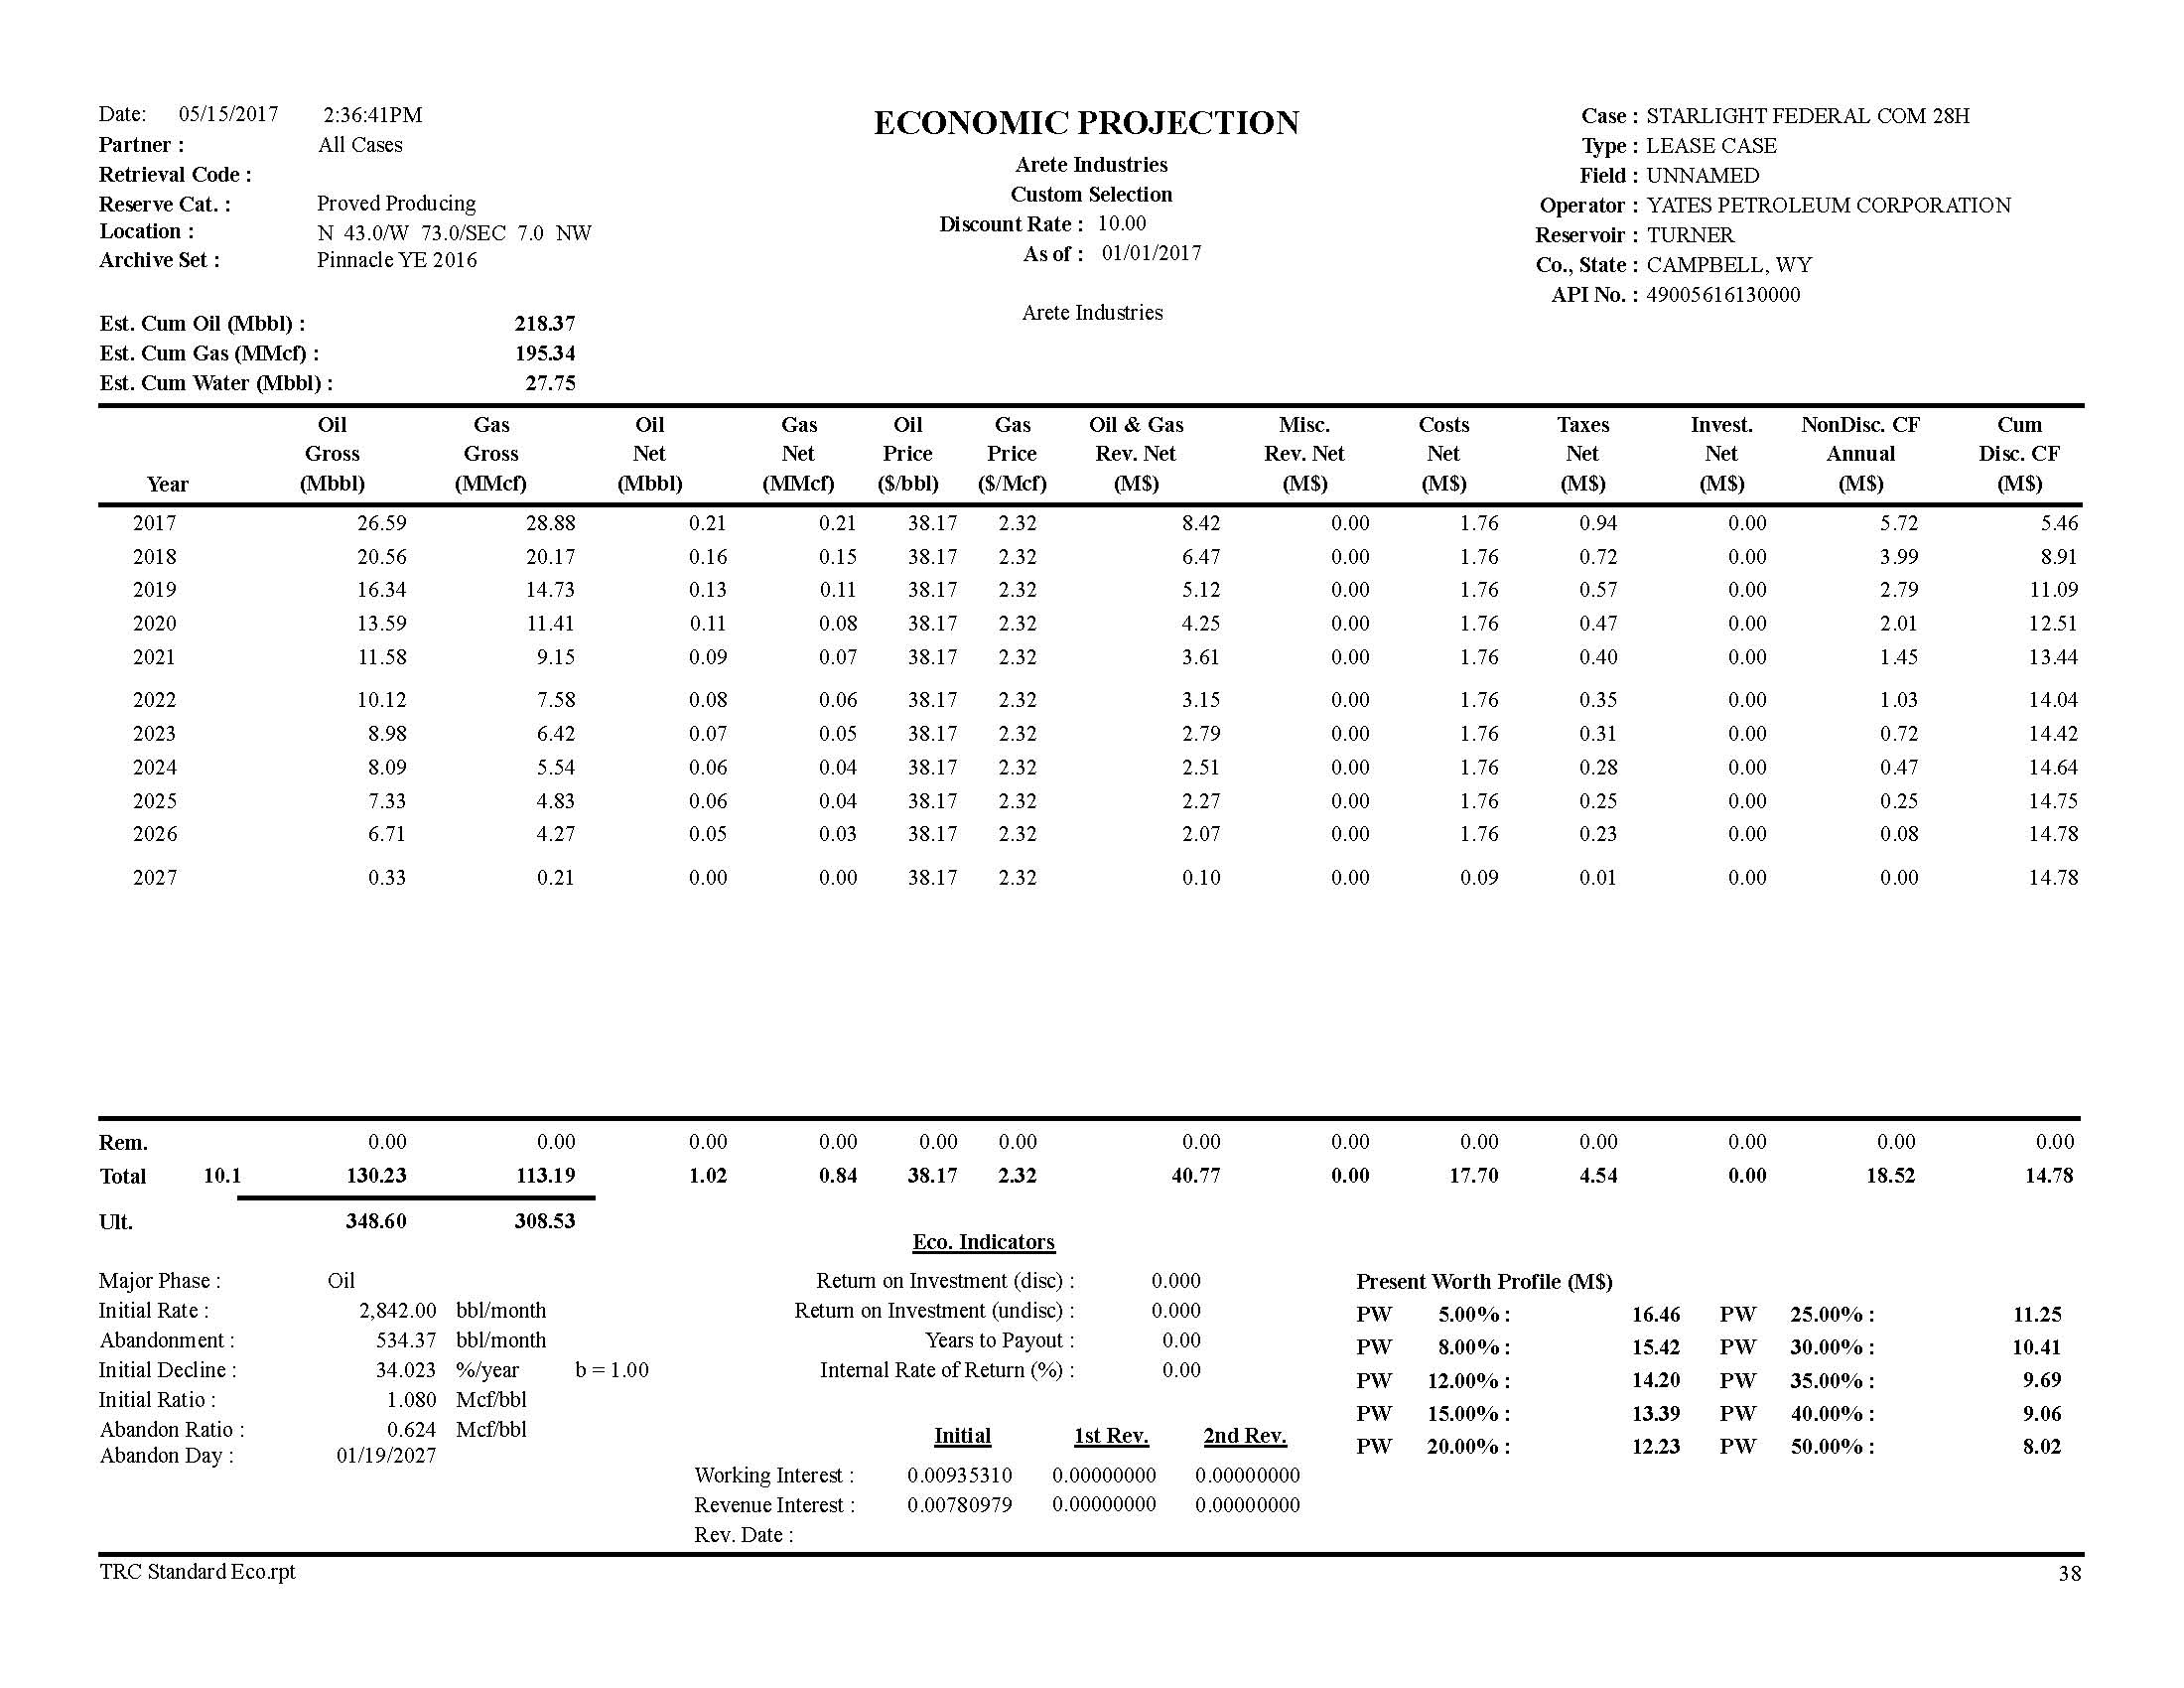
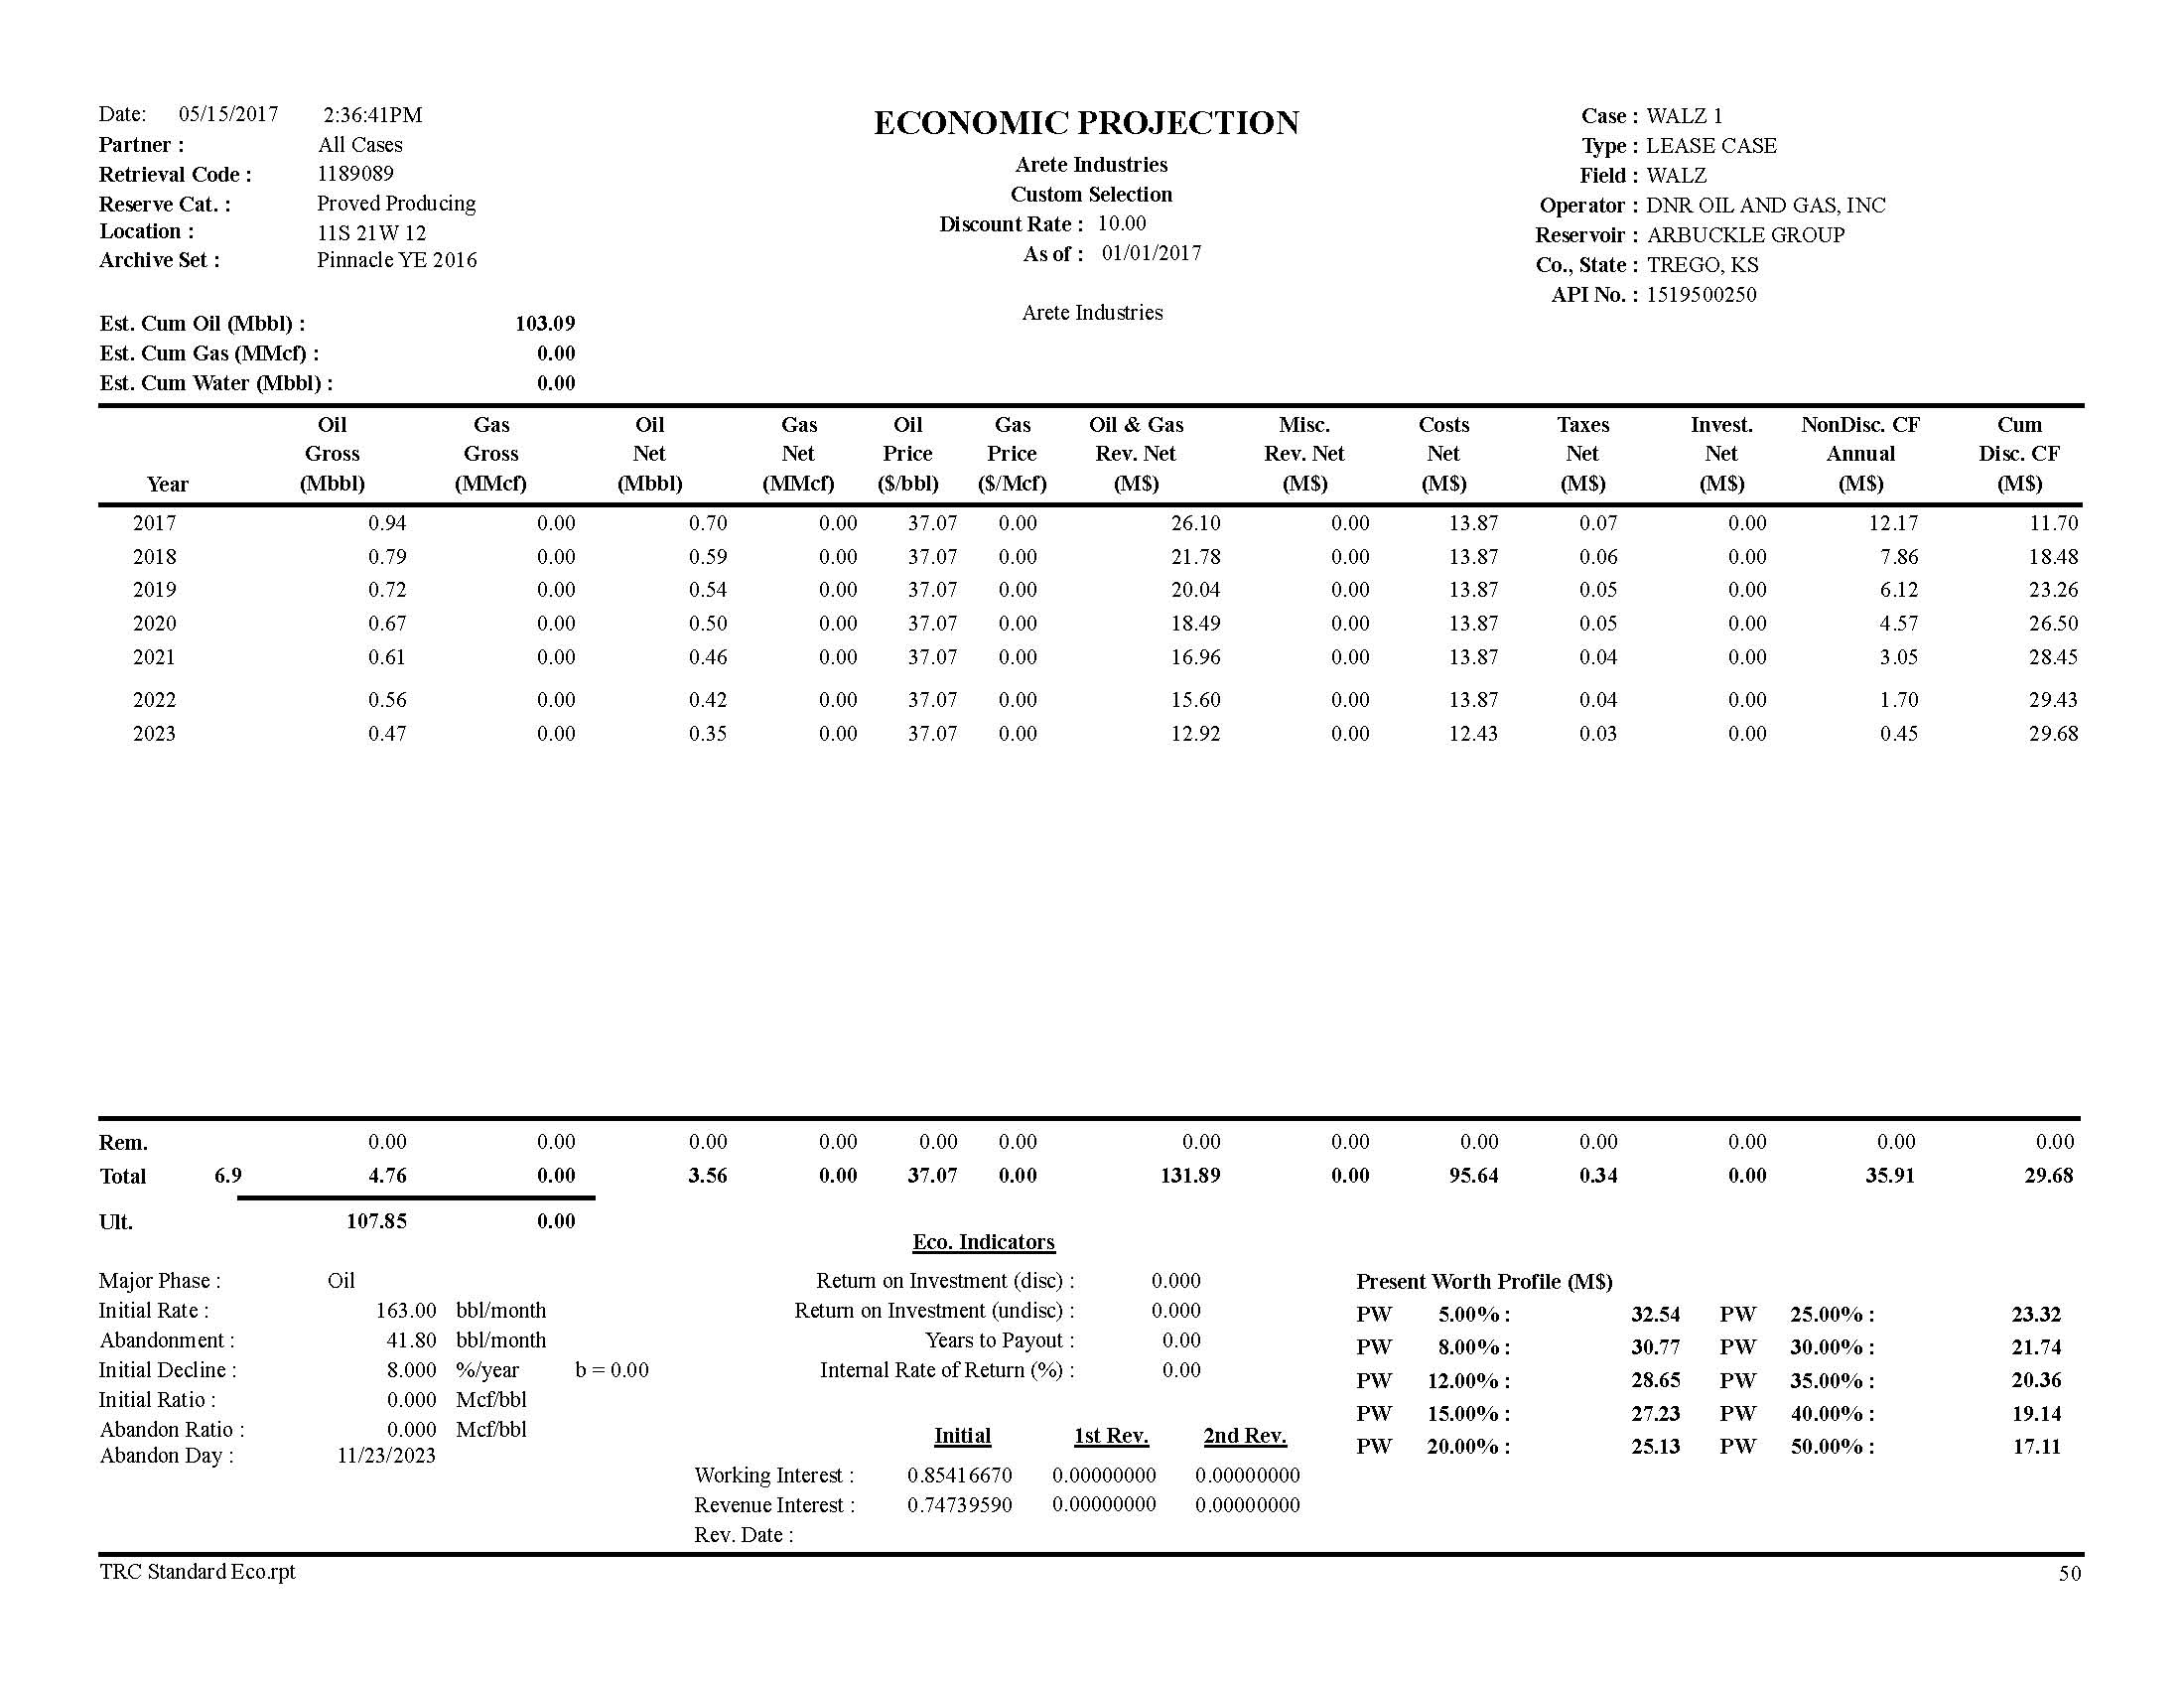
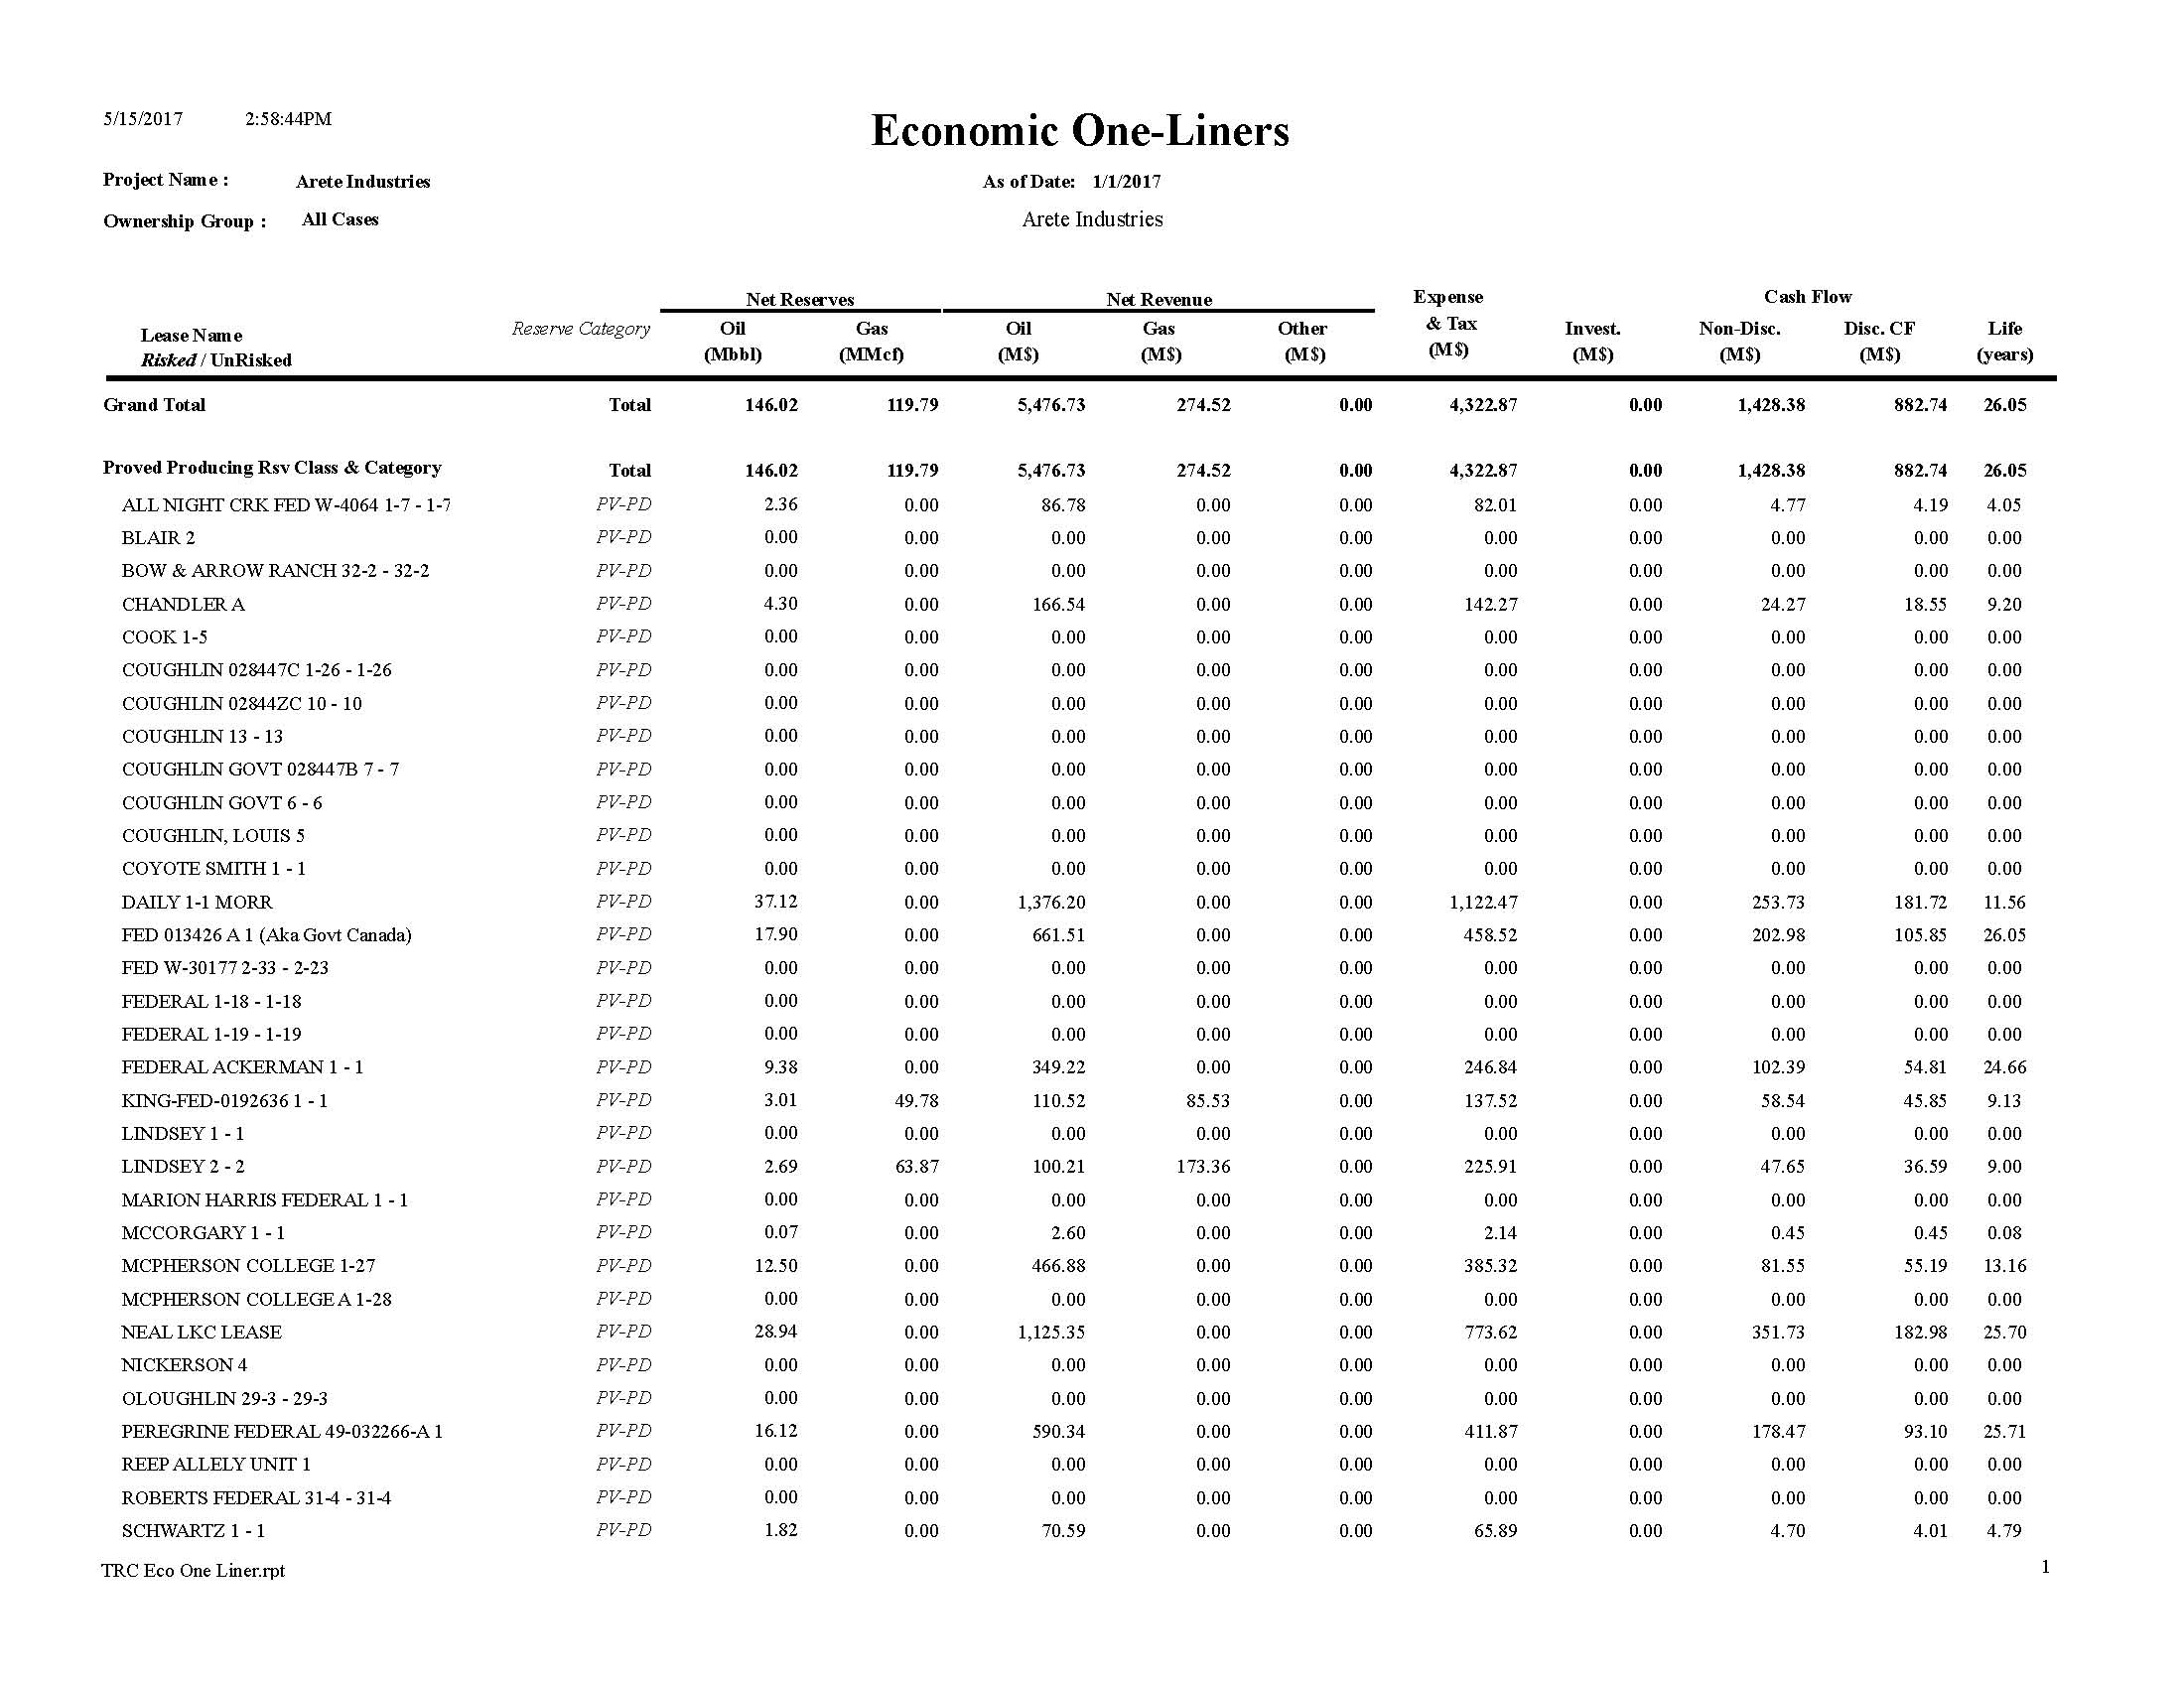
Pinnacle Energy Services, LLC ("Pinnacle") has performed a reserve and economic evaluation on certain oil and gas assets of Arete Industries, Inc. ("Arete") as of December 31, 2016. Well names, owned interests, and other well information are provided on the attached Exhibit A. Information used in the evaluation was provided by Arete and supplemented by data gathered from public sources. Summary results of this analysis are located below and details are presented in accompanying exhibits.
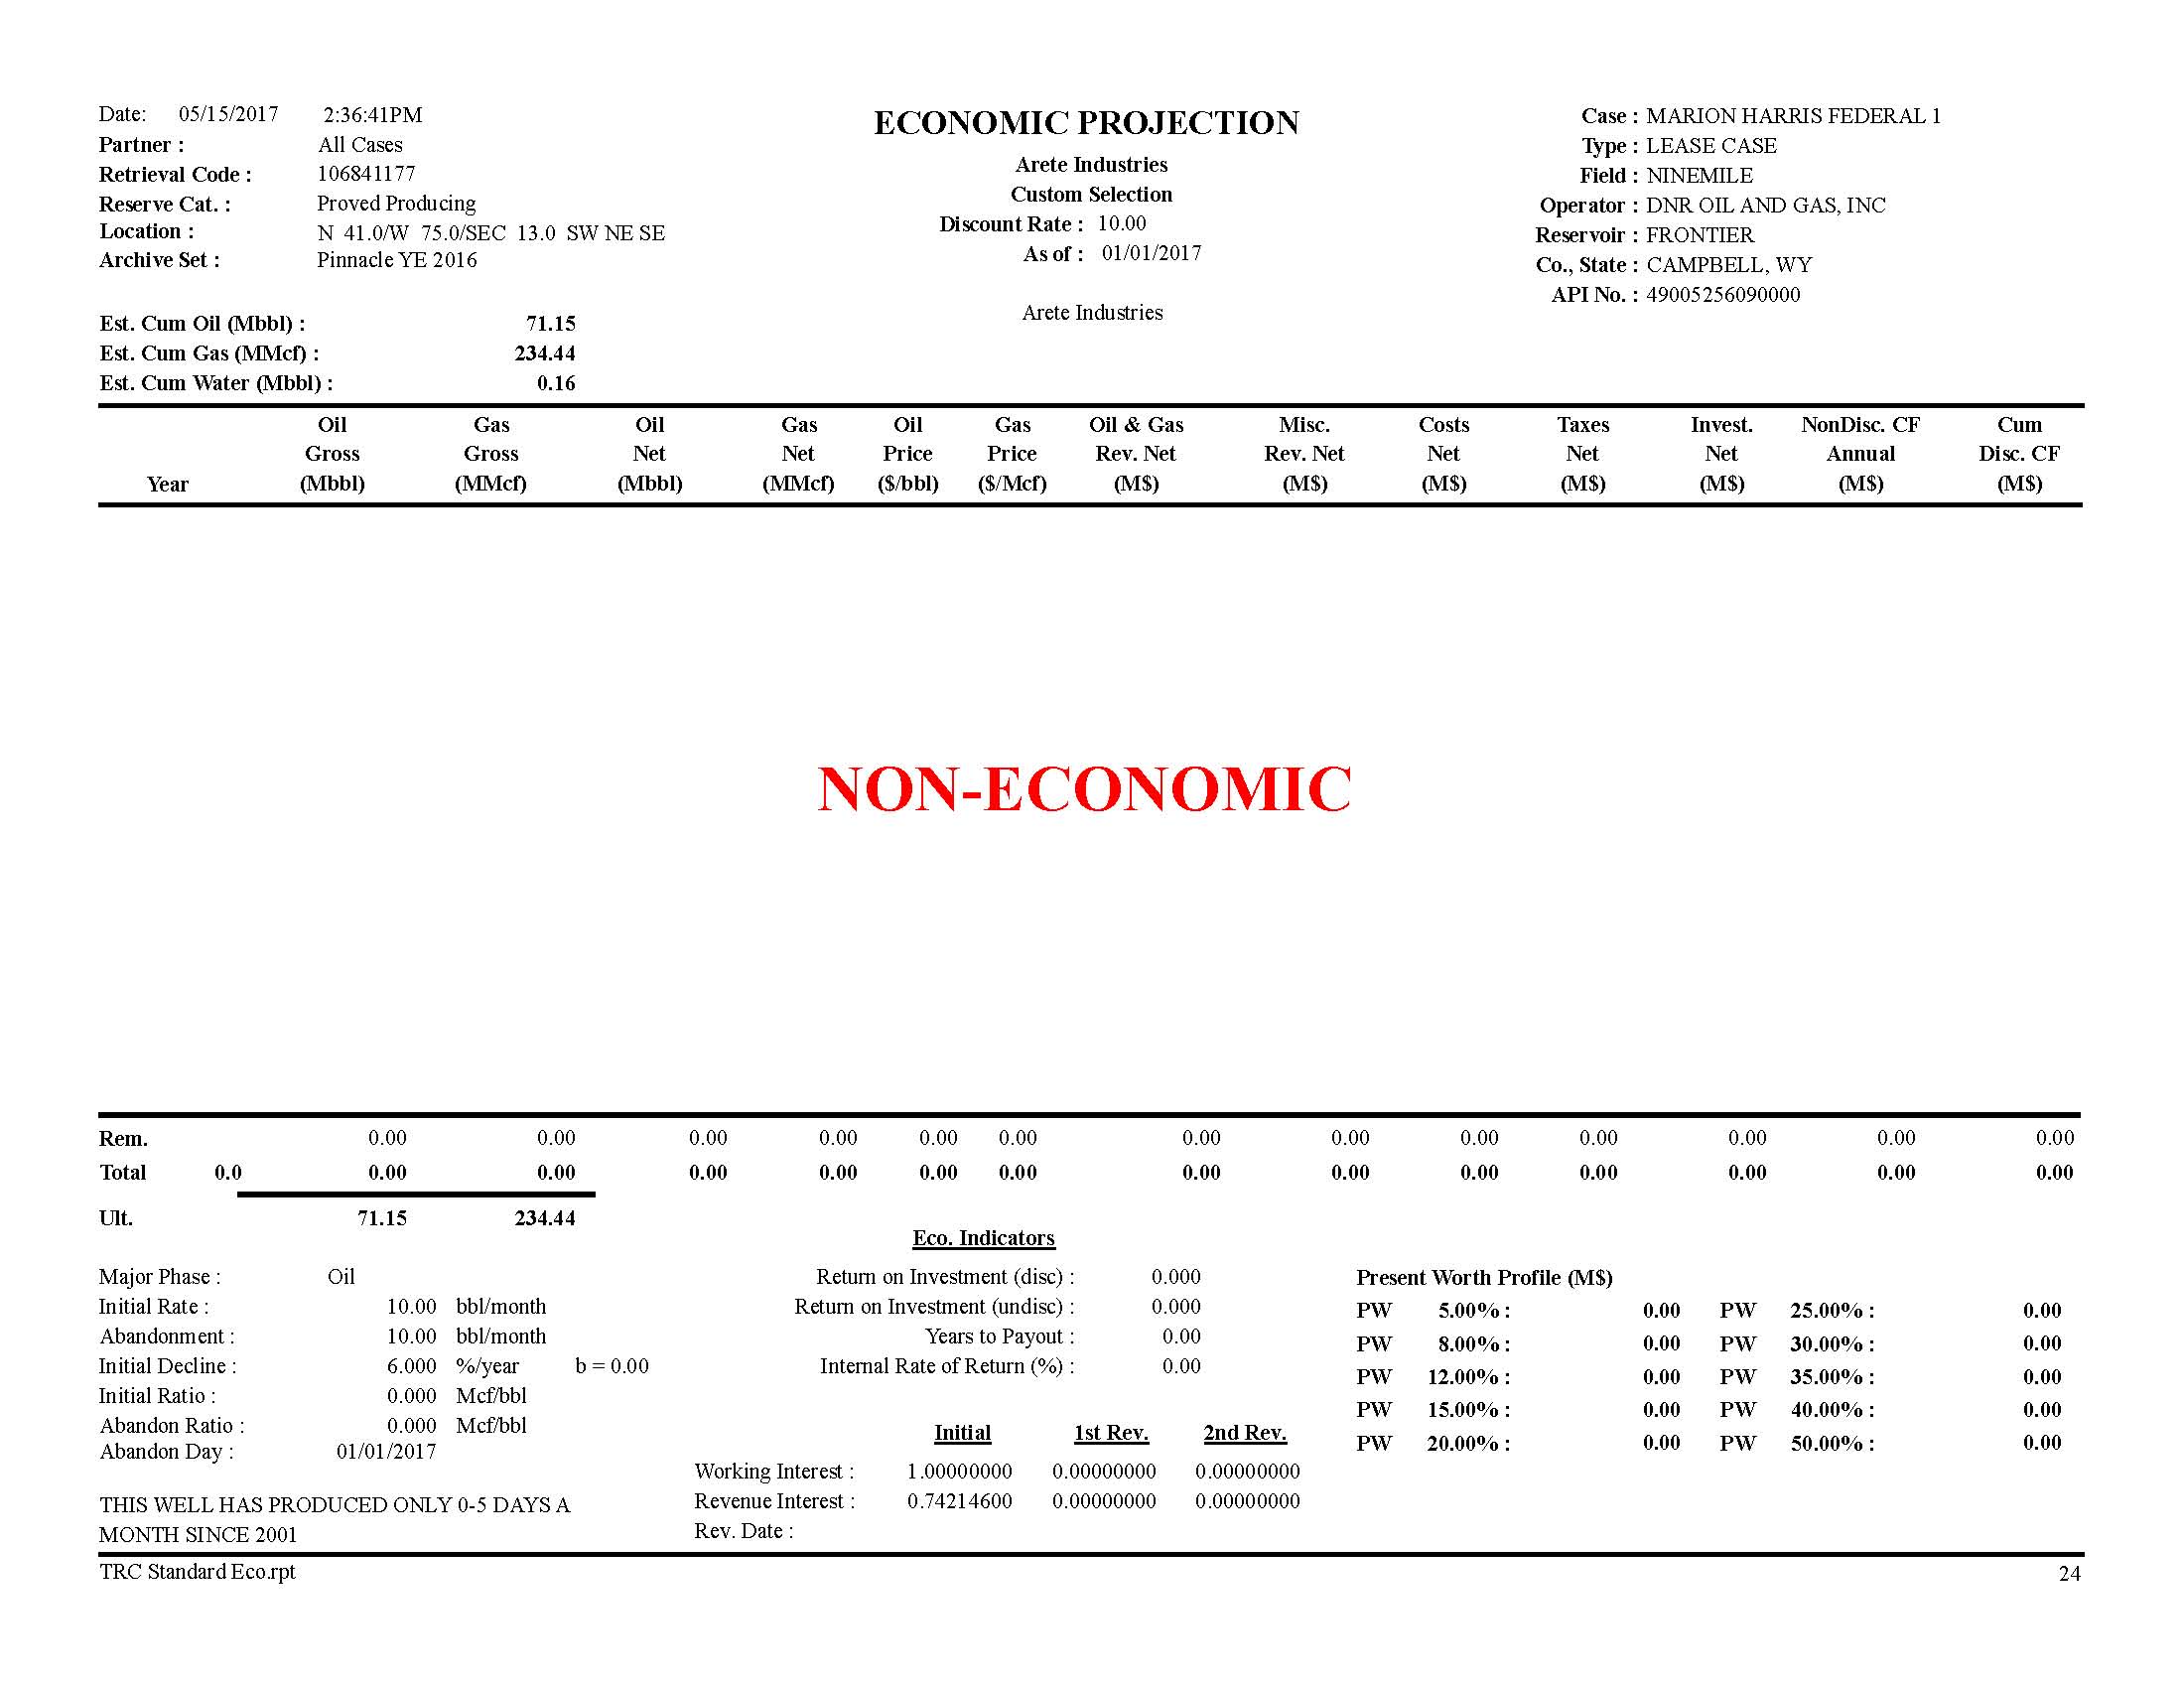
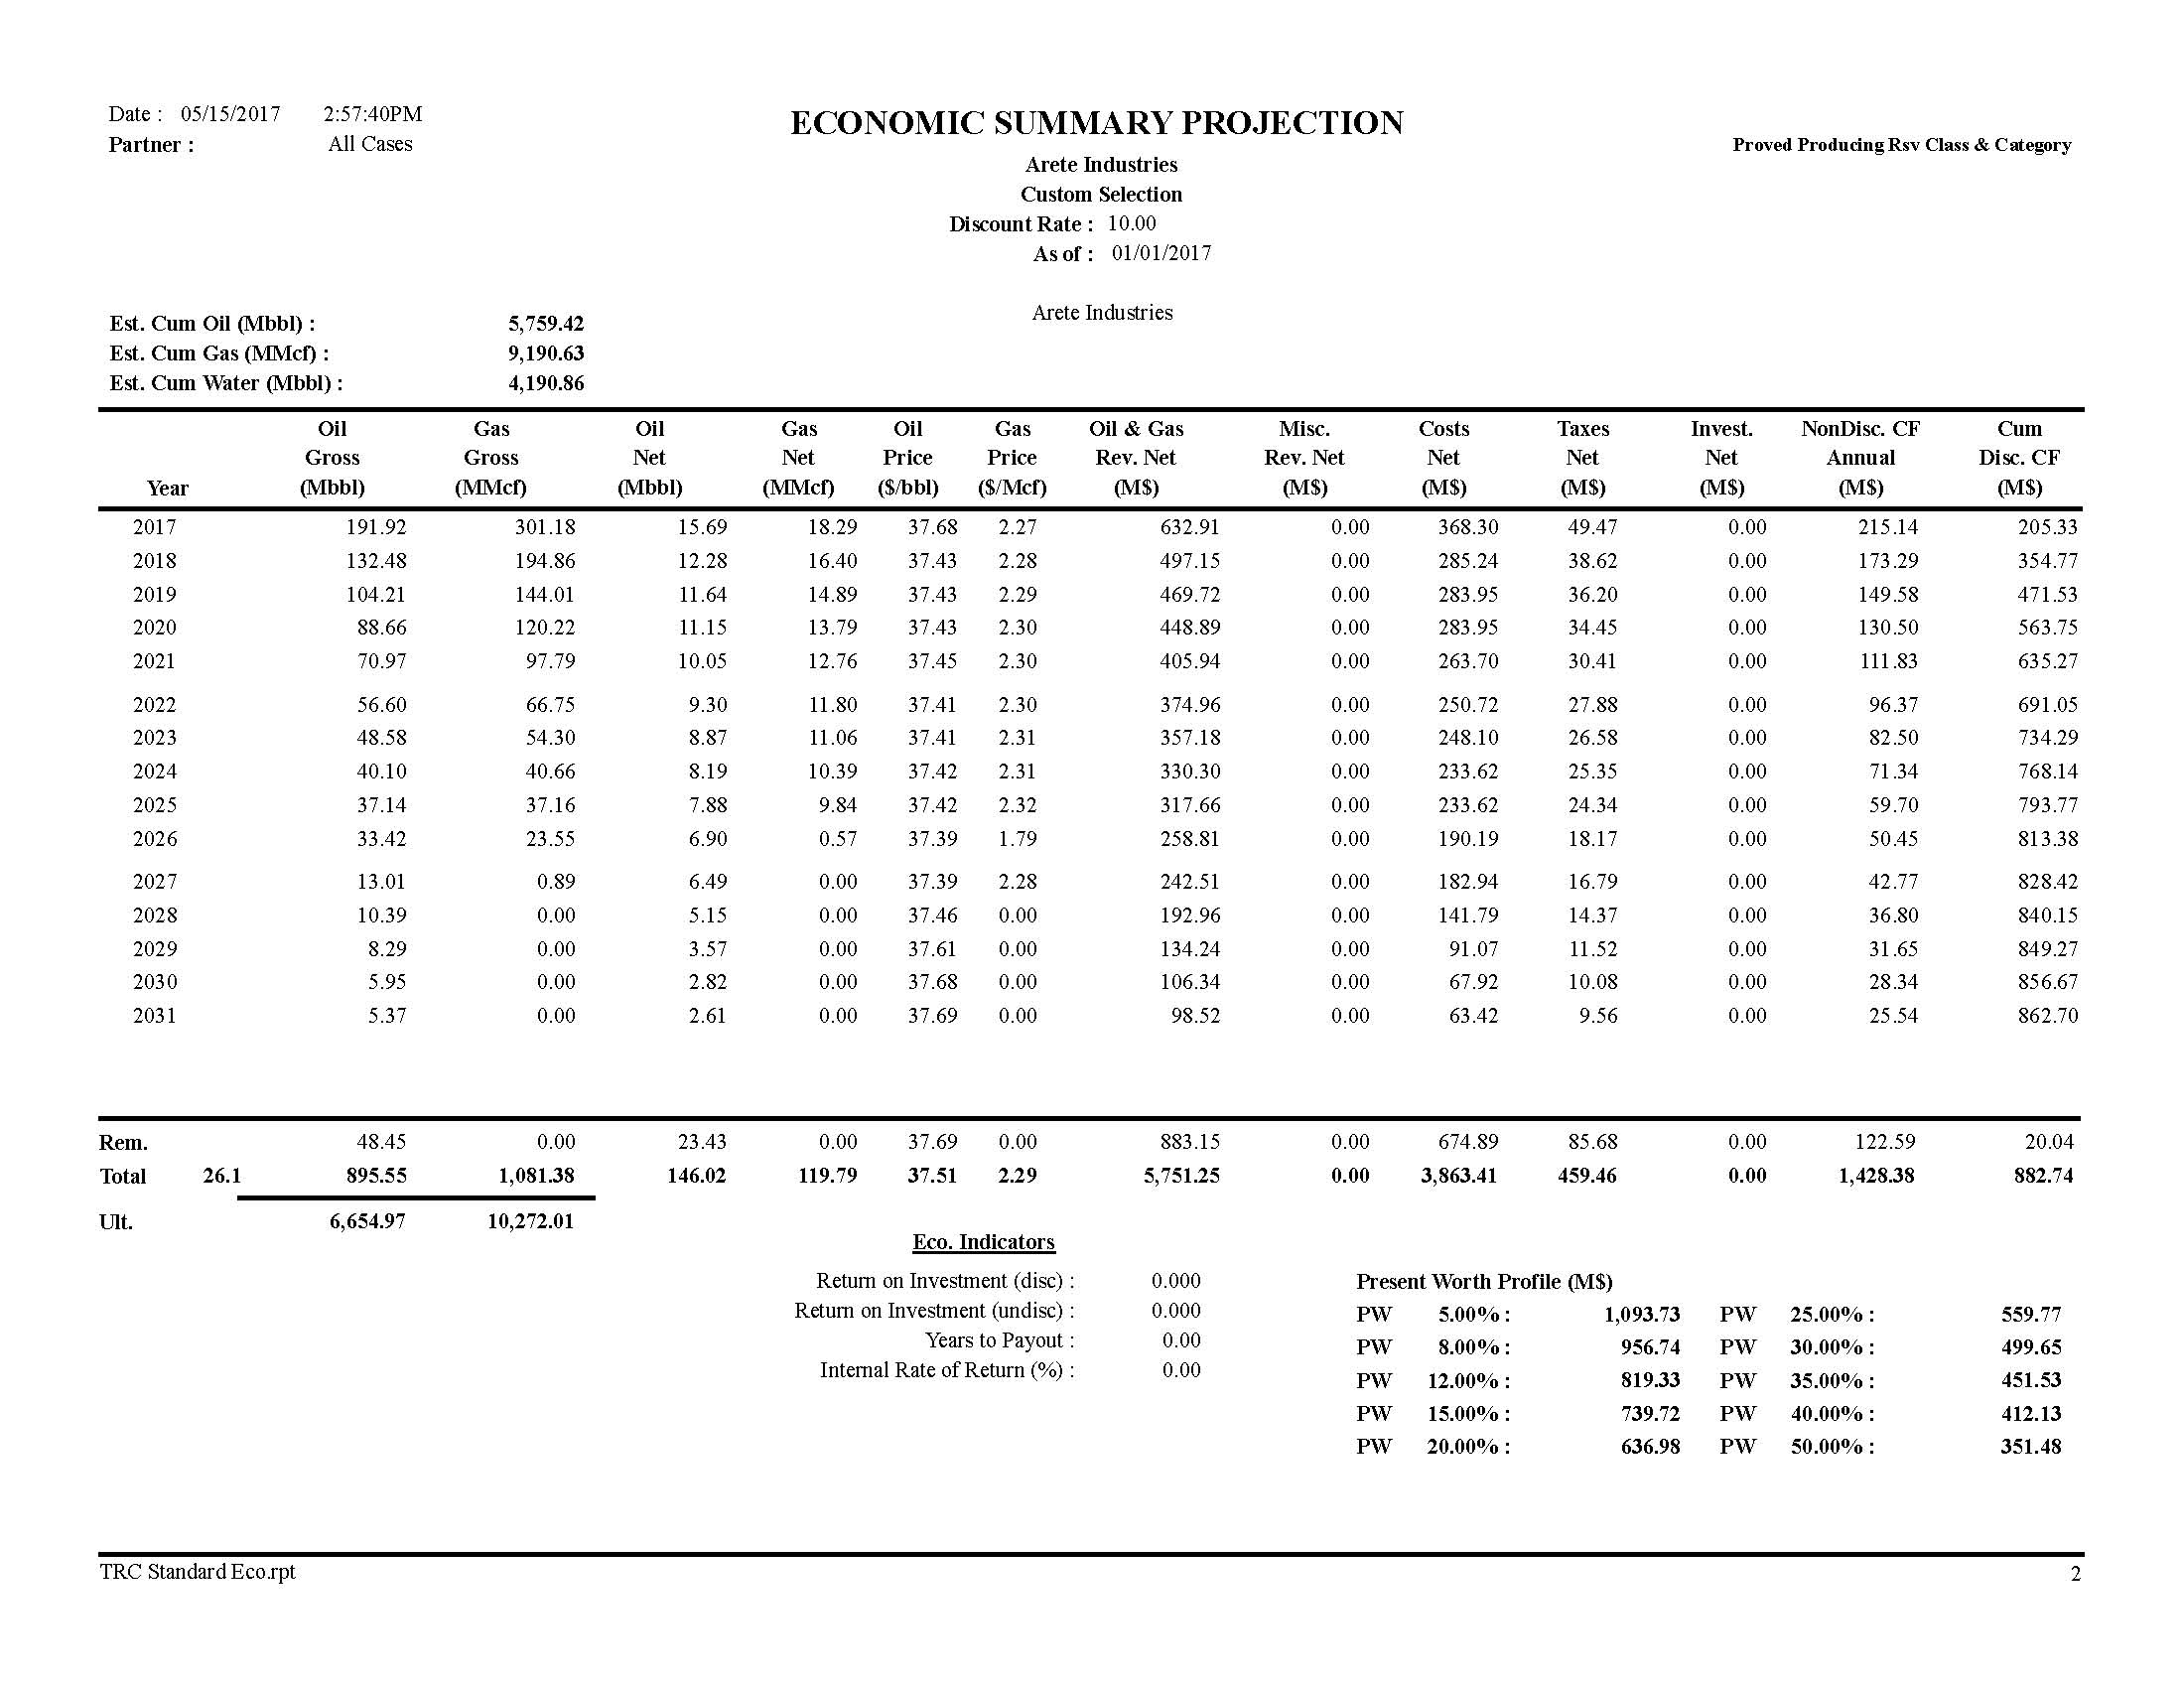
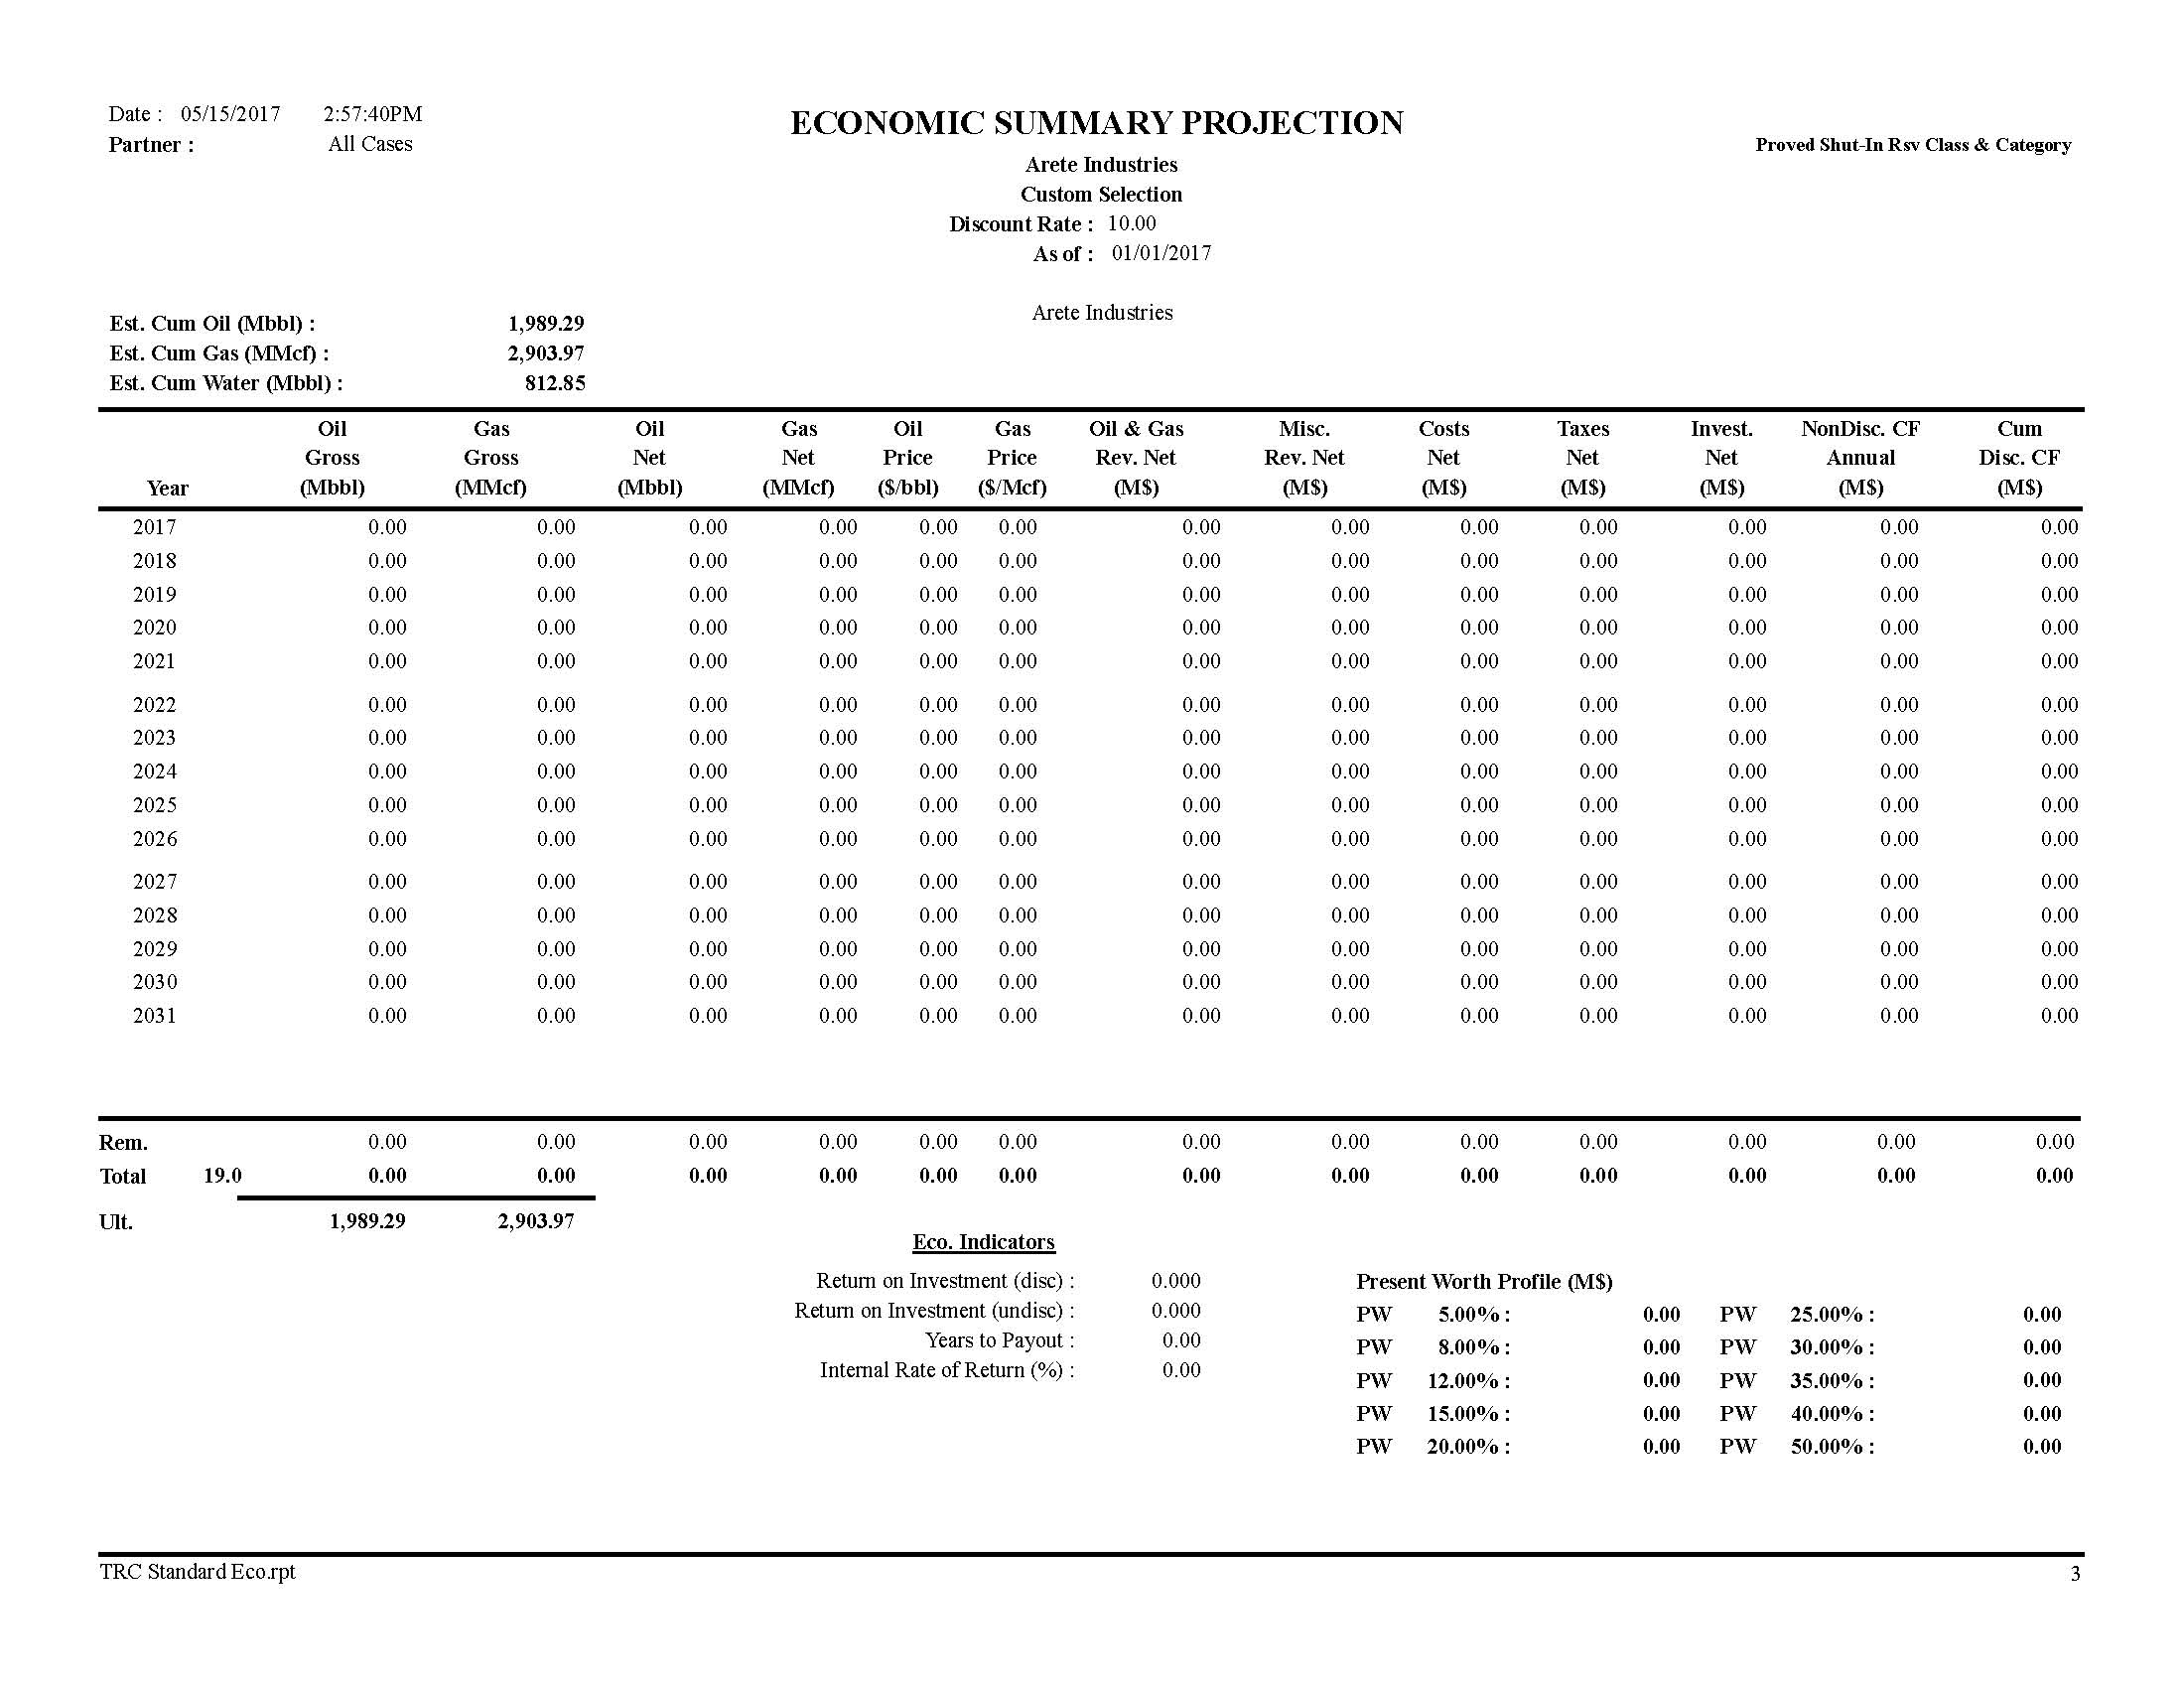
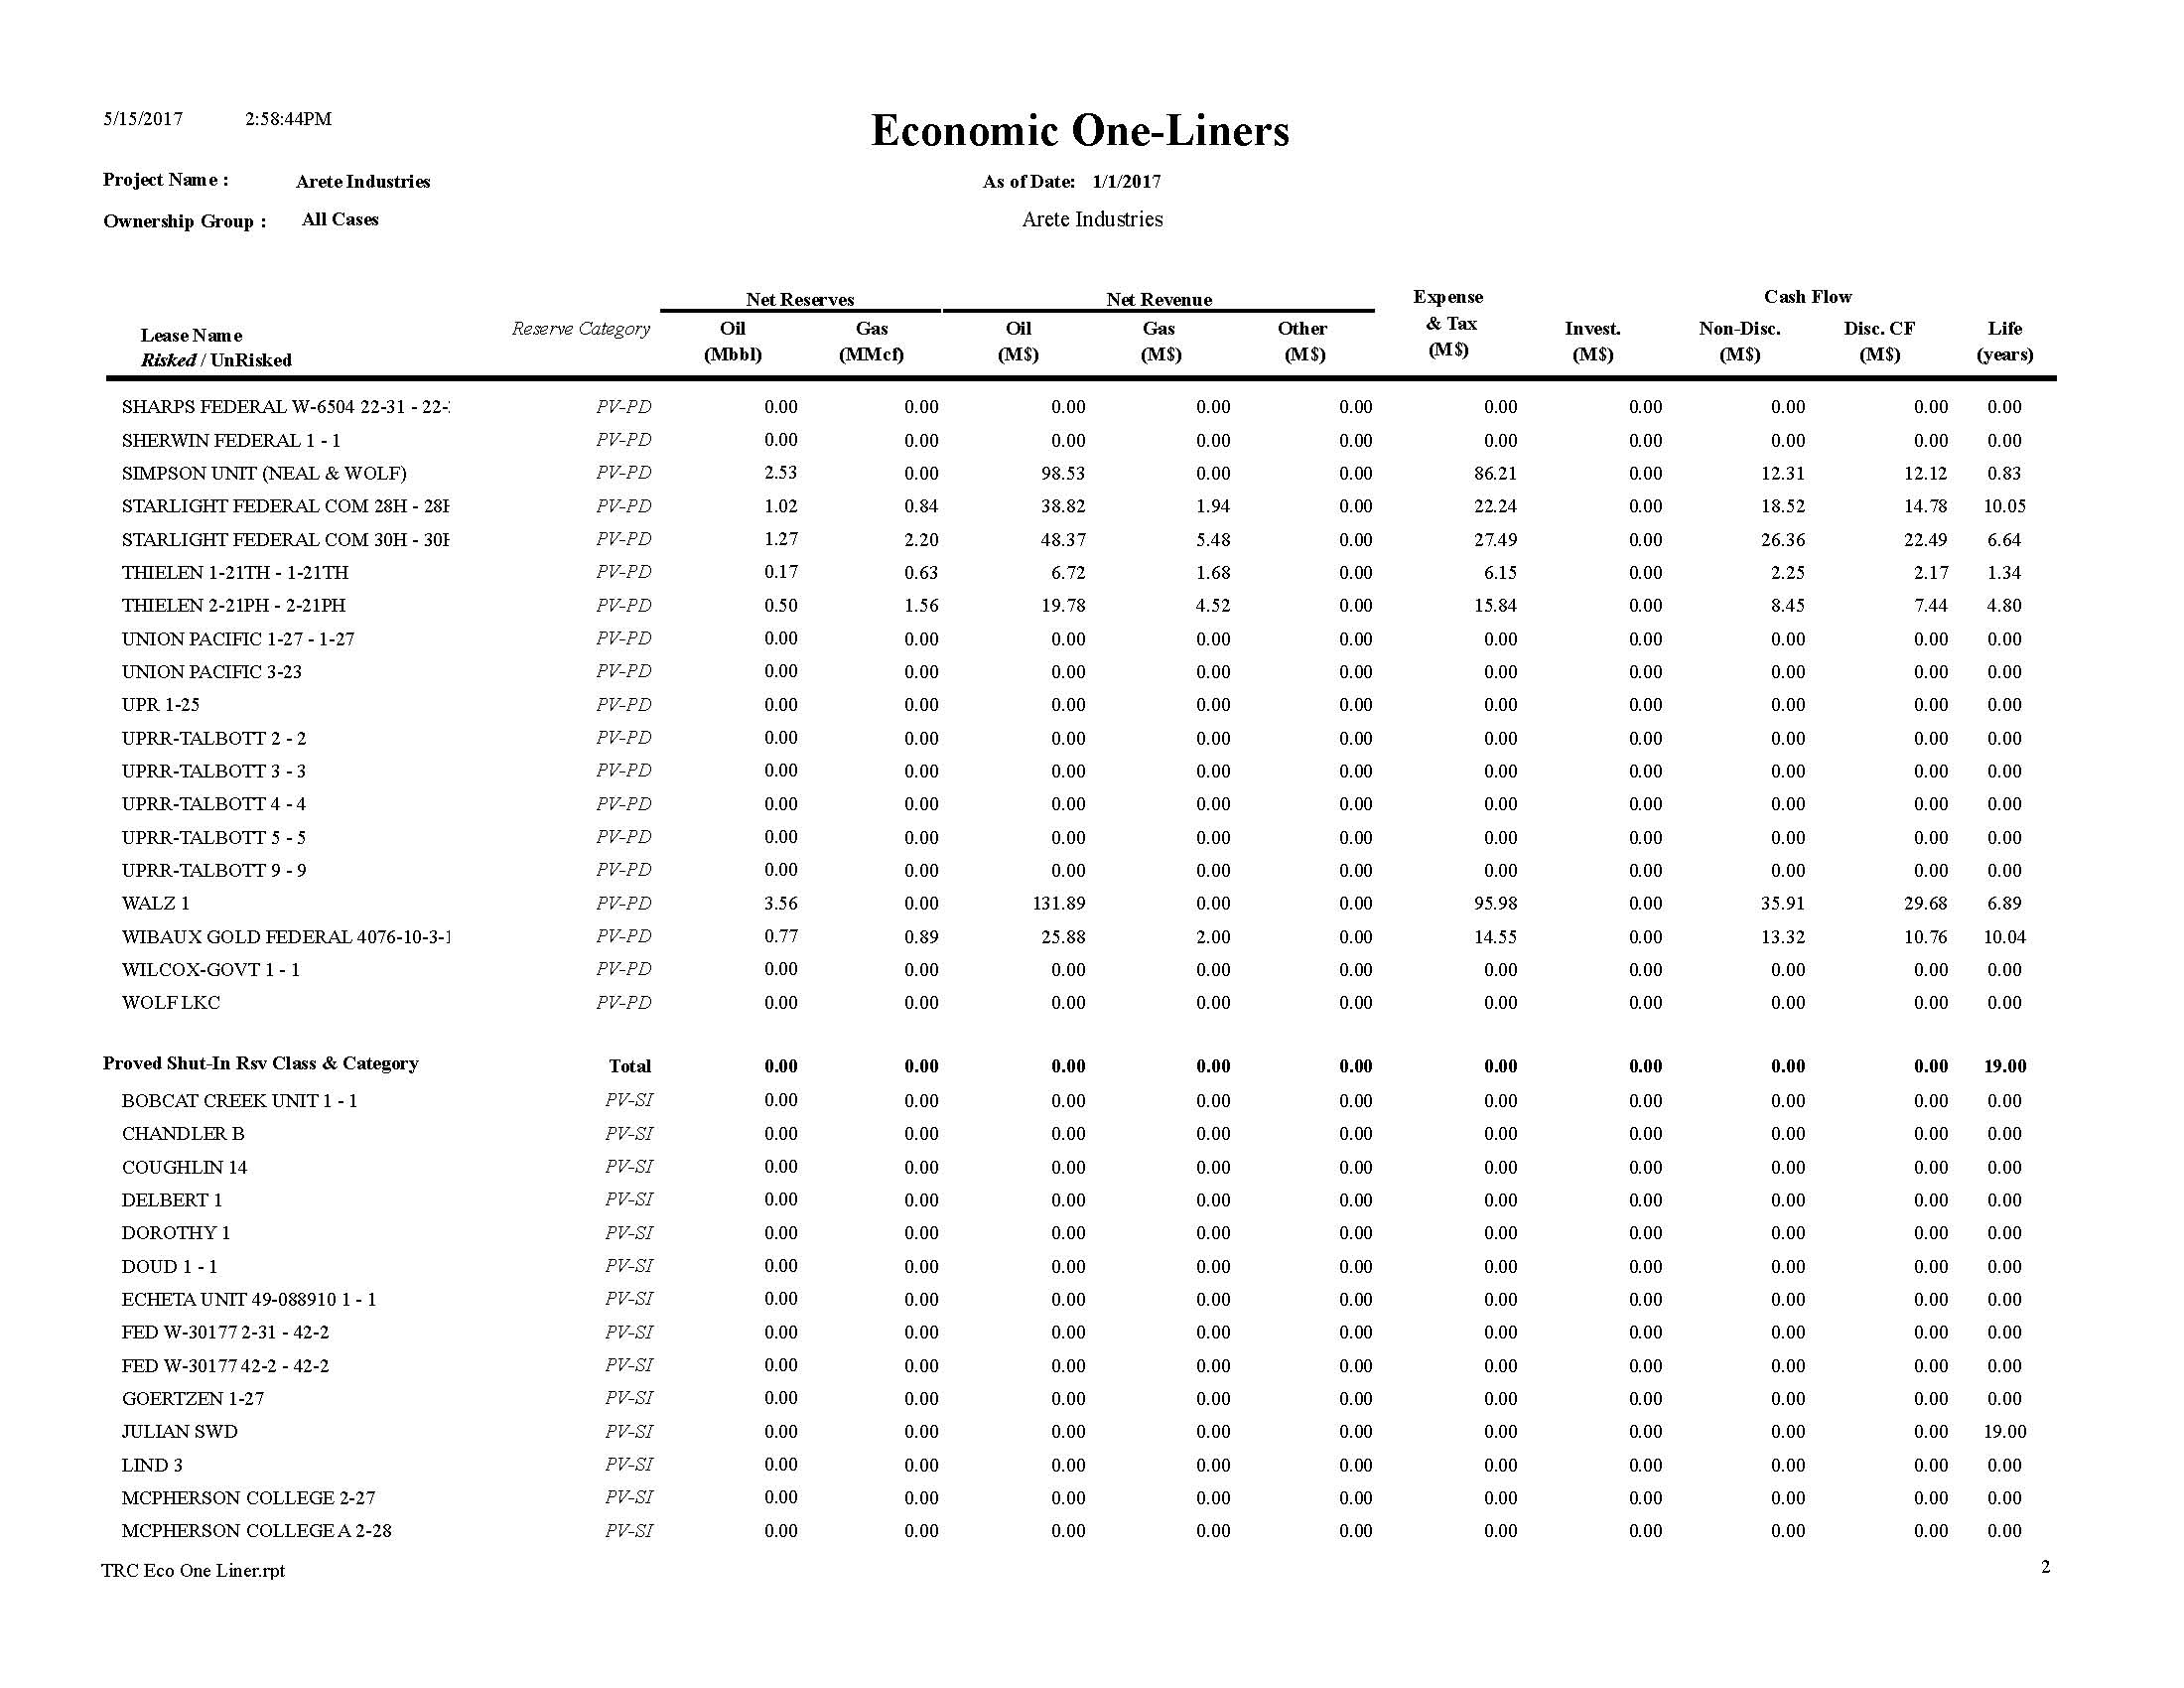
This evaluation was performed using SEC reserve standards and SEC year-end pricing, and includes fifty-one (51) Proved Developed Producing (PDP) properties and twenty (20) Proved Shut-In (PSI) properties.
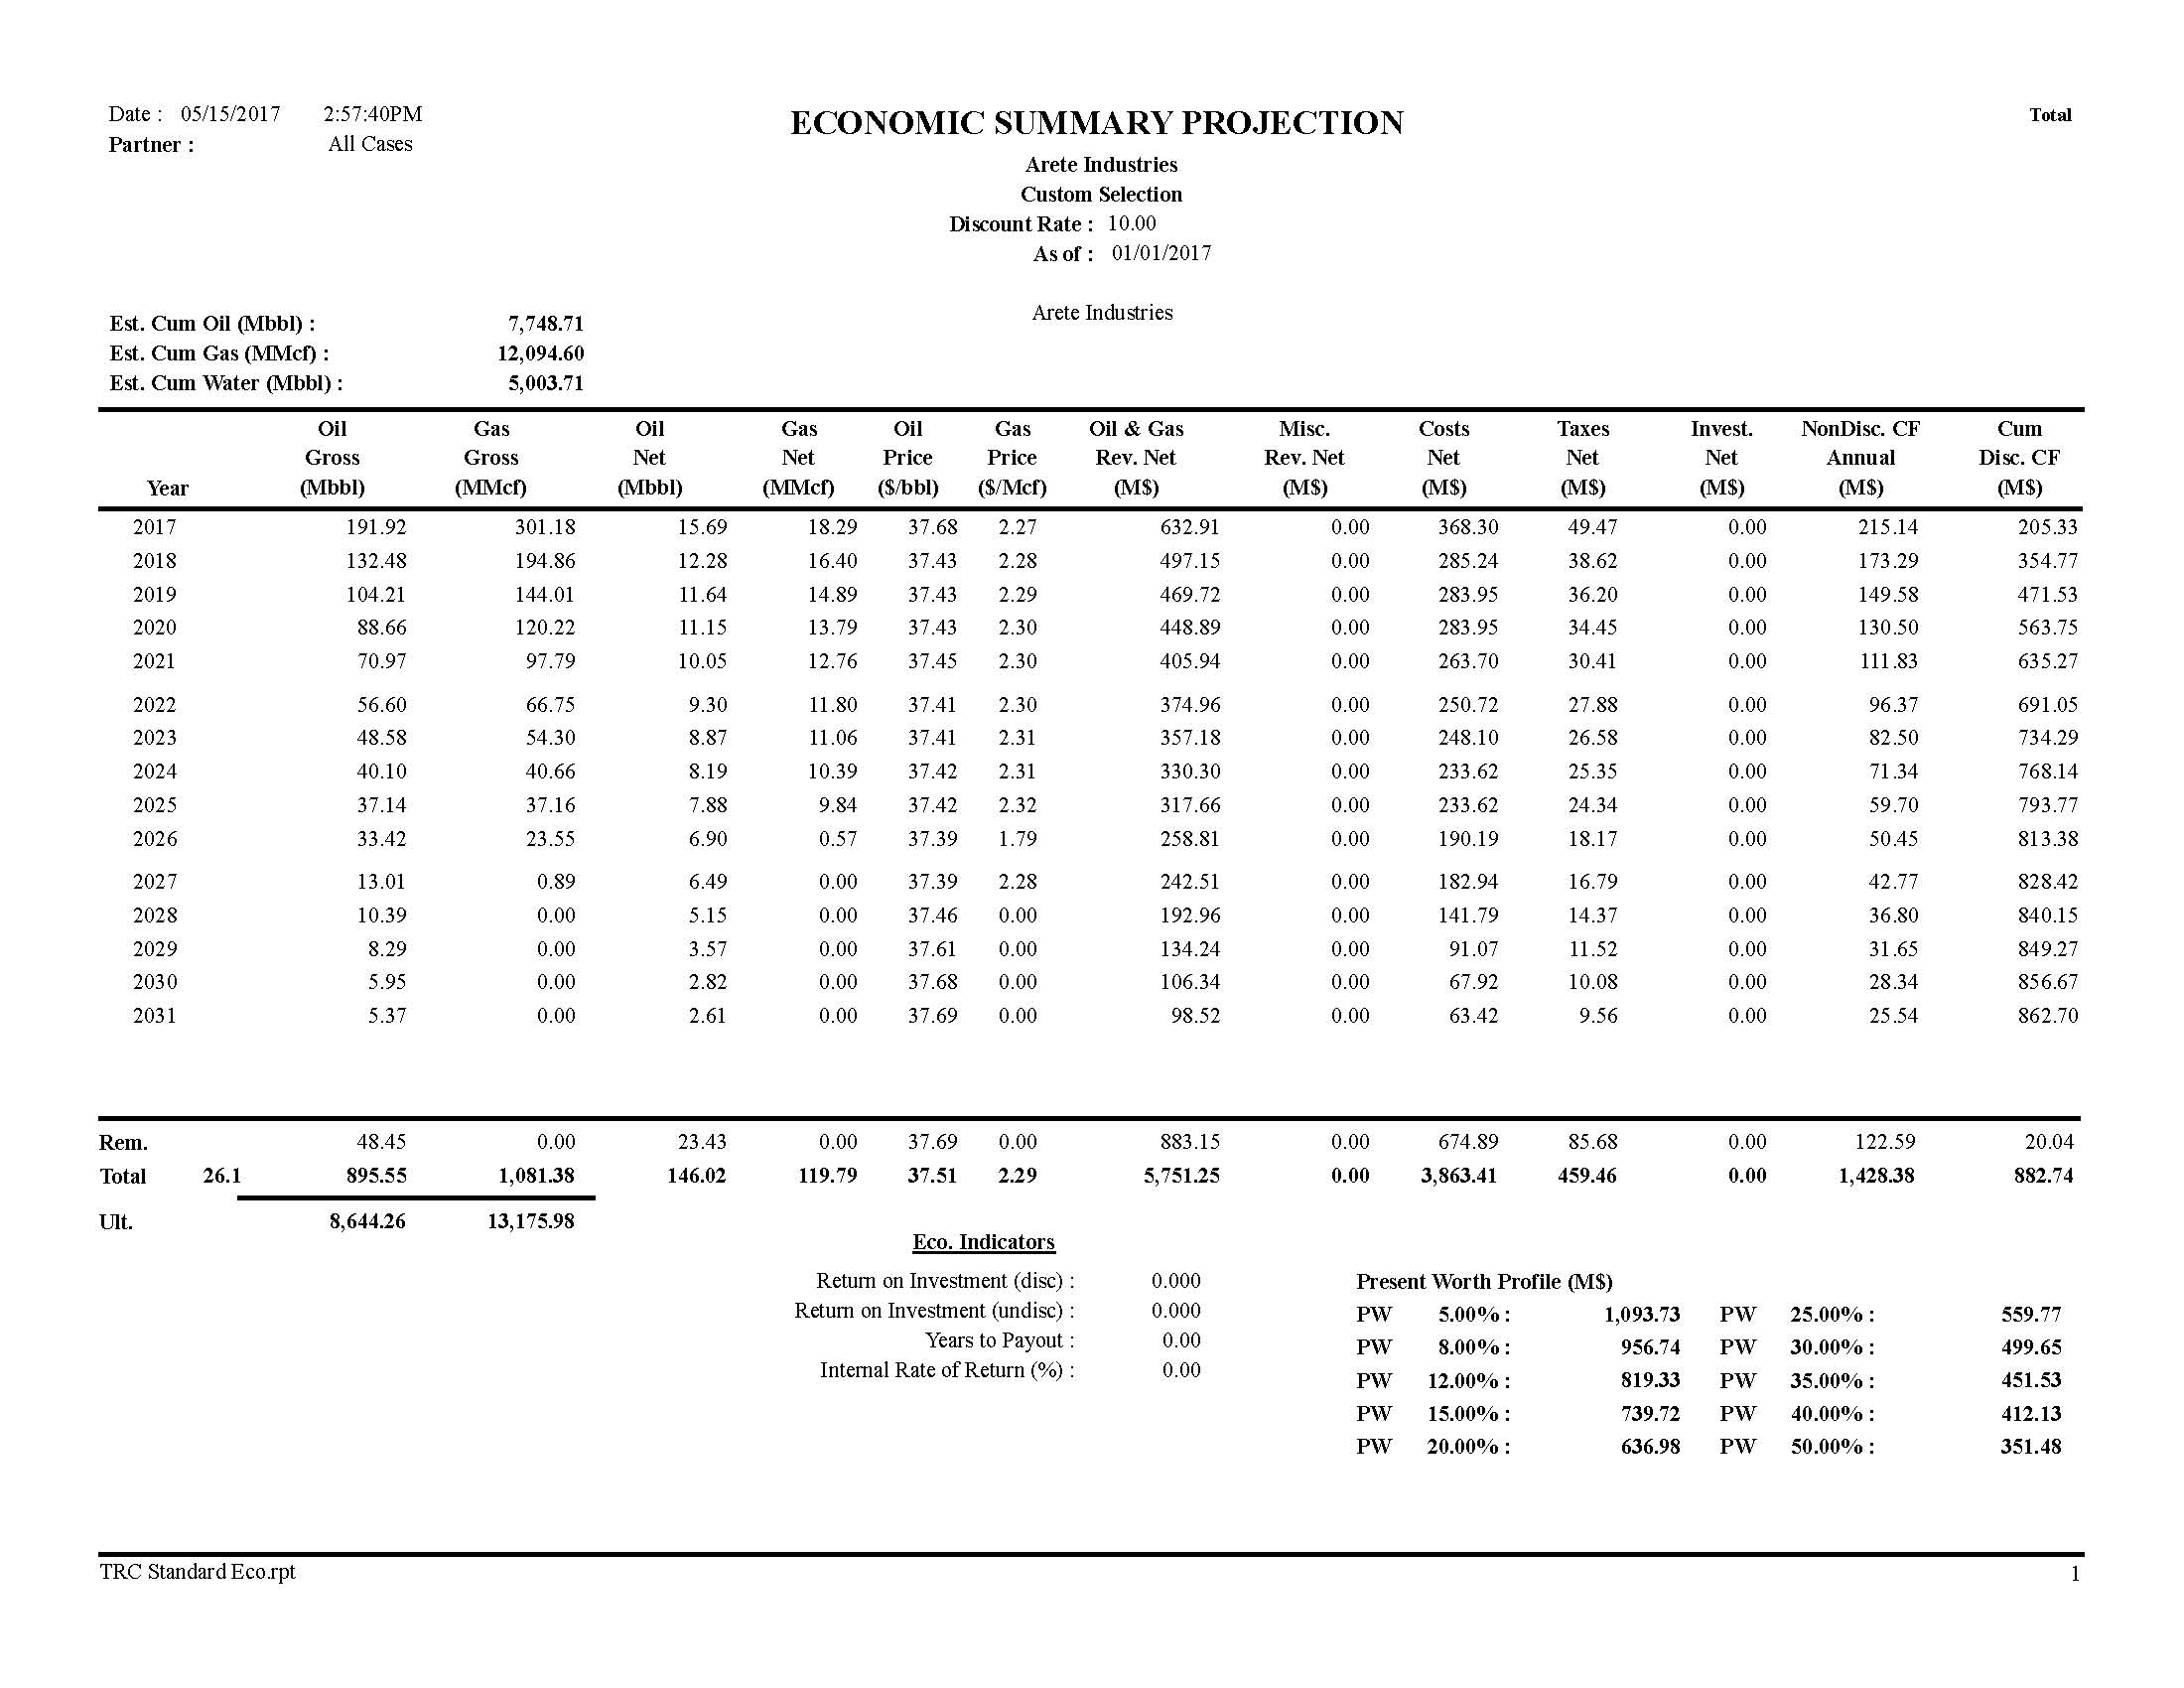
As presented in the accompanying summary projections, the net reserves and future net cash flows as of January 1, 2017 are as follows (Volumes in MBBLs and MMcf, Values in M$):
| Number of | Net Reserves | Net | Net | NPV | ||||||||||||||||||||||||
| Reserve Class | Properties | Oil | Gas | NGL | Capital | Cashflow | Disc @ 10% | |||||||||||||||||||||
|
MBBL
|
MMCF
|
MBBL
|
M$
|
M$
|
M$
|
|||||||||||||||||||||||
|
|
|
|
|
|
|
|
||||||||||||||||||||||
|
PDP
|
51
|
146
|
120
|
0
|
$0
|
$1,428
|
$883
|
|||||||||||||||||||||
| PSI | 20 | 0 | 0 | 0 | $0 | $0 | $0 | |||||||||||||||||||||
| Total Proved | 71 | 146 | 120 | 0 | $0 | $1,428 | $883 | |||||||||||||||||||||
Pricing
Per SEC rules as of January 1, 2010, the SEC pricing is calculated by averaging the first-of-the-month oil and gas pricing for the calendar year being evaluated. For 2016, the average oil and gas prices were $42.75/BBL for oil (WTI) and $2.49/MMBTU for natural gas (Henry Hub). Both prices were held constant.
Pinnacle Energy Services, LLC
9420 Cedar Lake Ave, Oklahoma City, OK 73114
Ofc: 405-810-9151 Fax: 405-843-4700 www.PinnacleEnergy.com
Based on an evaluation of actual oil prices received by Arete in 2016, differentials to NYMEX prices were applied to each lease. The calculated oil price differentials ranged from -$2.97/bbl to
-$10.77/bbl. One well, the Neil Federal 14, that produces from the Minnelusa has an oil differential of -$26.67/bbl.
Based on an evaluation of actual gas prices received by Arete in 2016, differentials to NYMEX prices were applied to each lease. The calculated gas price differentials ranged from -74% to +59%.
Interests
Interest information was provided by Arete for each property or lease. These interests are shown on the attached Exhibit A.
Taxes
Oil and gas severance tax rates vary by state, and were calculated based on the lease operating statements provided by Arete.
Expenses
Average monthly operating expenses for each property were calculated based on the 2016 expense data provided by Arete.
Property Descriptions and Reserve Estimates
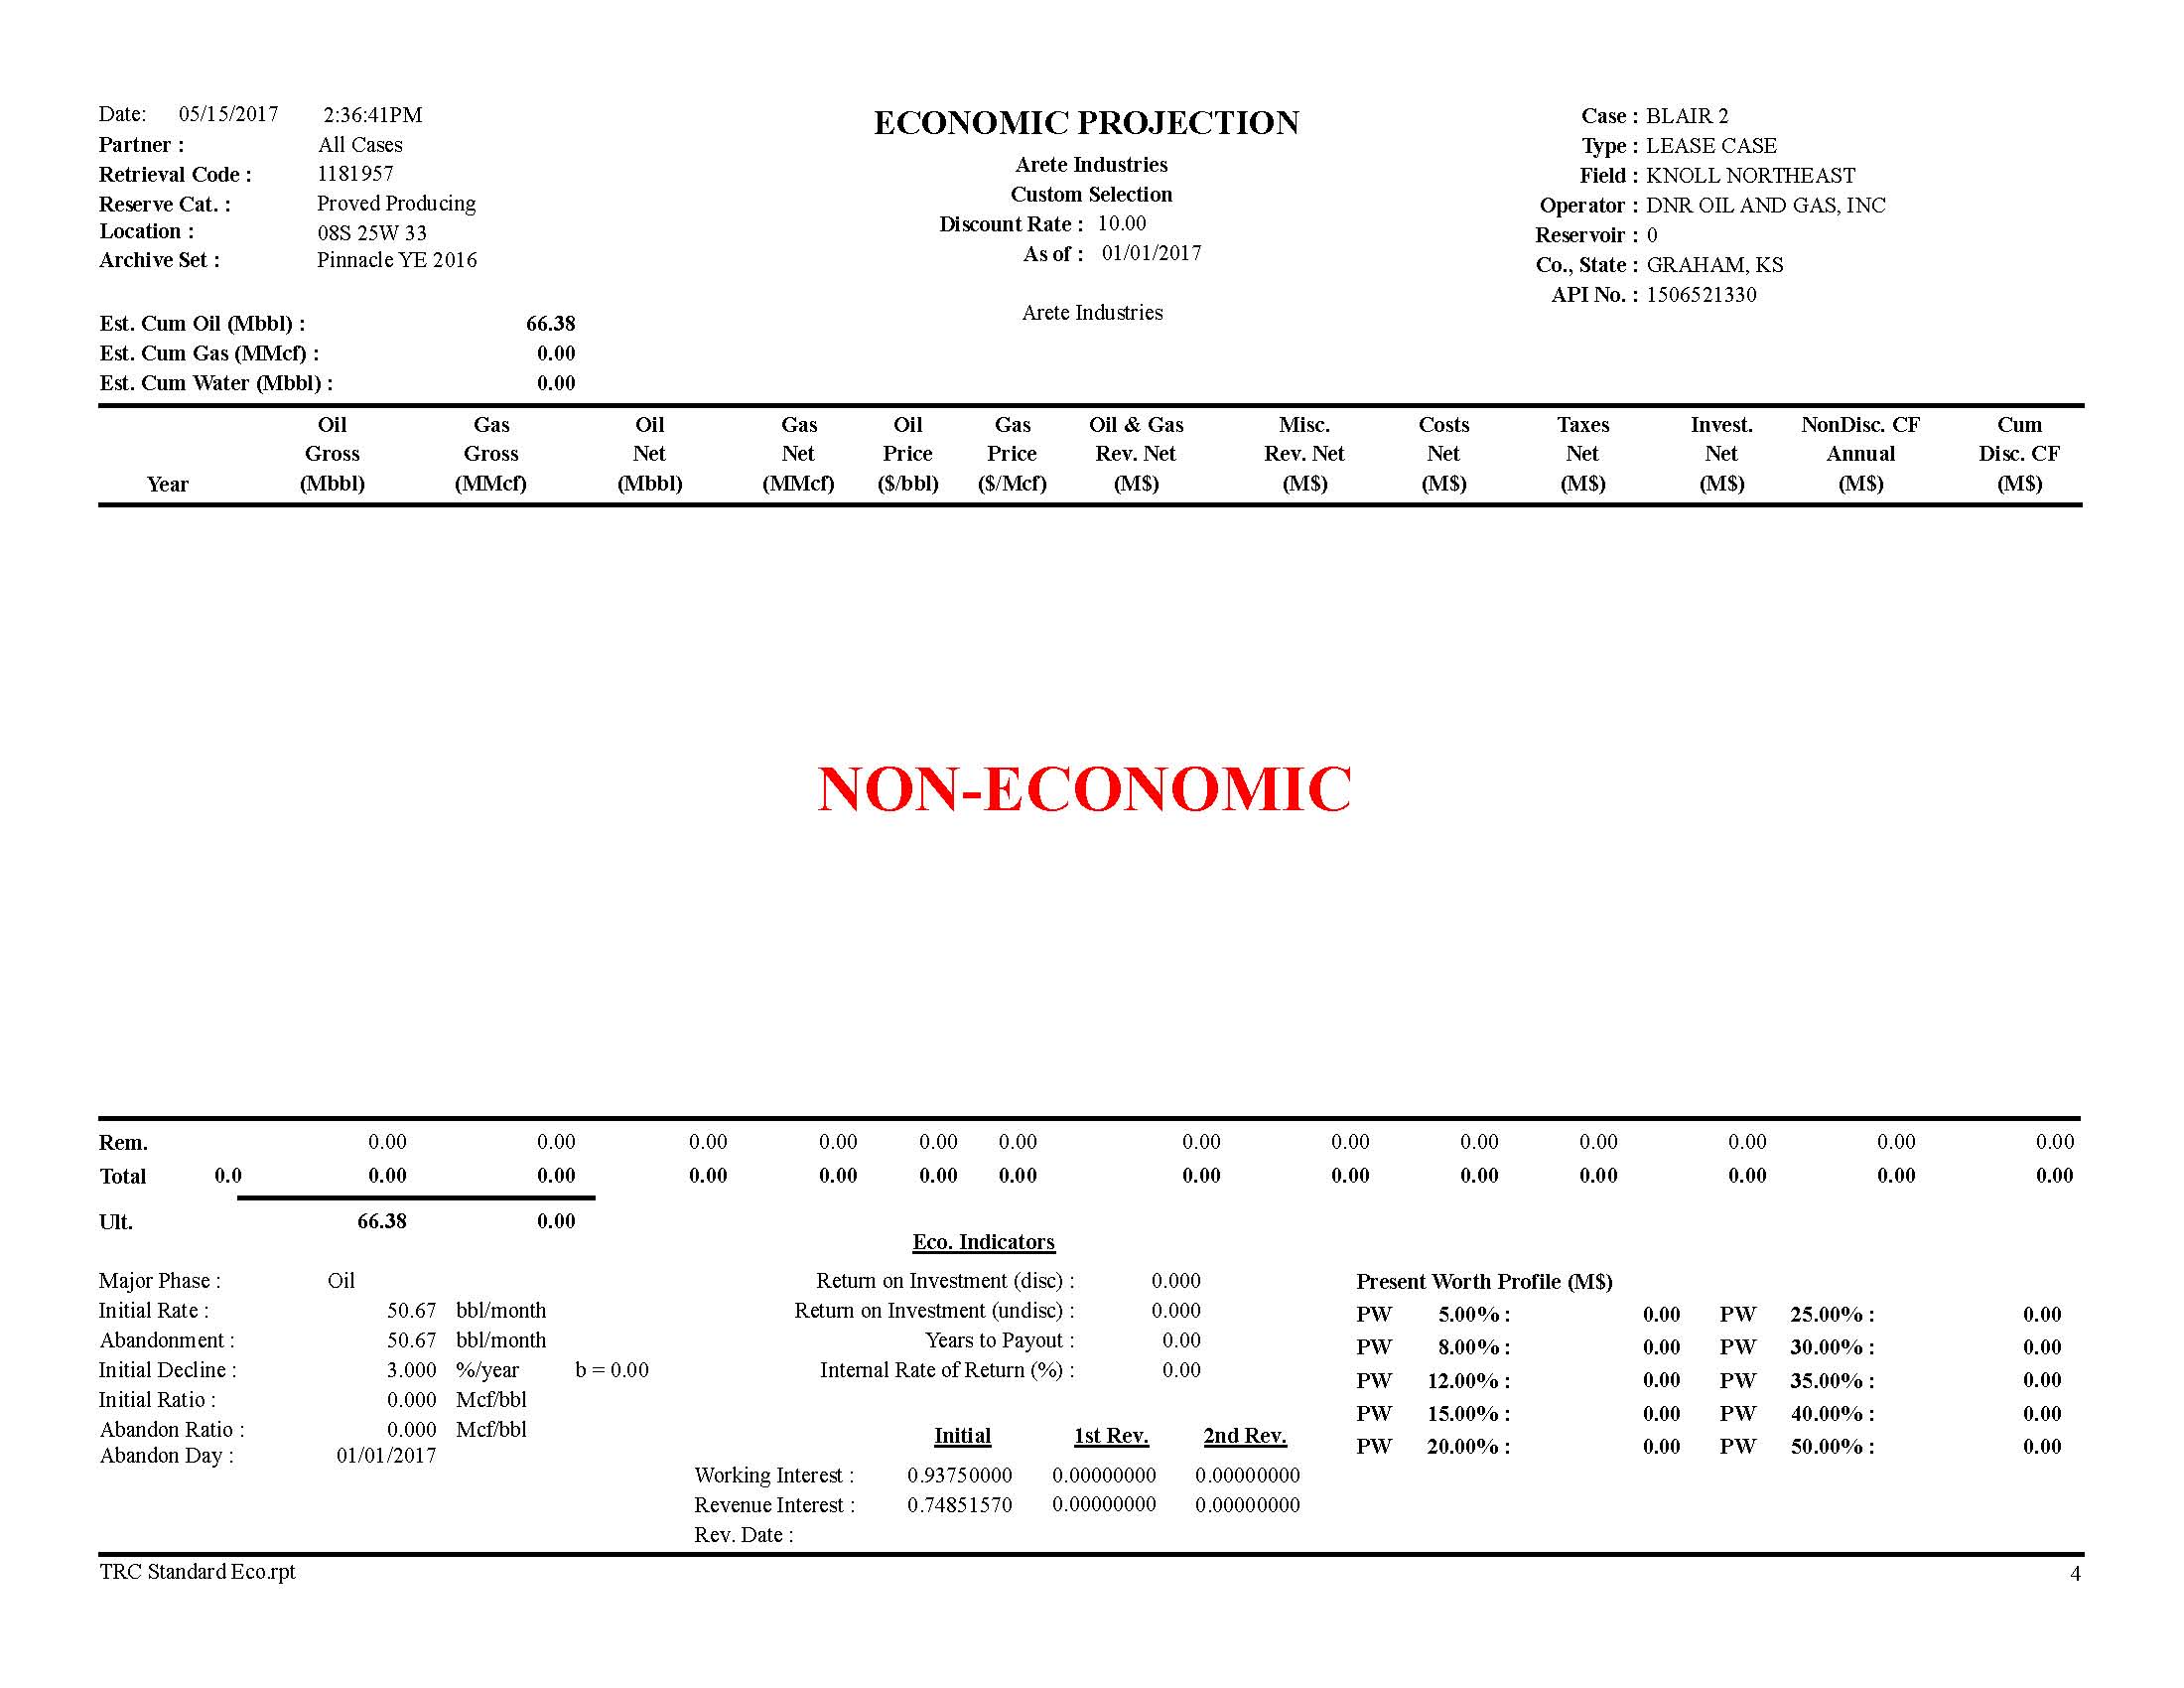
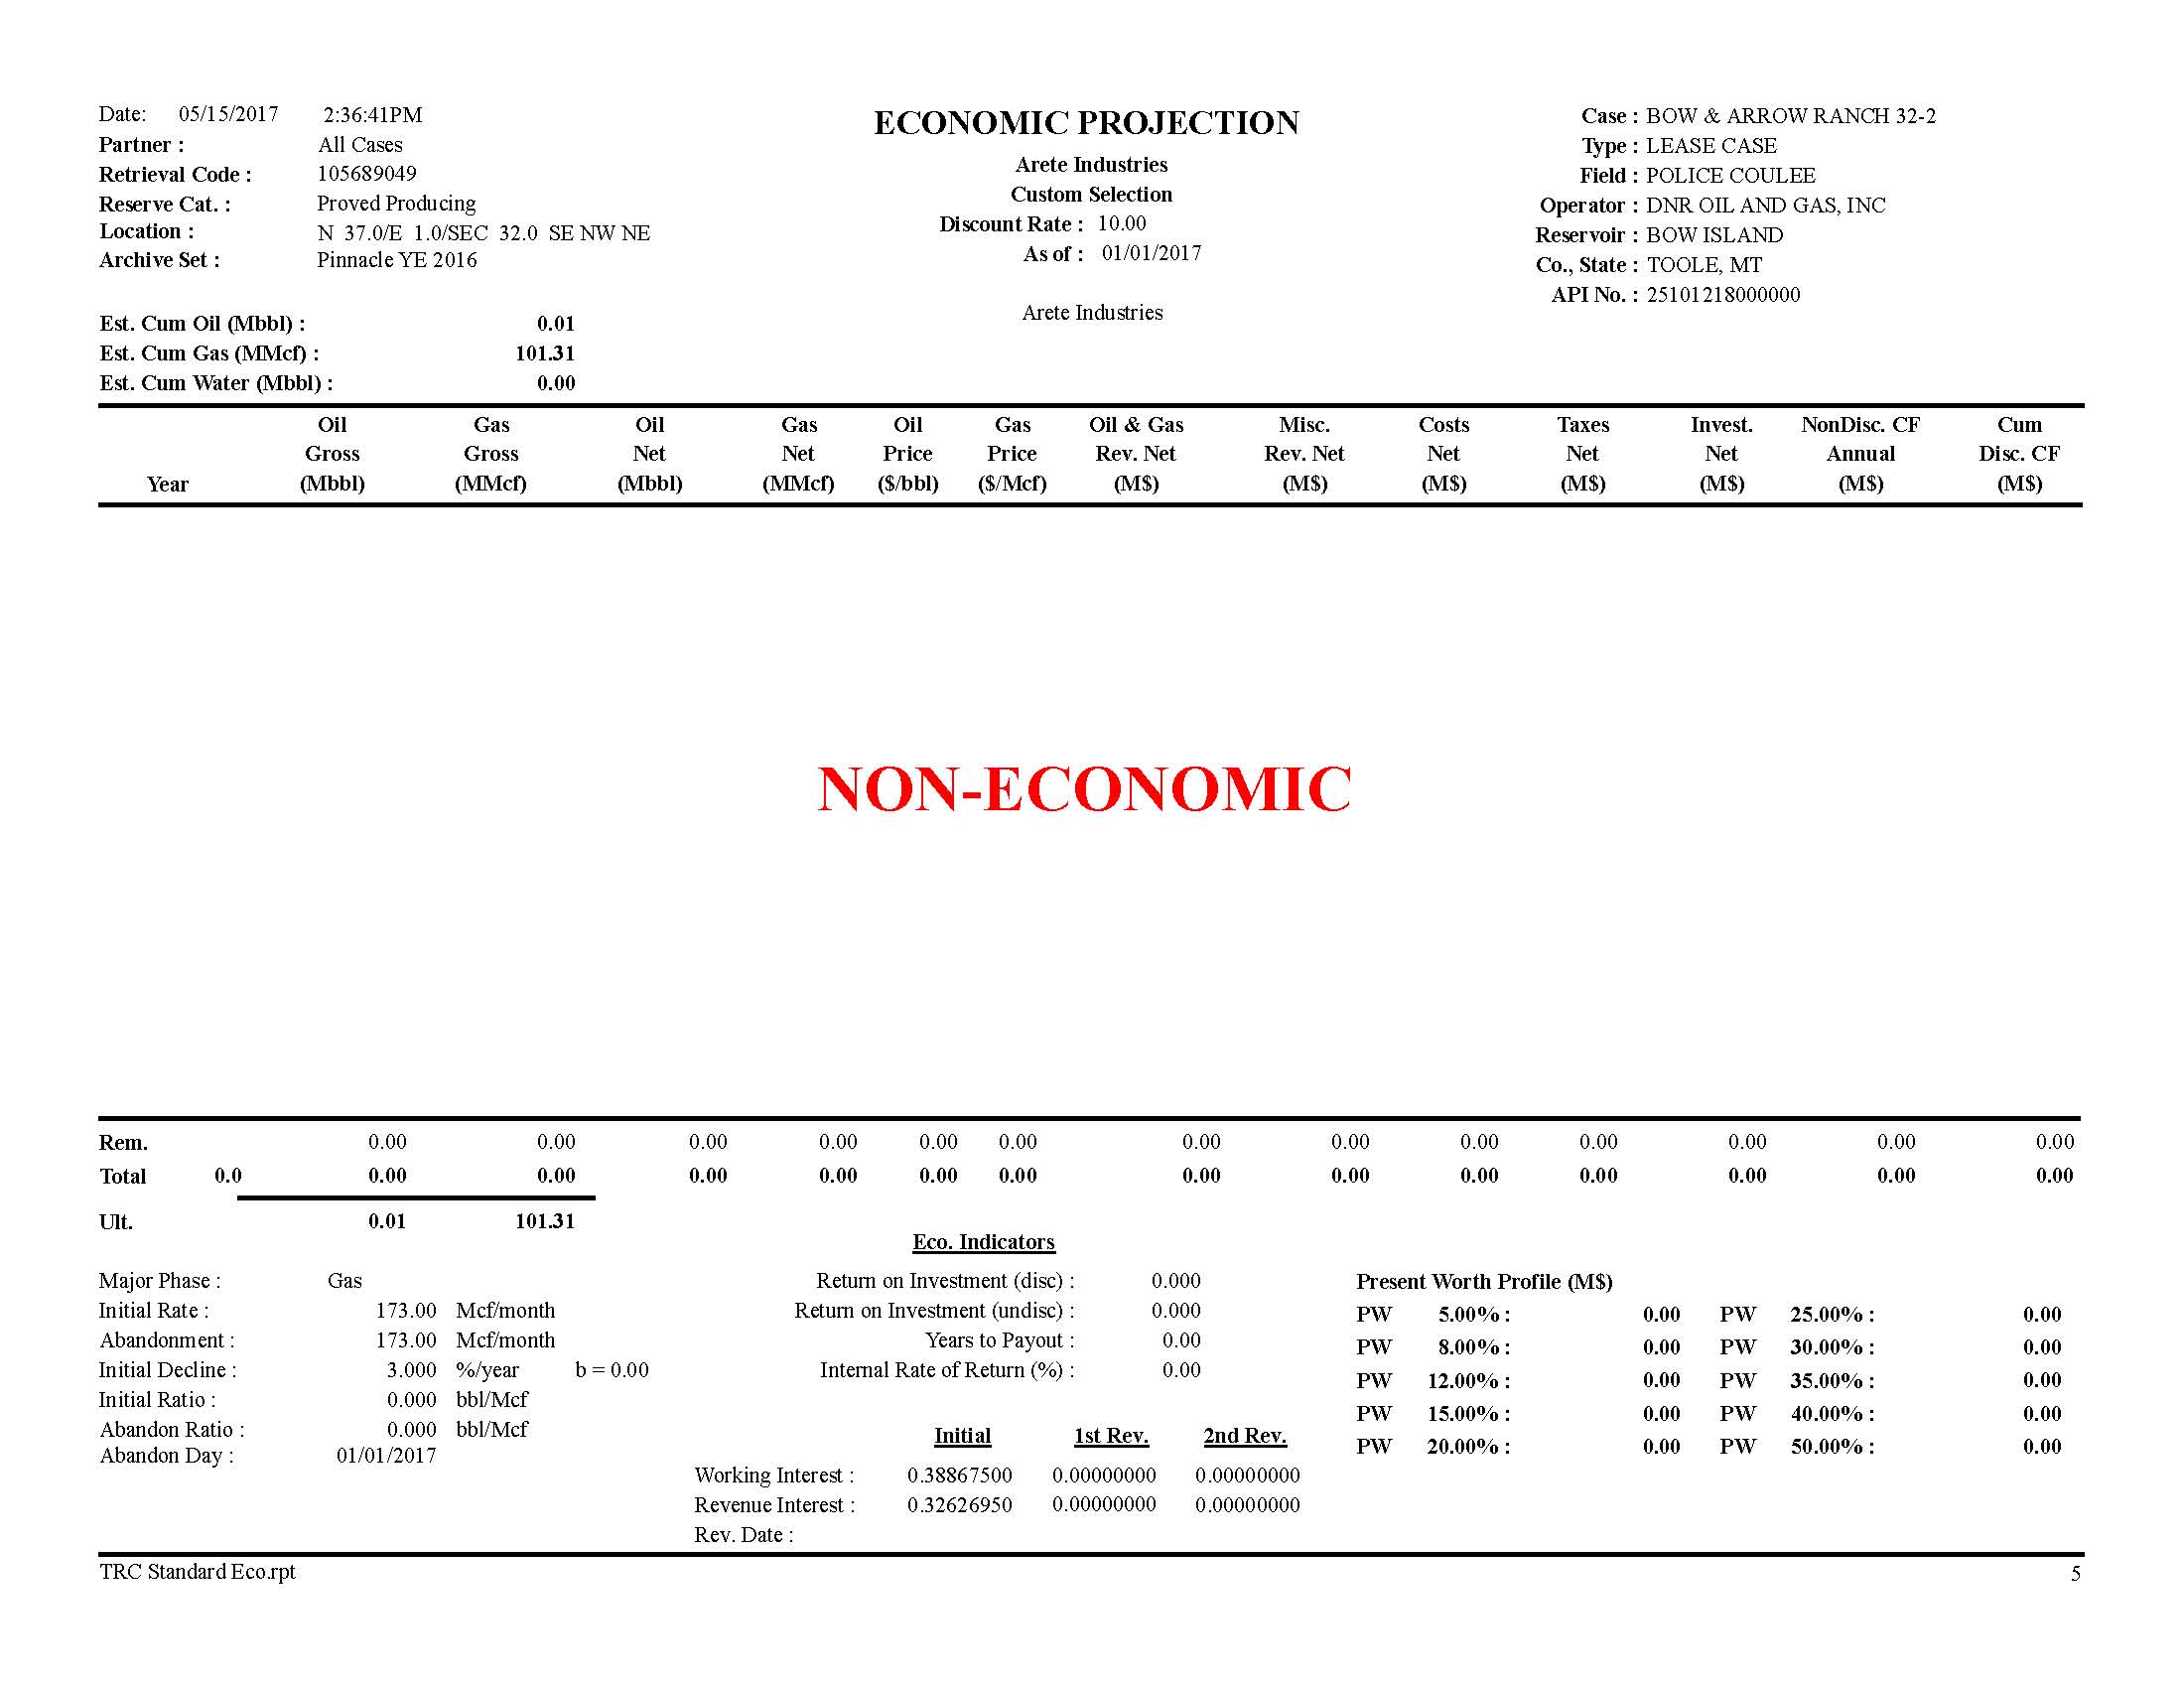
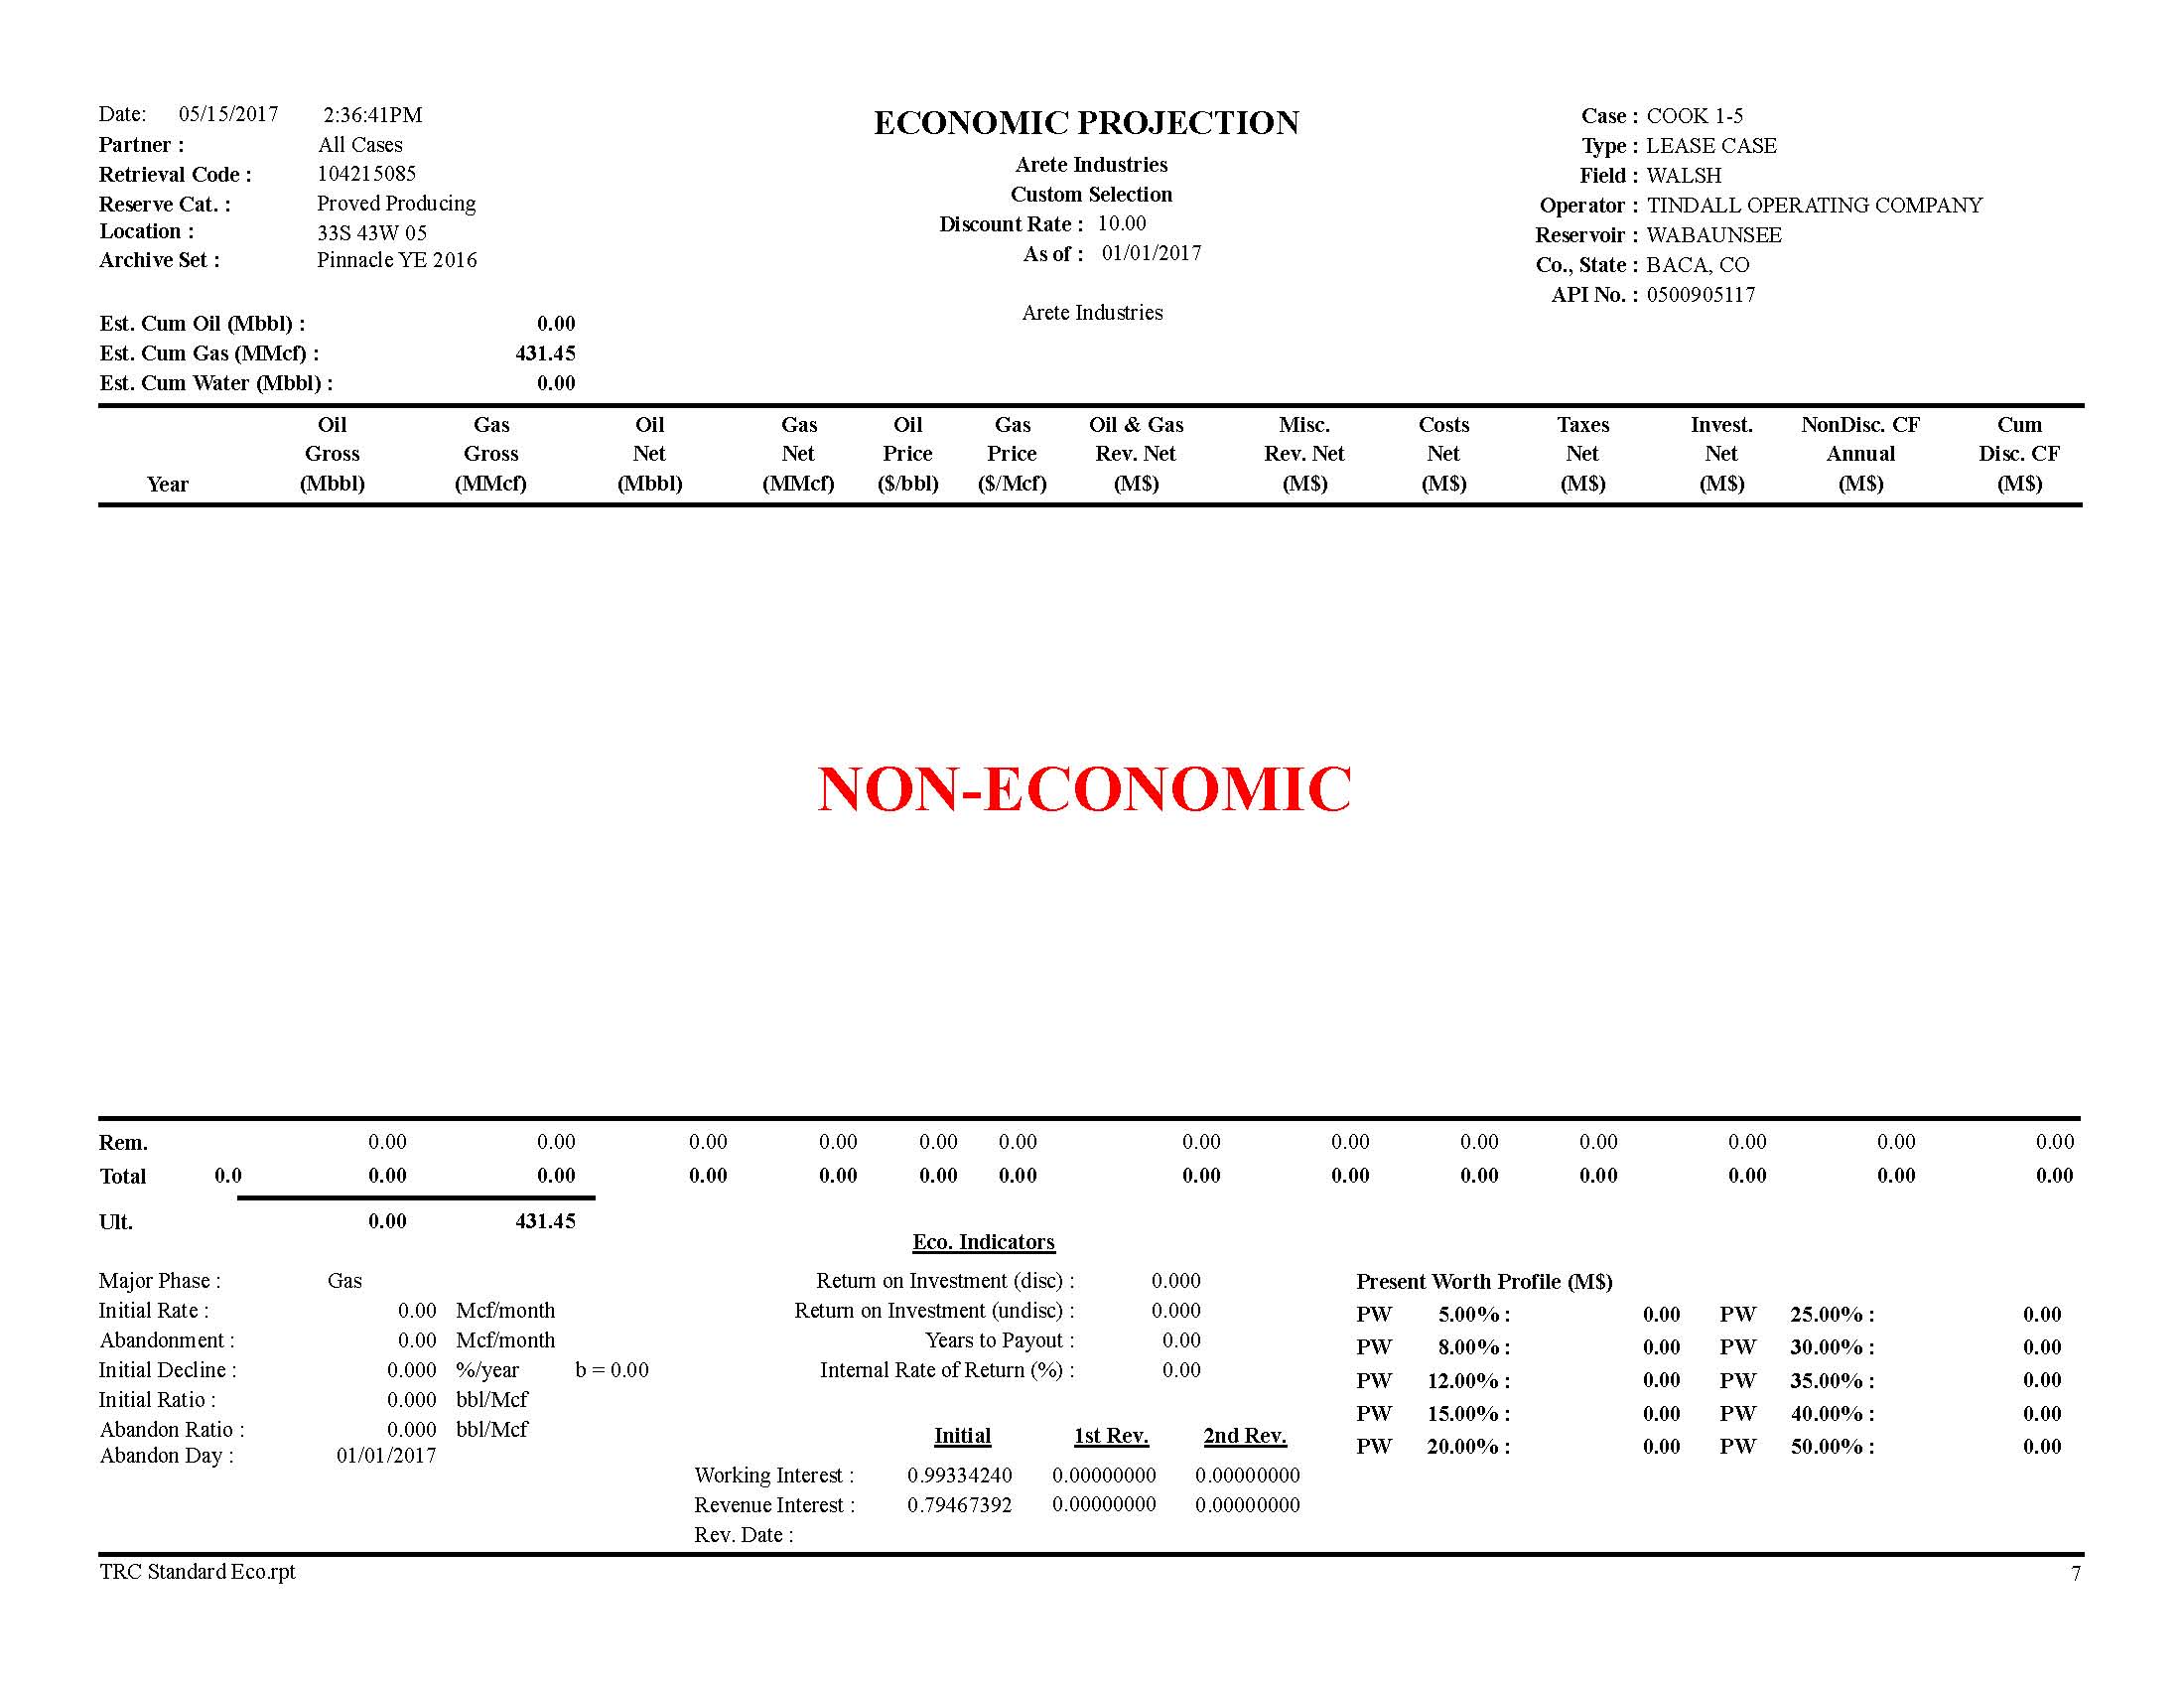
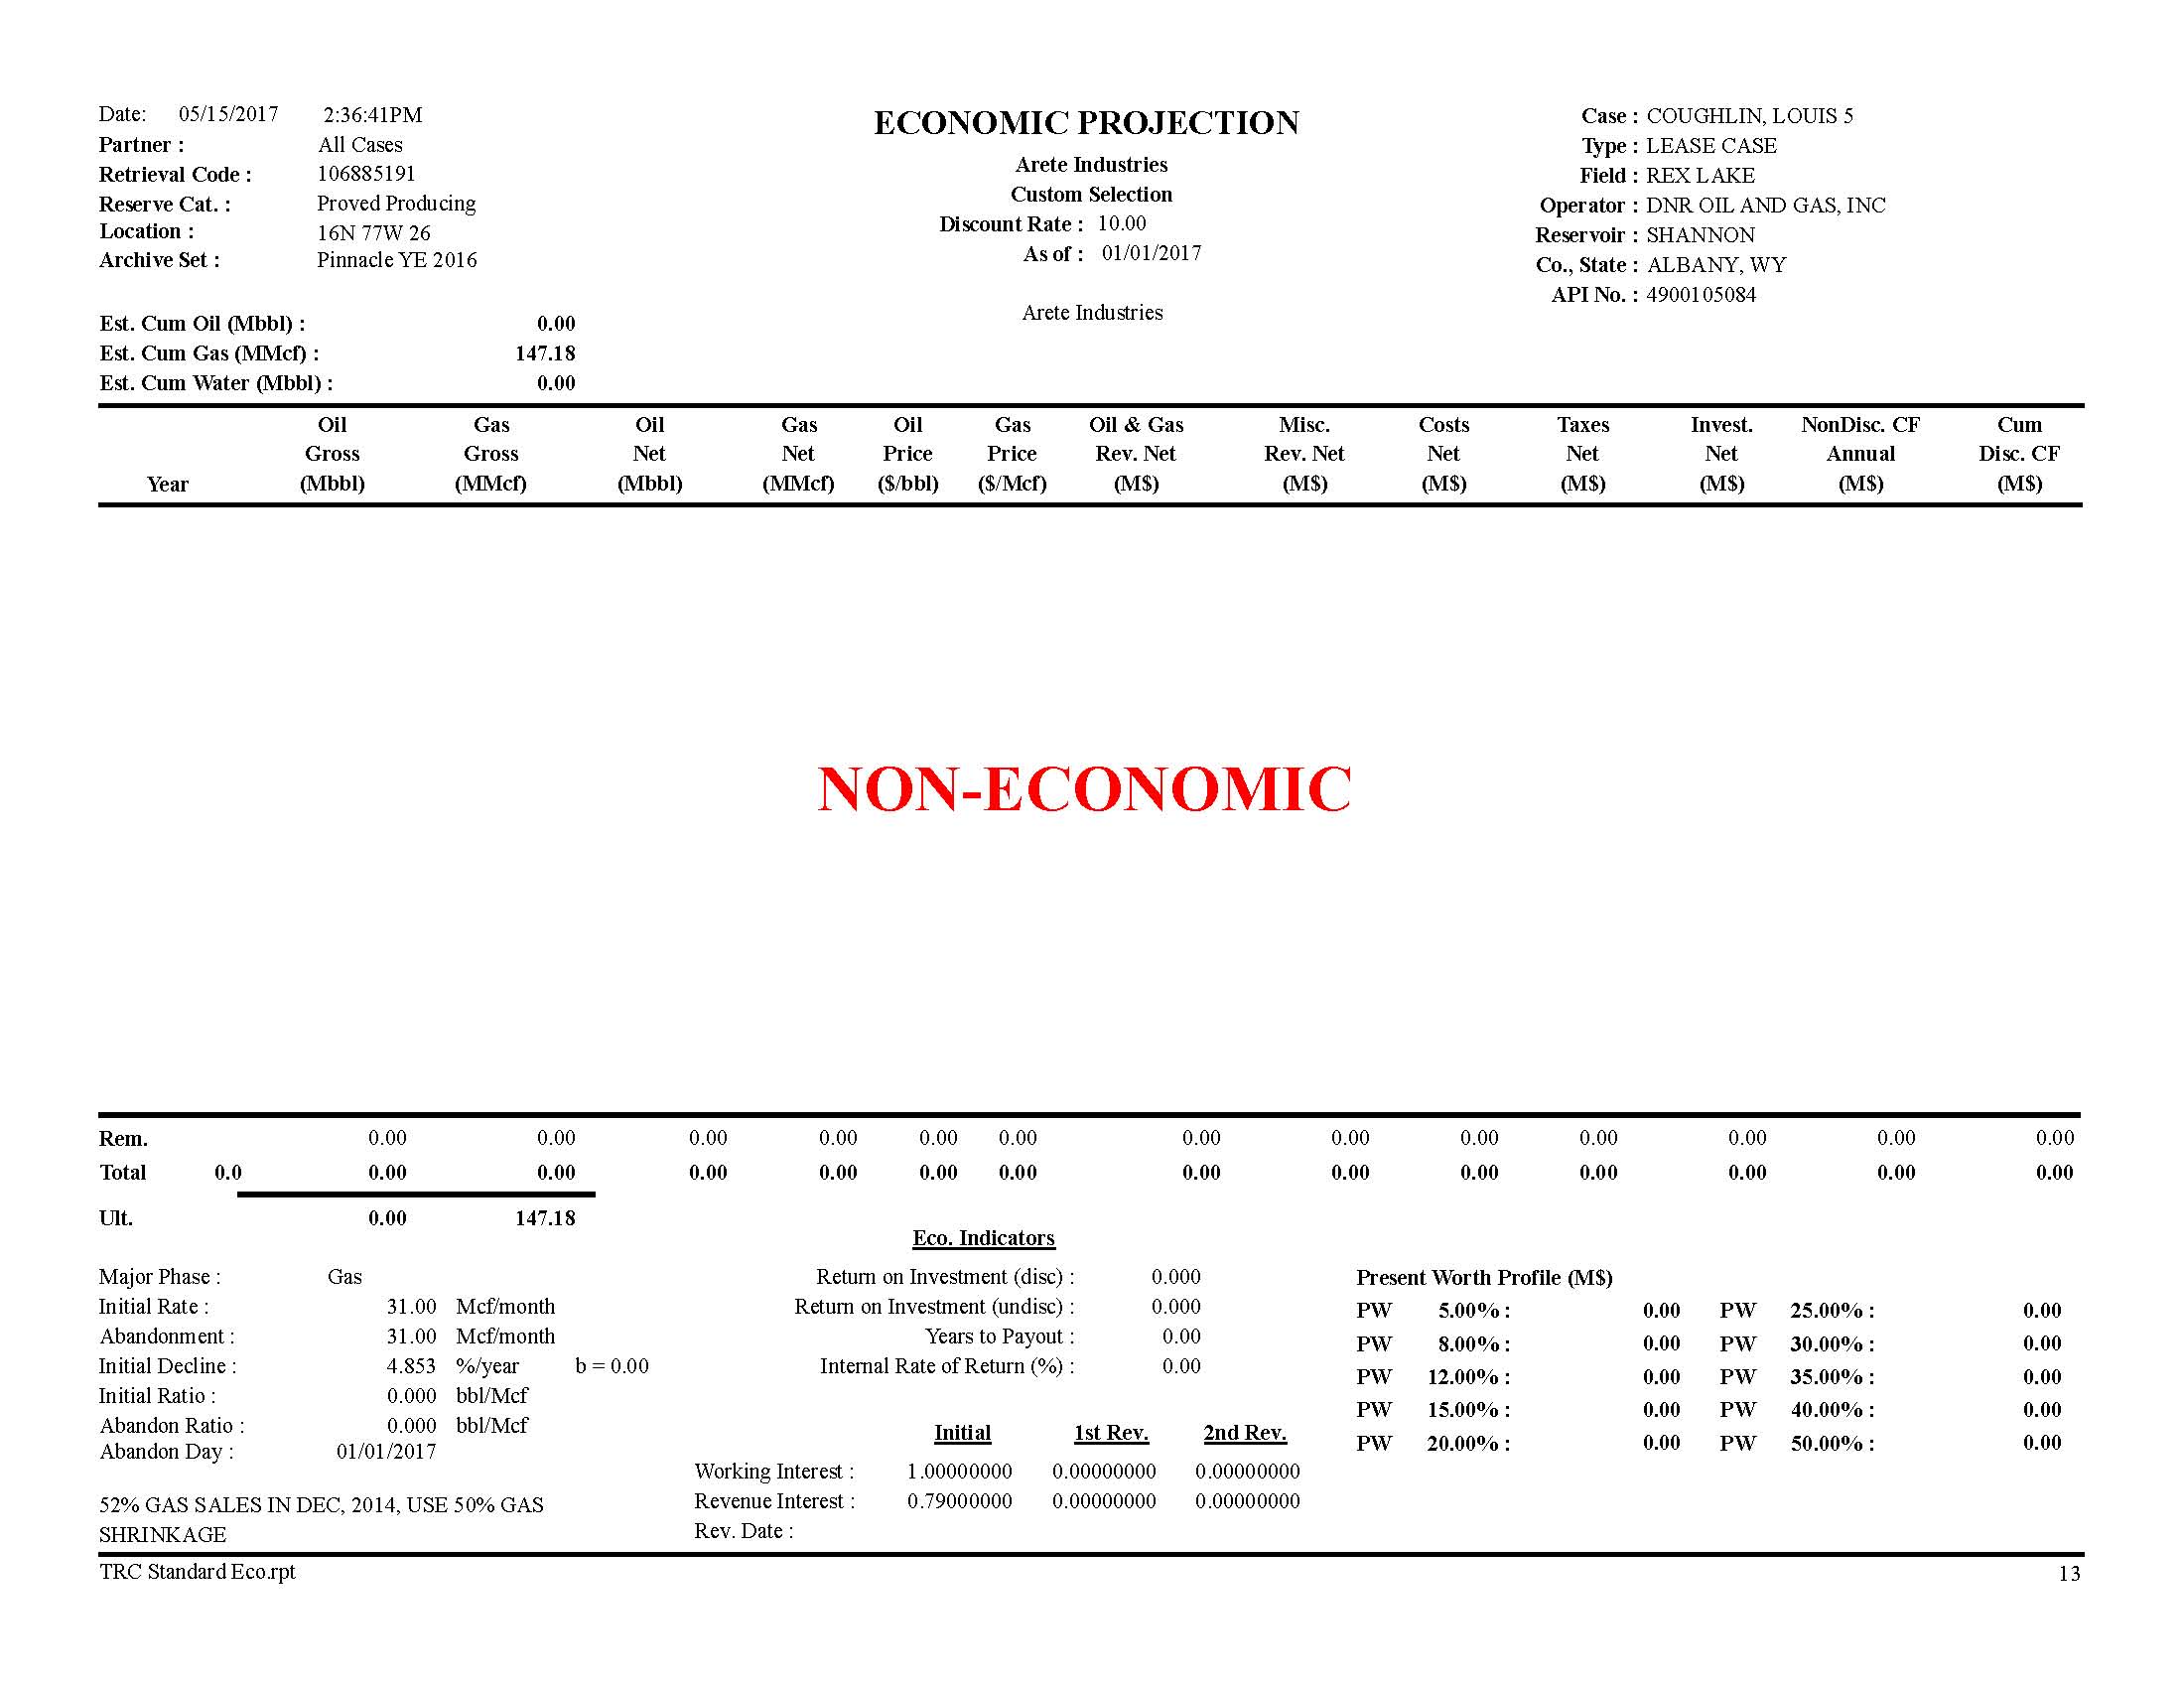
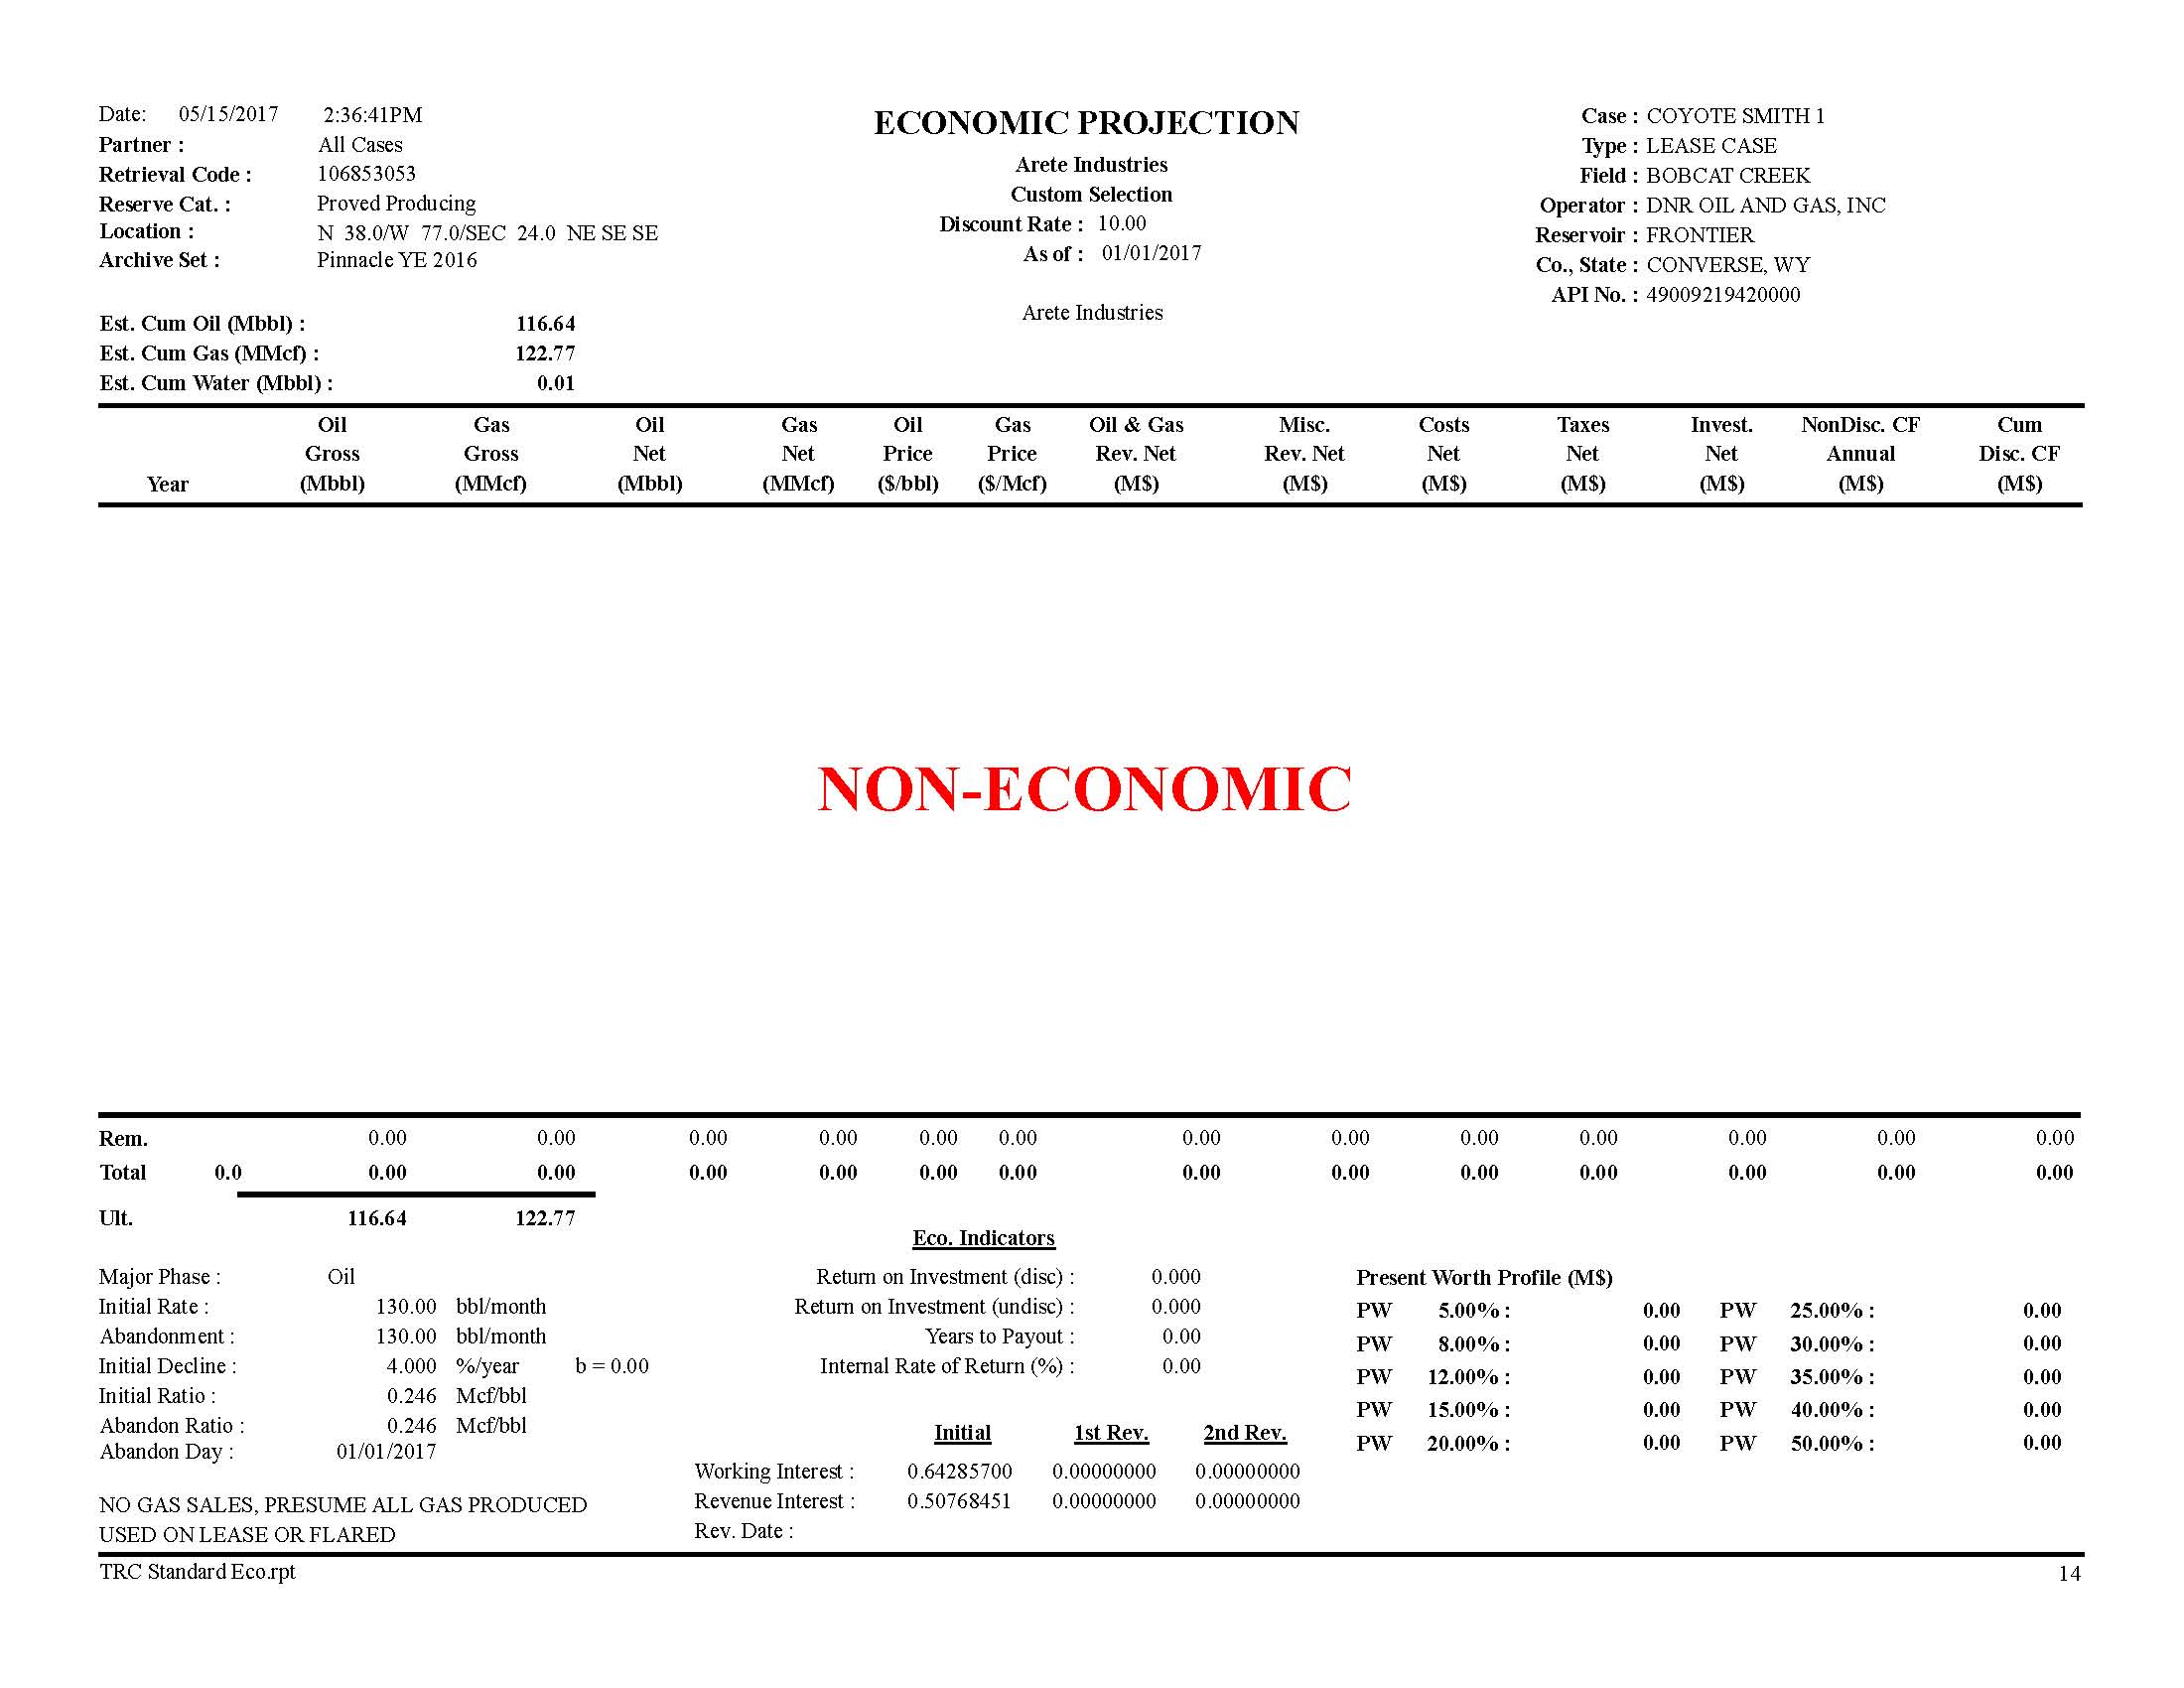
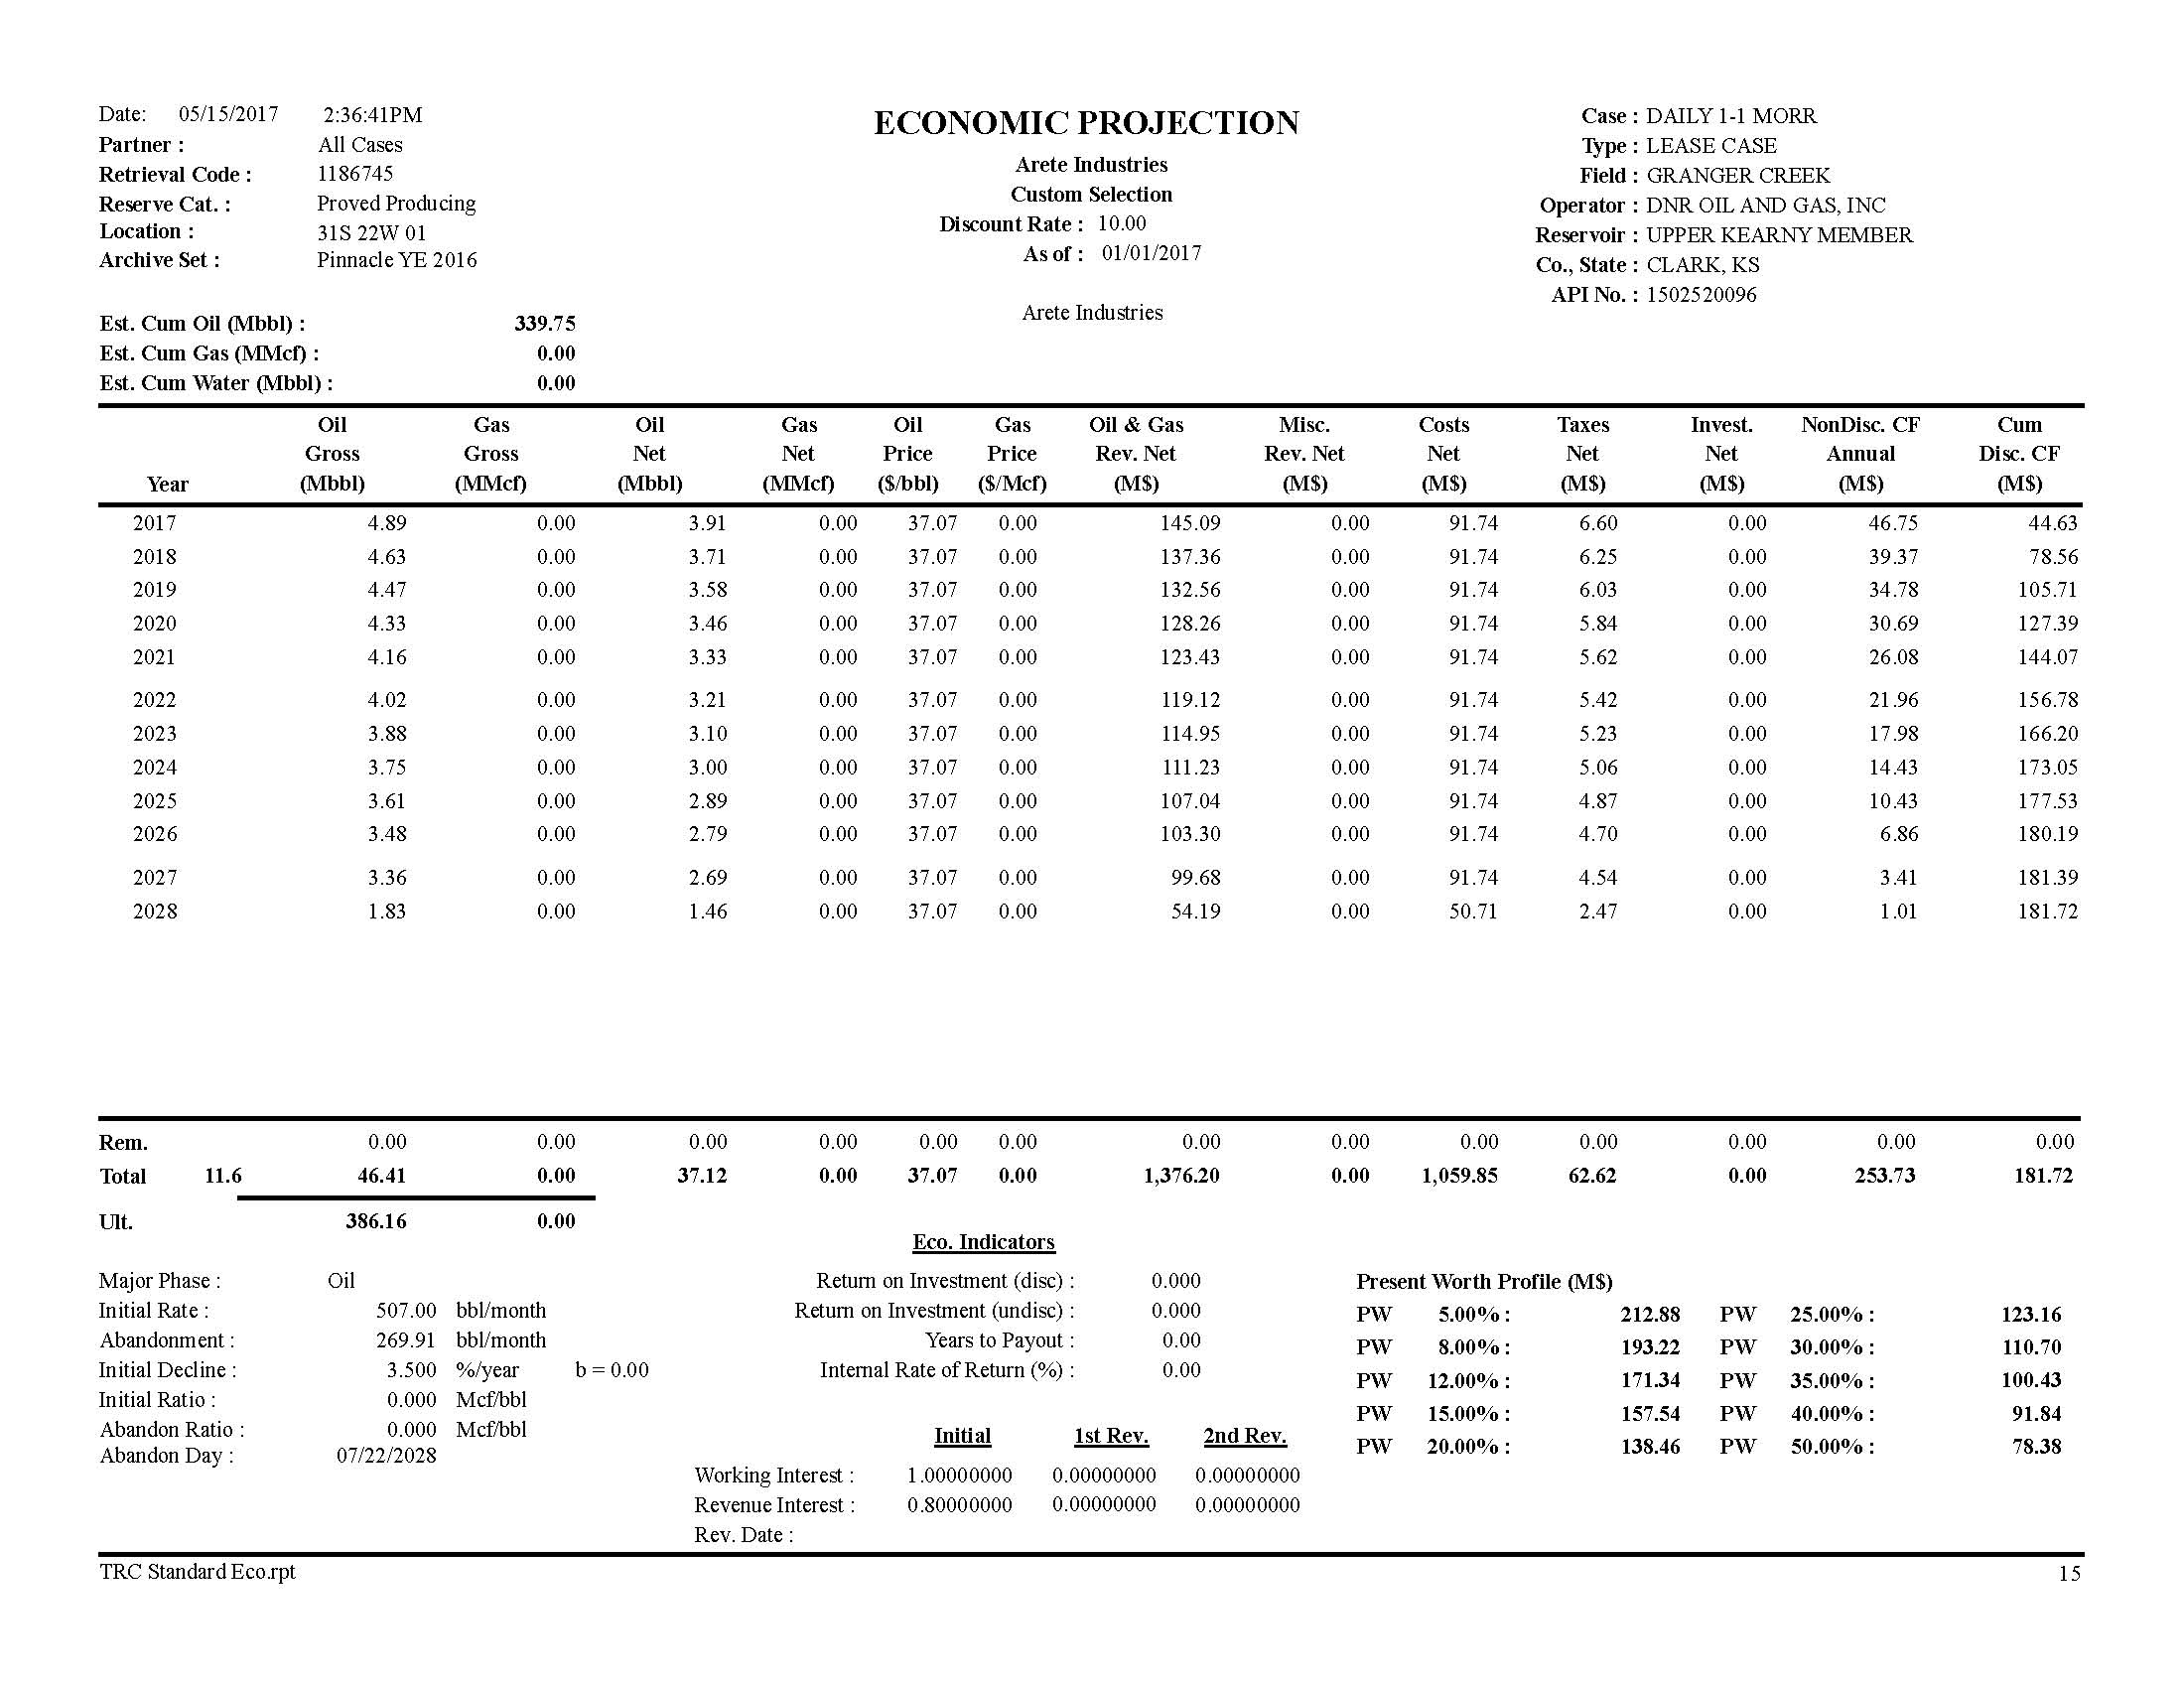
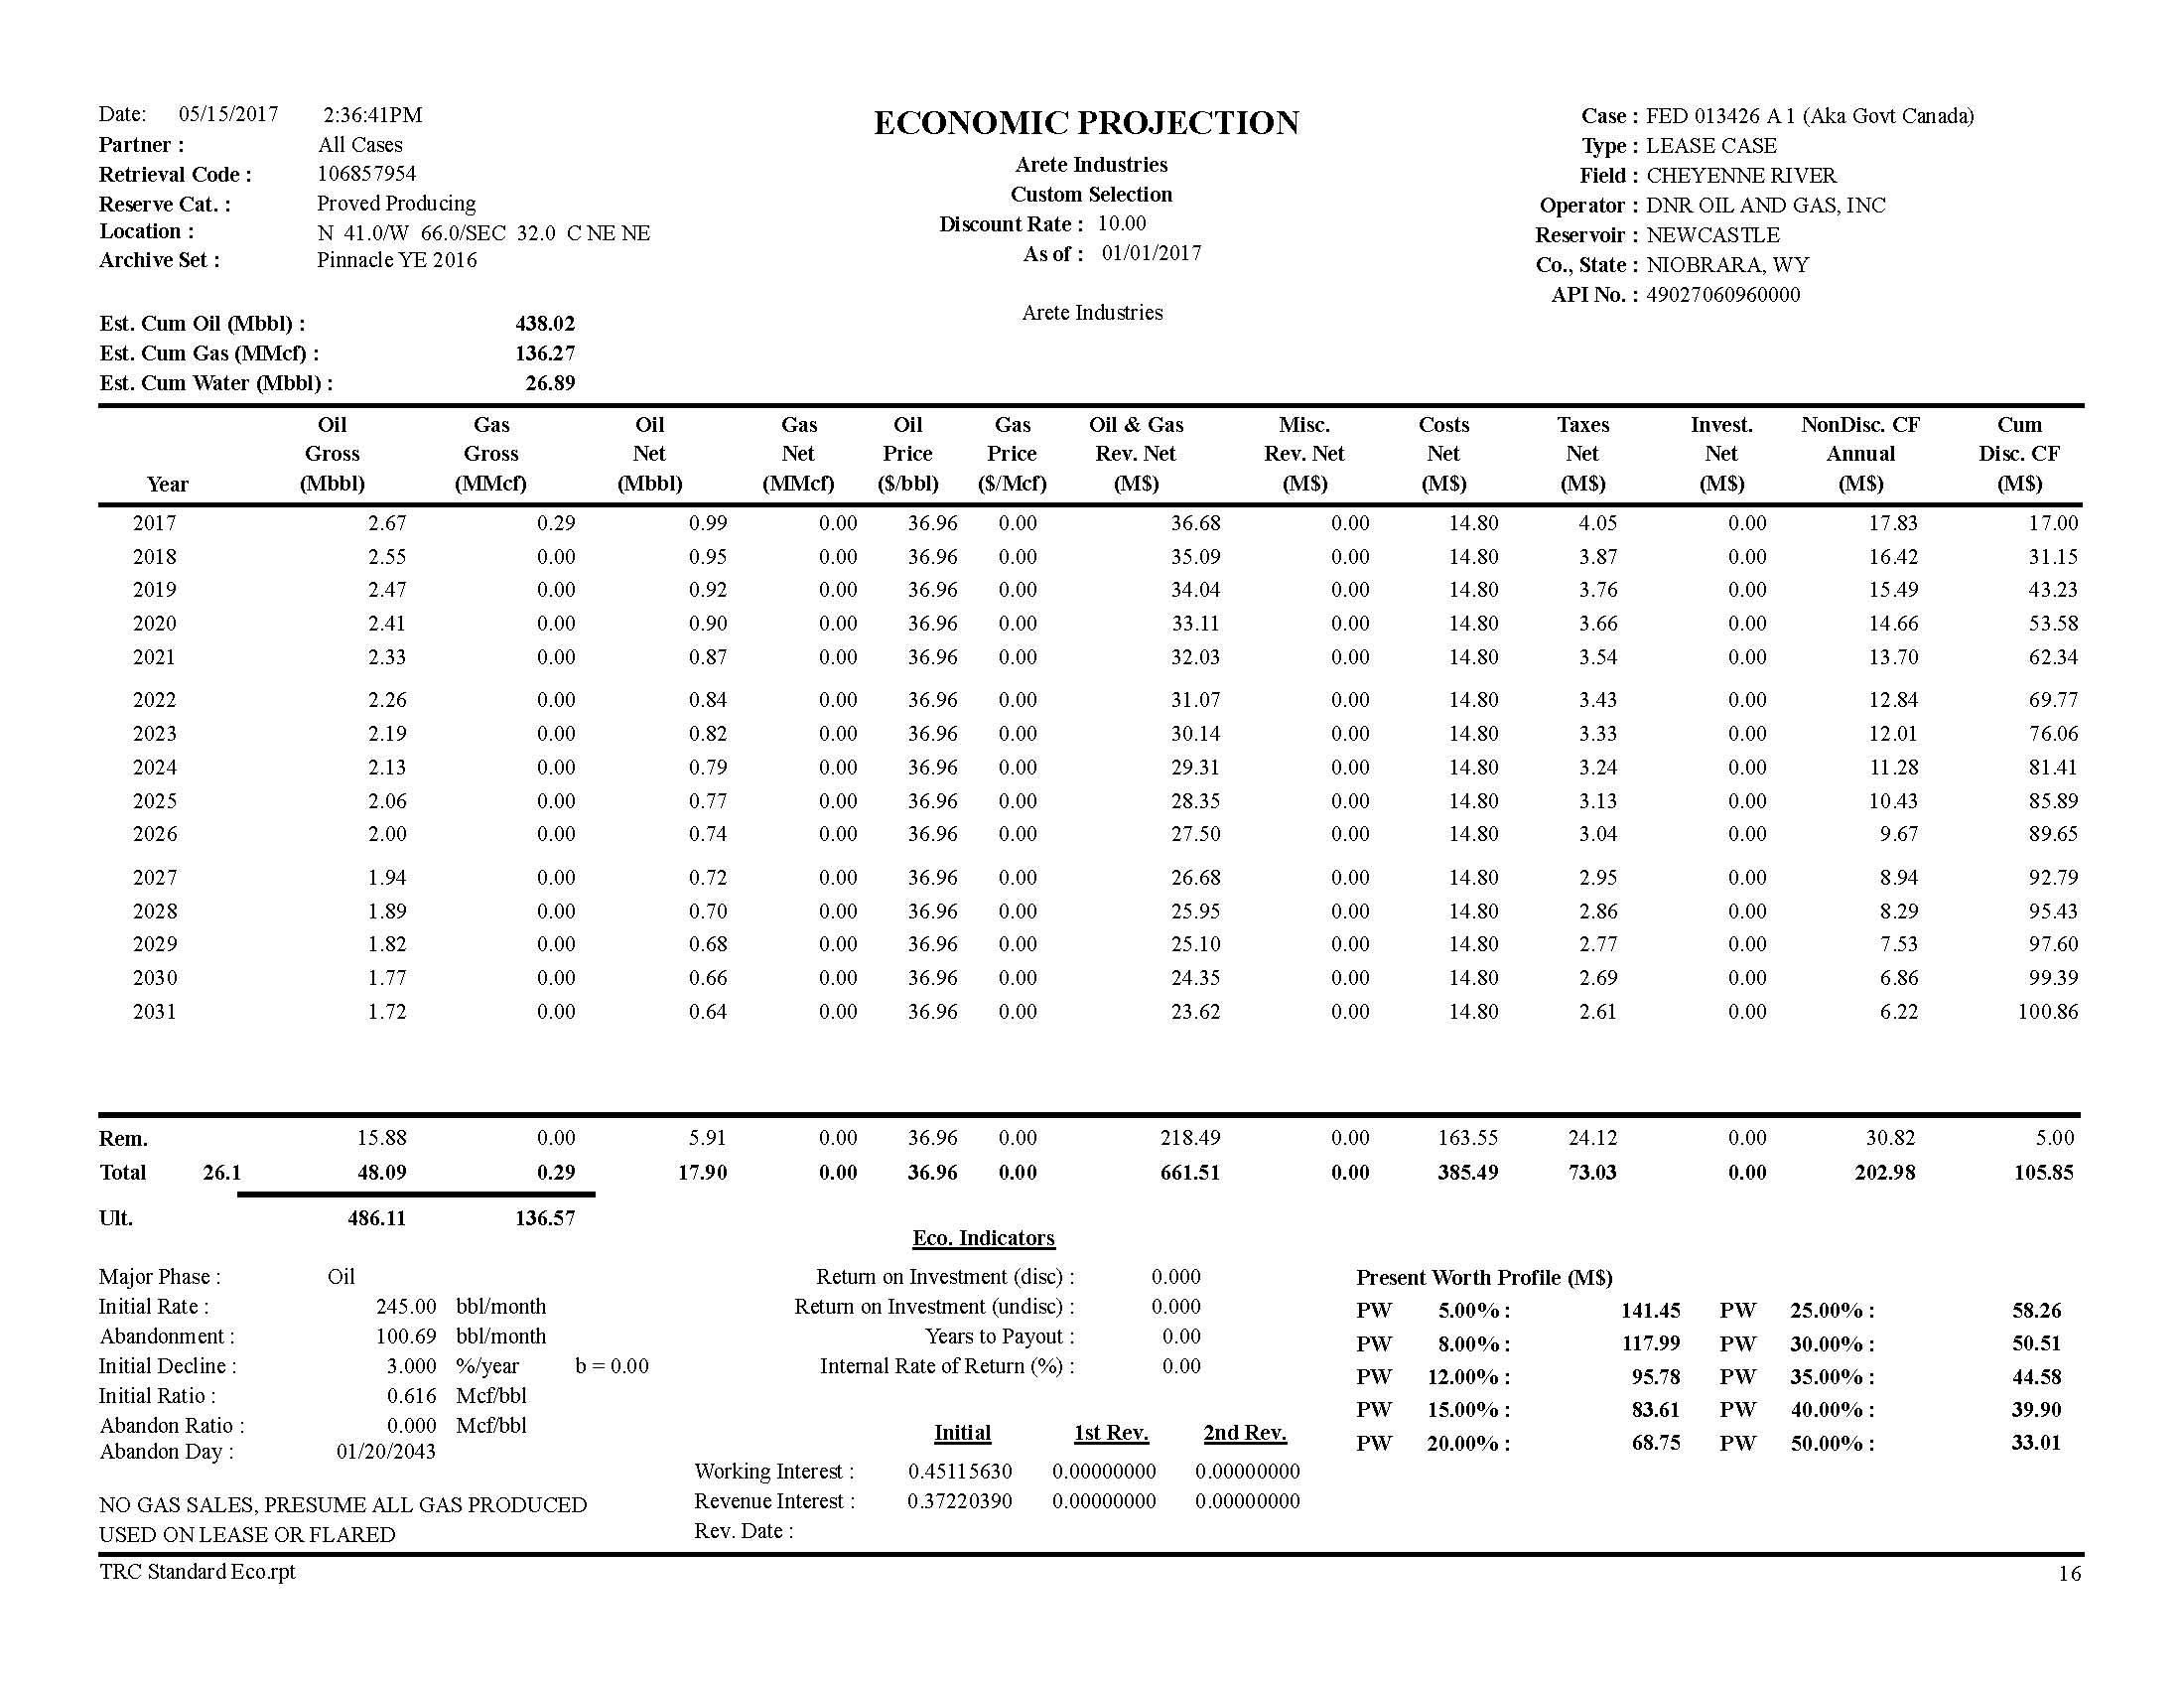
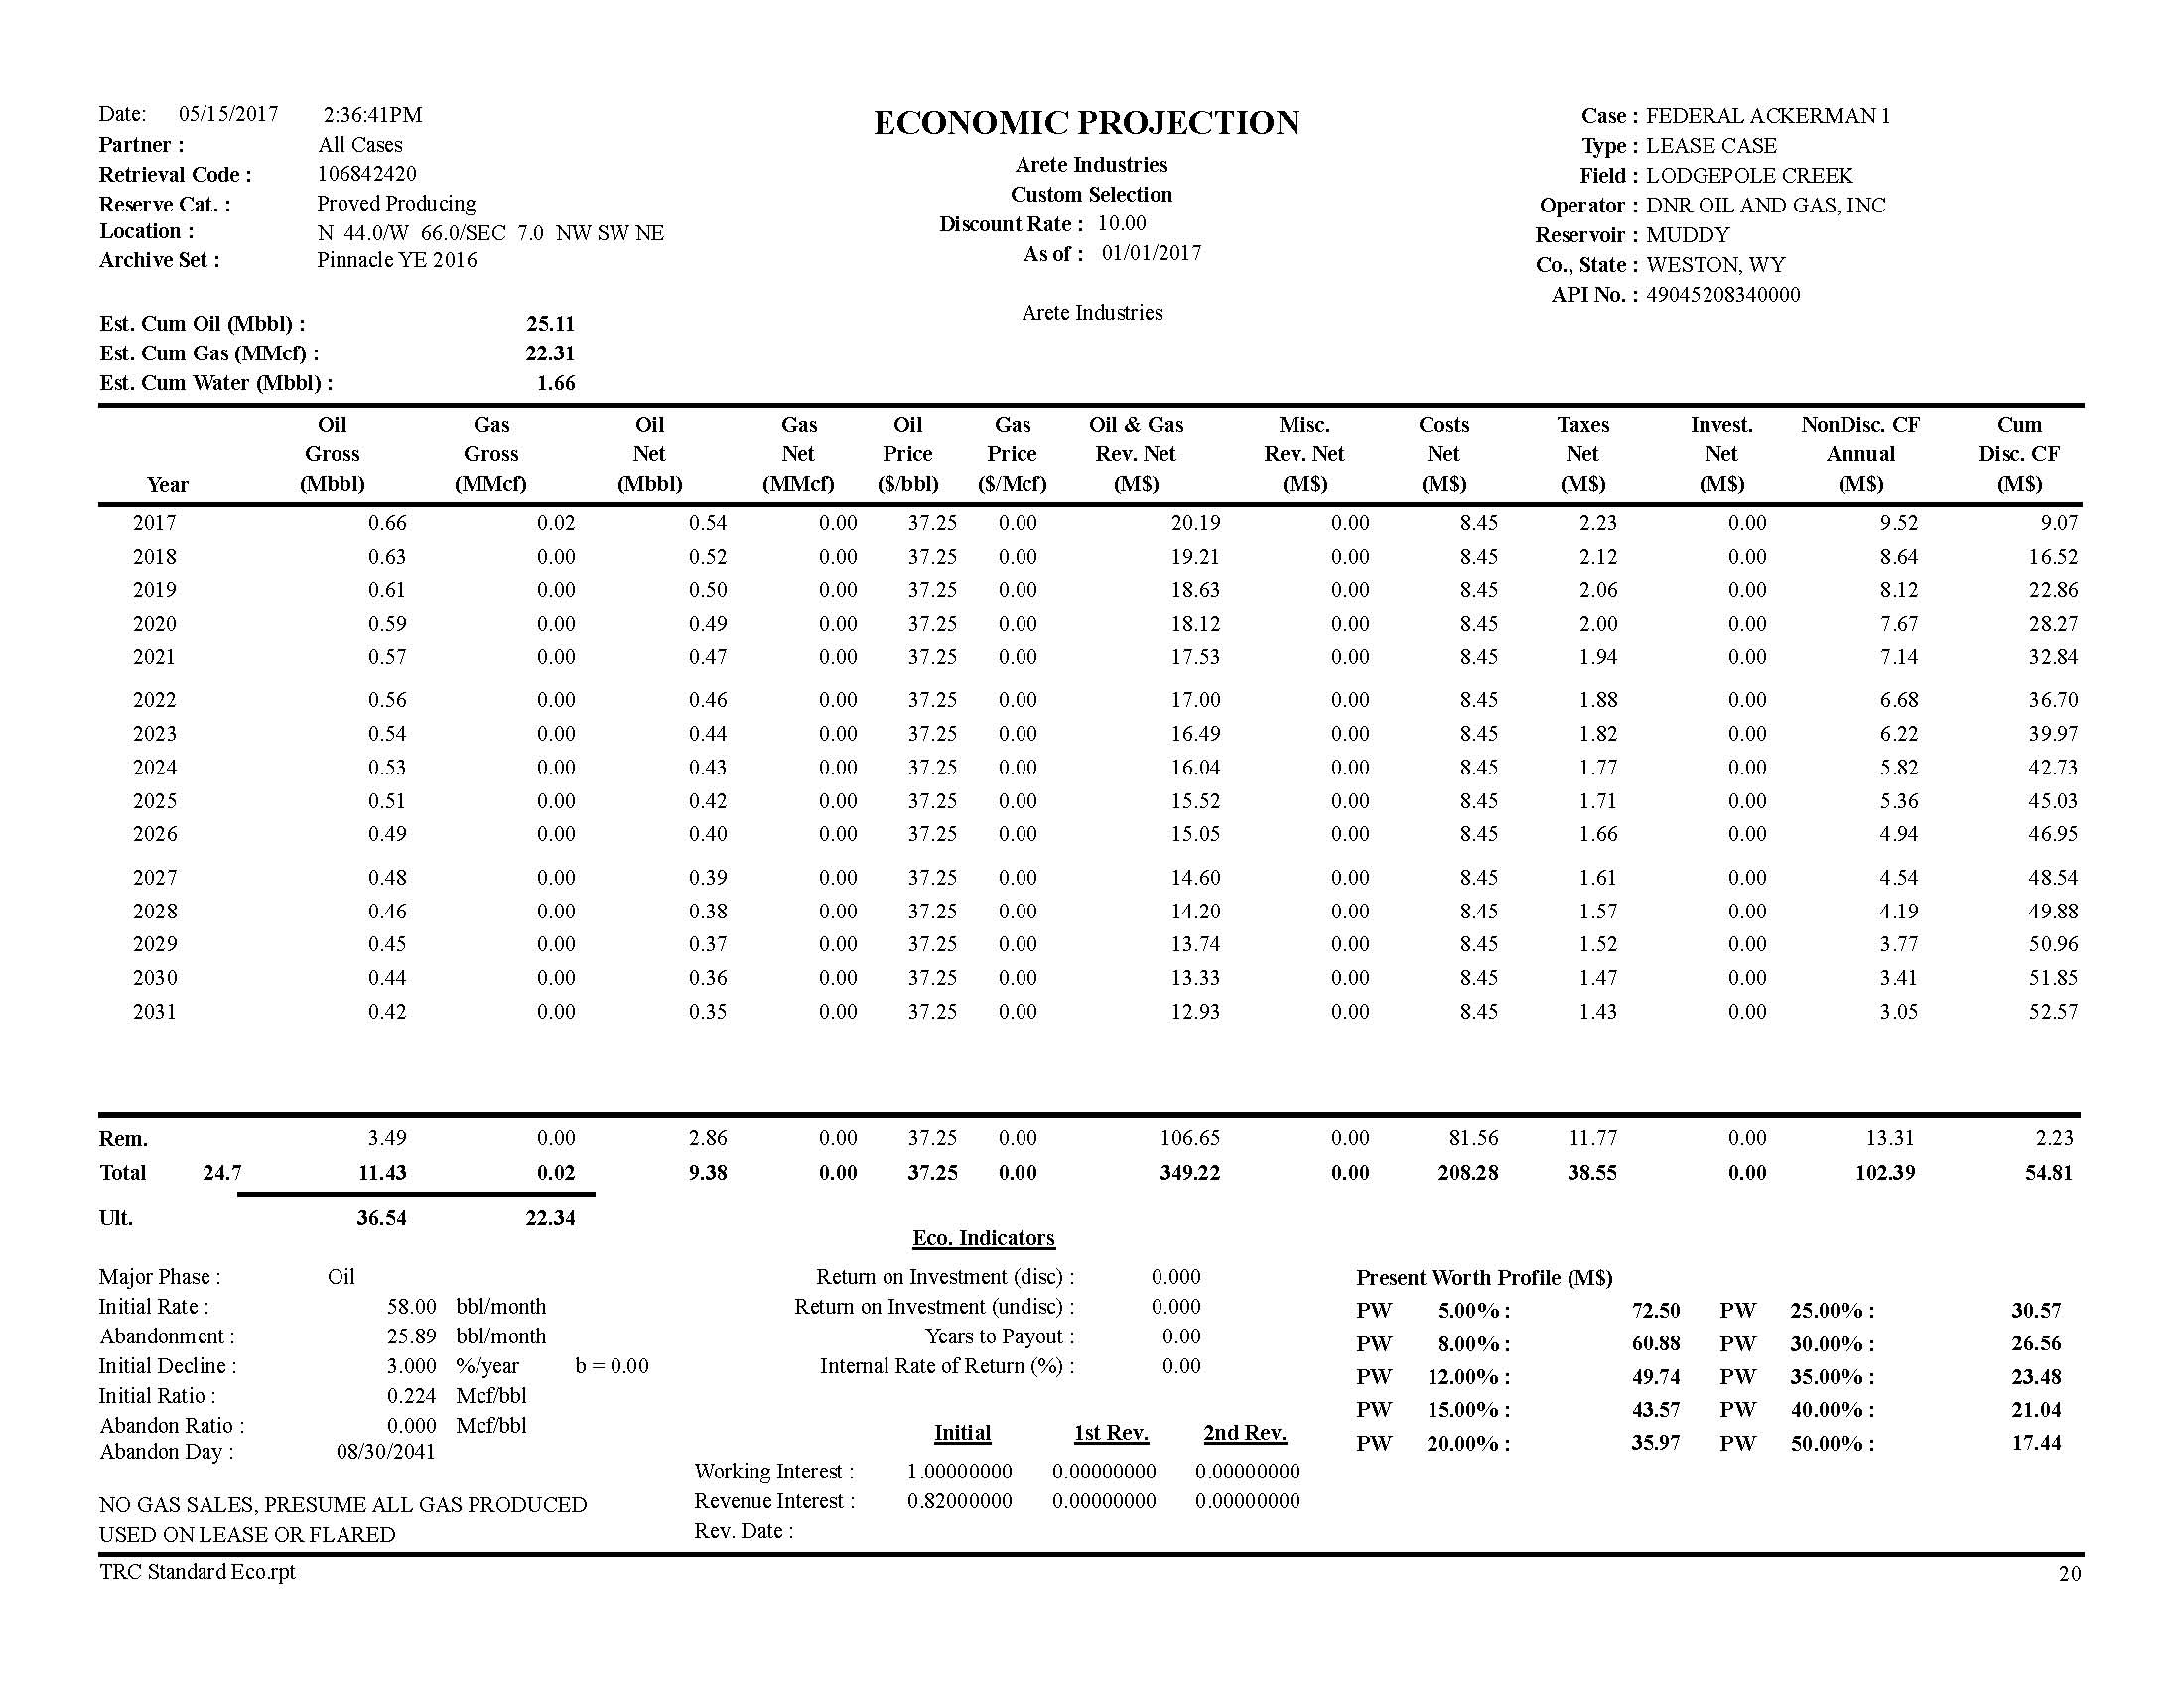
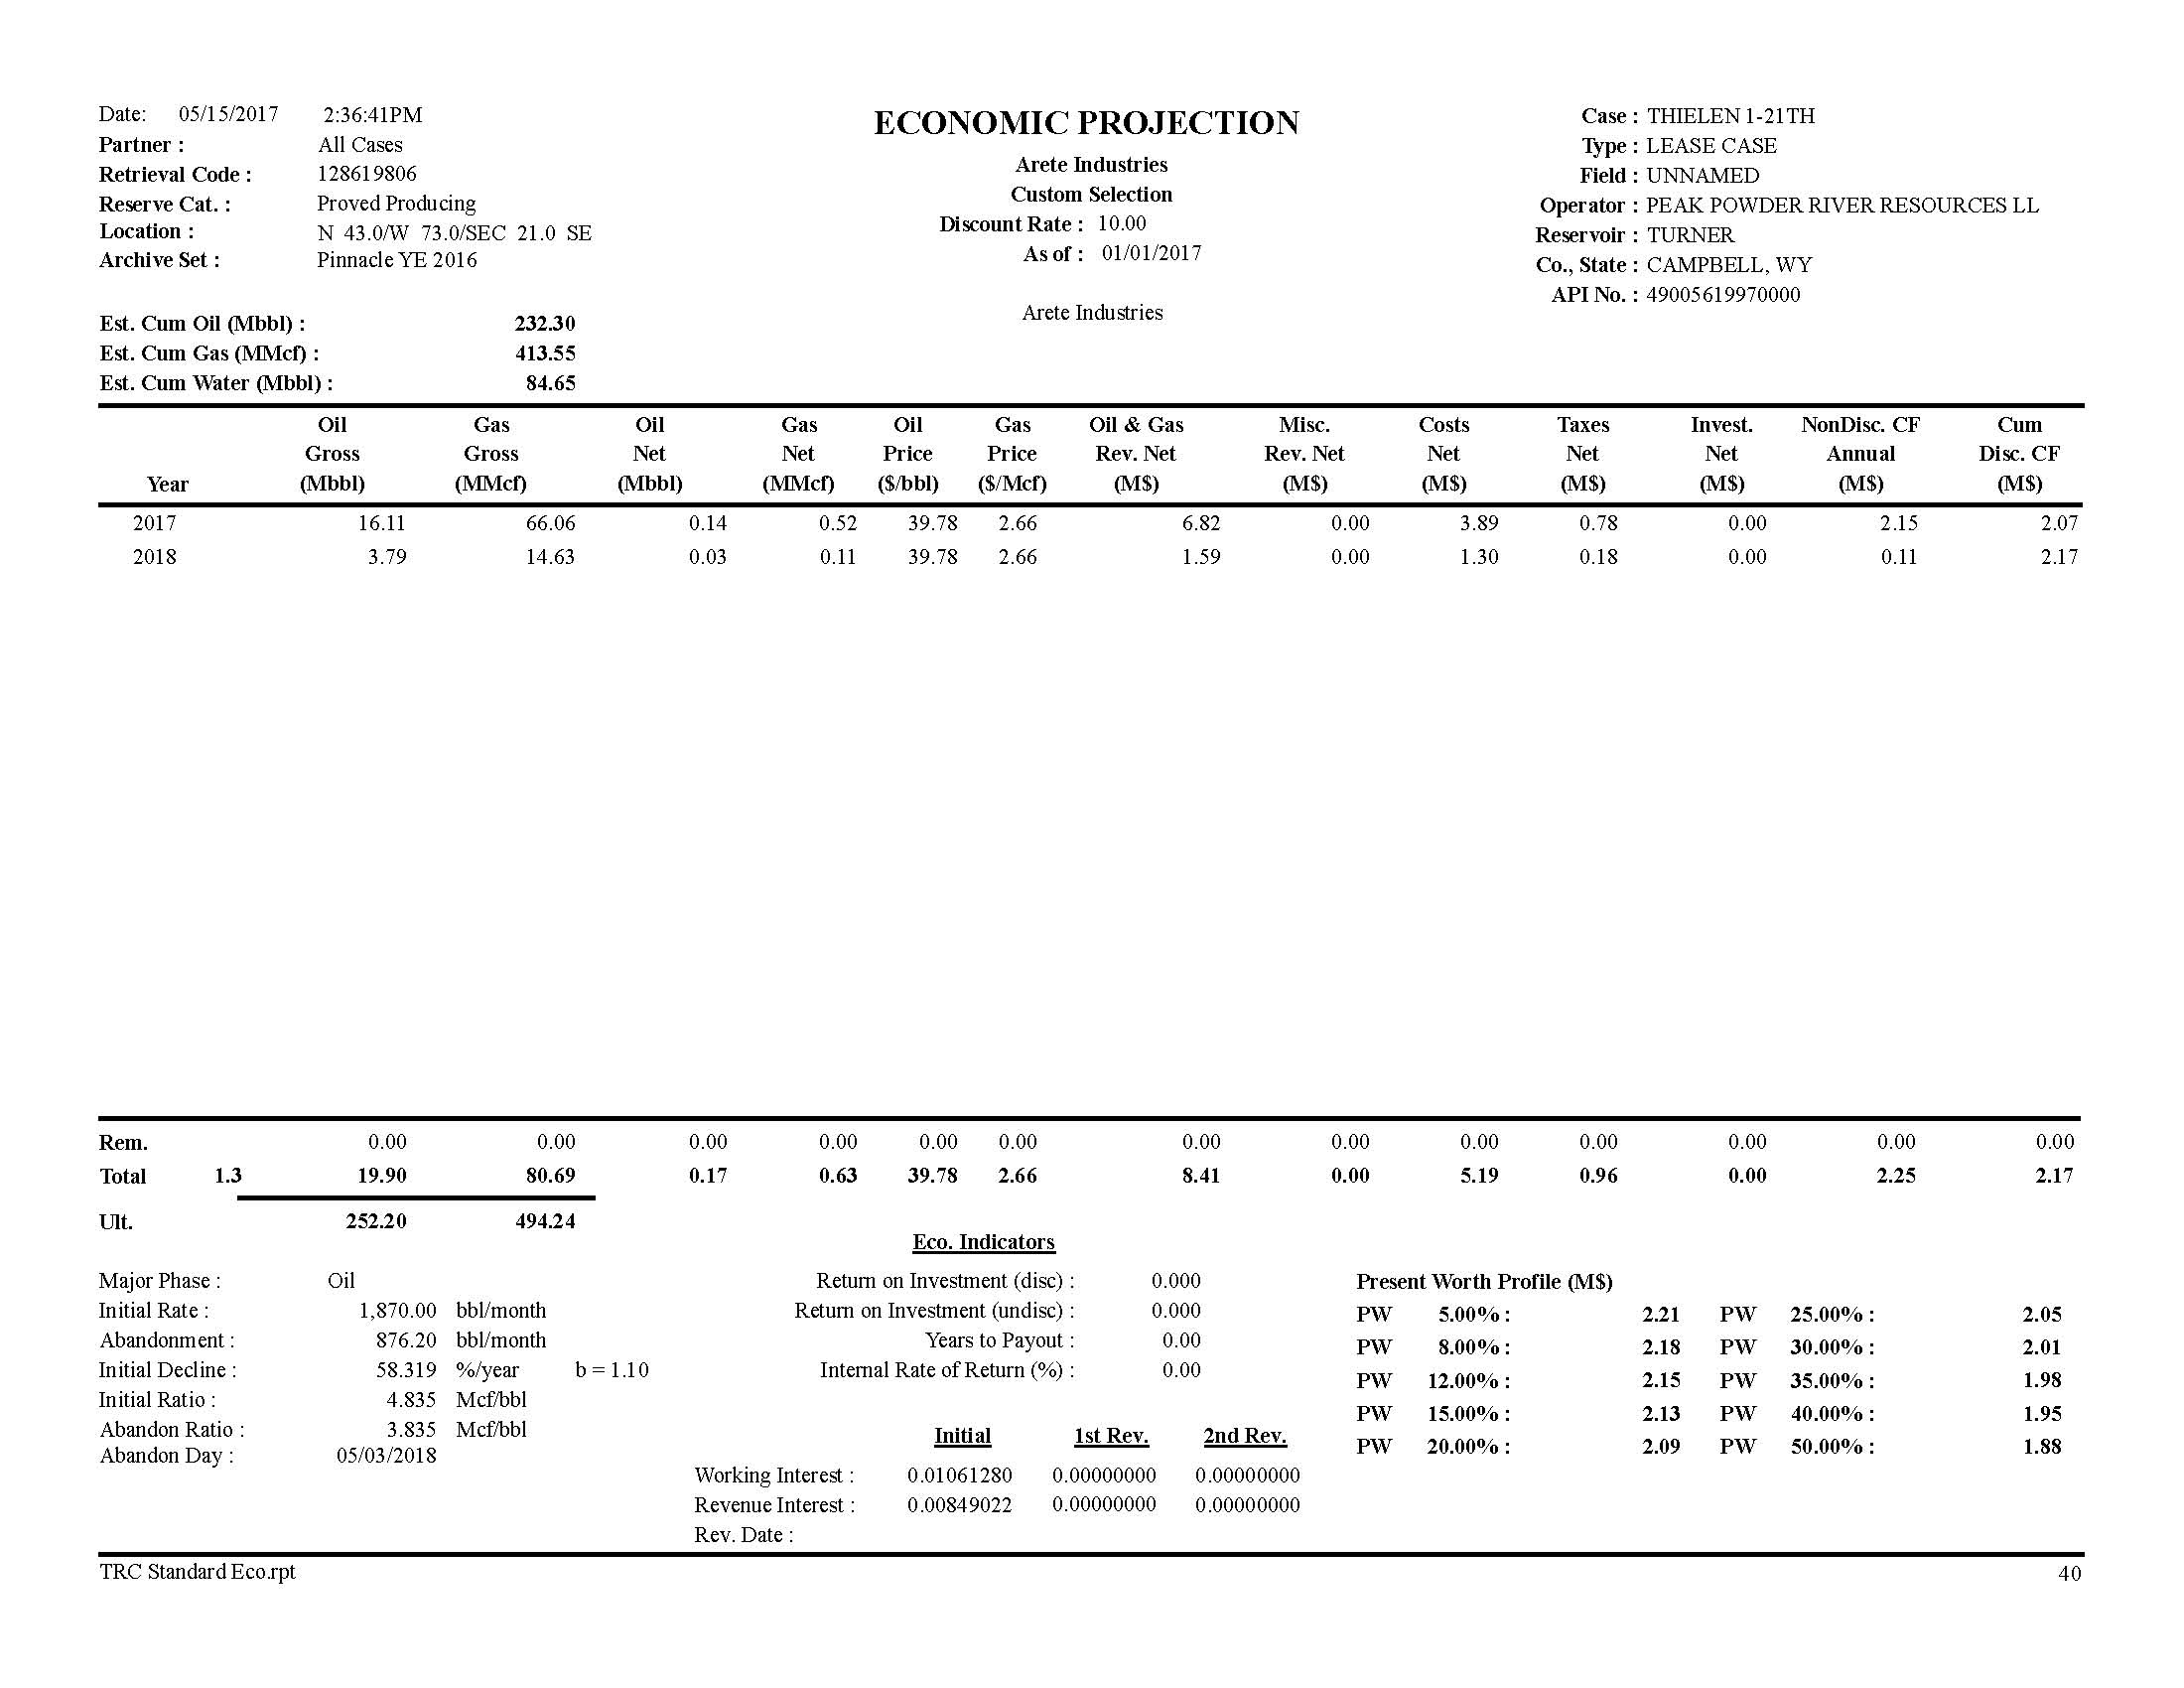
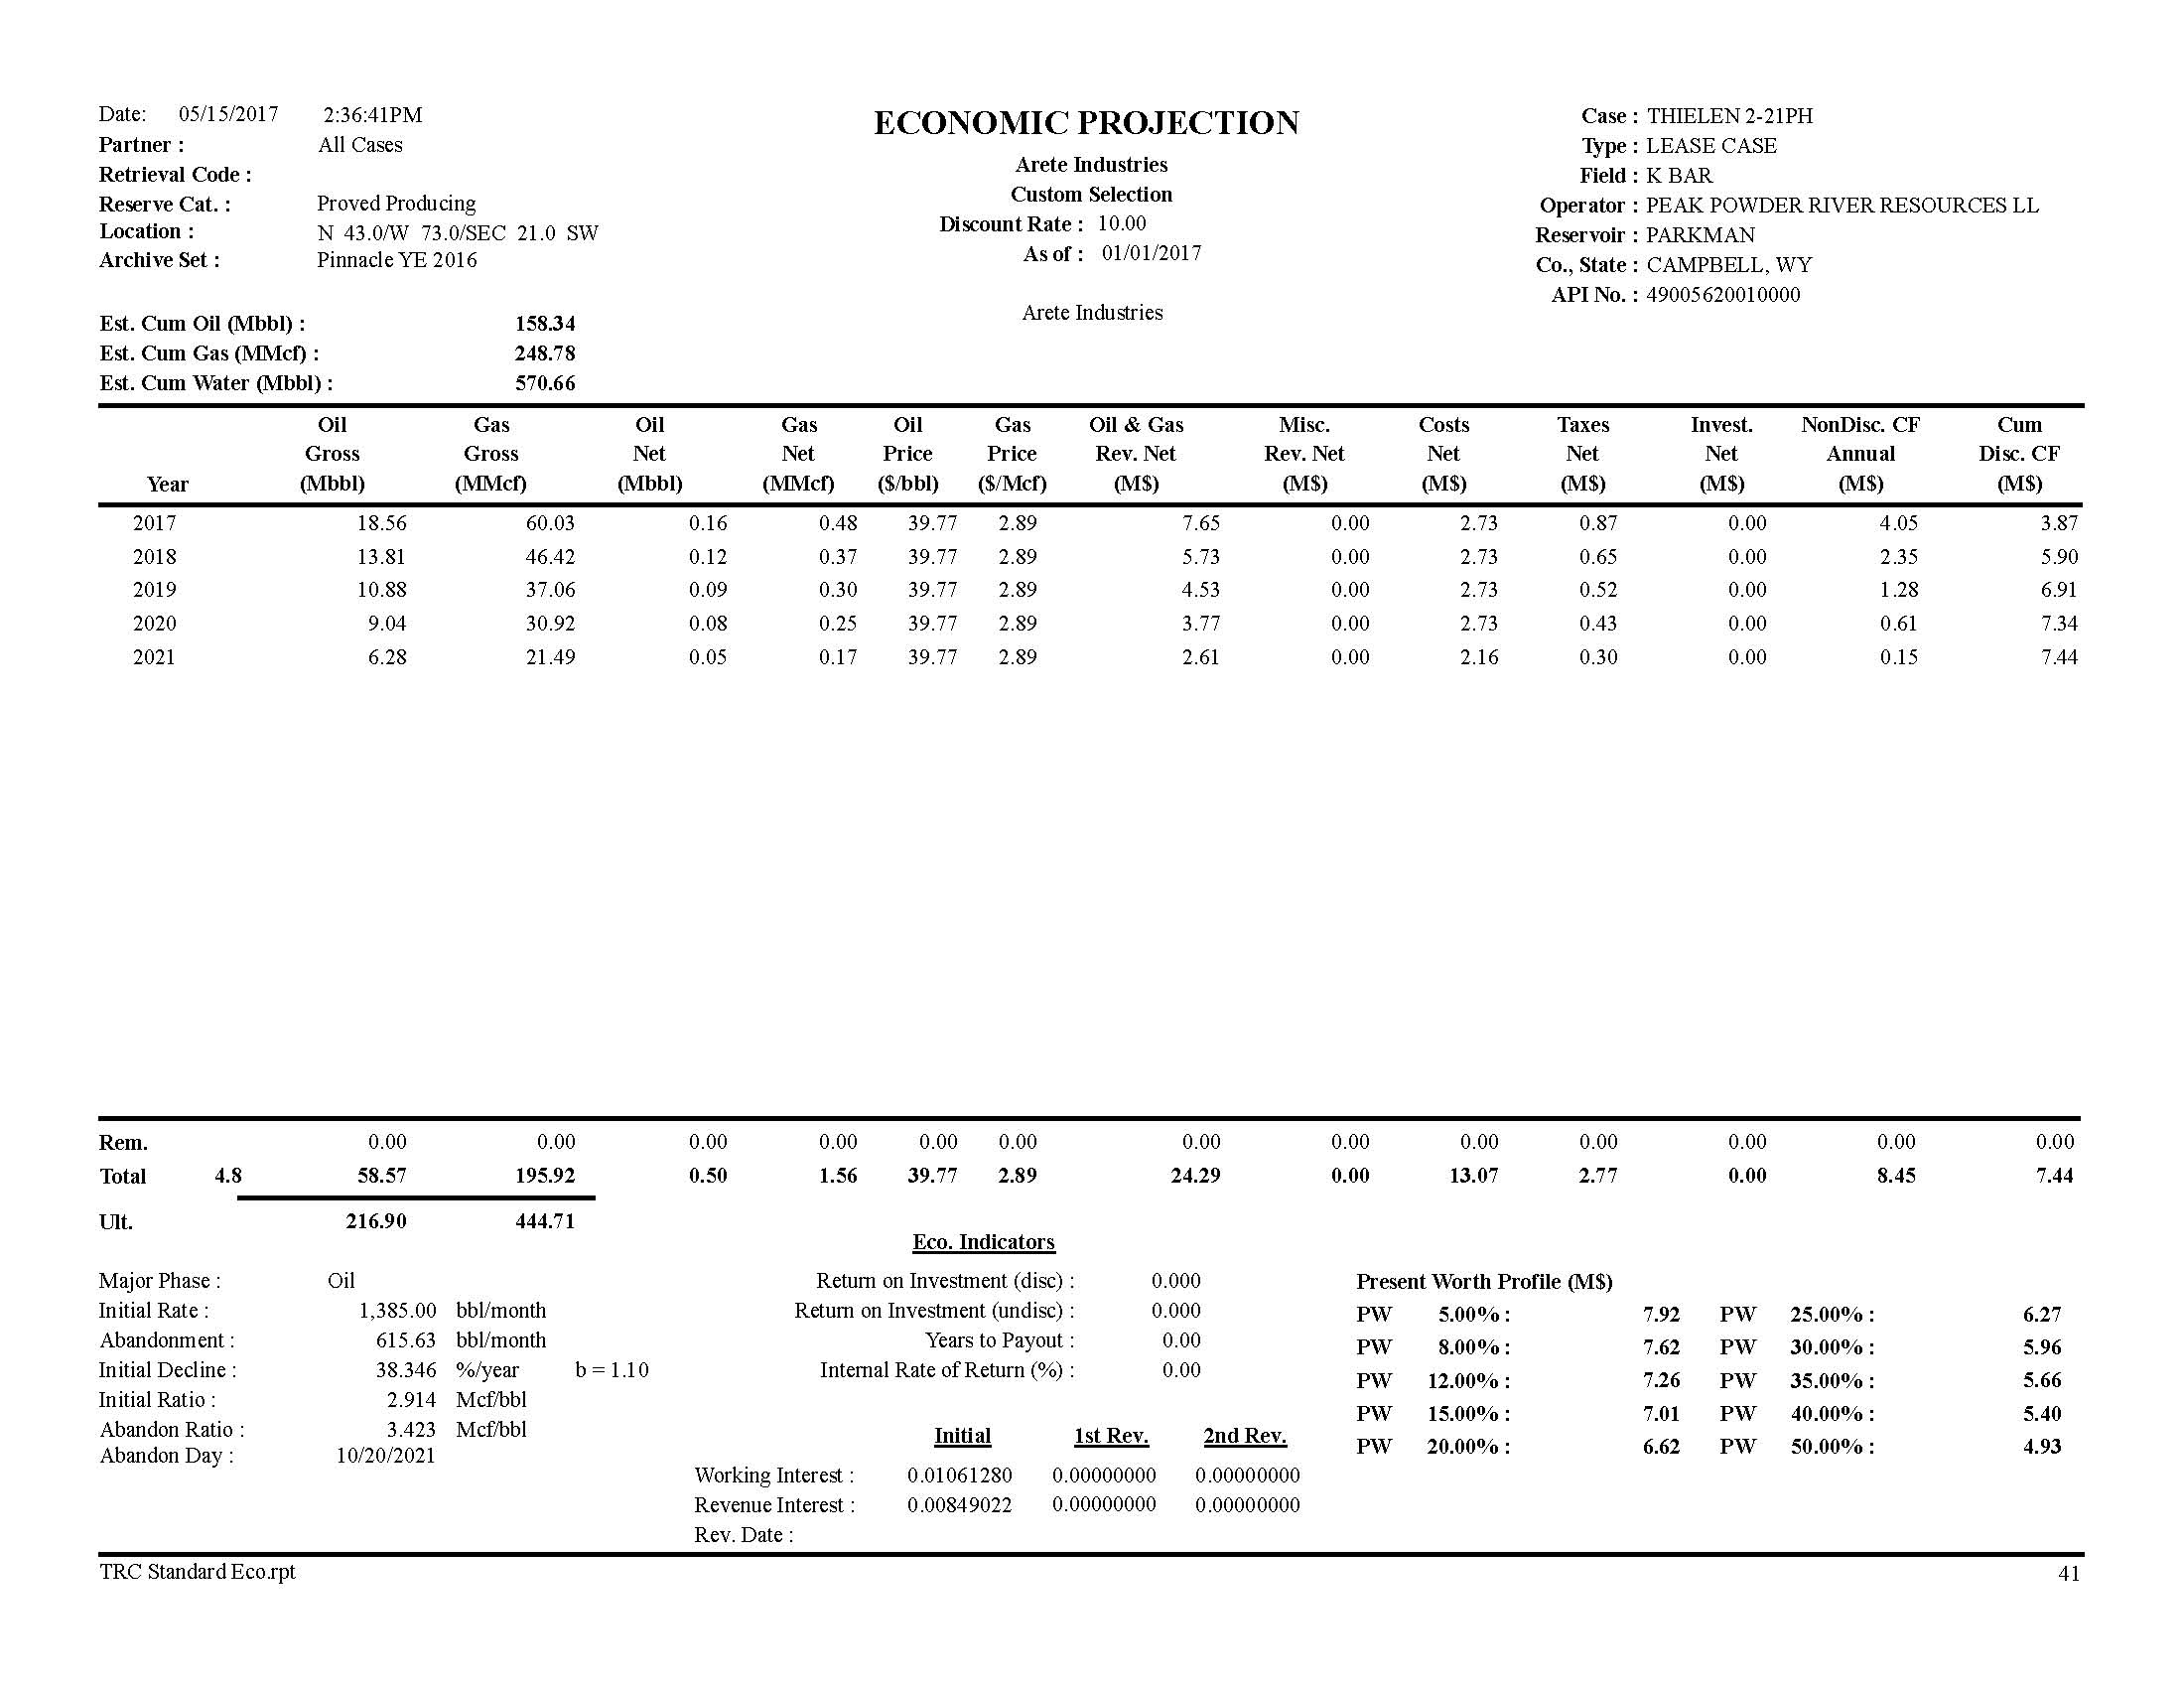
Fifty-one (51) properties were on production as of December 31, 2016. Remaining reserves for these properties were determined by decline curve analysis and analogy. Production plots for each property showing historical production and forecasts are included in the attachments.
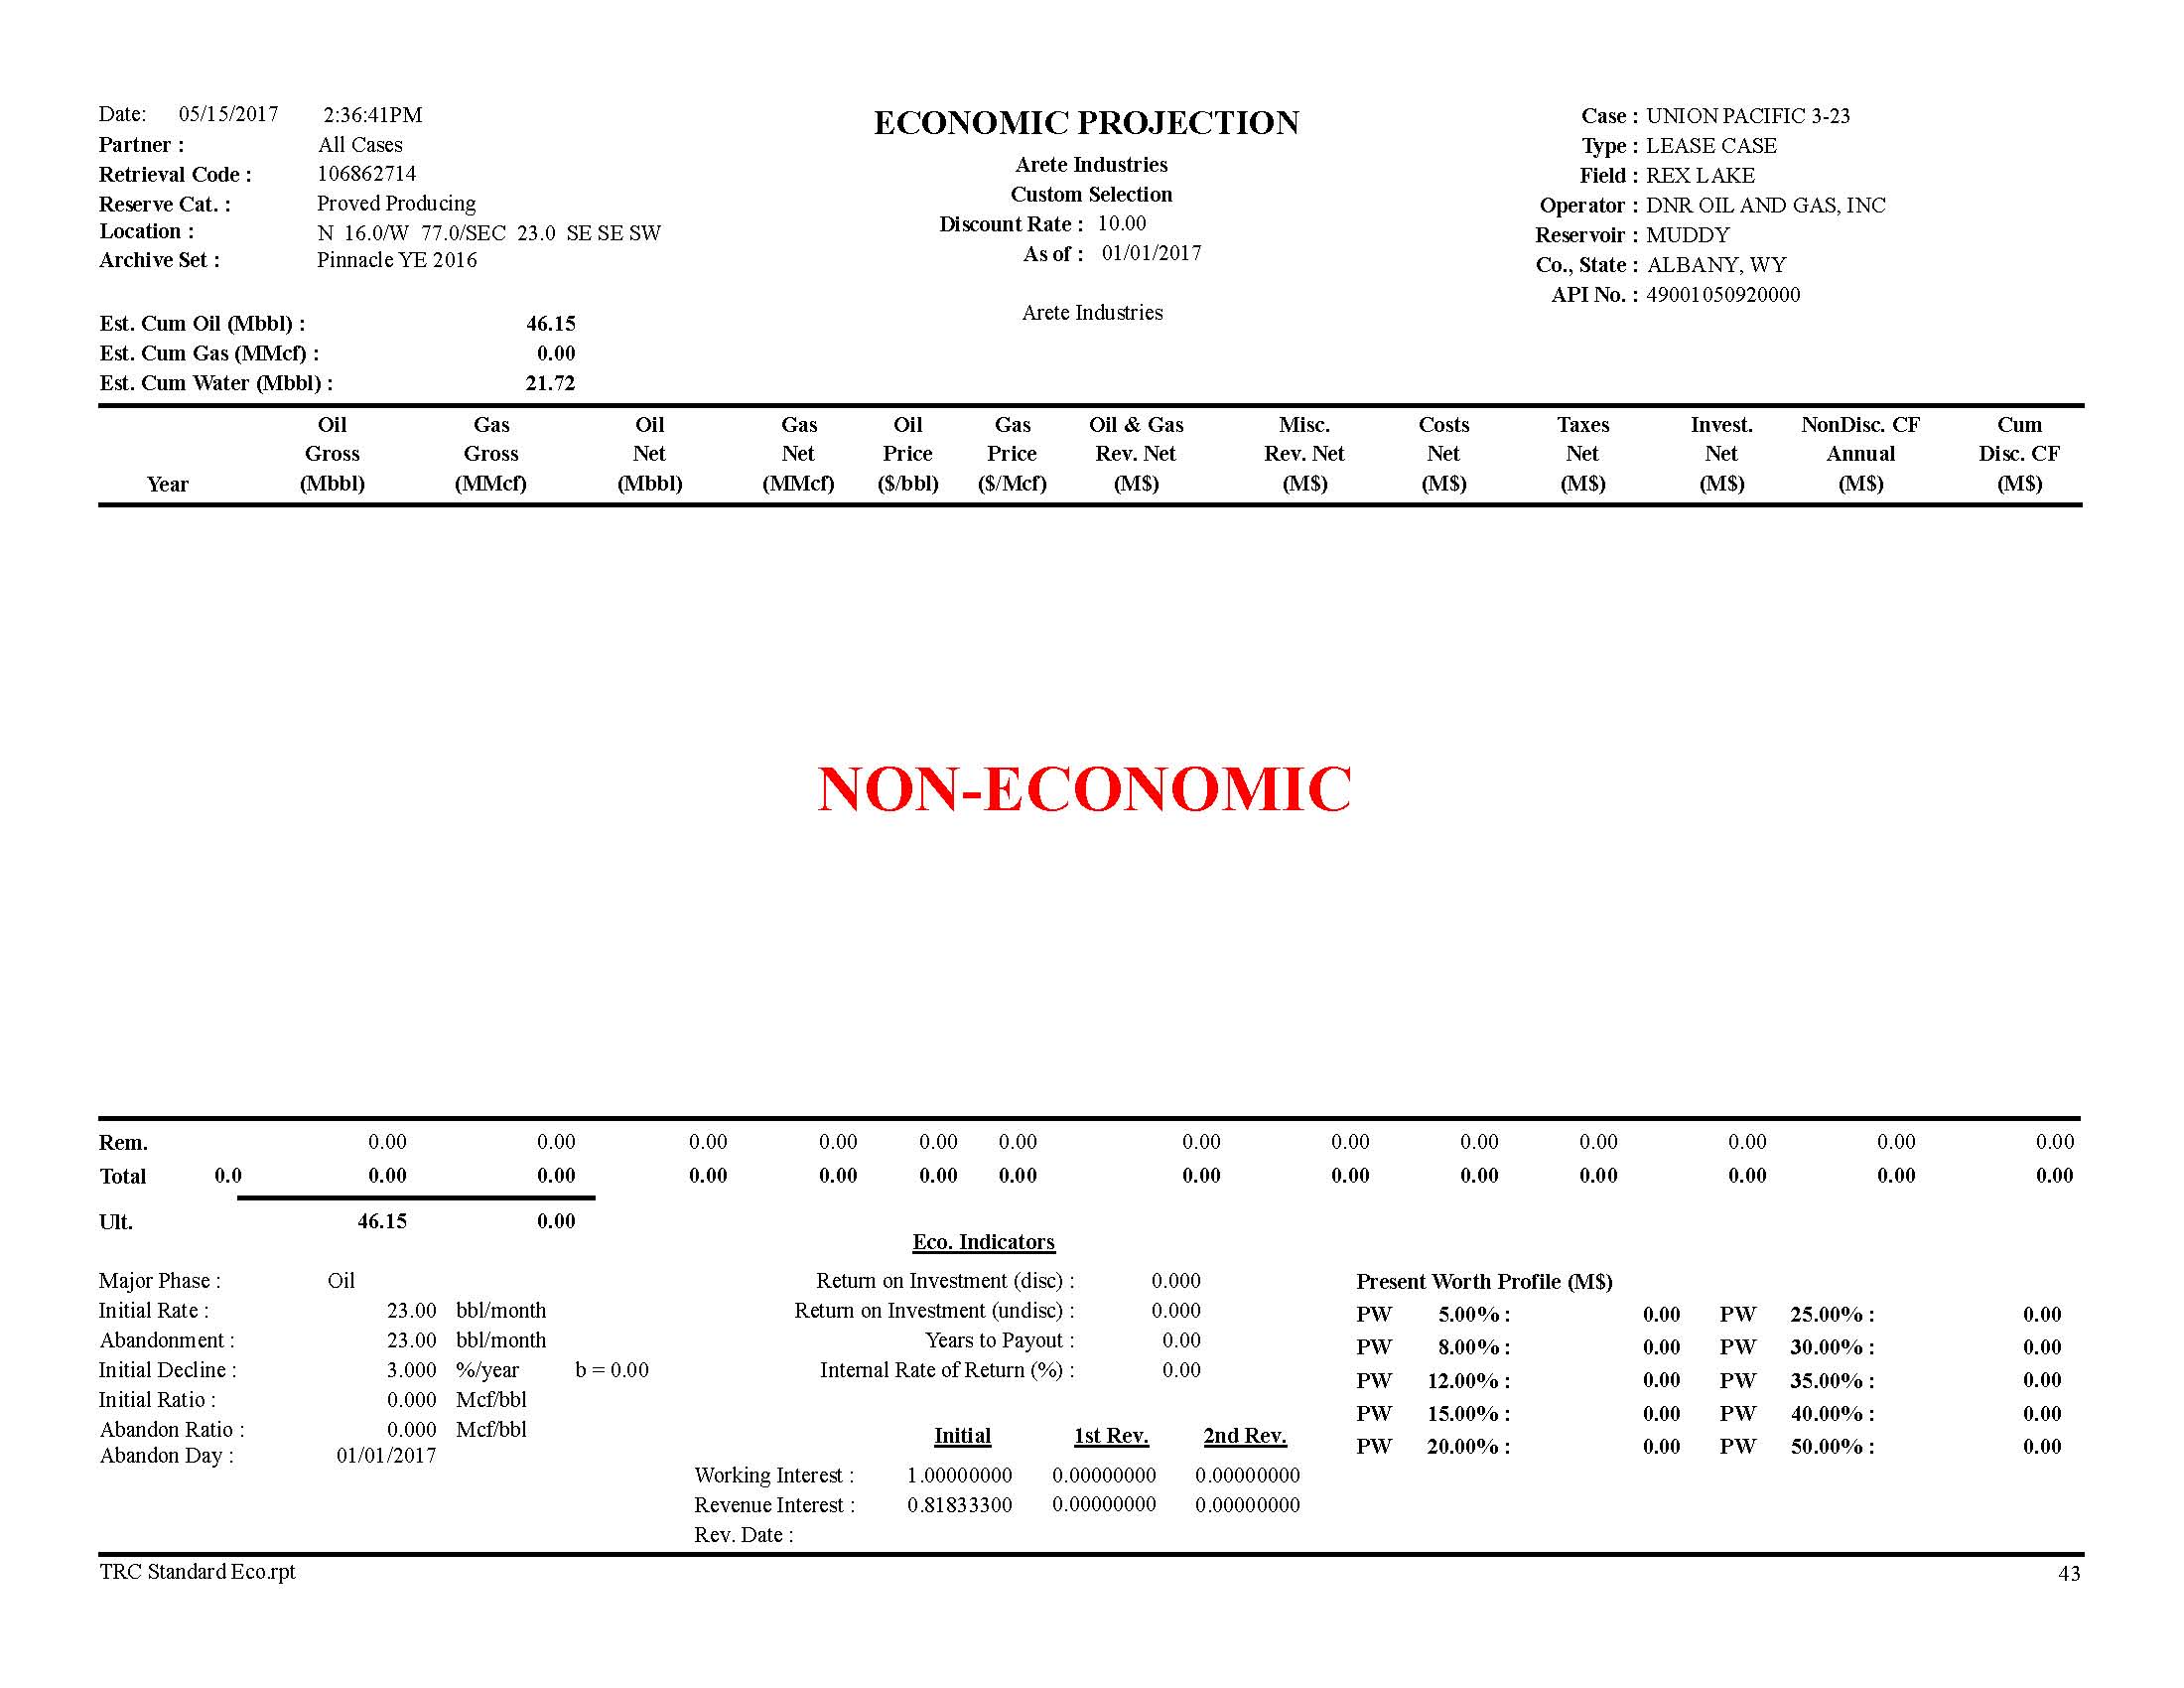
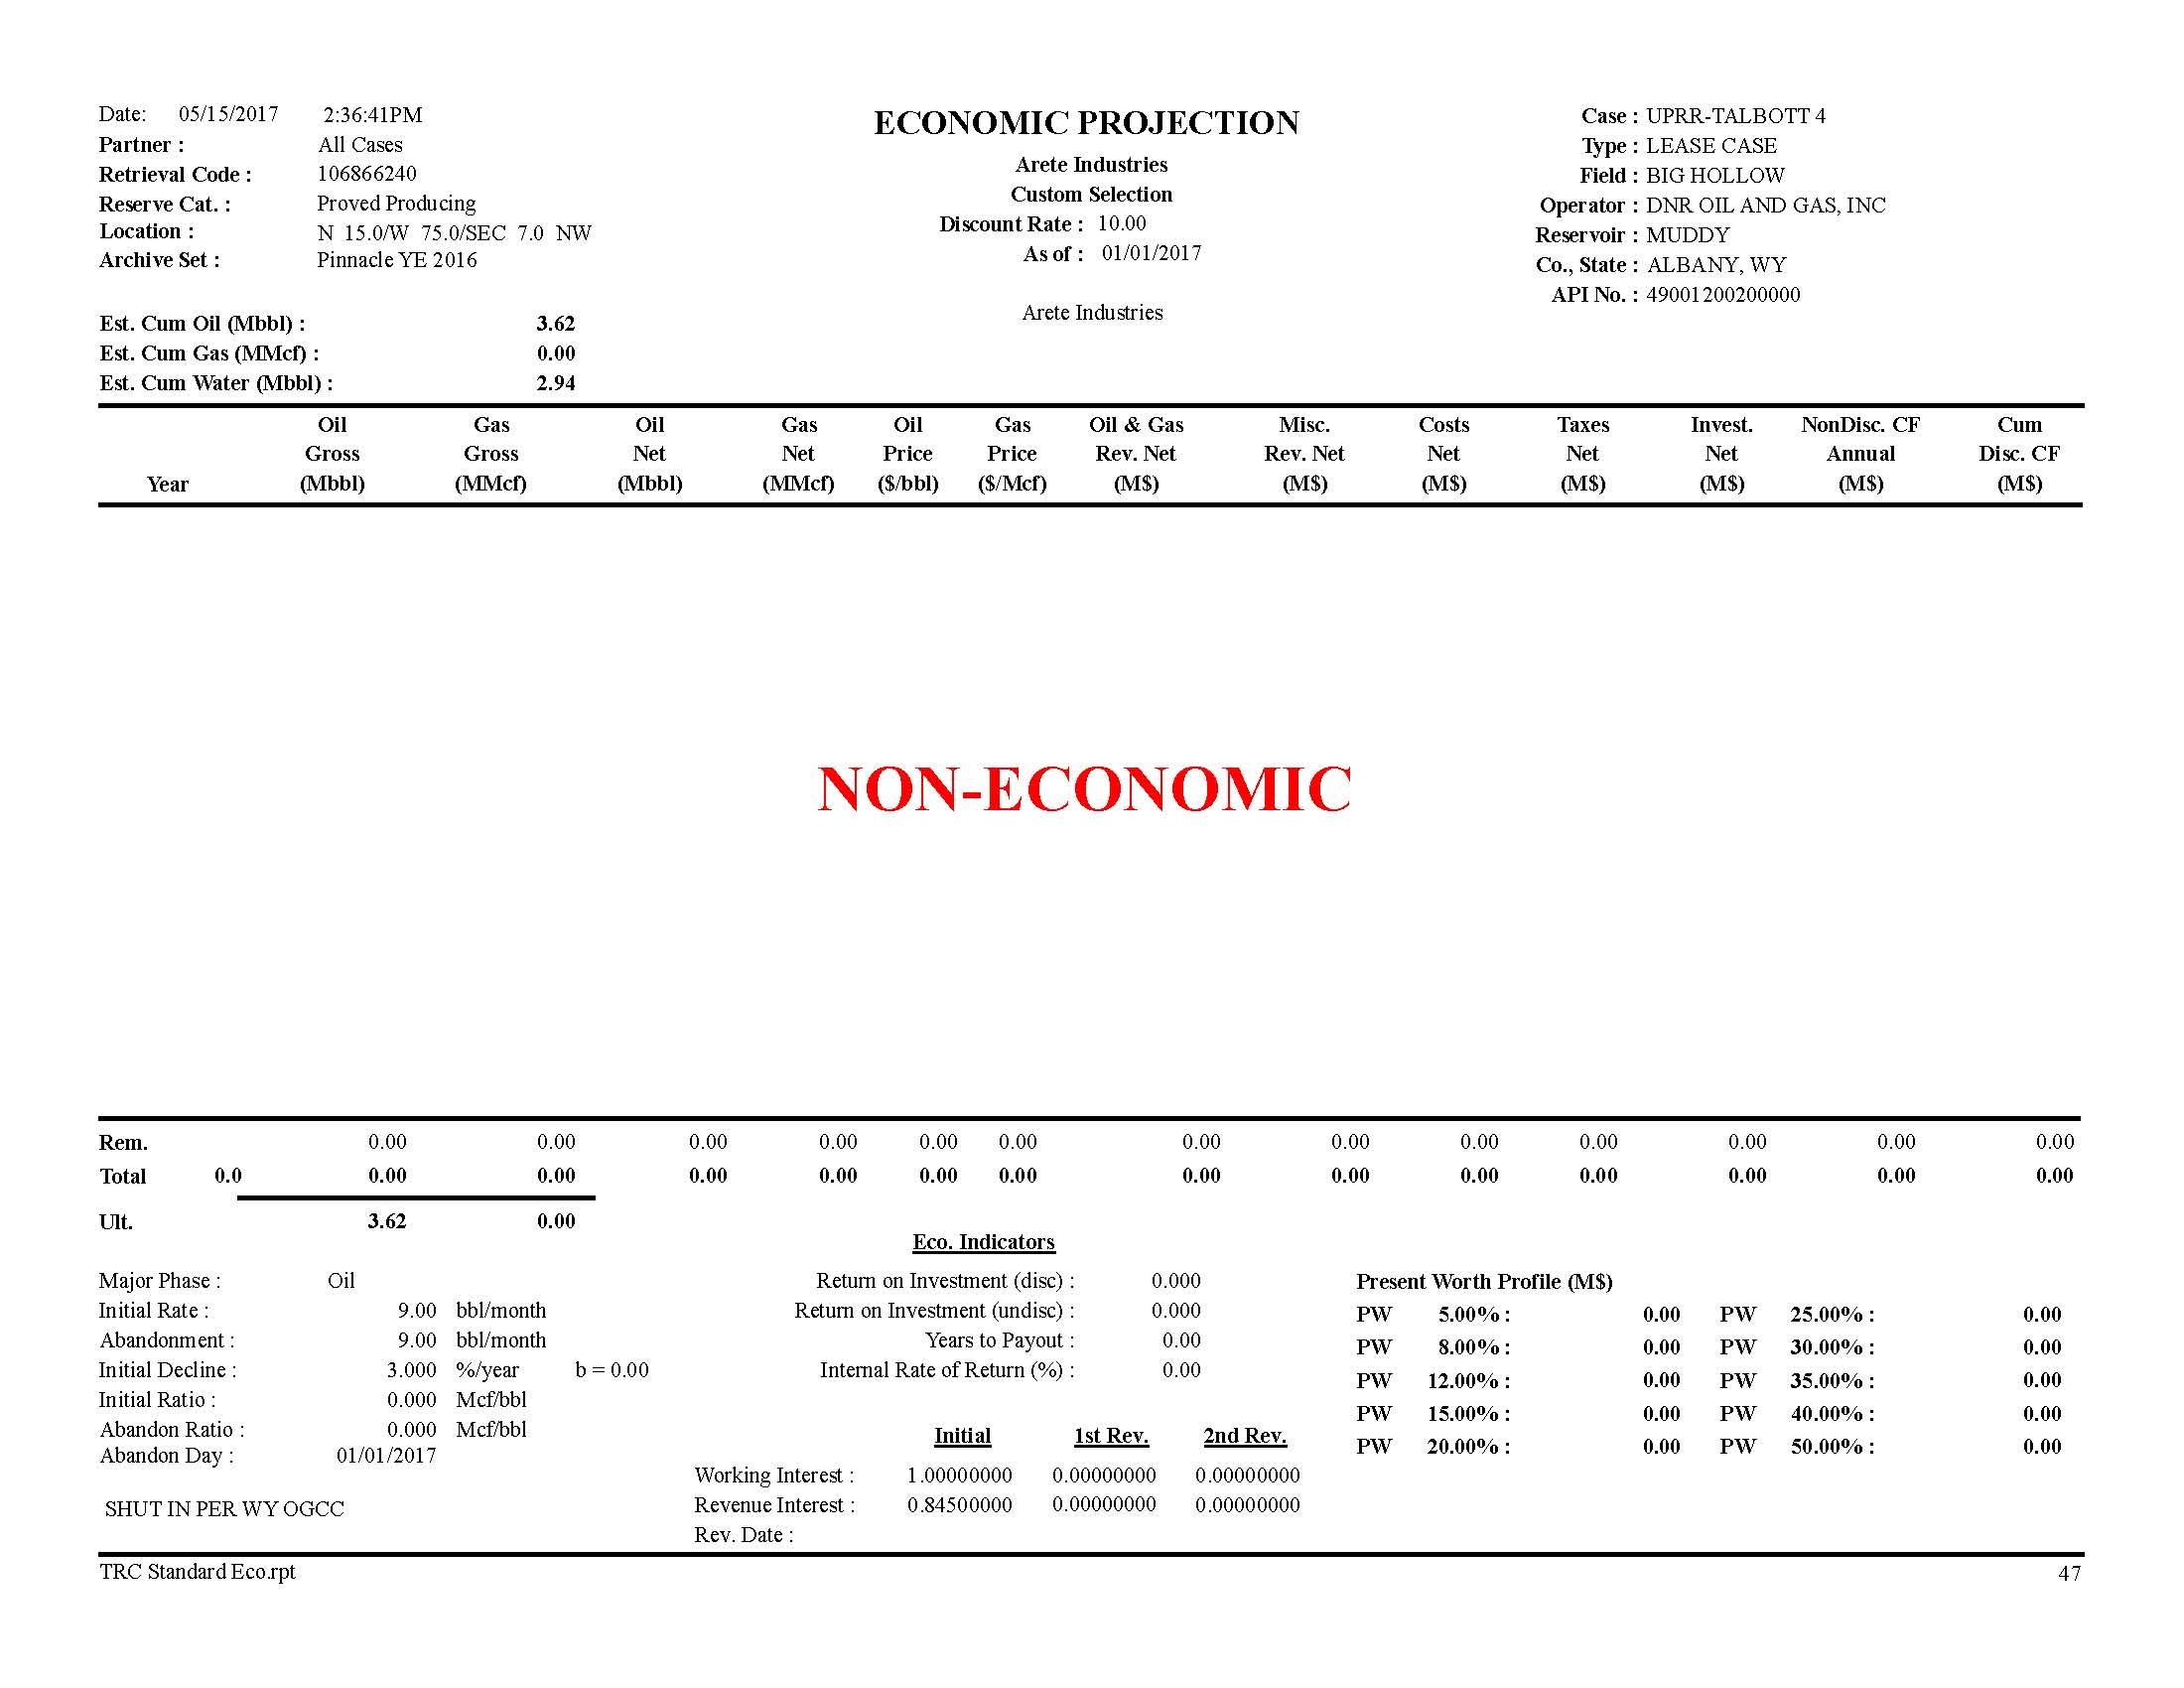
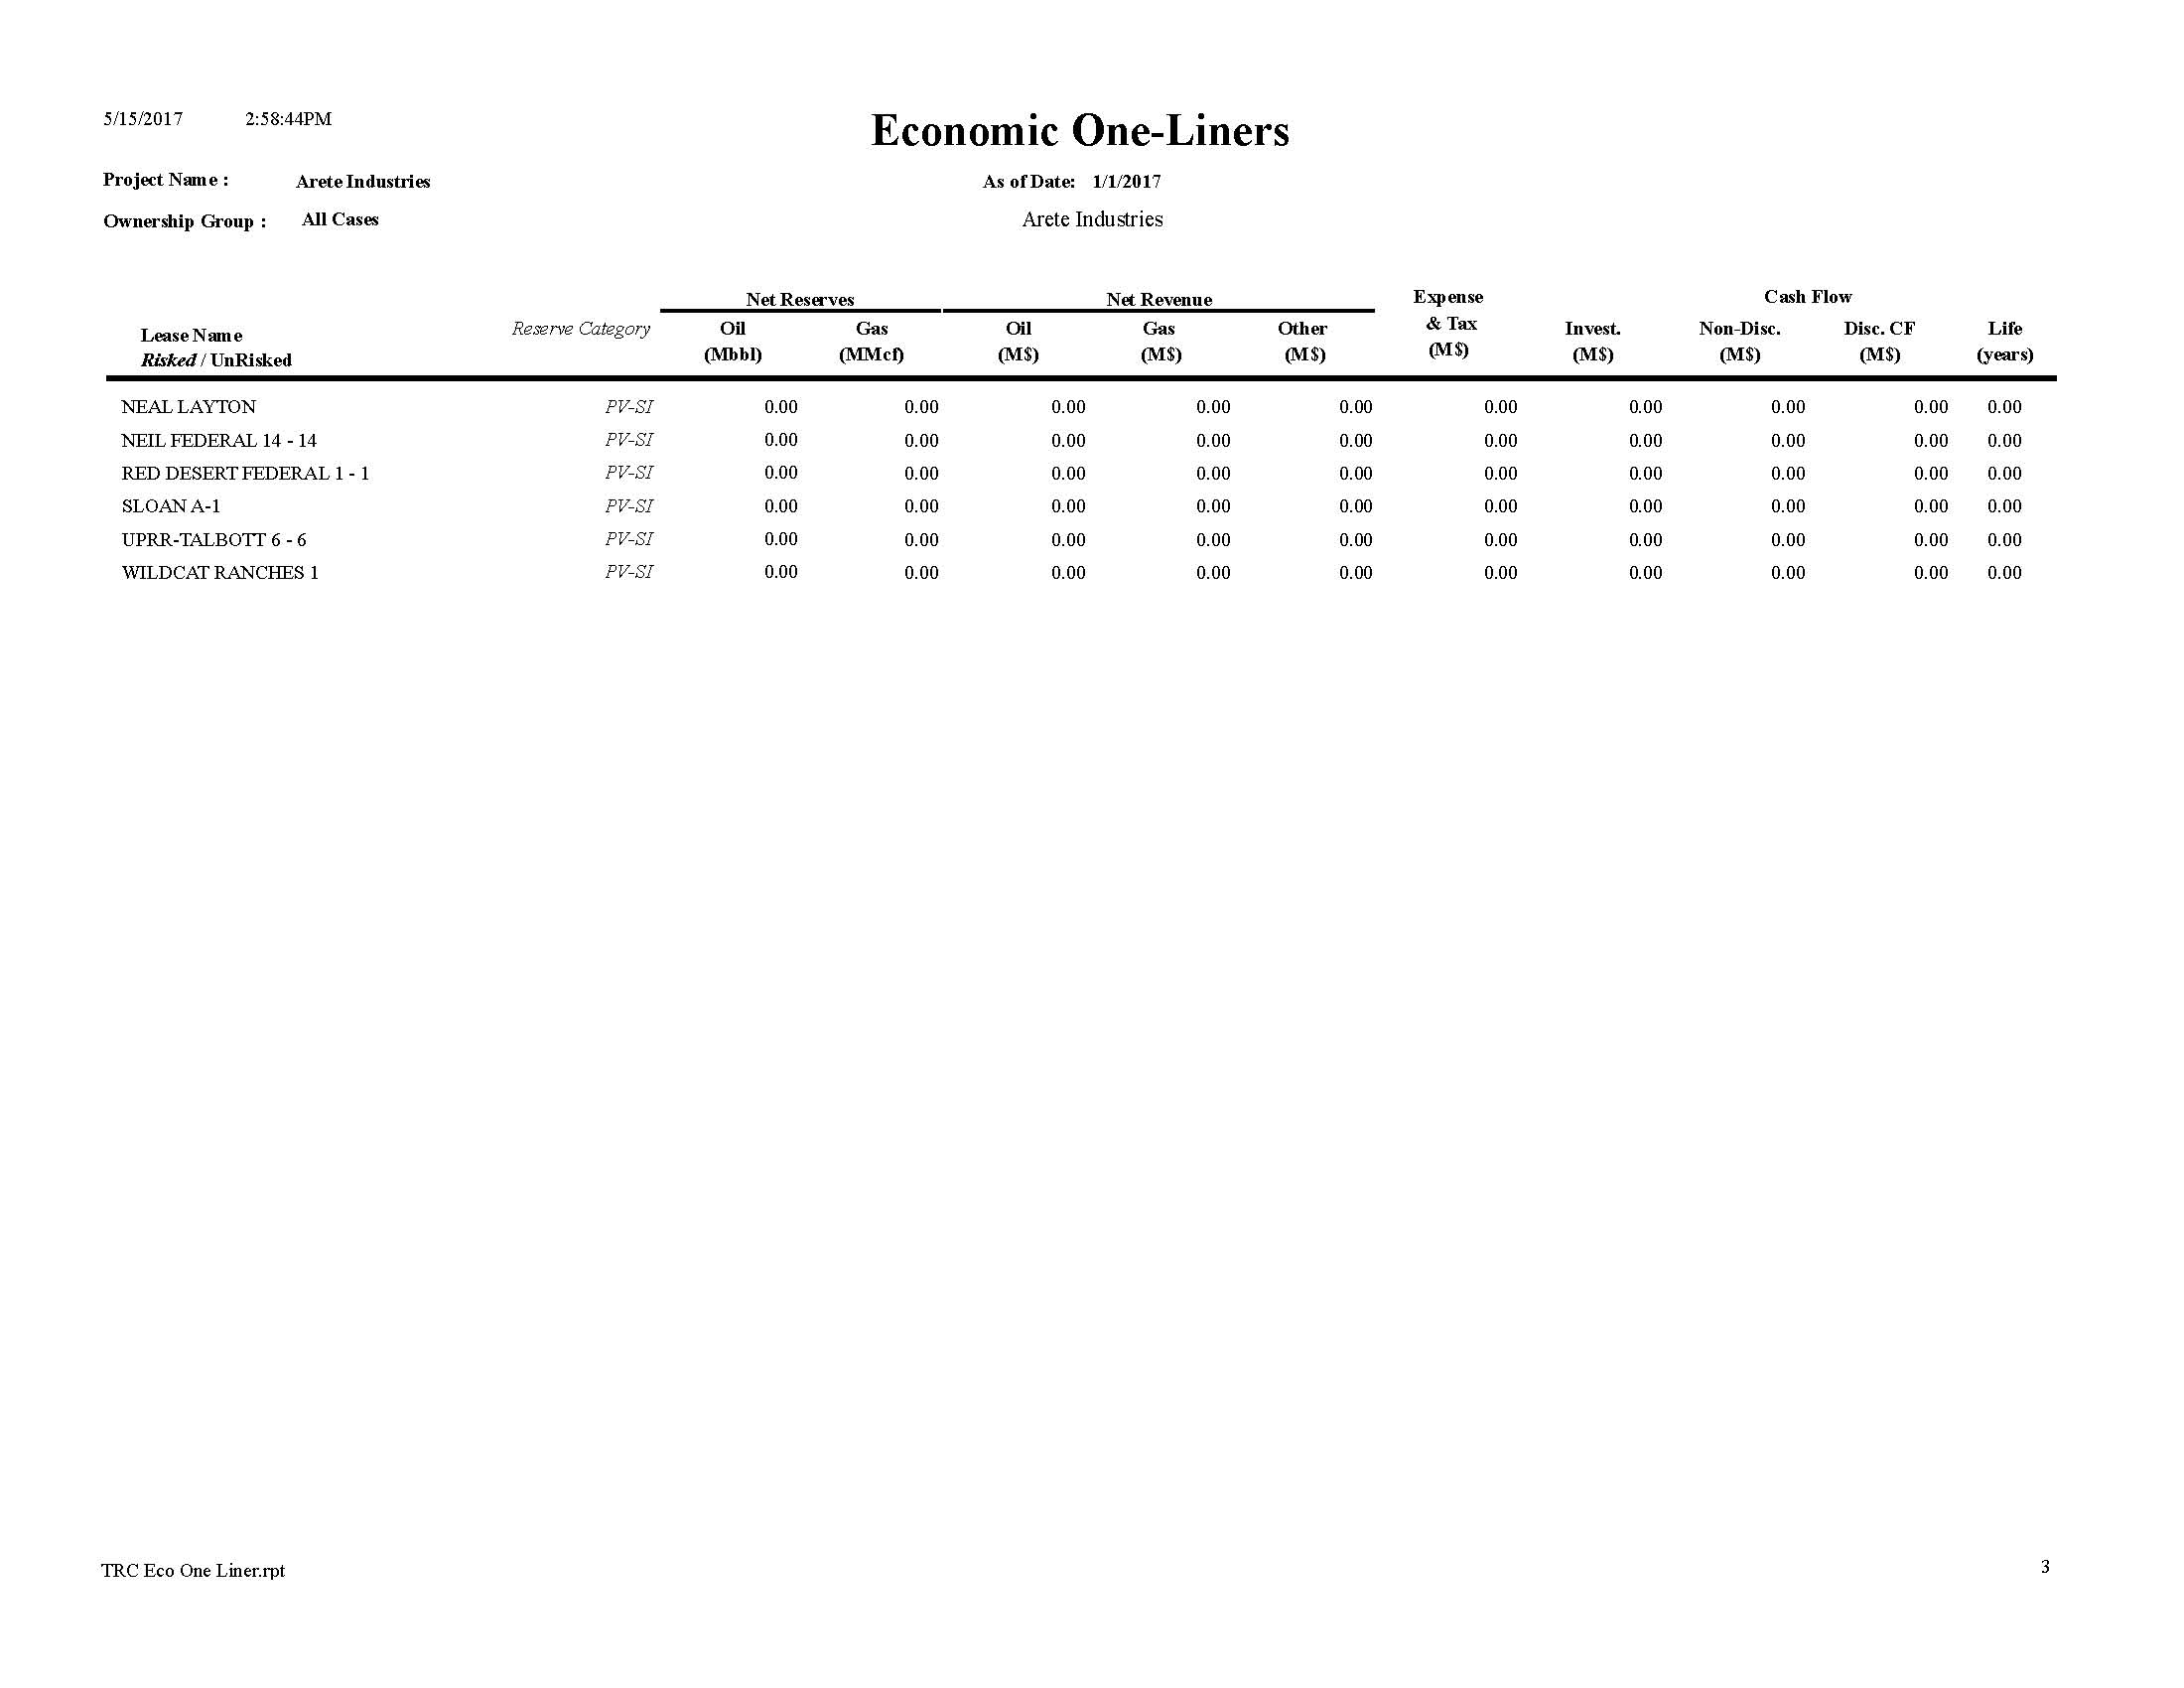
Twenty (20) properties had previously produced but are now shut-in.
Reserves
Remaining recoverable reserves are those quantities of petroleum that are anticipated to be commercially recovered from known accumulations from a given date forward. All reserve estimates involve some degree of uncertainty depending primarily on the amount of reliable geologic and engineering data available at the time of the estimate and the interpretation of these data. The relative degree of uncertainty is conveyed by classifying reserves as Proved (highly certain) or Non-Proved (less certain). The estimated reserves and revenues shown in this report were determined for Proved Developed Producing (PDP) and Proved Shut-In (PSI) reserve categories. By definition, PDP refers to existing producing properties.
Pinnacle Energy Services, LLC
9420 Cedar Lake Ave, Oklahoma City, OK 73114
Ofc: 405-810-9151 Fax: 405-843-4700 www.PinnacleEnergy.com
Accuracy of production forecasts generally depends on the amount of historical production and pressure data available, and the majority the producing wells reviewed in this evaluation had sufficient historical data to forecast future production with confidence. Those with limited production or pressure data history were forecasted by reviewing analogy well and test data and applying this knowledge to the available well information.
Future Cashflow
Future cash flow being reported is after deducting state production taxes and ad valorem taxes, but prior to deducting federal income taxes. The future net cash flow has been discounted at an annual rate of 10 percent to determine its present worth. The present worth is shown to indicate the effect of time on the value of money and should not be construed as being the fair market value of the properties.
General
The reserves and values included in this report are estimates only and should not be construed as being exact quantities. The reserve estimates were arrived at by using accepted engineering practices and were primarily based on historical rate decline analysis for existing producers. As additional pressure and production performance data becomes available, reserve estimates may increase or decrease in the future. The revenue from such reserves and the actual costs related may be more or less than the estimated amounts. Because of governmental policies and uncertainties of supply and demand, the prices actually received for the reserves included in this report and the costs incurred in recovering such reserves may vary from the price and cost assumptions referenced. Therefore, in all cases, estimates of reserves may increase or decrease as a result of future operations.
In evaluating the information available for this analysis, items excluded from consideration were all matters as to which legal or accounting, rather than engineering interpretation, may be controlling. As in all aspects of oil and gas evaluation, there are uncertainties inherent in the interpretation of engineering data and such conclusions necessarily represent only informed professional judgments. The titles to the properties have not been examined nor has the actual degree or type of interest owned been independently confirmed. A field inspection of the properties is not usually considered necessary for the purpose of this report.
Information included in this report includes the graphical decline curves for individual wells, projected production and cash flow economic results, one-line economic result summaries for each well, and miscellaneous individual well information. Additional information reviewed will be retained and is available for review at any time. Pinnacle Energy Services, L.L.C. can take no responsibility for the accuracy of the data used in the analysis, whether gathered from public sources or otherwise.
Pinnacle Energy Services, LLC
9420 Cedar Lake Ave, Oklahoma City, OK 73114
Ofc: 405-810-9151 Fax: 405-843-4700 www.PinnacleEnergy.com
Pinnacle Energy Services, LLC
{original signed by Richard J. Morrow}
Richard J. Morrow, P.E.
Petroleum Engineer
Disclaimer: Pinnacle Energy Services, L.L.C. nor any of its subsidiaries, affiliates, officers, directors, shareholders, employees, consultants, advisors, agents, or representatives make any representation or warranty, express or implied, in connection with any of the information made available herein, including, but not limited to, the past, present or future value of the anticipated reserves, cash flows, income, costs, expense, liabilities and profits, if any, to be derived from the properties described herein. All statements, estimates, projections and implications as to future operations are based upon best judgments of Pinnacle Energy Services; however, there is no assurance that such statements, estimates, projections or implications will prove to be accurate. Accordingly, any company, or other party receiving such information will rely solely upon its own independent examination and assessment of said information. Neither Pinnacle Energy Services nor any of its subsidiaries, affiliates, officers, directors, shareholders, employees, consultants, advisors, agents, or representatives shall have any liability to any party receiving the information herein, nor to any affiliate, partner, member, officer, director, shareholder, employee, consultant, advisor, agent or representative of such party from any use of such information. The property description and other information attached hereto are for the sole, confidential use of the person to whom this copy has been made available. It may not be disseminated or reproduced in any matter whatsoever, whether in full or in part, without the prior written consent of Pinnacle Energy Services, L.L.C. This evaluation and all descriptions and other information attached hereto are for information purposes only and do not constitute an evaluation of or offer to sell or a solicitation of an offer to buy any securities.
EXHIBIT A

Economic Summary
By Reserve Class and
Category
One-Line
Enonomic Report
PDP
Detailed Economic Report &
Decline Curves