Attached files
| file | filename |
|---|---|
| EX-99.1 - EXHIBIT 99.1 - ICAHN ENTERPRISES L.P. | tv480462_ex99-1.htm |
| 8-K - FORM 8-K - ICAHN ENTERPRISES L.P. | tv480462_8k.htm |
Exhibit 99.2

Icahn Enterprises L.P. Roadshow Presentation November 2017
Forward - Looking Statements and Non - GAAP Financial Measures Forward - Looking Statements This presentation contains certain statements that are, or may be deemed to be, “forward - looking statements” within the meaning of Section 27 A of the Securities Act of 1933 , as amended, and Section 21 E of the Securities Exchange Act of 1934 , as amended . All statements included herein, other than statements that relate solely to historical fact, are “forward - looking statements . ” Such statements include, but are not limited to, any statement that may predict, forecast, indicate or imply future results, performance, achievements or events, or any statement that may relate to strategies, plans or objectives for, or potential results of, future operations, financial results, financial condition, business prospects, growth strategy or liquidity, and are based upon management’s current plans and beliefs or current estimates of future results or trends . Forward - looking statements can generally be identified by phrases such as “believes,” “expects,” “potential,” “continues,” “may,” “should,” “seeks,” “predicts,” “anticipates,” “intends,” “projects,” “estimates,” “plans,” “could,” “designed,” “should be” and other similar expressions that denote expectations of future or conditional events rather than statements of fact . Our expectations, beliefs and projections are expressed in good faith and we believe that there is a reasonable basis for them . However, there can be no assurance that these expectations, beliefs and projections will result or be achieved . There are a number of risks and uncertainties that could cause our actual results to differ materially from the forward - looking statements contained in this presentation . These risks and uncertainties are described in our Annual Report on Form 10 - K for the year ended December 31 , 2016 and our Quarterly Report on Form 10 - Q for the quarter ended September 30 , 2017 . There may be other factors not presently known to us or which we currently consider to be immaterial that may cause our actual results to differ materially from the forward - looking statements . All forward - looking statements attributable to us or persons acting on our behalf apply only as of the date of this presentation and are expressly qualified in their entirety by the cautionary statements included in this presentation . Except to the extent required by law, we undertake no obligation to update or revise forward - looking statements to reflect events or circumstances after the date such statements are made or to reflect the occurrence of unanticipated events . Non - GAAP Financial Measures This presentation contains certain non - GAAP financial measures, including EBITDA, Adjusted EBITDA and Indicative Net Asset Value . The non - GAAP financial measures contained herein have limitations as analytical tools and should not be considered in isolation or in lieu of an analysis of our results as reported under U . S . GAAP . These non - GAAP measures should be evaluated only on a supplementary basis in connection with our U . S . GAAP results, including those reported in our consolidated financial statements and the related notes thereto contained in our Annual Report on Form 10 - K for the year ended December 31 , 2016 and our Quarterly Report on Form 10 - Q for the quarter ended September 30 , 2017 . A reconciliation of these non - GAAP financial measures to the most directly comparable GAAP financial measures can be found in the back of this presentation .

Presenters Keith Cozza – President & Chief Executive Officer SungHwan Cho – Chief Financial Officer 3

Agenda Transaction Overview Company Overview Investment Highlights Financial Performance Appendix 4

Transaction Overview

Executive Summary Icahn Enterprises L.P. (“IEP” or the “Company”) is a diversified holding company, with global businesses in Investment, Automotive, Energy, Metals, Railcar, Gaming, Mining, Food Packaging, Real Estate and Home Fashion – Total equity market capitalization of approximately $9.1 (1) billion as of November 29, 2017 The proposed debt issuance will provide IEP with funds needed to refinance their existing $1.275 billion of 2019 Notes through a combination of new Senior Unsecured Notes due 2025, Tack - on 6.75% Senior Unsecured Notes due 2024 and Tack - on 6.25% Senior Unsecured Notes due 2022 (1) Based on closing stock price of $53.57 and approximately 169.1 million depositary units and general partner equivalent intere sts as of November 29, 2017. (2) Includes new issue premium. 6 Sources and Uses of Funds Sources of Funds Uses of Funds ($Millions) New Senior Unsecured Notes due 2025 $500 Refinance 4.875% Senior Unsecured Notes due 2019 $1,275 Tack-on 6.75% Senior Unsecured Notes due 2024 (2) 393 Interest, Fees & Expenses 10 Tack-on 6.25% Senior Unsecured Notes due 2022 (2) 393 Total Sources $1,285 Total Uses $1,285

Capitalization and Credit Statistics Key Points Strong financial metrics (1) : – Total consolidated liquidity of $6.4 billion – Indicative gross asset value to holding company net debt coverage of 2.4x Holding company cash and cash equivalents value of $582 million (1) Affiliates of Carl Icahn owned 90.8% of IEP valued at $8.4Bn (2) as of September 30, 2017 (1) Pro - Forma as of September 30, 2017. (2) Based on closing stock price of $54.86 and approximately 153.5 million depositary units owned by Mr. Icahn as of September 30 , 2 017. (3) Pro - Forma financial data set forth below gives effect to the issuance of $1,285 million of Senior Unsecured Notes (includes new issue premium on new Tack - On Notes) and the redemption of the 4.875% Senior Unsecured Notes due 2019 with the proceeds thereof and adjusted for three transactions which occurred on October 2, 2017: $522 million from the sale of 4,3 82 railcars (a $96 million gain, net of tax), $124 million for the purchase of American Driveline Systems and $300 million investment into the Investment segment. (4) Debt is non - recourse to Icahn Enterprises. (5) Based on closing stock price of $54.86 and approximately 172.5 million depositary units and general partner equivalent intere sts as of September 30, 2017. (6) Indicative gross asset value defined as market value of public subsidiaries, market value of the Holding Company interest in Fun ds and book value or market comparables of other assets. 7 September 30, 2017 ($Millions) Actual Pro-Forma (3) Liquid Assets: Holding Company Cash & Cash Equivalents $484 $582 Holding Company Investment in Funds 2,864 3,164 Holding Company Liquid Assets $3,348 $3,746 Subsidiaries Cash & Cash Equivalents 1,554 1,554 Total Liquid Assets $4,902 $5,300 Holding Company Debt: 4.875% Senior Unsecured Notes due 2019 $1,272 - 6.000% Senior Unsecured Notes due 2020 1,704 1,704 5.875% Senior Unsecured Notes due 2022 1,341 1,341 6.250% Senior Unsecured Notes due 2022 693 693 Tack-On 6.250% Senior Unsecured Notes due 2022 - 393 6.750% Senior Unsecured Notes due 2024 498 498 Tack-On 6.750% Senior Unsecured Notes due 2024 - 393 New Senior Unsecured Notes due 2025 - 500 Mortgages Payable 21 21 Holding Company Debt $5,529 $5,542 Subsidiary Debt (4) 5,669 5,669 Total Consolidated Debt (a) $11,198 $11,211 Minority Interest (b) $6,414 $6,414 Shareholders' Book Equity (c) 4,784 4,880 Total Book Capitalization (a) + (b) + (c) $22,396 $22,505 Stockholders' Market Equity (5) (d) 9,464 9,464 Total Capitalization (a) + (b) + (d) $27,076 $27,089 Supplemental Information: Indicative Gross Asset Value (excluding HoldCo cash) (6) $12,099 $12,001 Indicative Gross Asset Value / Holding Company Net Debt 2.4x 2.4x Holding Company Liquid Assets / Holding Company Debt 0.6x 0.7x
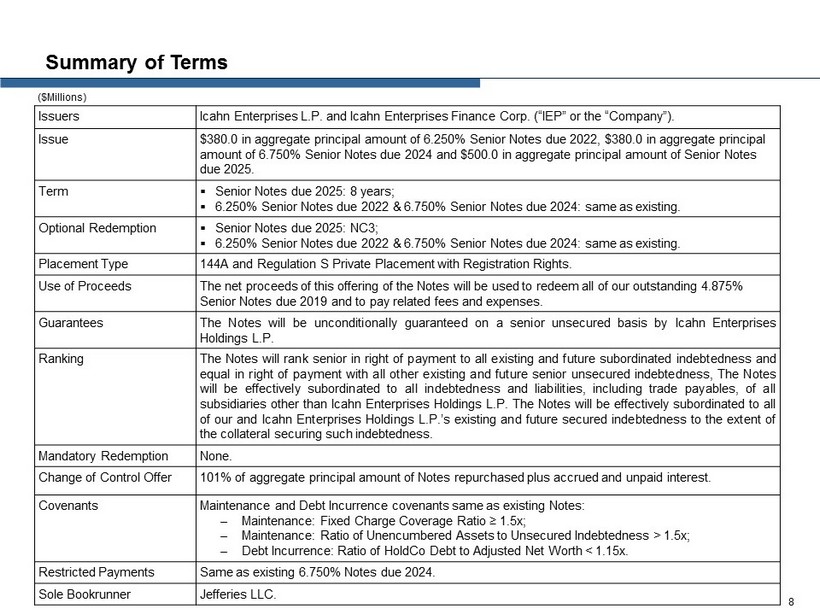
Summary of Terms Issuers Icahn Enterprises L.P. and Icahn Enterprises Finance Corp. (“IEP” or the “Company”). Issue $380.0 in aggregate principal amount of 6.250% Senior Notes due 2022, $380.0 in aggregate principal amount of 6.750% Senior Notes due 2024 and $500.0 in aggregate principal amount of Senior Notes due 2025. Term ▪ Senior Notes due 2025: 8 years; ▪ 6.250% Senior Notes due 2022 & 6.750% Senior Notes due 2024: same as existing. Optional Redemption ▪ Senior Notes due 2025: NC3; ▪ 6.250% Senior Notes due 2022 & 6.750% Senior Notes due 2024: same as existing. Placement Type 144A and Regulation S Private Placement with Registration Rights. Use of Proceeds The net proceeds of this offering of the Notes will be used to redeem all of our outstanding 4.875% Senior Notes due 2019 and to pay related fees and expenses. Guarantees The Notes will be unconditionally guaranteed on a senior unsecured basis by Icahn Enterprises Holdings L . P . Ranking The Notes will rank senior in right of payment to all existing and future subordinated indebtedness and equal in right of payment with all other existing and future senior unsecured indebtedness, The Notes will be effectively subordinated to all indebtedness and liabilities, including trade payables, of all subsidiaries other than Icahn Enterprises Holdings L . P . The Notes will be effectively subordinated to all of our and Icahn Enterprises Holdings L . P . ’s existing and future secured indebtedness to the extent of the collateral securing such indebtedness . Mandatory Redemption None . Change of Control Offer 101 % of aggregate principal amount of Notes repurchased plus accrued and unpaid interest . Covenants Maintenance and Debt Incurrence covenants same as existing Notes: – Maintenance: Fixed Charge Coverage Ratio ≥ 1.5x; – Maintenance: Ratio of Unencumbered Assets to Unsecured Indebtedness > 1.5x; – Debt Incurrence: Ratio of HoldCo Debt to Adjusted Net Worth < 1.15x. Restricted Payments Same as existing 6.750% Notes due 2024. Sole Bookrunner Jefferies LLC. 8 ($Millions)

Company Overview

Overview of Icahn Enterprises Icahn Enterprises L.P. is a diversified holding company with operating segments in Investment, Automotive, Energy, Gaming, Mi nin g, Railcar, Food Packaging, Metals, Real Estate and Home Fashion IEP is majority owned and controlled by Carl Icahn – Over many years, Carl Icahn has contributed most of his businesses to and executed transactions primarily through IEP – As of September 30, 2017, Carl Icahn and his affiliates owned approximately 90.8% of IEP’s outstanding depositary units IEP benefits from cash flows from its subsidiaries: – CVR Energy: $2.00 per share annualized dividend – American Railcar Inc: $1.60 per share annual dividend – Recurring cash flows from our Real Estate segment IEP has daily liquidity through its ability to redeem its investment in the funds on a daily basis (1) Investment segment total assets represents book value of equity. 10 ($ millions) As of September 30, 2017 Segment Assets Revenue Net (Loss) Income Attrib. to IEP Adj. EBITDA Attrib. to IEP Investment (1) $7,437 $119 $54 $112 Automotive 10,651 10,282 529 768 Energy 4,947 5,730 24 205 Metals 223 376 (3) 12 Railcar 1,910 2,264 1,115 312 Gaming 1,333 949 43 105 Mining 251 96 5 19 Food Packaging 499 376 6 44 Real Estate 931 543 468 40 Home Fashion 193 182 (17) (5) Holding Company 869 66 (298) 28 Total $29,244 $20,983 $1,926 $1,640 Twelve Months Ended September 30, 2017

66% CVR Energy Inc. (NYSE: CVI) Summary Corporate Organizational Chart WestPoint Home LLC PSC Metals Inc. AREP Real Estate Holdings, LLC Tropicana Entertainment Inc. (OTCPK:TPCA) Federal - Mogul LLC Icahn Enterprises G.P. Inc. Icahn Enterprises L.P. (NasdaqGS: IEP) Icahn Enterprises Holdings L.P. 1% 1% 99% LP Interest 34% 75% 100% 82% American Railcar Industries, Inc. (NasdaqGS:ARII) Icahn Capital LP Viskase Companies Inc. (OTCPK:VKSC) As of September 30, 2017, Icahn Enterprises had investments with a fair market value of approximately $2.9 billion in the Investment Funds One of the largest independent metal recycling companies in the US Consists of rental commercial real estate, property development and associated resort activities Provider of home textile products for nearly 200 years One of the worldwide leaders in cellulosic, fibrous and plastic casings for processed meat industry Holding company that owns substantial interests in two separate operating subsidiaries Multi - jurisdictional gaming company with eight casinos in New Jersey, Indiana, Nevada, Mississippi, Missouri, Louisiana and Aruba Leading North American manufacturer of hopper and tank railcars and provider of railcar repair and maintenance services 84% 100% 100% 62% Producer and distributer of nitrogen fertilizer products CVR Partners, LP (NYSE: UAN) CVR Refining, LP (NYSE: CVRR) 185k bpd capacity oil refining company in the mid - continent region of the United States 100% 100% 4% Leading global supplier to the automotive, aerospace, energy, heavy duty truck, industrial, marine, power generation and auto aftermarket industries Note: Percentages denote equity ownership as of November 1, 2017. Excludes intermediary and pass through entities. 11 Ferrous Resources Brazilian iron ore producer Icahn Automotive Group LLC Engaged in the distribution of automotive parts in the aftermarket as well as providing automotive services 100% 77%

Deep Team Led by Carl Icahn Led by Carl Icahn ─ Substantial investing history provides IEP with unique network of relationships and access to Wall Street Team consists of approximately 20 professionals with diverse backgrounds ─ Well rounded team with professionals focusing on different areas such as equity, distressed debt and credit Name Title Years at Icahn Years of Industry Experience Keith Cozza President & Chief Executive Officer , Icahn Enterprises L.P. 13 16 SungHwan Cho Chief Financial Officer , Icahn Enterprises L.P. 11 20 Courtney Mather Portfolio Manager, Icahn Capital 3 18 Richard Mulligan Portfolio Manager, Icahn Capital 1 38 Brett Icahn Consultant, Icahn Enterprises L.P. 13 13 Jesse Lynn General Counsel, Icahn Enterprises L.P. 13 22 Andrew Langham General Counsel, Icahn Enterprises L.P. 12 18 12
Investment Highlights
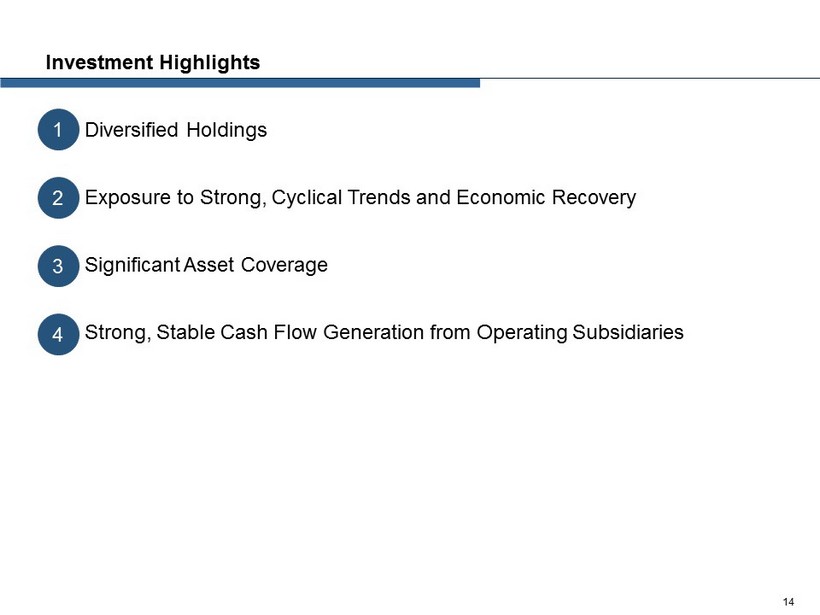
Investment Highlights Diversified Holdings Exposure to Strong, Cyclical Trends and Economic Recovery Significant Asset Coverage Strong, Stable Cash Flow Generation from Operating Subsidiaries 1 2 3 4 14

Diversified Holdings Operating Segments for Icahn Enterprises Automotive(3) 27% Energy(4) 16% Gaming(5) 13% Railcar(6) 8% Food Packaging 2% Metals 1% Real Estate 7% Home Fashion 1% Mining 1% Investment 24% Asset Mix (1)(2) 1 The Company is well diversified across various industries and sectors (1) Indicative Net Asset Value of subsidiaries as of September 30, 2017, refer to slide 22. (2) Excludes Holding Company. (3) Automotive includes Federal - Mogul and Icahn Automotive Group LLC. (4) Energy includes CVR Energy and CVR Refining (direct holding). (5) Gaming includes Tropicana and Trump Entertainment. (6) Railcar includes American Railcar Industries and RemainCo . 15

Diversified Subsidiary Companies with Significant Inherent Value The Company’s diversification across multiple industries and geographies provides a natural hedge against cyclical and general economic swings Global market leader in each of its principal product categories with a long history of quality and strong brand names Geographically diverse, regional properties in major gaming markets with significant consolidation opportunities 200 year heritage with some of the best known brands in home fashion; consolidation likely in fragmented sector Leading global market position in non - edible meat casings poised to capture further growth in emerging markets Established regional footprint positioned to actively participate in consolidation of the highly fragmented scrap metal market A leading, vertically integrated manufacturer of railcars, railcar services and railcar leasing. Strategically located mid - continent petroleum refiner and nitrogen fertilizer producer generating record profitability Long - term real estate investment horizon with strong, steady cash flows AREP Real Estate Holdings, LLC IEP’s subsidiary companies possess key competitive strengths and / or leading market positions IEP seeks to create incremental value by investing in organic growth and targeting businesses that offer consolidation opport uni ties ─ Capitalize on attractive interest rate environment to pursue acquisitions and recognize meaningful synergies 16 A Brazilian iron ore mining operation that supplies iron ore products to the global steel industry Engaged in the distribution of automotive parts in the aftermarket as well as providing automotive services

Highlights and Recent Developments Since inception in 2004 through September 30, 2017, the Investment Funds’ cumulative return was approximately 130.0%, representing an annualized rate of return of approximately 6.7% Long history of investing in public equity and debt securities and pursuing activist agenda Employs an activist strategy that seeks to unlock hidden value through various tactics ─ Financial / balance sheet restructurings (e.g., CIT Group, Apple) ─ Operational turnarounds (e.g., Motorola, Navistar) ─ Strategic initiatives (e.g., Motorola, eBay, Manitowoc) ─ Corporate governance changes (e.g., eBay, Gannet) The Investment Funds’ net notional exposure was net short 77% at September 30 , 2017 Segment: Investment Company Description IEP invests its proprietary capital through various private investment funds (the “Investment Funds”) managed by the Investment segment Fair value of IEP’s interest in the Investment Funds was approximately $2.9 billion as of September 30, 2017 IEP has daily liquidity through its ability to redeem its investment in the Investment Funds on a daily basis Historical Segment Financial Summary 17 (1) Balance Sheet data as of the end of each respective fiscal period. (2) Represents a weighted - average composite of the gross returns, net of expenses for the Investment Funds. (3) 2012 gross return assumes that IEP’s holdings in CVR Energy remained in the Investment Funds for the entire period. IEP obta ine d a majority stake in CVR Energy in May 2012. Investment Funds returns were approximately 6.6% when excluding returns on CVR Energy after it became a consolidated entity. (4) For the nine months ended September 30, 2017. (35.6%) 33.3% 15.2% 34.5% 20.2% 30.8% (7.4%) (18.0%) (20.3%) 6.6% 2008 2009 2010 2011 2012 2013 2014 2015 2016 2017 Historical Returns (2) (3) (4) Investment Segment LTM September 30, ($ millions) 2014 2015 2016 2017 Select Income Statement Data: Total revenues ($218) ($865) ($1,223) $119 Net income (loss) (684) (1,665) (1,487) (75) Net income (loss) attrib. to IEP (305) (760) (604) 54 Select Balance Sheet Data (1) : Total equity $9,062 $7,541 $5,396 $7,437 Equity attributable to IEP 4,284 3,428 1,669 2,882 FYE December 31, 2
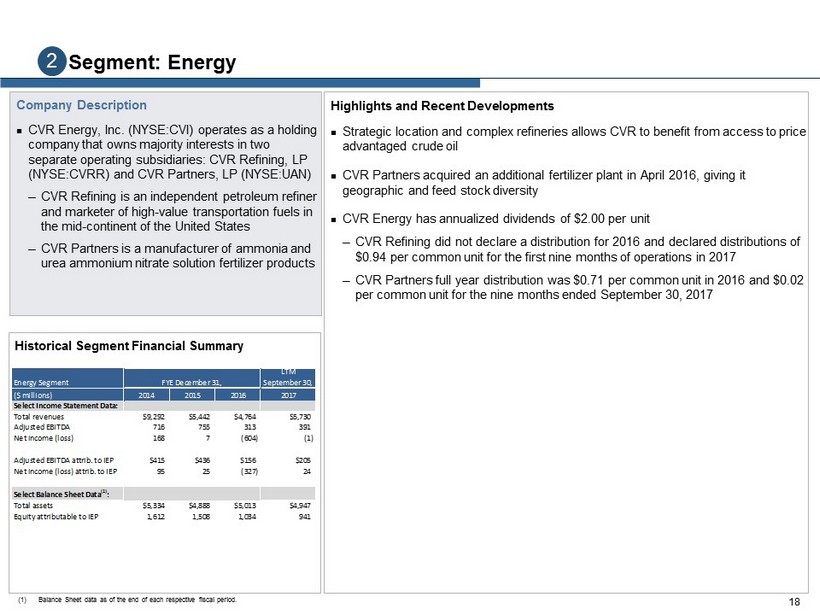
Highlights and Recent Developments Strategic location and complex refineries allows CVR to benefit from access to price advantaged crude oil CVR Partners acquired an additional fertilizer plant in April 2016, giving it geographic and feed stock diversity CVR Energy has annualized dividends of $2.00 per unit ─ CVR Refining did not declare a distribution for 2016 and declared distributions of $0.94 per common unit for the first nine months of operations in 2017 ─ CVR Partners full year distribution was $0.71 per common unit in 2016 and $0.02 per common unit for the nine months ended September 30, 2017 Segment: Energy Company Description CVR Energy, Inc. (NYSE:CVI) operates as a holding company that owns majority interests in two separate operating subsidiaries: CVR Refining, LP (NYSE:CVRR) and CVR Partners, LP ( NYSE:UAN ) ─ CVR Refining is an independent petroleum refiner and marketer of high - value transportation fuels in the mid - continent of the United States ─ CVR Partners is a manufacturer of ammonia and urea ammonium nitrate solution fertilizer products Historical Segment Financial Summary 18 (1) Balance Sheet data as of the end of each respective fiscal period. Energy Segment LTM September 30, ($ millions) 2014 2015 2016 2017 Select Income Statement Data: Total revenues $9,292 $5,442 $4,764 $5,730 Adjusted EBITDA 716 755 313 391 Net income (loss) 168 7 (604) (1) Adjusted EBITDA attrib. to IEP $415 $436 $156 $205 Net income (loss) attrib. to IEP 95 25 (327) 24 Select Balance Sheet Data (1) : Total assets $5,334 $4,888 $5,013 $4,947 Equity attributable to IEP 1,612 1,508 1,034 941 FYE December 31, 2

Segment: Automotive Company Description We conduct our Automotive segment through our wholly owned subsidiaries Federal - Mogul LLC ("Federal - Mogul") and Icahn Automotive Group LLC ("Icahn Automotive"), which is the parent company of IEH Auto Parts Holding LLC and The Pep Boys - Manny, Moe and Jack Federal - Mogul is engaged in the manufacture and distribution of automotive parts Icahn Automotive provides automotive maintenance services as well as retail and wholesale sales of automotive parts Historical Segment Financial Summary Federal - Mogul: Powertrain Highlights Fuel economy and emissions content driving market growth – Combustion engines still #1 for foreseeable future – Regulations increasing demand for further improvement through 2025 – Engine downsizing creates higher content product mix Leading powertrain products with #1 or #2 position in most major product categories Extensive technology and intellectual property with focus on core product lines Investing in emerging markets where there are attractive opportunities for growth Continued restructuring to lower cost structure and improve manufacturing footprint Federal - Mogul: Motorparts Highlights Aftermarket benefits from the growing number of vehicles and the increasing age of vehicles Leader in most of its product categories with a long history of quality and strong brand names including Champion, Wagner, Ferodo, MOOG, Fel - Pro Investing in Growth – Global Expansion : L everage global capabilities in Asia and other emerging markets – Distribution and IT : Improve customer service and delivery, order and inventory management, on - line initiatives – Cost Structure : improve manufacturing footprint, optimize low - cost sourcing and operational performance – Product Line Growth : expand existing product lines and add new product lines – Product Differentiation and Brand Value : invest in product innovation and communicate brand value proposition to end customers 19 Recent Developments In January 2017, Icahn Enterprises completed the acquisition of all outstanding shares of Federal Mogul not already owned by Icahn Enterprises (1) Balance Sheet data as of the end of each respective fiscal period. (2) Results include IEH Auto Parts Holding LLC beginning June 1, 2015 and Pep Boys beginning February 3, 2016. Icahn Automotive Group LLC Pep Boys and IEH Auto are operated together in order to grow their sales to DIFM distributors and DIFM service professionals, to grow their automotive service business, and to maintain their DIY customer bases by offering the broadest product assortment in the automotive aftermarket In 2017, we increased the number of stores in our service network by over 1,000 locations – Just Brakes in January 2017 (134 locations), Precision Auto Care in July 2017 (253 locations), American Driveline Systems in October 2017 (680 locations) Automotive Segment LTM September 30, ($ millions) 2014 2015 (2) 2016 (2) 2017 Select Income Statement Data: Total revenues $7,324 $7,853 $9,928 $10,282 Adjusted EBITDA 630 651 834 813 Net income (loss) (90) (352) 77 543 Adjusted EBITDA attrib. to IEP $502 $531 $692 $768 Net income (loss) attrib. to IEP (87) (299) 53 529 Select Balance Sheet Data (1) : Total assets $7,529 $7,943 $9,819 $10,651 Equity attributable to IEP 1,231 1,270 2,292 2,852 FYE December 31, 2

Highlights and Recent Developments The initial sale of ARL to SMBC Rail closed on June 1, 2017 ─ Received approximately $1.3 billion in cash resulting in a pre - tax gain of $1.5 billion for the first nine months ending September 30, 2017 ─ In October 2017, we sold an additional 4,382 railcars to SMBC Rail for $522 million, resulting in a $154 million pretax gain Railcar manufacturing ─ Railcar shipments for the three months ended September 30, 2017 of 893 railcars, including 275 railcars to leasing customers ─ Tank railcar demand impacted by volatile crude oil prices Approximately 12,700 railcars (2) in lease fleet provide stable cash flows ARI annualized dividend is $1.60 per share On July 28, 2015, ARI’s Board of Directors authorized a $250 million stock repurchase program Segment: Railcar Segment Description American Railcar Industries, Inc. (NASDAQ:ARII) operates in three business segments: manufacturing operations, railcar services and leasing American Railcar Leasing, LLC (“ARL”), was engaged in the business of leasing railcars. As of June 1, 2017, IEP sold ARL, along with a majority of its railcar lease fleet Historical Segment Financial Summary . 20 (1) Balance Sheet data as of the end of each respective fiscal period. (2) As of November 1, 2017. Railcar Segment LTM September 30, ($ millions) 2014 2015 2016 2017 Net Sales/Other Revenues From Operations: Manufacturing $379 $440 $430 $299 Railcar leasing 364 452 471 377 Railcar services 47 47 51 67 Total $790 $939 $952 $743 Gross Margin: Manufacturing $91 $102 $64 $33 Railcar leasing 219 276 276 277 Railcar services 17 22 23 23 Total $327 $400 $363 $333 Adjusted EBITDA attrib. to IEP $269 $318 $379 $312 Net income (loss) attrib. to IEP 122 137 150 1,115 Total assets (1) $3,120 $3,681 $3,332 $1,910 Equity attributable to IEP (1) 711 742 444 787 FYE December 31, 2
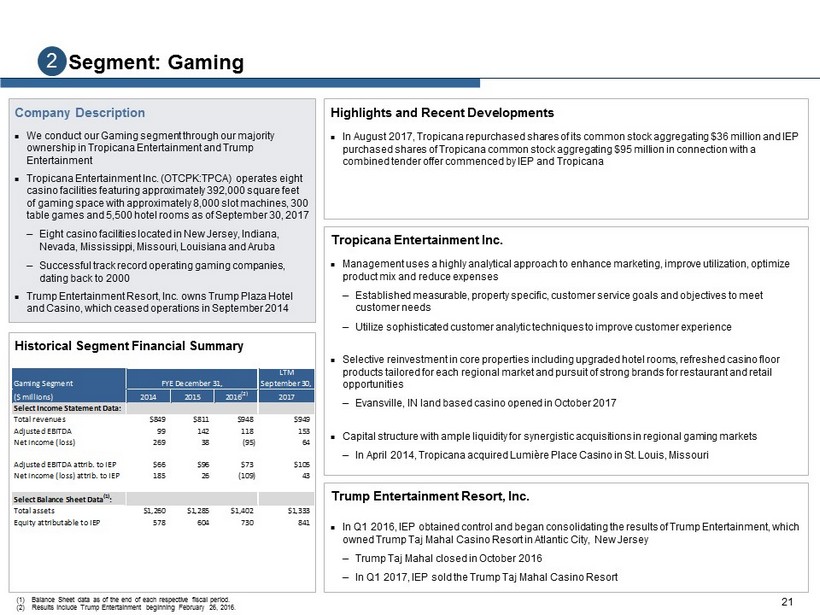
Highlights and Recent Developments In August 2017, Tropicana repurchased shares of its common stock aggregating $36 million and IEP purchased shares of Tropicana common stock aggregating $95 million in connection with a combined tender offer commenced by IEP and Tropicana Segment: Gaming Company Description We conduct our Gaming segment through our majority ownership in Tropicana Entertainment and Trump Entertainment Tropicana Entertainment Inc. (OTCPK:TPCA) operates eight casino facilities featuring approximately 392,000 square feet of gaming space with approximately 8,000 slot machines, 300 table games and 5,500 hotel rooms as of September 30, 2017 ─ Eight casino facilities located in New Jersey, Indiana, Nevada, Mississippi, Missouri, Louisiana and Aruba ─ Successful track record operating gaming companies, dating back to 2000 Trump Entertainment Resort, Inc. owns Trump Plaza Hotel and Casino, which ceased operations in September 2014 Historical Segment Financial Summary 21 (1) Balance Sheet data as of the end of each respective fiscal period. (2) Results include Trump Entertainment beginning February 26, 2016. Tropicana Entertainment Inc. Management uses a highly analytical approach to enhance marketing, improve utilization, optimize product mix and reduce expenses ─ Established measurable, property specific, customer service goals and objectives to meet customer needs ─ Utilize sophisticated customer analytic techniques to improve customer experience Selective reinvestment in core properties including upgraded hotel rooms, refreshed casino floor products tailored for each regional market and pursuit of strong brands for restaurant and retail opportunities ─ Evansville, IN land based casino opened in October 2017 Capital structure with ample liquidity for synergistic acquisitions in regional gaming markets ─ In April 2014, Tropicana acquired Lumière Place Casino in St. Louis, Missouri Trump Entertainment Resort, Inc. In Q1 2016, IEP obtained control and began consolidating the results of Trump Entertainment, which owned Trump Taj Mahal Casino Resort in Atlantic City, New Jersey ─ Trump Taj Mahal closed in October 2016 ─ In Q1 2017, IEP sold the Trump Taj Mahal Casino Resort Gaming Segment LTM September 30, ($ millions) 2014 2015 2016 (2) 2017 Select Income Statement Data: Total revenues $849 $811 $948 $949 Adjusted EBITDA 99 142 118 153 Net income (loss) 269 38 (95) 64 Adjusted EBITDA attrib. to IEP $66 $96 $73 $105 Net income (loss) attrib. to IEP 185 26 (109) 43 Select Balance Sheet Data (1) : Total assets $1,260 $1,285 $1,402 $1,333 Equity attributable to IEP 578 604 730 841 FYE December 31, 2

Significant Asset Coverage Significant Valuation demonstrated by market value of IEP’s public subsidiaries and Holding Company interest in Funds and boo k v alue or market comparables of other assets 22 Note: Indicative net asset value does not purport to reflect a valuation of IEP. The calculated Indicative net asset value d oes not include any value for our Investment Segment other than the fair market value of our investment in the Investment Funds. A valuation is a subjective exercise and Indicative net asset value does not necessarily co nsider all elements or consider in the adequate proportion the elements that could affect the valuation of IEP. Investors may reasonably differ on what such elements are and their impact on IEP. No represen tat ion or assurance, express or implied is made as to the accuracy and correctness of indicative net asset value as of these dates or with respect to any future indicative or prospective results which may vary. (1) Represents equity attributable to us as of each respective date. (2) Based on closing share price on each date (or if such date was not a trading day, the immediately preceding trading day) and the number of shares owned by the Holding Company as of each respective date. (3) Amounts based on market comparables due to lack of material trading volume. Tropicana valued at 8.5x Adjusted EBITDA for the twe lve months ended December 31, 2016, and 9.0x Adjusted EBITDA for the twelve months ended March 31, 2017, June 30, 2017 and September 30, 2017. Viskase valued at 9.0x Adjusted EBITDA for the twelve months ended December 31, 2016, Mar ch 31, 2017, June 30, 2017 and September 30, 2017. (4) December 31, 2016 represents the closing share price on each date (or if such date was not a trading day, the immediately pre ced ing trading day) and the number of shares owned by the Holding Company. March 31, 2017, June 30, 2017 and September 30, 2017 represents the value of the company based on IEP’s tender offer during Q1 2017. (5) December 31, 2016 and March 31, 2017 reflect the initial sale of ARL to SMBC Rail and assumes that the ARL cars not being so ld to SMBC Rail during the initial closing are valued at the purchase price option set forth in the ARL sales agreement less liabilities. June 30, 2017 and September 30, 2017 represents the option purchase price of the remaining cars not sold in th e initial ARL sale, plus working capital as of that date. (6) Holding Company’s balance as of each respective date. (7) Holding Company’s balance as of each respective date. For March 31, 2017, the distribution payable was adjusted to $20 millio n, which represents the actual distribution paid subsequent to March 31, 2017. Dec 31 March 31 June 30 Sept 30 2016 2017 2017 2017 Market-valued Subsidiaries: Holding Company interest in Funds (1) $1,669 $1,846 $2,742 $2,882 CVR Energy (2) 1,808 1,430 1,549 1,844 CVR Refining - direct holding (2) 60 54 55 57 American Railcar Industries (2) 538 488 455 458 Total market-valued subsidiaries $4,074 $3,818 $4,801 $5,241 Other Subsidiaries Tropicana (3) $862 $981 $1,092 $1,429 Viskase (3) 154 155 164 179 Federal-Mogul (4) 1,429 1,690 1,690 1,690 Real Estate Holdings (1) 642 638 643 851 PSC Metals (1) 155 169 169 169 WestPoint Home (1) 164 161 157 153 ARL / RemainCo (5) 1,689 1,699 557 537 Ferrous Resources (1) 104 109 125 123 Icahn Automotive Group LLC (1) 1,319 1,301 1,325 1,487 Trump Entertainment (1) 86 28 32 64 Total - other subsidiaries $6,605 $6,932 $5,954 $6,683 Add: Holding Company cash and cash equivalents (6) 225 337 653 484 Less: Holding Company debt (6) (5,490) (5,507) (5,507) (5,508) Add: Other Holding Company net assets (7) 171 163 93 175 Indicative Net Asset Value $5,585 $5,743 $5,994 $7,075 As of 3 ($Millions)

Strong, Stable Cash Flow Generation from Operating Subsidiaries The Company and its subsidiaries generate ample cash flow to cover interest payments and operating expenses Holding Company liquidity of $3.7 billion (1) , comprised of Hold Co. cash and IEP’s interest in the Investment Funds 4 (1) As adjusted for three transactions which occurred on October 2, 2017: $522 million from the sale of 4,382 railcars, $124 mill ion for the purchase of American Driveline Systems and $300 million investment into the Investment segment. 23 Actual As Adjusted (1) Last Twelve Months Ended September 30, 2017 Last Twelve Months Ended September 30, 2017 ($in millions) (unaudited) (unaudited) Cash Dividends and Distributions: CVR Energy, Inc. $182 $182 American Railcar Industries, Inc. 19 19 American Railcar Leasing, LLC 72 72 Icahn Automotive Group - - Cash distribution from our Real Estate segment 15 15 Cash distribution from our Investment segment 300 300 Total regular cash dividends and distributions $588 $588 Proceeds from asset sales: American Railcar Leasing, LLC $1,286 $1,808 Real Estate segment 255 255 Other 37 37 Total proceeds from asset sales $1,578 $2,100 Significant investments: Icahn Automotive Group ($220) ($344) Federal-Mogul (254) (254) Tropicana (95) (95) Investment segment (1,300) (1,600) Total significant investments ($1,869) ($2,293) Cash flow, net of significant investments $297 $395

Liquidity Serves as a Competitive Advantage The Company and its subsidiaries maintain ample liquidity to take advantage of attractive opportunities for their respective businesses ($Millions) 24 4 Actual As Adjusted (1) Liquidity As of 9/30/2017 As of 9/30/2017 Liquid Assets: Hold Co. Cash & Cash Equivalents $484 $582 IEP Interest in Investment Funds 2,864 3,164 Subsidiaries Cash & Cash Equivalents 1,554 1,554 Total $4,902 $5,300 Subsidiary Revolver Availability: Automotive $456 $456 Energy 419 419 Railcar 200 200 Gaming - - Food Packaging 8 8 Home Fashion 24 24 Subsidiary Revolver Availability $1,107 $1,107 Total Liquidity $6,009 $6,407 (1) As adjusted for three transactions which occurred on October 2, 2017: $522 million from the sale of 4,382 railcars, $124 mill ion for the purchase of American Driveline Systems and $300 million investment into the Investment segment.

Financial Performance

Financial Performance Net Income (Loss) Attributable to Icahn Enterprises Adjusted EBITDA Attributable to Icahn Enterprises 26 ($373) ($1,194) ($1,128) $1,926 FYE 2014 FYE 2015 FYE 2016 LTM 9/30/17 $1,018 $930 $837 $1,640 FYE 2014 FYE 2015 FYE 2016 LTM 9/30/17 LTM September 30, LTM September 30, ($ in millions) 2014 2015 2016 2017 ($ in millions) 2014 2015 2016 2017 Net Income (Loss) Attributable to Icahn Enterprises Adjusted EBITDA attributable to Icahn Enterprises Investment ($305) ($760) ($604) $54 Investment ($162) ($500) ($528) $112 Automotive (87) (299) 53 529 Automotive 502 531 692 768 Energy 95 25 (327) 24 Energy 415 436 156 205 Metals (25) (51) (20) (3) Metals (15) (29) (15) 12 Railcar 122 137 150 1,115 Railcar 269 318 379 312 Gaming 185 26 (109) 43 Gaming 66 96 73 105 Mining - (150) (19) 5 Mining - (6) 1 19 Food Packaging 6 (3) 6 6 Food Packaging 47 43 40 44 Real Estate 22 61 12 468 Real Estate 46 45 41 40 Home Fashion 2 (4) (12) (17) Home Fashion 5 6 (1) (5) Holding Company (388) (176) (258) (298) Holding Company (155) (10) (1) 28 Total ($373) ($1,194) ($1,128) $1,926 Total $1,018 $930 $837 $1,640 FYE December 31,FYE December 31, ($Millions)

Consolidated Financial Snapshot 27 ($Millions) LTM September 30, 2014 2015 2016 2016 2017 2017 Net Income (Loss): Investment ($684) ($1,665) ($1,487) ($972) $440 ($75) Automotive (90) (352) 77 103 569 543 Energy 168 7 (604) (588) 15 (1) Metals (25) (51) (20) (13) 4 (3) Railcar 188 213 183 123 1,074 1,134 Gaming 269 38 (95) (69) 90 64 Mining - (195) (24) (21) 10 7 Food Packaging 9 (3) 8 8 8 8 Real Estate 22 61 12 13 469 468 Home Fashion 2 (4) (12) (6) (11) (17) Holding Company (388) (176) (258) (234) (274) (298) Net Income (Loss) ($529) ($2,127) ($2,220) ($1,656) $2,394 $1,830 Less: net income (loss) attrib. to NCI (156) (933) (1,092) (734) 262 (96) Net Income (Loss) attib. to IEP ($373) ($1,194) ($1,128) ($2,390) $2,656 $1,926 Adjusted EBITDA: Investment ($385) ($1,100) ($1,257) ($788) $574 $105 Automotive 630 651 834 650 629 813 Energy 716 755 313 270 348 391 Metals (15) (29) (15) (11) 16 12 Railcar 415 492 458 332 245 371 Gaming 99 142 118 109 144 153 Mining - (9) 2 (3) 22 27 Food Packaging 66 59 55 39 45 61 Real Estate 46 45 41 29 28 40 Home Fashion 5 6 (1) 0 (4) (5) Holding Company (155) (10) (1) 6 35 28 Consolidated Adjusted EBITDA $1,422 $1,002 $547 $633 $2,082 $1,996 Less: Adjusted EBITDA attrib. to NCI 404 72 (290) 60 (586) 356 Adjusted EBITDA attrib. to IEP $1,018 $930 $837 $693 $1,496 $1,640 Capital Expenditures $1,411 $1,359 $826 $615 $692 $903 Nine Months Ended September 30, FYE December 31,
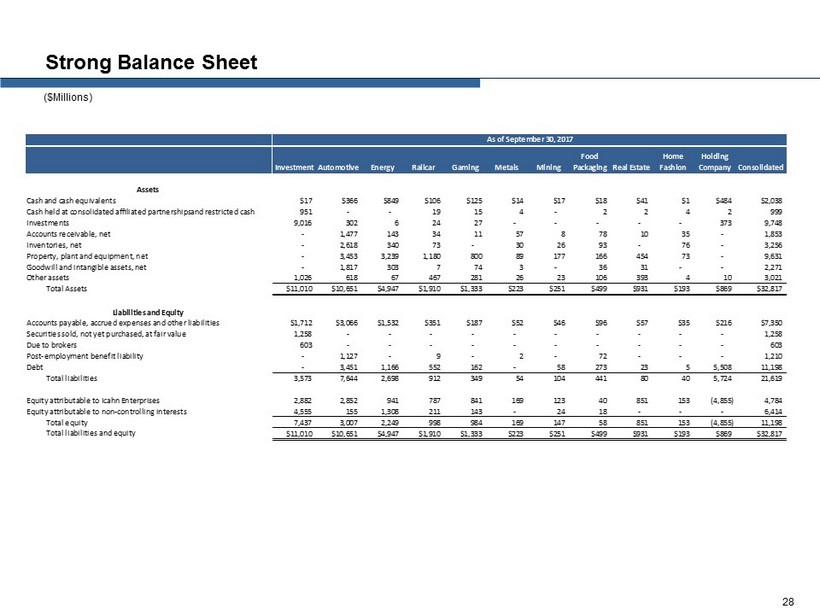
Strong Balance Sheet ($Millions) 28 InvestmentAutomotive Energy Railcar Gaming Metals Mining Food Packaging Real Estate Home Fashion Holding Company Consolidated Assets Cash and cash equivalents $17 $366 $849 $106 $125 $14 $17 $18 $41 $1 $484 $2,038 Cash held at consolidated affiliated partnerships and restricted cash 951 - - 19 15 4 - 2 2 4 2 999 Investments 9,016 302 6 24 27 - - - - - 373 9,748 Accounts receivable, net - 1,477 143 34 11 57 8 78 10 35 - 1,853 Inventories, net - 2,618 340 73 - 30 26 93 - 76 - 3,256 Property, plant and equipment, net - 3,453 3,239 1,180 800 89 177 166 454 73 - 9,631 Goodwill and intangible assets, net - 1,817 303 7 74 3 - 36 31 - - 2,271 Other assets 1,026 618 67 467 281 26 23 106 393 4 10 3,021 Total Assets $11,010 $10,651 $4,947 $1,910 $1,333 $223 $251 $499 $931 $193 $869 $32,817 Liabilities and Equity Accounts payable, accrued expenses and other liabilities $1,712 $3,066 $1,532 $351 $187 $52 $46 $96 $57 $35 $216 $7,350 Securities sold, not yet purchased, at fair value 1,258 - - - - - - - - - - 1,258 Due to brokers 603 - - - - - - - - - - 603 Post-employment benefit liability - 1,127 - 9 - 2 - 72 - - - 1,210 Debt - 3,451 1,166 552 162 - 58 273 23 5 5,508 11,198 Total liabilities 3,573 7,644 2,698 912 349 54 104 441 80 40 5,724 21,619 Equity attributable to Icahn Enterprises 2,882 2,852 941 787 841 169 123 40 851 153 (4,855) 4,784 Equity attributable to non-controlling interests 4,555 155 1,308 211 143 - 24 18 - - - 6,414 Total equity 7,437 3,007 2,249 998 984 169 147 58 851 153 (4,855) 11,198 Total liabilities and equity $11,010 $10,651 $4,947 $1,910 $1,333 $223 $251 $499 $931 $193 $869 $32,817 As of September 30, 2017

Appendix 29

IEP began as American Real Estate Partners, which was founded in 1987, and has grown its diversified portfolio to ten operati ng segments and approximately $33 billion of assets as of September 30, 2017 IEP has demonstrated a history of successfully acquiring undervalued assets and improving and enhancing their operations and fin ancial results IEP’s record is based on a long - term horizon that can enhance business value and facilitate a profitable exit strategy ─ In 2006, IEP sold its oil and gas assets for $1.5 billion, resulting in a net pre - tax gain of $0.6 billion ─ In 2008, IEP sold its investment in American Casino & Entertainment Properties for $1.2 billion, resulting in a pre - tax gain of $0.7 billion ─ In 2017, IEP sold American Railcar Leasing for $3.4 billion and recognized a pre - tax gain of $1.7 billion Acquired partnership interest in Icahn Capital Management L.P. in 2007 ─ IEP and certain of Mr. Icahn's wholly owned affiliates are the sole investors in the Investment Funds IEP also has grown the business through organic investment and through a series of bolt - on acquisitions ─ Acquired Pep Boys in 2016 Evolution of Icahn Enterprises Timeline of Recent Acquisitions and Exits (1) Market capitalization as of September 30, 2017 and balance sheet data as of September 30, 2017. As of December 31, 2007 Mkt. Cap: $8.9bn Total Assets: $12.4bn Current (1) Mkt. Cap: $9.3bn Total Assets: $32.8bn American Casino & Entertainment Properties 2/20/08: Sale of the casinos resulted in proceeds of $1.2 billion and a pre - tax gain of $0.7 billion American Railcar Industries 1/15/10: 54.4% of ARI’s shares outstanding were contributed by Carl Icahn in exchange for IEP depositary units Tropicana Entertainment 11/15/10: Received an equity interest as a result of a Ch.11 restructuring and subsequently acquired a majority stake CVR Energy 5/4/12: Acquired a majority interest in CVR via a tender offer to purchase all outstanding shares of CVR Federal - Mogul 7/3/08: Acquired a majority interest in Federal - Mogul from companies wholly owned by Carl Icahn Viskase 1/15/10: 71.4% of Viskase’s shares outstanding were contributed by Carl Icahn in exchange for IEP depositary units Year: 30 CVR Refining & CVR Partners 2013: CVR Refining completed IPO and secondary offering. CVR Partners completed a secondary offering. 2017 2008 2009 2010 2011 2012 American Railcar Leasing 10/2/13: Acquired 75% of ARL from companies wholly owned by Carl Icahn 2013 2014 IEH Auto Parts Holding 6/1/15: IEH Auto Parts Holding acquired substantially all of the auto part assets in the U.S. of Uni - Select Inc. Ferrous Resources 6/8/15: IEP acquired a controlling interest in Ferrous Resources 2015 Pep Boys 2/4/16: IEP acquired Pep Boys 2016 American Railcar Leasing 2017: Sale of ARL for $3.4 billion and a pre - tax gain of $1.7 billion.

Highlights and Recent Developments Future growth expected to be driven by changing diets of a growing middle class in emerging markets ─ Majority of revenues from emerging markets ─ Acquired a plastic casing manufacturer in Poland in December 2016 and a fibrous casing manufacturer in January 2017 Developed markets remain a steady source of income ─ Distribution channels to certain customers spanning more than 50 years Significant barriers to entry ─ Technically difficult chemical production process ─ Significant environmental and food safety regulatory requirements ─ Substantial capital cost Segment: Food Packaging Company Description Viskase Companies, Inc (OTCPK:VKSC) is a worldwide leader in the production and sale of cellulosic, fibrous and plastic casings for the processed meat and poultry industry Leading worldwide manufacturer of non - edible cellulosic casings for small - diameter meats (hot dogs and sausages) ─ Leading manufacturer of non - edible fibrous casings for large - diameter meats (sausages, salami, hams and deli meats) Historical Segment Financial Summary 31 (1) Balance Sheet data as of the end of each respective fiscal period. Food Packaging Segment LTM September 30, ($ millions) 2014 2015 2016 2017 Select Income Statement Data: Total revenues $346 $337 $332 $376 Adjusted EBITDA 66 59 55 61 Net income (loss) 9 (3) 8 8 Adjusted EBITDA attrib. to IEP $47 $43 $40 $44 Net income (loss) attrib. to IEP 6 (3) 6 6 Select Balance Sheet Data (1) : Total assets $436 $416 $428 $499 Equity attributable to IEP 30 23 25 40 FYE December 31,

Highlights and Recent Developments Increasing global demand for steel and other metals drives demand for U.S. scrap Results are currently impacted by headwinds from: ─ Low iron ore prices ─ Strong U.S. dollar ─ Increased steel imports Scrap recycling process is “greener” than virgin steel production ─ Electric arc furnace drive scrap demand and are significantly more energy efficient than blast furnaces ─ Electric arc furnace steel mills are approximately 60% of U.S. production Highly fragmented industry with potential for further consolidation ─ Capitalizing on consolidation and vertical integration opportunities ─ PSC is building a leading position in its markets Product diversification will reduce volatility through cycles ─ Expansion of non - ferrous share of total business Segment: Metals Company Description PSC Metals, Inc. is one of the largest independent metal recycling companies in the U.S. Collects industrial and obsolete scrap metal, processes it into reusable forms and supplies the recycled metals to its customers Strong regional footprint (Upper Midwest, St. Louis Region and the South) Historical Segment Financial Summary 32 (1) Balance Sheet data as of the end of each respective fiscal period. Metals Segment LTM September 30, ($ millions) 2014 2015 2016 2017 Select Income Statement Data: Total revenues $711 $365 $269 $376 Adjusted EBITDA (15) (29) (15) 12 Net income (loss) (25) (51) (20) (3) Adjusted EBITDA attrib. to IEP ($15) ($29) ($15) $12 Net income (loss) attrib. to IEP (25) (51) (20) (3) Select Balance Sheet Data (1) : Total assets $315 $215 $193 $223 Equity attributable to IEP 250 182 155 169 FYE December 31,

Highlights and Recent Developments Business strategy is based on long - term investment outlook and operational expertise Rental Real Estate Operations Net lease portfolio overview ─ Single tenant (Over $200bn market cap, A - credit) for two large buildings with leases through 2020 – 2021 ─ 12 legacy properties with 2.9 million square feet: 13% Retail, 57% Industrial, 30% Office. Maximize value of commercial lease portfolio through effective management of existing properties ─ Seek to sell assets on opportunistic basis Property Development New Seabury in Cape Cod, Massachusetts and Grand Harbor in Vero Beach, Florida include land for future residential development of approximately 272 and 1,128 units, respectively In Q3 2017, sold a development property in Las Vegas Nevada for $600 million, resulting in a pretax gain of $456 million Club Operations Club operations in New Seabury, Cape Cod and Grand Harbor, Vero Beach focus on operating golf club and related activities Segment: Real Estate Company Description Consists of rental real estate, property development and associated club activities Rental real estate consists primarily of retail, office and industrial properties leased to single corporate tenants Property development and club operations are focused on the construction and sale of single and multi - family houses, lots in subdivisions and planned communities and raw land for residential development Historical Segment Financial Summary 33 (1) Balance Sheet data as of the end of each respective fiscal period. Real Estate Segment LTM September 30, ($ millions) 2014 2015 2016 2017 Select Income Statement Data: Total revenues $101 $131 $88 $543 Adjusted EBITDA 46 45 41 40 Net income (loss) 22 61 12 468 Adjusted EBITDA attrib. to IEP $46 $45 $41 $40 Net income (loss) attrib. to IEP 22 61 12 468 Select Balance Sheet Data (1) : Total assets $745 $701 $687 $931 Equity attributable to IEP 693 656 642 851 FYE December 31,
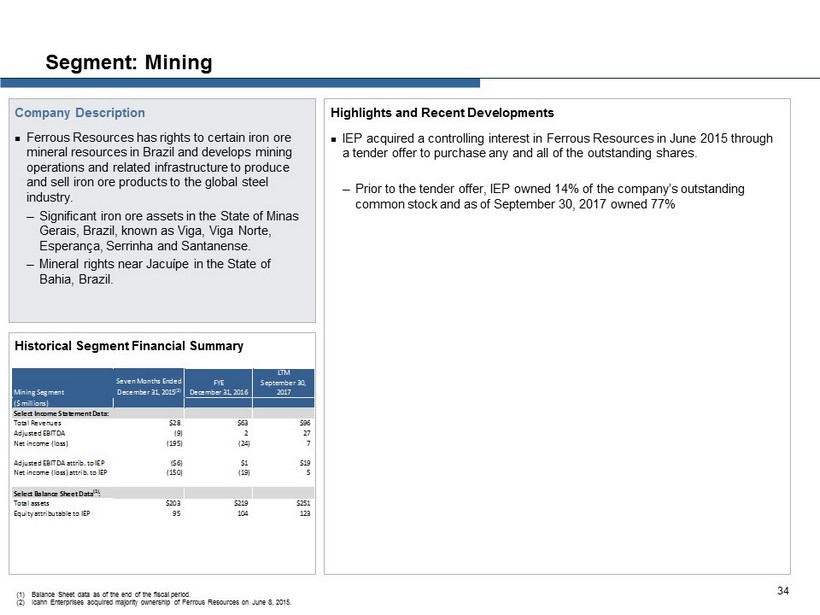
Highlights and Recent Developments IEP acquired a controlling interest in Ferrous Resources in June 2015 through a tender offer to purchase any and all of the outstanding shares. ─ Prior to the tender offer, IEP owned 14% of the company’s outstanding common stock and as of September 30, 2017 owned 77% Segment: Mining Company Description Ferrous Resources has rights to certain iron ore mineral resources in Brazil and develops mining operations and related infrastructure to produce and sell iron ore products to the global steel industry. ─ Significant iron ore assets in the State of Minas Gerais , Brazil, known as Viga , Viga Norte, Esperança , Serrinha and Santanense . ─ Mineral rights near Jacuípe in the State of Bahia, Brazil. Historical Segment Financial Summary 34 Mining Segment Seven Months Ended December 31, 2015 (2) FYE December 31, 2016 LTM September 30, 2017 ($ millions) Select Income Statement Data: Total Revenues $28 $63 $96 Adjusted EBITDA (9) 2 27 Net income (loss) (195) (24) 7 Adjusted EBITDA attrib. to IEP ($6) $1 $19 Net income (loss) attrib. to IEP (150) (19) 5 Select Balance Sheet Data (1) : Total assets $203 $219 $251 Equity attributable to IEP 95 104 123 (1) Balance Sheet data as of the end of the fiscal period. (2) Icahn Enterprises acquired majority ownership of Ferrous Resources on June 8, 2015.
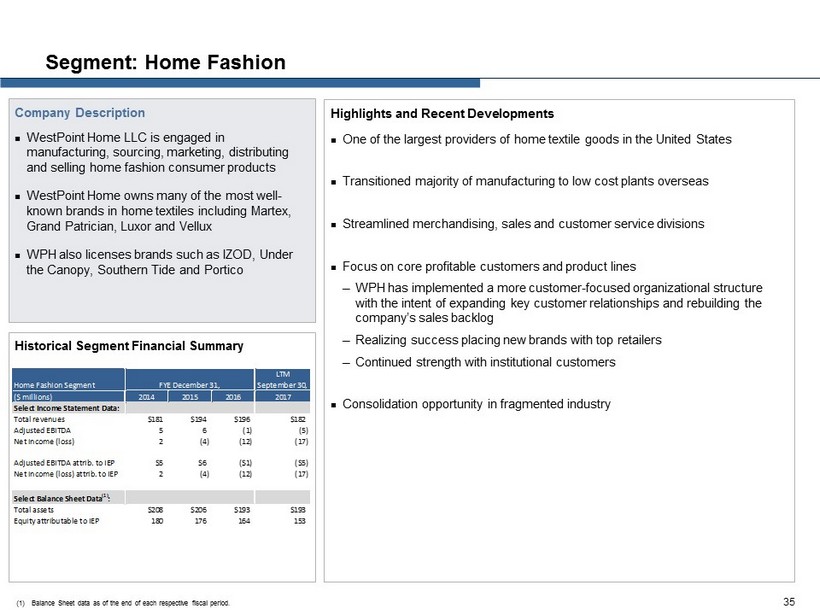
Highlights and Recent Developments One of the largest providers of home textile goods in the United States Transitioned majority of manufacturing to low cost plants overseas Streamlined merchandising, sales and customer service divisions Focus on core profitable customers and product lines ─ WPH has implemented a more customer - focused organizational structure with the intent of expanding key customer relationships and rebuilding the company’s sales backlog ─ Realizing success placing new brands with top retailers ─ Continued strength with institutional customers Consolidation opportunity in fragmented industry Segment: Home Fashion Company Description WestPoint Home LLC is engaged in manufacturing, sourcing, marketing, distributing and selling home fashion consumer products WestPoint Home owns many of the most well - known brands in home textiles including Martex, Grand Patrician, Luxor and Vellux WPH also licenses brands such as IZOD, Under the Canopy, Southern Tide and Portico Historical Segment Financial Summary 35 (1) Balance Sheet data as of the end of each respective fiscal period. Home Fashion Segment LTM September 30, ($ millions) 2014 2015 2016 2017 Select Income Statement Data: Total revenues $181 $194 $196 $182 Adjusted EBITDA 5 6 (1) (5) Net income (loss) 2 (4) (12) (17) Adjusted EBITDA attrib. to IEP $5 $6 ($1) ($5) Net income (loss) attrib. to IEP 2 (4) (12) (17) Select Balance Sheet Data (1) : Total assets $208 $206 $193 $193 Equity attributable to IEP 180 176 164 153 FYE December 31,

EBITDA Reconciliation 36
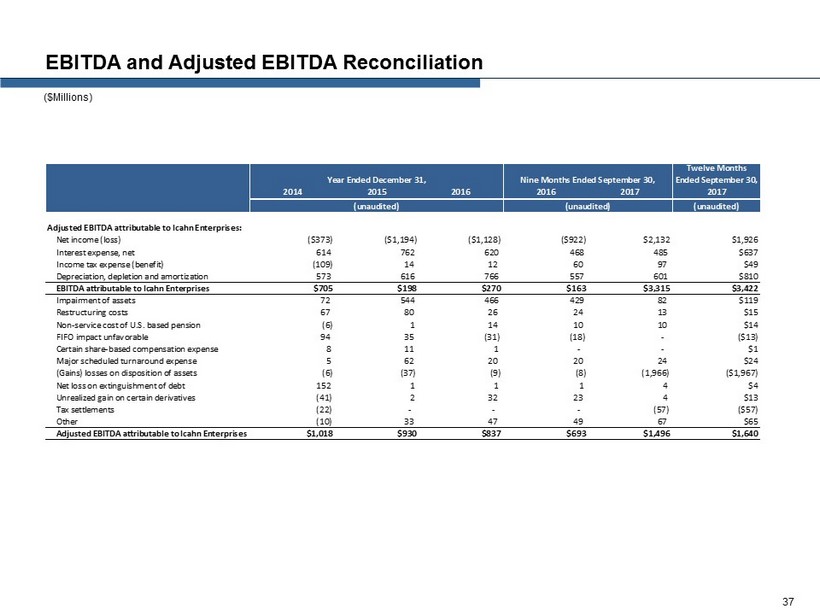
EBITDA and Adjusted EBITDA Reconciliation 37 ($Millions) Twelve Months Ended September 30, 2014 2015 2016 2016 2017 2017 (unaudited) Adjusted EBITDA attributable to Icahn Enterprises: Net income (loss) ($373) ($1,194) ($1,128) ($922) $2,132 $1,926 Interest expense, net 614 762 620 468 485 $637 Income tax expense (benefit) (109) 14 12 60 97 $49 Depreciation, depletion and amortization 573 616 766 557 601 $810 EBITDA attributable to Icahn Enterprises $705 $198 $270 $163 $3,315 $3,422 Impairment of assets 72 544 466 429 82 $119 Restructuring costs 67 80 26 24 13 $15 Non-service cost of U.S. based pension (6) 1 14 10 10 $14 FIFO impact unfavorable 94 35 (31) (18) - ($13) Certain share-based compensation expense 8 11 1 - - $1 Major scheduled turnaround expense 5 62 20 20 24 $24 (Gains) losses on disposition of assets (6) (37) (9) (8) (1,966) ($1,967) Net loss on extinguishment of debt 152 1 1 1 4 $4 Unrealized gain on certain derivatives (41) 2 32 23 4 $13 Tax settlements (22) - - - (57) ($57) Other (10) 33 47 49 67 $65 Adjusted EBITDA attributable to Icahn Enterprises $1,018 $930 $837 $693 $1,496 $1,640 Year Ended December 31, Nine Months Ended September 30, (unaudited) (unaudited)

Adjusted EBITDA Reconciliation by Segment – Nine Months Ended September 30, 2017 ($Millions) 38 Investment Automotive Energy Metals Railcar Gaming Mining Food Packaging Real Estate Home Fashion Holding Company Consolidated Adjusted EBITDA: Net income (loss) $440 $569 $15 $4 $1,074 $90 $10 $8 $469 ($11) ($274) $2,394 Interest expense, net 134 120 81 - 37 8 4 10 (1) - 242 635 Income tax expense (benefit) - (537) (2) (3) 525 48 2 5 - - 72 110 Depreciation, depletion and amortization - 375 208 15 51 54 4 18 15 6 - 746 EBITDA before non-controlling interests $574 $527 $302 $16 $1,687 $200 $20 $41 $483 ($5) $40 $3,885 Impairment of assets - 12 - - 68 - - - 2 - - 82 Restructuring costs - 11 - - - - - 3 - - - 14 Non-service cost of U.S. based pension - 8 - - - - - 3 - - - 11 Major scheduled turnaround expense - - 40 - - - - - - - - 40 (Gains) losses on disposition of assets - (4) 2 - (1,511) 3 - - (456) - - (1,966) Net loss on extinguishment of debt - 4 - - - - - - - - - 4 Unrealized gain on certain derivatives - - 6 - - - - - - - - 6 Tax settlements - - - - - (61) - - - - - (61) Other - 71 (2) - 1 2 2 (2) (1) 1 (5) 67 Adjusted EBITDA before non-controlling interests $574 $629 $348 $16 $245 $144 $22 $45 $28 ($4) $35 $2,082 Adjusted EBITDA attributable to IEP: Net income (loss) $212 $561 $22 $4 $1,063 $72 $8 $6 $469 ($11) ($274) $2,132 Interest expense, net 44 120 33 - 31 6 3 7 (1) - 242 485 Income tax expense (benefit) - (537) 4 (3) 518 38 1 4 - - 72 97 Depreciation, depletion and amortization - 375 99 15 35 41 2 13 15 6 - 601 EBITDA attributable to Icahn Enterprises $256 $519 $158 $16 $1,647 $157 $14 $30 $483 ($5) $40 $3,315 Impairment of assets - 12 - - 68 - - - 2 - - 82 Restructuring costs - 11 - - - - - 2 - - - 13 Non-service cost of U.S. based pension - 8 - - - - - 2 - - - 10 Major scheduled turnaround expense - - 24 - - - - - - - - 24 (Gains) losses on disposition of assets - (4) 2 - (1,511) 3 - - (456) - - (1,966) Net loss on extinguishment of debt - 4 - - - - - - - - - 4 Unrealized gain on certain derivatives - - 4 - - - - - - - - 4 Tax settlements - - - - - (57) - - - - - (57) Other - 71 (3) - 1 2 2 (1) (1) 1 (5) 67 Adjusted EBITDA attributable to Icahn Enterprises $256 $621 $185 $16 $205 $105 $16 $33 $28 ($4) $35 $1,496
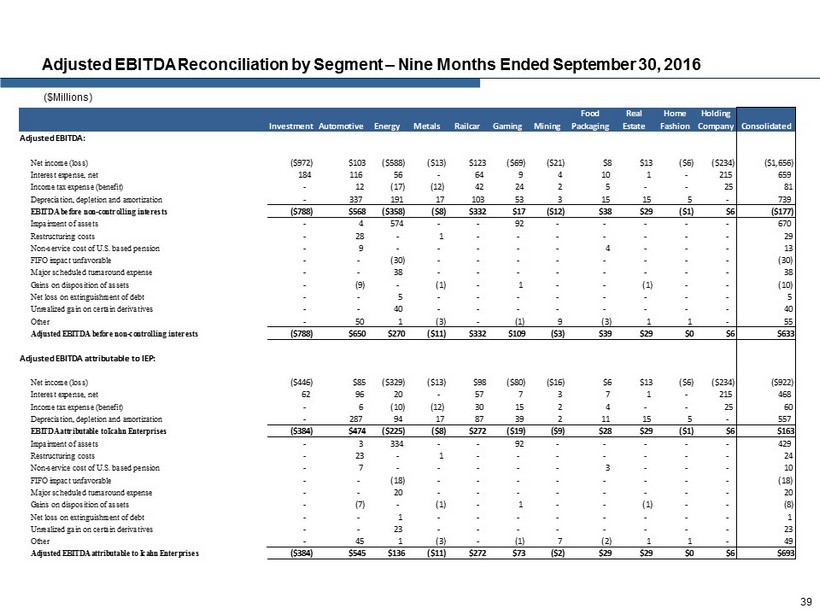
Adjusted EBITDA Reconciliation by Segment – Nine Months Ended September 30, 2016 ($Millions) 39 Investment Automotive Energy Metals Railcar Gaming Mining Food Packaging Real Estate Home Fashion Holding Company Consolidated Adjusted EBITDA: Net income (loss) ($972) $103 ($588) ($13) $123 ($69) ($21) $8 $13 ($6) ($234) ($1,656) Interest expense, net 184 116 56 - 64 9 4 10 1 - 215 659 Income tax expense (benefit) - 12 (17) (12) 42 24 2 5 - - 25 81 Depreciation, depletion and amortization - 337 191 17 103 53 3 15 15 5 - 739 EBITDA before non-controlling interests ($788) $568 ($358) ($8) $332 $17 ($12) $38 $29 ($1) $6 ($177) Impairment of assets - 4 574 - - 92 - - - - - 670 Restructuring costs - 28 - 1 - - - - - - - 29 Non-service cost of U.S. based pension - 9 - - - - - 4 - - - 13 FIFO impact unfavorable - - (30) - - - - - - - - (30) Major scheduled turnaround expense - - 38 - - - - - - - - 38 Gains on disposition of assets - (9) - (1) - 1 - - (1) - - (10) Net loss on extinguishment of debt - - 5 - - - - - - - - 5 Unrealized gain on certain derivatives - - 40 - - - - - - - - 40 Other - 50 1 (3) - (1) 9 (3) 1 1 - 55 Adjusted EBITDA before non-controlling interests ($788) $650 $270 ($11) $332 $109 ($3) $39 $29 $0 $6 $633 Adjusted EBITDA attributable to IEP: Net income (loss) ($446) $85 ($329) ($13) $98 ($80) ($16) $6 $13 ($6) ($234) ($922) Interest expense, net 62 96 20 - 57 7 3 7 1 - 215 468 Income tax expense (benefit) - 6 (10) (12) 30 15 2 4 - - 25 60 Depreciation, depletion and amortization - 287 94 17 87 39 2 11 15 5 - 557 EBITDA attributable to Icahn Enterprises ($384) $474 ($225) ($8) $272 ($19) ($9) $28 $29 ($1) $6 $163 Impairment of assets - 3 334 - - 92 - - - - - 429 Restructuring costs - 23 - 1 - - - - - - - 24 Non-service cost of U.S. based pension - 7 - - - - - 3 - - - 10 FIFO impact unfavorable - - (18) - - - - - - - - (18) Major scheduled turnaround expense - - 20 - - - - - - - - 20 Gains on disposition of assets - (7) - (1) - 1 - - (1) - - (8) Net loss on extinguishment of debt - - 1 - - - - - - - - 1 Unrealized gain on certain derivatives - - 23 - - - - - - - - 23 Other - 45 1 (3) - (1) 7 (2) 1 1 - 49 Adjusted EBITDA attributable to Icahn Enterprises ($384) $545 $136 ($11) $272 $73 ($2) $29 $29 $0 $6 $693

Adjusted EBITDA Reconciliation by Segment – Last Twelve Months Ended September 30, 2017 ($Millions) 40 Investment Automotive Energy Metals Railcar Gaming Mining Food Packaging Real Estate Home Fashion Holding Company Consolidated Adjusted EBITDA: Net income (loss) ($75) $543 ($1) ($3) $1,134 $64 $7 $8 $468 ($17) ($298) $1,830 Interest expense, net 180 157 107 - 56 11 5 12 - - 315 843 Income tax expense (benefit) - (509) (30) (7) 540 48 2 8 - - 13 65 Depreciation, depletion and amortization - 511 275 20 82 72 4 23 22 9 - 1,018 EBITDA before non-controlling interests $105 $702 $351 $10 $1,812 $195 $18 $51 $490 ($8) $30 $3,756 Impairment of assets - 26 - 1 68 14 - - 7 2 3 121 Restructuring costs - 10 - 1 - - - 6 - - - 17 Non-service cost of U.S. based pension - 12 - - - - - 4 - - - 16 FIFO impact unfavorable - - (22) - - - - - - - - (22) Certain share-based compensation expense - - - - 1 - - - - - - 1 Major scheduled turnaround expense - - 40 - - - - - - - - 40 (Gains) losses on disposition of assets - (4) 2 - (1,511) 3 - - (456) (1) - (1,967) Net loss on extinguishment of debt - 4 - - - - - - - - - 4 Unrealized gain on certain derivatives - - 22 - - - - - - - - 22 Tax settlements - - - - - (61) - - - - - (61) Other - 63 (2) - 1 2 9 - (1) 2 (5) 69 Adjusted EBITDA before non-controlling interests $105 $813 $391 $12 $371 $153 $27 $61 $40 ($5) $28 $1,996 Adjusted EBITDA attributable to IEP: Net income (loss) $54 $529 $24 ($3) $1,115 $43 $5 $6 $468 ($17) ($298) $1,926 Interest expense, net 58 151 44 - 48 8 4 9 - - 315 637 Income tax expense (benefit) - (513) (18) (7) 529 38 1 6 - - 13 49 Depreciation, depletion and amortization - 494 132 20 61 54 2 16 22 9 - 810 EBITDA attributable to Icahn Enterprises $112 $661 $182 $10 $1,753 $143 $12 $37 $490 ($8) $30 $3,422 Impairment of assets - 24 - 1 68 14 - - 7 2 3 119 Restructuring costs - 10 - 1 - - - 4 - - - 15 Non-service cost of U.S. based pension - 11 - - - - - 3 - - - 14 FIFO impact unfavorable - - (13) - - - - - - - - (13) OPEB curtailment gains - - - - - - - - - - - - Certain share-based compensation expense - - - - 1 - - - - - - 1 Major scheduled turnaround expense - - 24 - - - - - - - - 24 (Gains) losses on disposition of assets - (4) 2 - (1,511) 3 - - (456) (1) - (1,967) Net loss on extinguishment of debt - 4 - - - - - - - - - 4 Unrealized gain on certain derivatives - - 13 - - - - - - - - 13 Tax settlements - - - - - (57) - - - - - (57) Other - 62 (3) - 1 2 7 - (1) 2 (5) 65 Adjusted EBITDA attributable to Icahn Enterprises $112 $768 $205 $12 $312 $105 $19 $44 $40 ($5) $28 $1,640

Adjusted EBITDA Reconciliation by Segment – Year Ended December 31, 2016 ($Millions) 41 Investment Automotive Energy Metals Railcar Gaming Mining Food Packaging Real Estate Home Fashion Holding Company Consolidated Adjusted EBITDA: Net income (loss) ($1,487) $77 ($604) ($20) $183 ($95) ($24) $8 $12 ($12) ($258) ($2,220) Interest expense, net 230 153 82 - 83 12 5 12 2 - 288 867 Income tax expense (benefit) - 40 (45) (16) 57 24 2 8 - - (34) 36 Depreciation, depletion and amortization - 473 258 22 134 71 3 20 22 8 - 1,011 EBITDA before non-controlling interests ($1,257) $743 ($309) ($14) $457 $12 ($14) $48 $36 ($4) ($4) ($306) Impairment of assets - 18 574 1 - 106 - - 5 2 3 709 Restructuring costs - 27 - 2 - - - 3 - - - 32 Non-service cost of U.S. based pension - 13 - - - - - 5 - - - 18 FIFO impact unfavorable - - (52) - - - - - - - - (52) Certain share-based compensation expense - - - - 1 - - - - - - 1 Major scheduled turnaround expense - - 38 - - - - - - - - 38 (Gains) losses on disposition of assets - (9) - (1) - 1 - - (1) (1) - (11) Net loss on extinguishment of debt - - 5 - - - - - - - - 5 Unrealized gain on certain derivatives - - 56 - - - - - - - - 56 Other - 42 1 (3) - (1) 16 (1) 1 2 - 57 Adjusted EBITDA before non-controlling interests ($1,257) $834 $313 ($15) $458 $118 $2 $55 $41 ($1) ($1) $547 Adjusted EBITDA attributable to IEP: Net income (loss) ($604) $53 ($327) ($20) $150 ($109) ($19) $6 $12 ($12) ($258) ($1,128) Interest expense, net 76 127 31 - 74 9 4 9 2 - 288 620 Income tax expense (benefit) - 30 (32) (16) 41 15 2 6 - - (34) 12 Depreciation, depletion and amortization - 406 127 22 113 52 2 14 22 8 - 766 EBITDA attributable to Icahn Enterprises ($528) $616 ($201) ($14) $378 ($33) ($11) $35 $36 ($4) ($4) $270 Impairment of assets - 15 334 1 - 106 - - 5 2 3 466 Restructuring costs - 22 - 2 - - - 2 - - - 26 Non-service cost of U.S. based pension - 10 - - - - - 4 - - - 14 FIFO impact unfavorable - - (31) - - - - - - - - (31) Certain share-based compensation expense - - - - 1 - - - - - - 1 Major scheduled turnaround expense - - 20 - - - - - - - - 20 (Gains) losses on disposition of assets - (7) - (1) - 1 - - (1) (1) - (9) Net loss on extinguishment of debt - - 1 - - - - - - - - 1 Unrealized gain on certain derivatives - - 32 - - - - - - - - 32 Other - 36 1 (3) - (1) 12 (1) 1 2 - 47 Adjusted EBITDA attributable to Icahn Enterprises ($528) $692 $156 ($15) $379 $73 $1 $40 $41 ($1) ($1) $837
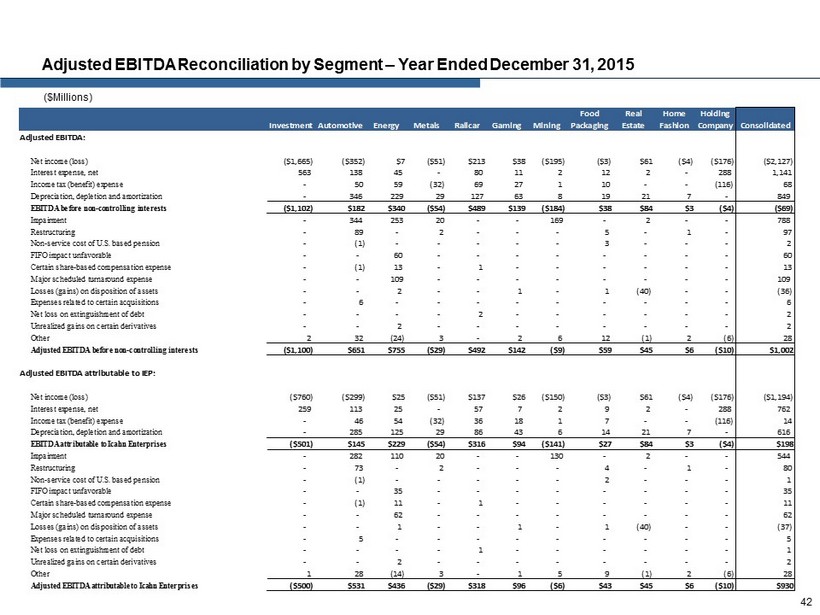
Adjusted EBITDA Reconciliation by Segment – Year Ended December 31, 2015 ($Millions) 42 Investment Automotive Energy Metals Railcar Gaming Mining Food Packaging Real Estate Home Fashion Holding Company Consolidated Adjusted EBITDA: Net income (loss) ($1,665) ($352) $7 ($51) $213 $38 ($195) ($3) $61 ($4) ($176) ($2,127) Interest expense, net 563 138 45 - 80 11 2 12 2 - 288 1,141 Income tax (benefit) expense - 50 59 (32) 69 27 1 10 - - (116) 68 Depreciation, depletion and amortization - 346 229 29 127 63 8 19 21 7 - 849 EBITDA before non-controlling interests ($1,102) $182 $340 ($54) $489 $139 ($184) $38 $84 $3 ($4) ($69) Impairment - 344 253 20 - - 169 - 2 - - 788 Restructuring - 89 - 2 - - - 5 - 1 - 97 Non-service cost of U.S. based pension - (1) - - - - - 3 - - - 2 FIFO impact unfavorable - - 60 - - - - - - - - 60 Certain share-based compensation expense - (1) 13 - 1 - - - - - - 13 Major scheduled turnaround expense - - 109 - - - - - - - - 109 Losses (gains) on disposition of assets - - 2 - - 1 - 1 (40) - - (36) Expenses related to certain acquisitions - 6 - - - - - - - - - 6 Net loss on extinguishment of debt - - - - 2 - - - - - - 2 Unrealized gains on certain derivatives - - 2 - - - - - - - - 2 Other 2 32 (24) 3 - 2 6 12 (1) 2 (6) 28 Adjusted EBITDA before non-controlling interests ($1,100) $651 $755 ($29) $492 $142 ($9) $59 $45 $6 ($10) $1,002 Adjusted EBITDA attributable to IEP: Net income (loss) ($760) ($299) $25 ($51) $137 $26 ($150) ($3) $61 ($4) ($176) ($1,194) Interest expense, net 259 113 25 - 57 7 2 9 2 - 288 762 Income tax (benefit) expense - 46 54 (32) 36 18 1 7 - - (116) 14 Depreciation, depletion and amortization - 285 125 29 86 43 6 14 21 7 - 616 EBITDA attributable to Icahn Enterprises ($501) $145 $229 ($54) $316 $94 ($141) $27 $84 $3 ($4) $198 Impairment - 282 110 20 - - 130 - 2 - - 544 Restructuring - 73 - 2 - - - 4 - 1 - 80 Non-service cost of U.S. based pension - (1) - - - - - 2 - - - 1 FIFO impact unfavorable - - 35 - - - - - - - - 35 Certain share-based compensation expense - (1) 11 - 1 - - - - - - 11 Major scheduled turnaround expense - - 62 - - - - - - - - 62 Losses (gains) on disposition of assets - - 1 - - 1 - 1 (40) - - (37) Expenses related to certain acquisitions - 5 - - - - - - - - - 5 Net loss on extinguishment of debt - - - - 1 - - - - - - 1 Unrealized gains on certain derivatives - - 2 - - - - - - - - 2 Other 1 28 (14) 3 - 1 5 9 (1) 2 (6) 28 Adjusted EBITDA attributable to Icahn Enterprises ($500) $531 $436 ($29) $318 $96 ($6) $43 $45 $6 ($10) $930

Adjusted EBITDA Reconciliation by Segment – Year Ended December 31, 2014 ($Millions) 43 Investment Automotive Energy Metals Railcar Gaming Food Packaging Real Estate Home Fashion Holding Company Consolidated Adjusted EBITDA: Net income (loss) ($684) ($90) $168 ($25) $188 $269 $9 $22 $2 ($388) ($529) Interest expense, net 299 123 35 - 57 11 14 3 - 290 832 Income tax (benefit) expense - 91 73 (18) 56 (147) 3 - - (161) (103) Depreciation, depletion and amortization - 335 219 26 106 50 22 22 7 - 787 EBITDA before non-controlling interests ($385) $459 $495 ($17) $407 $183 $48 $47 $9 ($259) $987 Impairment - 24 103 3 - - - 5 - - 135 Restructuring - 86 - - - - - - (2) - 84 Non-service cost of U.S. based pension - (6) - - - - (1) - - - (7) FIFO impact unfavorable - - 161 - - - - - - - 161 Certain share-based compensation expense - (4) 13 - 3 - - - - - 12 Major scheduled turnaround expense - - 7 - - - - - - - 7 (Gains) losses on disposal of assets - - - - - 1 - (4) (3) - (6) Net loss on extinguishment of debt - 36 - - 2 - 16 - - 108 162 Unrealized loss on certain derivatives - - (63) - - - - - - - (63) Tax settlements - - - - - (32) - - - - (32) Other - 35 - (1) 3 (53) 3 (2) 1 (4) (18) Adjusted EBITDA before non-controlling interests ($385) $630 $716 ($15) $415 $99 $66 $46 $5 ($155) $1,422 Adjusted EBITDA attributable to IEP: Net income (loss) ($305) ($87) $95 ($25) $122 $185 $6 $22 $2 ($388) ($373) Interest expense, net 143 99 20 - 42 7 10 3 - 290 614 Income tax (benefit) expense - 80 64 (18) 26 (102) 2 - - (161) (109) Depreciation, depletion and amortization - 270 124 26 74 34 16 22 7 - 573 EBITDA attributable to Icahn Enterprises ($162) $362 $303 ($17) $264 $124 $34 $47 $9 ($259) $705 Impairment - 19 45 3 - - 5 - - 72 Restructuring - 69 - - - - - - (2) - 67 Non-service cost of U.S. based pension - (5) - - - - (1) - - - (6) FIFO impact unfavorable - - 94 - - - - - - - 94 Certain share-based compensation expense - (3) 9 - 2 - - - - - 8 Major scheduled turnaround expense - - 5 - - - - - - - 5 (Gains) losses on disposal of assets - - - - - 1 - (4) (3) - (6) Net loss on extinguishment of debt - 31 - - 1 - 12 - - 108 152 Unrealized loss on certain derivatives - - (41) - - - - - - - (41) Tax settlements - - - - - (22) - - - - (22) Other - 29 - (1) 2 (37) 2 (2) 1 (4) (10) Adjusted EBITDA attributable to Icahn Enterprises ($162) $502 $415 ($15) $269 $66 $47 $46 $5 ($155) $1,018