Attached files
| file | filename |
|---|---|
| 8-K - 8-K - O-I Glass, Inc. /DE/ | a17-27639_18k.htm |
Safe harbor comments 2 Non-GAAP Financial Measures The Company uses certain non-GAAP financial measures, which are measures of its historical or future financial performance that are not calculated and presented in accordance with GAAP, within the meaning of applicable SEC rules. Management believes that its presentation and use of certain non-GAAP financial measures, including adjusted earnings, adjusted earnings per share, segment operating profit, segment operating profit margin and adjusted free cash flow, provide relevant and useful supplemental financial information, which is widely used by analysts and investors, as well as by management in assessing both consolidated and business unit performance. These non-GAAP measures are reconciled to the most directly comparable GAAP measures and should be considered supplemental in nature and should not be considered in isolation or be construed as being more important than comparable GAAP measures. Adjusted earnings relates to net earnings from continuing operations attributable to the Company, exclusive of items management considers not representative of ongoing operations because such items are not reflective of the Company’s principal business activity, which is glass container production. Adjusted earnings are divided by weighted average shares outstanding (diluted) to derive adjusted earnings per share. Segment operating profit relates to earnings from continuing operations before interest expense (net), provision for income taxes and is also exclusive of items management considers not representative of ongoing operations. Segment operating profit margin is segment operating profit divided by segment net sales. Management uses adjusted earnings, adjusted earnings per share, segment operating profit and segment operating profit margin to evaluate its period-over-period operating performance because it believes this provides a useful supplemental measure of the results of operations of its principal business activity by excluding items that are not reflective of such operations. Adjusted earnings, adjusted earnings per share, segment operating profit and segment operating profit margin may be useful to investors in evaluating the underlying operating performance of the Company’s business as these measures eliminate items that are not reflective of its principal business activity. Further, adjusted free cash flow relates to cash provided by continuing operating activities less additions to property, plant and equipment plus asbestos-related payments. Management uses adjusted free cash flow to evaluate its period-over-period cash generation performance because it believes this provides a useful supplemental measure related to its principal business activity. Adjusted free cash flow may be useful to investors to assist in understanding the comparability of cash flows generated by the Company’s principle business activity. Since a significant majority of the Company’s asbestos-related claims are expected to be received in the next ten years, adjusted free cash flow may help investors to evaluate the long-term cash generation ability of the Company’s principal business activity as these asbestos-related payments decline. It should not be inferred that the entire adjusted free cash flow amount is available for discretionary expenditures, since the Company has mandatory debt service requirements and other non-discretionary expenditures that are not deducted from the measure. Management uses non-GAAP information principally for internal reporting, forecasting, budgeting and calculating compensation payments.
Forward-Looking Statements This document contains "forward-looking" statements within the meaning of Section 21E of the Securities Exchange Act of 1934, as amended (the “Exchange Act”) and Section 27A of the Securities Act of 1933. Forward-looking statements reflect the Company's current expectations and projections about future events at the time, and thus involve uncertainty and risk. The words “believe,” “expect,” “anticipate,” “will,” “could,” “would,” “should,” “may,” “plan,” “estimate,” “intend,” “predict,” “potential,” “continue,” and the negatives of these words and other similar expressions generally identify forward-looking statements. It is possible the Company's future financial performance may differ from expectations due to a variety of factors including, but not limited to the following: (1) the Company’s ability to realize expected growth opportunities, cost savings and synergies from the Vitro Acquisition, (2) foreign currency fluctuations relative to the U.S. dollar, (3) changes in capital availability or cost, including interest rate fluctuations and the ability of the Company to refinance debt at favorable terms, (4) the general political, economic and competitive conditions in markets and countries where the Company has operations, including uncertainties related to economic and social conditions, disruptions in capital markets, disruptions in the supply chain, competitive pricing pressures, inflation or deflation, and changes in tax rates and laws, (5) the Company’s ability to generate sufficient future cash flows to ensure the Company’s goodwill is not impaired, (6) consumer preferences for alternative forms of packaging, (7) cost and availability of raw materials, labor, energy and transportation, (8) the Company’s ability to manage its cost structure, including its success in implementing restructuring plans and achieving cost savings, (9) consolidation among competitors and customers, (10) the Company’s ability to acquire businesses and expand plants, integrate operations of acquired businesses and achieve expected synergies, (11) unanticipated expenditures with respect to environmental, safety and health laws, (12) the Company’s ability to further develop its sales, marketing and product development capabilities, (13) the Company’s ability to prevent and detect cybersecurity threats against its information technology systems, (14) the Company’s ability to accurately estimate its total asbestos-related liability or to control the timing and occurrence of events relates to asbestos-related claims, (15) changes in U.S. trade policies, (16) the Company’s ability to achieve its strategic plan, and the other risk factors associated with the business described in the Company’s annual report on Form 10-K, quarterly reports on Form 10-Q and current reports on Form 8-K filed with the SEC. It is not possible to foresee or identify all such factors. Any forward-looking statements in this document are based on certain assumptions and analyses made by the Company in light of its experience and perception of historical trends, current conditions, expected future developments, and other factors it believes are appropriate in the circumstances. Forward-looking statements are not a guarantee of future performance and actual results or developments may differ materially from expectations. While the Company continually reviews trends and uncertainties affecting the Company's results of operations and financial condition, the Company does not assume any obligation to update or supplement any particular forward-looking statements contained in this document. The Company routinely posts important information on its website – www.o-i.com/investors. Safe harbor comments - continued 3
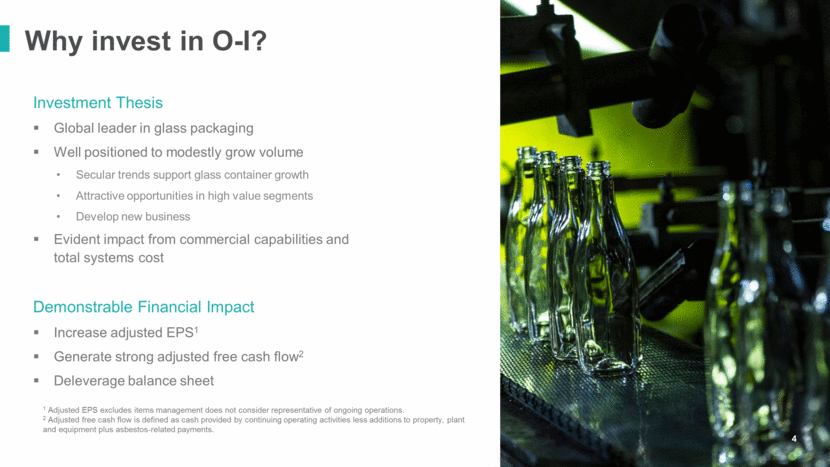
Why invest in O-I? 4 Investment Thesis Global leader in glass packaging Well positioned to modestly grow volume Secular trends support glass container growth Attractive opportunities in high value segments Develop new business Evident impact from commercial capabilities and total systems cost Demonstrable Financial Impact Increase adjusted EPS1 Generate strong adjusted free cash flow2 Deleverage balance sheet 1 Adjusted EPS excludes items management does not consider representative of ongoing operations. 2 Adjusted free cash flow is defined as cash provided by continuing operating activities less additions to property, plant and equipment plus asbestos-related payments.
2017 financial expectations on track with guidance 5 1 See reconciliation tables in the appendix of this presentation. 2 Segment operating profit is defined as consolidated earnings before interest income, interest expense, and provision for income taxes and excludes amounts related to certain items that management considers not representative of ongoing operations as well as certain retained corporate costs. Segment operating profit margin is defined as segment operating profit divided by segment net sales. 4Q17 adjusted EPS1 expected to be $0.50-$0.55 Margin pressure driven by Asia Pacific investments 2017 targets in line with (or better than) Investor Day targets Strong financial performance in 2017 2017 guidance Current expectation Adjusted EPS1 $2.60-$2.65 Adjusted free cash flow1 ~$365M Debt reduction (FX neutral) ~$225M Impact of strategic initiatives $35M-$45M Organic volume growth ~1% Segment operating profit margin2 expansion ~80 bps Temporary modest pressure
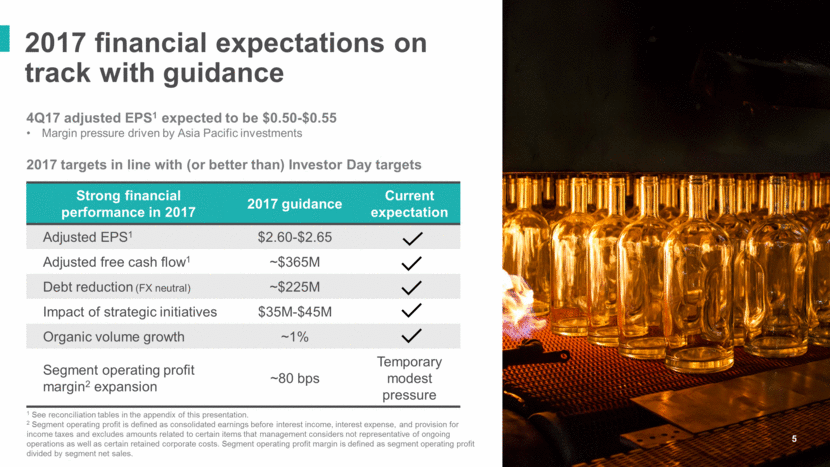
Integrated Americas team 6 Optimization Better serve the market by leveraging the Americas footprint Integrate business planning across region Optimize end-to-end supply chain and commercial activities Americas segment reporting begins 1Q18 Strategic Joint Venture with Constellation Extending JV agreement by 10 years, to 2034 Increasing exposure to the fastest growing beer segment in the U.S. Adding fifth furnace to meet overall rising demand Higher JV production partially offset by lower U.S. sales to CBI JV expected to issue dividends in 2018, as planned
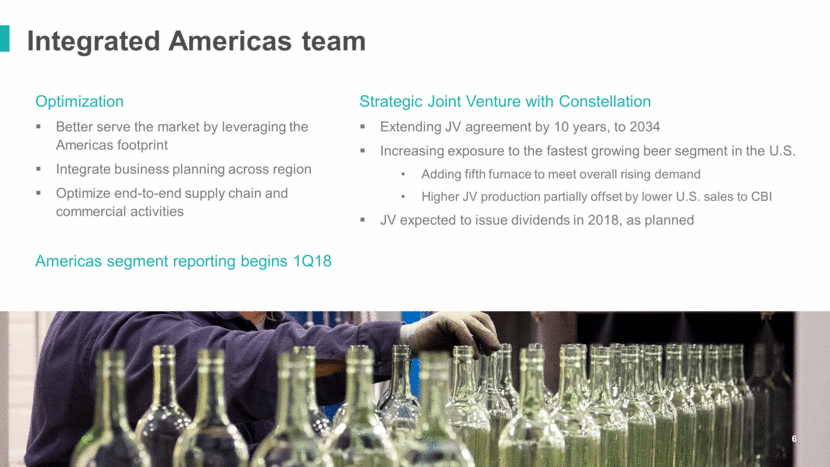
Higher segment operating profit & margin expected in 2018 7 AMERICAS EUROPE Trends Non-beer segments continue to grow Ongoing U.S. mainstream beer trends; strong performance in imports Strong demand in Mexico Further recovery in Brazil Trends Supply/demand dynamics essentially unchanged Constructive pricing environment for annual contracts ASIA PACIFIC Trends Modest demand growth in AU and NZ Stronger growth trends in Southeast Asia ENTERPRISE 2018 Expectations Annual sales volume growth ~1% Price-cost spread neutral Continued gains from Total Systems Cost Some offset from asset improvements in Asia Pacific Segment operating profit margin expansion >40 bps, higher than Investor Day expectations
2018 non-operational outlook 8 Corporate expense expected to be higher than 2017 Higher level of investments to drive sustainable value Layering in additional end-to-end supply chain capabilities Continuing support for successful R&D platforms Pension expense expected to be modestly higher than 2017 Net interest expense projected to be modestly lower than 2017 Deleveraging offsets projected variable interest rate hikes Tax rate expected to be in the range of 23-25%
9 Higher Adjusted EPS expected in 2018 Improved business performance adds >40 bps margin growth Global sales volume up ~1% vs. 2017 Total Systems Cost benefits Incremental benefit of ~$12M from closure of plant in Europe Modestly favorable interest expense Price offsets inflation Incremental asset improvements in Asia Pacific Investments drive higher corporate expense Higher effective tax rate Tailwinds Headwinds
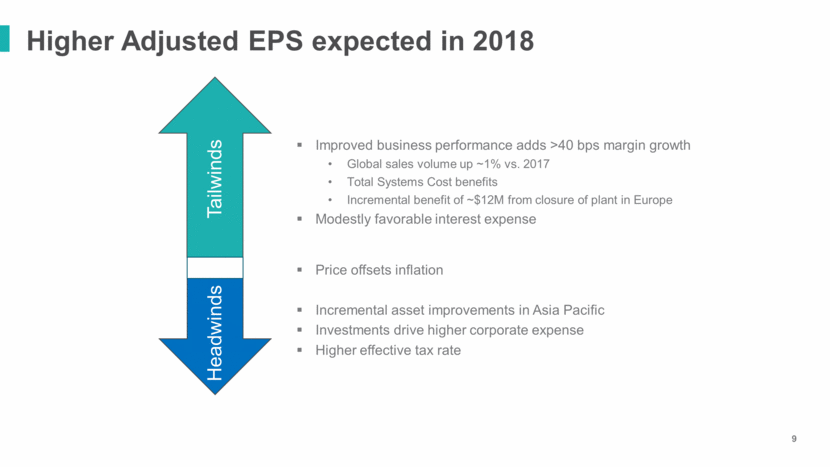
2018 Adjusted FCF outlook 10 Growth in segment operating profit Continued contribution from working capital, mainly inventory Capital expenditures of ~$500M Lower restructuring payments than in 2017 $0 $100 $200 $300 $400 $500 $600 $700 $800 $900 2015 2016 2017f 2018e $ Millions CASH FROM CONTINUING OPERATIONS ADJUSTED FREE CASH FLOW
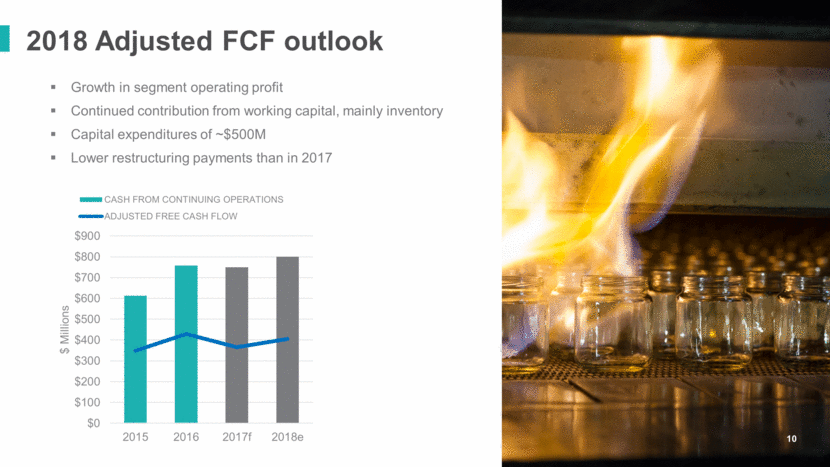
Pension: On-going risk mitigation 11 Reduced pension liabilities by $500 million already in 4Q17 through annuity purchases De-risking efforts reducing our sensitivity to changes in discount rates 50 bps change in discount rate leads to ~$7M pre-tax impact, compared with ~$20M in 2012 1 Related to the “amortization of actuarial loss” component of pension expense, which is included in GAAP EPS and adjusted EPS. 2018 Pension Outlook Expense expected to be modestly higher than 2017 Contributions expected to be similar to 2017 PENSION ACCOUNTING IMPACT ON ANNUAL ADJUSTED EPS Sustained non cash pension expense reduces EPS by ~ $0.401 $0.00 $0.50 $1.00 $1.50 $2.00 $2.50 $3.00 2017 Adj EPS guidance at mid-point Adj EPS, excl. "amortization of actuarial loss" 0 20 40 60 2014 2015 2016 2017f 2018e $ Millions PENSION CONTRIBUTIONS 0 20 40 60 2014 2015 2016 2017f 2018e $ Millions PENSION EXPENSE
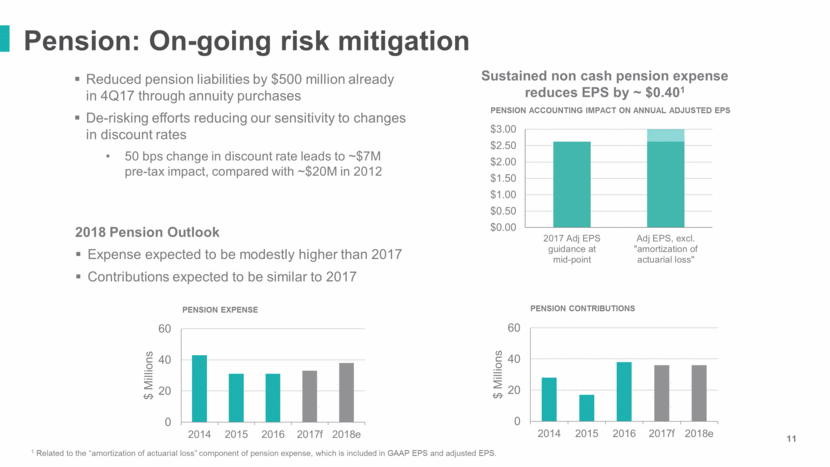
Continued favorable trends in asbestos 12 1 year ASBESTOS PAYMENTS TOTAL EXPECTED ASBESTOS-RELATED LIABILITY1 1 The Company’s ultimate asbestos-related liability cannot be estimated with certainty. As part of its future comprehensive annual reviews, the Company will estimate its total asbestos-related liability and such reviews may result in adjustments to the liability accrued at the time of the review. The 2017 forecasted asbestos-related liability is calculated as the Dec. 31, 2016 asbestos-related liability less the forecasted 2017 asbestos payments and does not include an adjustment for asbestos-related costs at this time. Annual comprehensive legal review yielded no change to liability in 2016; 2017 review is on-going Expecting ~$10-15M reduction in annual asbestos payments Payments in 2016 were 40% lower than 2008 Average age of claimant is >80 years old and continues to increase each year
13 Capital structure Deleveraging: continues to be key priority Improved debt profile No Senior Notes due until 2020 Higher proportion of non-USD debt as natural hedge to foreign currency Improving leverage ratio ~3 times net debt to EBITDA by end of 2018
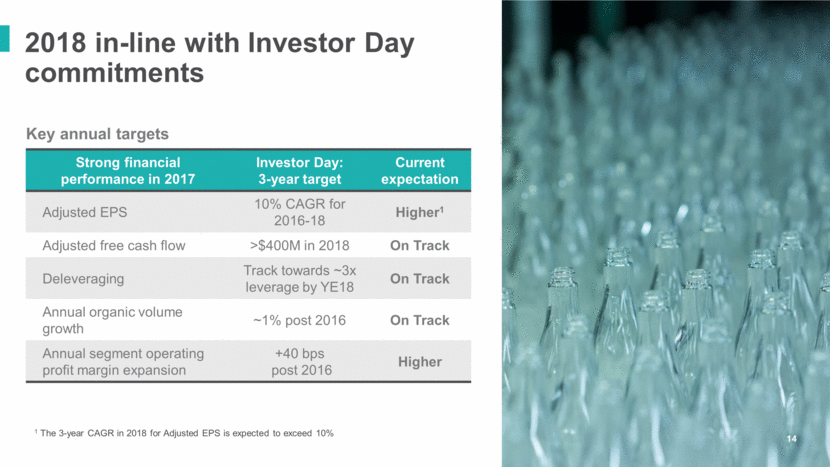
2018 in-line with Investor Day commitments 14 Key annual targets Strong financial performance in 2017 Investor Day: 3-year target Current expectation Adjusted EPS 10% CAGR for 2016-18 Higher1 Adjusted free cash flow >$400M in 2018 On Track Deleveraging Track towards ~3x leverage by YE18 On Track Annual organic volume growth ~1% post 2016 On Track Annual segment operating profit margin expansion +40 bps post 2016 Higher 1 The 3-year CAGR in 2018 for Adjusted EPS is expected to exceed 10%
15 Appendix

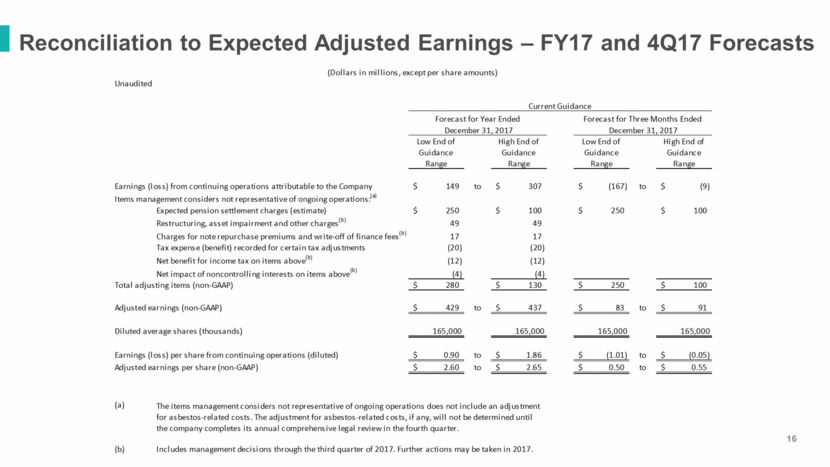
Reconciliation to Expected Adjusted Earnings – FY17 and 4Q17 Forecasts 16
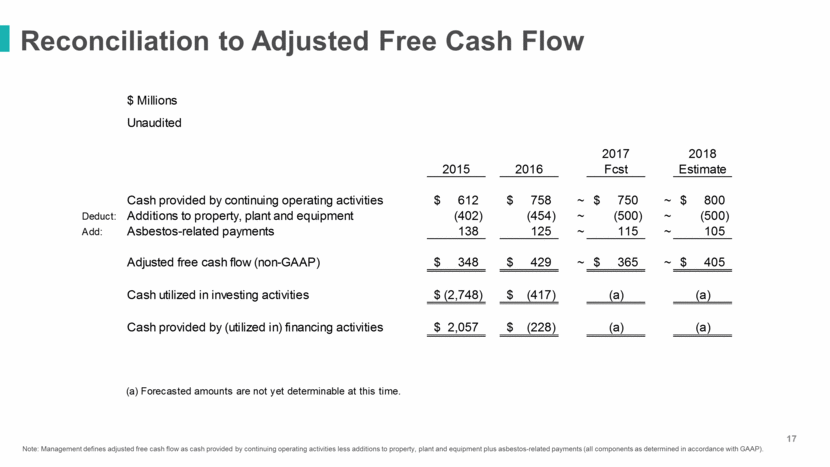
Reconciliation to Adjusted Free Cash Flow 17 Note: Management defines adjusted free cash flow as cash provided by continuing operating activities less additions to property, plant and equipment plus asbestos-related payments (all components as determined in accordance with GAAP). $ Millions Unaudited 2017 2018 2015 2016 Fcst Estimate Cash provided by continuing operating activities $ 612 $ 758 ~ $ 750 ~ $ 800 Deduct: Additions to property, plant and equipment (402) (454) ~ (500) ~ (500) Add: Asbestos-related payments 138 125 ~ 115 ~ 105 Adjusted free cash flow (non-GAAP) $ 348 $ 429 ~ $ 365 ~ $ 405 Cash utilized in investing activities $ (2,748) $ (417) (a) (a) Cash provided by (utilized in) financing activities $ 2,057 $ (228) (a) (a) (a) Forecasted amounts are not yet determinable at this time.
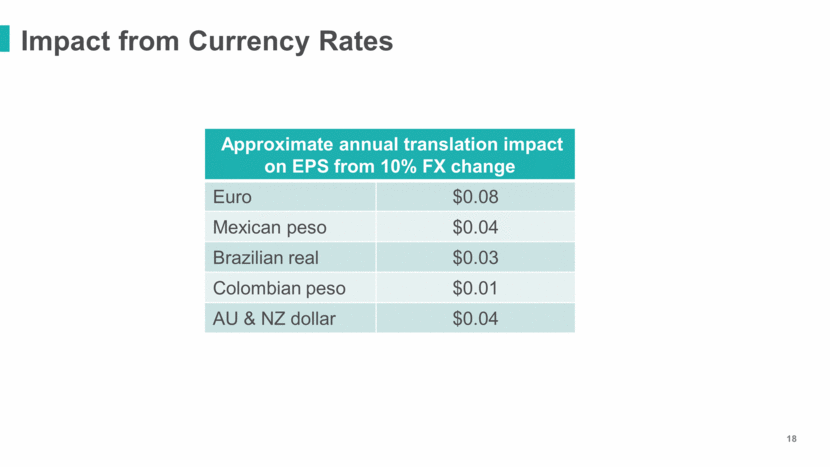
Impact from Currency Rates 18 Approximate annual translation impact on EPS from 10% FX change Euro $0.08 Mexican peso $0.04 Brazilian real $0.03 Colombian peso $0.01 AU & NZ dollar $0.04
