Attached files
| file | filename |
|---|---|
| 8-K - 8-K - Wesco Aircraft Holdings, Inc | wair-9302017x8kcover.htm |
| EX-99.1 - EXHIBIT 99.1 - Wesco Aircraft Holdings, Inc | wair-9302017xex991.htm |
Q4 2017 EARNINGS CALL PRESENTATION
November 28, 2017
Todd Renehan
Chief Executive Officer
Kerry Shiba
Executive Vice President and Chief Financial Officer
Information in this presentation should be read in conjunction
with Wesco Aircraft’s earnings press release and tables for the
fiscal 2017 fourth quarter.
Wesco Aircraft Proprietary
Visit www.wescoair.com
Disclaimer
2
Wesco Aircraft – Investor Relations
This presentation contains forward-looking statements (including within the meaning of the Private Securities Litigation Reform Act of 1995) concerning Wesco Aircraft Holdings, Inc. (“Wesco Aircraft “ or the “Company”). These
statements may discuss goals, intentions and expectations as to future plans, trends, events, results of operations or financial condition, or otherwise, based on current beliefs of management, as well as assumptions made by,
and information currently available to, management. In some cases, you can identify forward-looking statements by the use of forward-looking terms such as “accelerate,” “achieve,” “address,” “anticipate,” “believe,”
“continue,” “could,” “develop,” “deliver,” “drive,” “expand,” “execute,” “expect,” “focus,” “future,” “grow,” “improve,” “increase,” “indicator,” “likely,” “opportunity,” “outlook,” “plan,” “reduce,” “should,” “target,” “to be,”
“trend,” “will” or similar words, phrases or expressions. These forward-looking statements are subject to various risks and uncertainties, many of which are outside the Company’s control. Therefore, you should not place undue
reliance on such statements.
Factors that could cause actual results to differ materially from these forward-looking statements include, but are not limited to, the following: general economic and industry conditions; conditions in the credit markets;
changes in military spending; risks unique to suppliers of equipment and services to the U.S. government; risks associated with the Company’s long-term, fixed-price agreements that have no guarantee of future sales volumes;
risks associated with the loss of significant customers, a material reduction in purchase orders by significant customers, or the delay, scaling back or elimination of significant programs on which the Company relies; the
Company’s ability to effectively compete in its industry; the Company’s ability to effectively manage its inventory; the Company’s suppliers’ ability to provide it with the products the Company sells in a timely manner, in
adequate quantities and/or at a reasonable cost; the Company’s ability to maintain effective information technology systems; the Company’s ability to retain key personnel; risks associated with the Company’s international
operations, including exposure to foreign currency movements; risks associated with assumptions the Company makes in connection with its critical accounting estimates (including goodwill, excess and obsolete inventory and
valuation allowance of the company’s deferred tax assets) and legal proceedings; changes in U.S. tax law; the Company’s dependence on third-party package delivery companies; fuel price risks; fluctuations in the Company’s
financial results from period-to-period; environmental risks; risks related to the handling, transportation and storage of chemical products; risks related to the aerospace industry and the regulation thereof; risks related to the
Company’s indebtedness; and other risks and uncertainties.
The foregoing list of factors is not exhaustive. You should carefully consider the foregoing factors and the other risks and uncertainties that affect the Company’s business, including those described in the Company’s Annual
Report on Form 10-K, Quarterly Reports on Form 10-Q, Current Reports on Form 8-K and other documents filed from time to time with the Securities and Exchange Commission. All forward-looking statements included in this
presentation (including information included or incorporated by reference herein) are based upon information available to the Company as of the date hereof, and the Company undertakes no obligation to update or revise
publicly any forward-looking statements, whether as a result of new information, future events or otherwise.
The Company utilizes and discusses Adjusted Income from Operations, Adjusted Operating Margin, Adjusted Net Income, Adjusted Basic Earnings Per Share (EPS), Adjusted Diluted EPS, Adjusted Earnings Before Interest, Taxes,
Depreciation and Amortization (EBITDA), Adjusted EBITDA Margin and Free Cash Flow, which are non-GAAP measures its management uses to evaluate its business, because the Company believes these measures assist
investors and analysts in comparing its performance across reporting periods on a consistent basis by excluding items that management does not believe are indicative of the Company’s core operating performance. The
Company believes these metrics are used in the financial community, and the Company presents these metrics to enhance understanding of its operating performance. You should not consider Adjusted EBITDA and Adjusted
Net Income as alternatives to Net (Loss) Income, determined in accordance with GAAP, and should not consider Adjusted Income from Operations as an alternative to (Loss) Income from Operations, determined in accordance
with GAAP, in each case as an indicator of operating performance. Adjusted Income from Operations, Adjusted Operating Margin, Adjusted Net Income, Adjusted Basic EPS, Adjusted Diluted EPS, Adjusted EBITDA, Adjusted
EBITDA Margin and Free Cash Flow are not measurements of financial performance under GAAP, and these metrics may not be comparable to similarly titled measures of other companies. See the Appendix for a reconciliation
of Adjusted Income from Operations, Adjusted Operating Margin, Adjusted Net Income, Adjusted Basic EPS, Adjusted Diluted EPS, Adjusted EBITDA and Adjusted EBITDA Margin to the most directly comparable financial
measures calculated and presented in accordance with GAAP.
Wesco Aircraft Proprietary
Visit www.wescoair.com
4Q17 and Fiscal 2017 Highlights
3
Wesco Aircraft – Investor Relations
Q4 net sales and gross profit lower, exacerbated by higher expenses – similar trends seen all year
Business stabilized from operational perspective – not yet reflected in financial results
Added more than $80 million in new business revenue, offset by volume declines and lost business
Continuing to win new business and renew long-term contracts
New business primary driver of expected modest FY18 growth; volume declines expected to moderate
High level of SG&A relative to sales not sustainable; taking corrective action
Progress made with improvement plan – positive trends, key leading indicators
Restructured debt covenants – provides substantial flexibility while actions begin to drive results
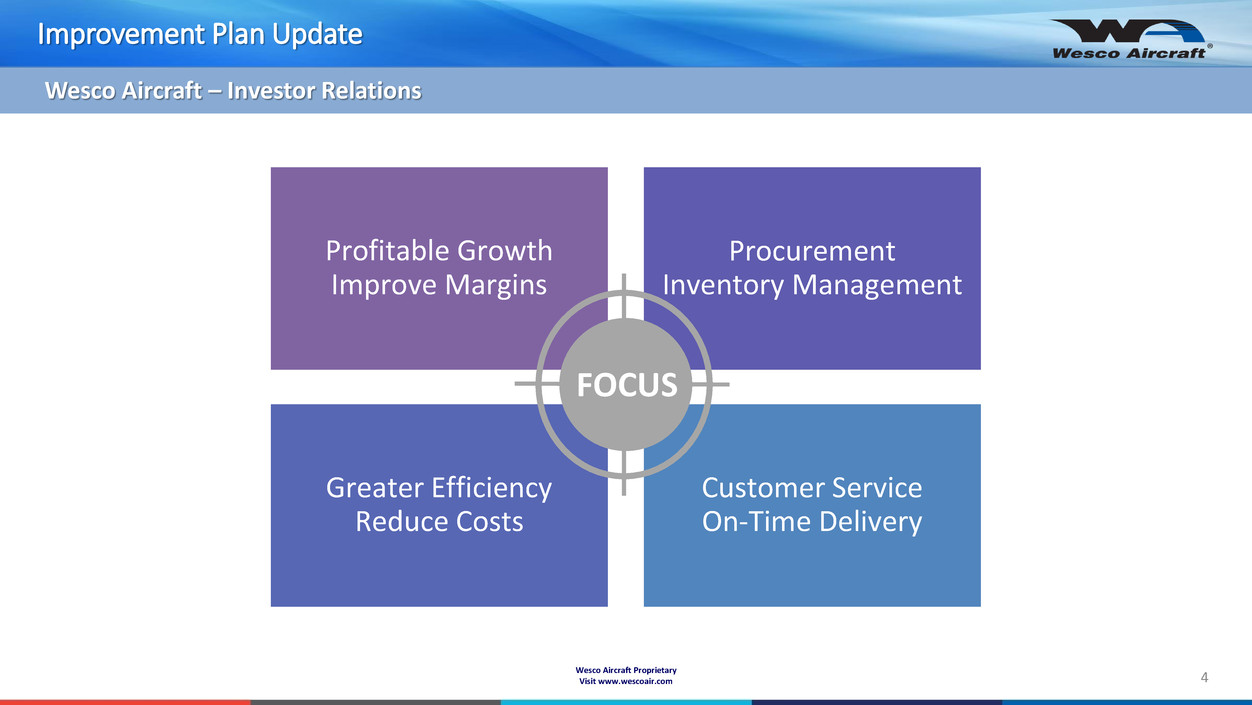
Procurement
Inventory Management
Greater Efficiency
Reduce Costs
Customer Service
On-Time Delivery
Profitable Growth
Improve Margins
FOCUS
Improvement Plan Update
4
Wesco Aircraft – Investor Relations
Wesco Aircraft Proprietary
Visit www.wescoair.com
Wesco Aircraft Proprietary
Visit www.wescoair.com
Improvement Plan Progress
5
Wesco Aircraft – Investor Relations
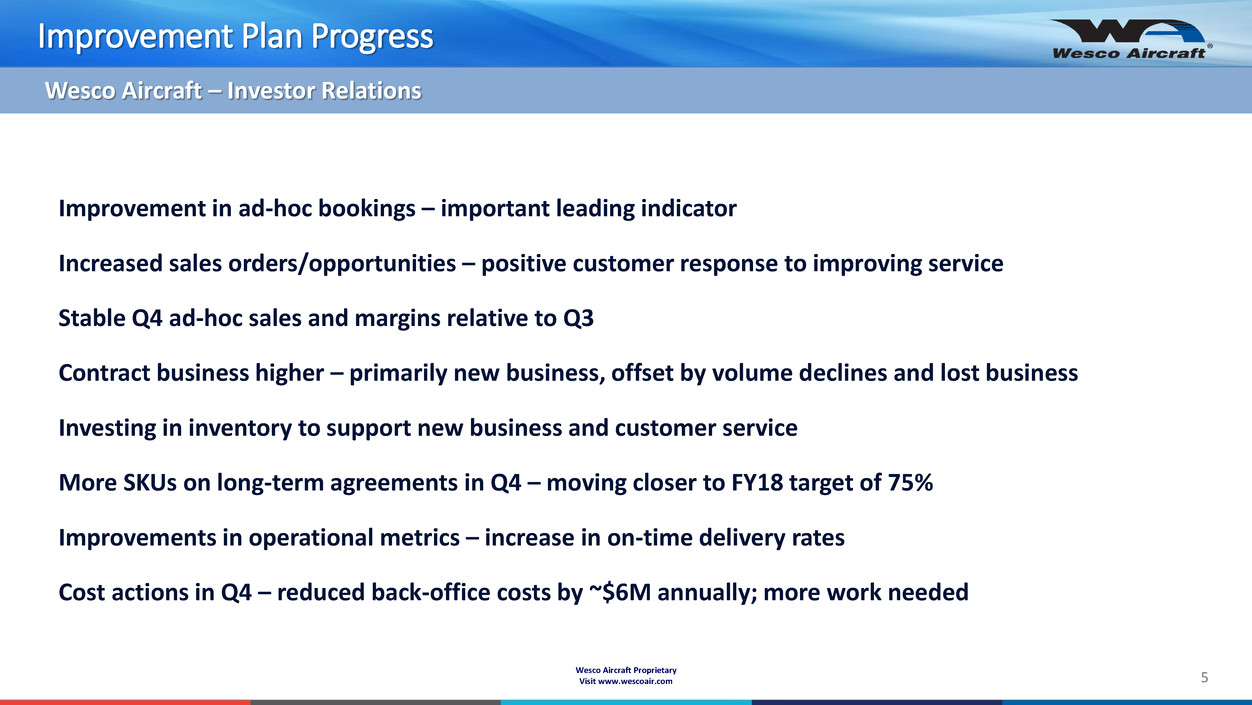
Improvement in ad-hoc bookings – important leading indicator
Increased sales orders/opportunities – positive customer response to improving service
Stable Q4 ad-hoc sales and margins relative to Q3
Contract business higher – primarily new business, offset by volume declines and lost business
Investing in inventory to support new business and customer service
More SKUs on long-term agreements in Q4 – moving closer to FY18 target of 75%
Improvements in operational metrics – increase in on-time delivery rates
Cost actions in Q4 – reduced back-office costs by ~$6M annually; more work needed
Wesco Aircraft Proprietary
Visit www.wescoair.com
Business Review
6
Wesco Aircraft – Investor Relations
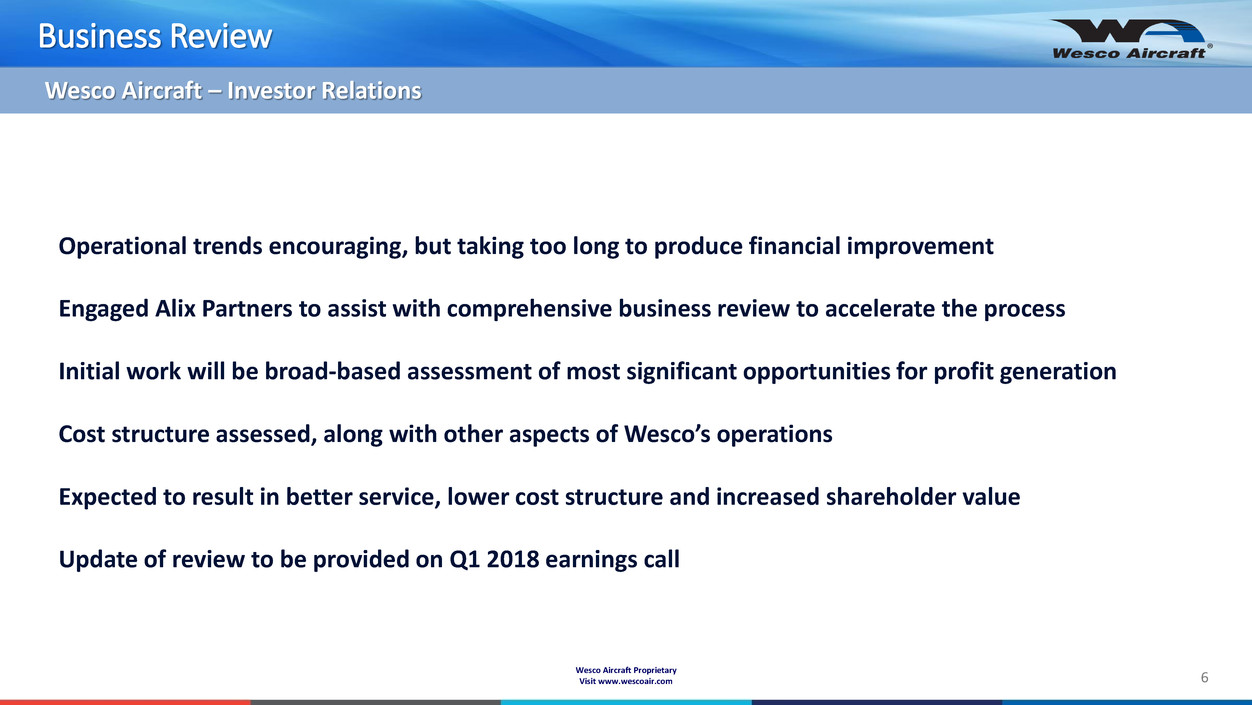
Operational trends encouraging, but taking too long to produce financial improvement
Engaged Alix Partners to assist with comprehensive business review to accelerate the process
Initial work will be broad-based assessment of most significant opportunities for profit generation
Cost structure assessed, along with other aspects of Wesco’s operations
Expected to result in better service, lower cost structure and increased shareholder value
Update of review to be provided on Q1 2018 earnings call
Wesco Aircraft Proprietary
Visit www.wescoair.com
4Q17 Net Sales Summary
7
Wesco Aircraft – Investor Relations
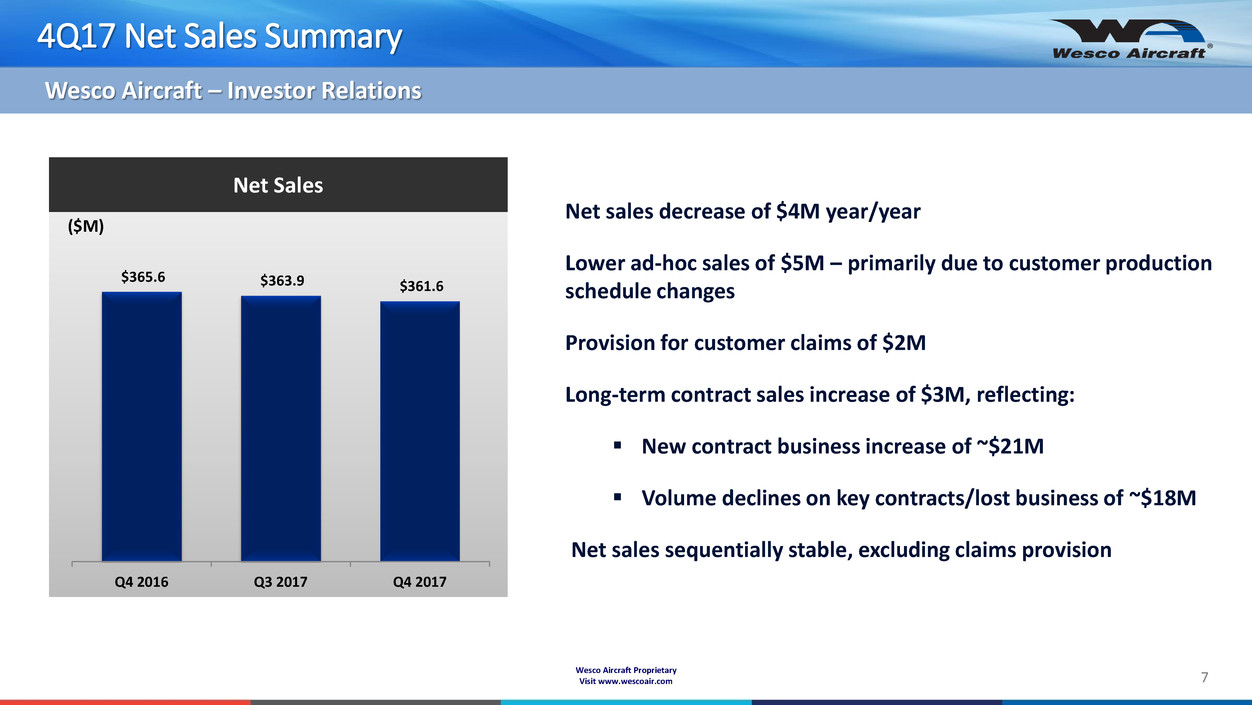
$365.6 $363.9 $361.6
Q4 2016 Q3 2017 Q4 2017
Net Sales
($M)
Net sales decrease of $4M year/year
Lower ad-hoc sales of $5M – primarily due to customer production
schedule changes
Provision for customer claims of $2M
Long-term contract sales increase of $3M, reflecting:
New contract business increase of ~$21M
Volume declines on key contracts/lost business of ~$18M
Net sales sequentially stable, excluding claims provision
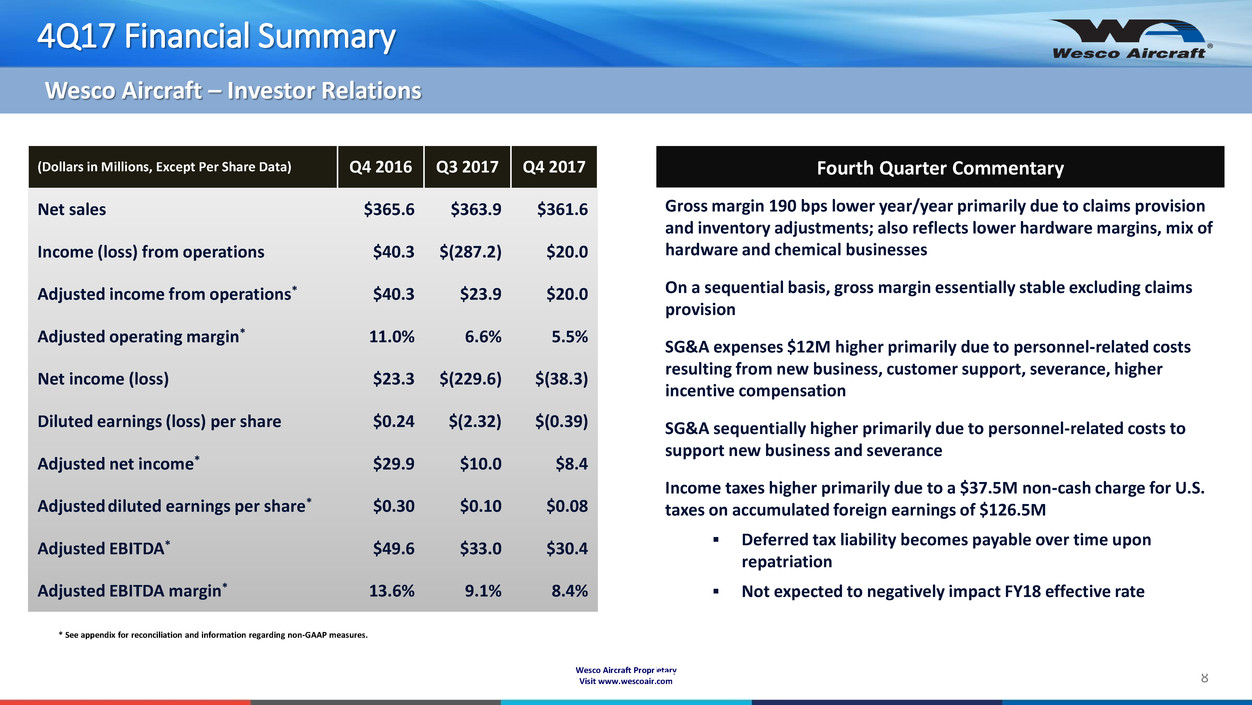
(Dollars in Millions, Except Per Share Data) Q4 2016 Q3 2017 Q4 2017
Net sales $365.6 $363.9 $361.6
Income (loss) from operations $40.3 $(287.2) $20.0
Adjusted income from operations* $40.3 $23.9 $20.0
Adjusted operating margin* 11.0% 6.6% 5.5%
Net income (loss) $23.3 $(229.6) $(38.3)
Diluted earnings (loss) per share $0.24 $(2.32) $(0.39)
Adjusted net income* $29.9 $10.0 $8.4
Adjusted diluted earnings per share* $0.30 $0.10 $0.08
Adjusted EBITDA* $49.6 $33.0 $30.4
Adjusted EBITDA margin* 13.6% 9.1% 8.4%
Wesco Aircraft Proprietary
Visit www.wescoair.com
4Q17 Financial Summary
8
Wesco Aircraft – Investor Relations
Fourth Quarter Commentary
Gross margin 190 bps lower year/year primarily due to claims provision
and inventory adjustments; also reflects lower hardware margins, mix of
hardware and chemical businesses
On a sequential basis, gross margin essentially stable excluding claims
provision
SG&A expenses $12M higher primarily due to personnel-related costs
resulting from new business, customer support, severance, higher
incentive compensation
SG&A sequentially higher primarily due to personnel-related costs to
support new business and severance
Income taxes higher primarily due to a $37.5M non-cash charge for U.S.
taxes on accumulated foreign earnings of $126.5M
Deferred tax liability becomes payable over time upon
repatriation
Not expected to negatively impact FY18 effective rate
* See appendix for reconciliation and information regarding non-GAAP measures.
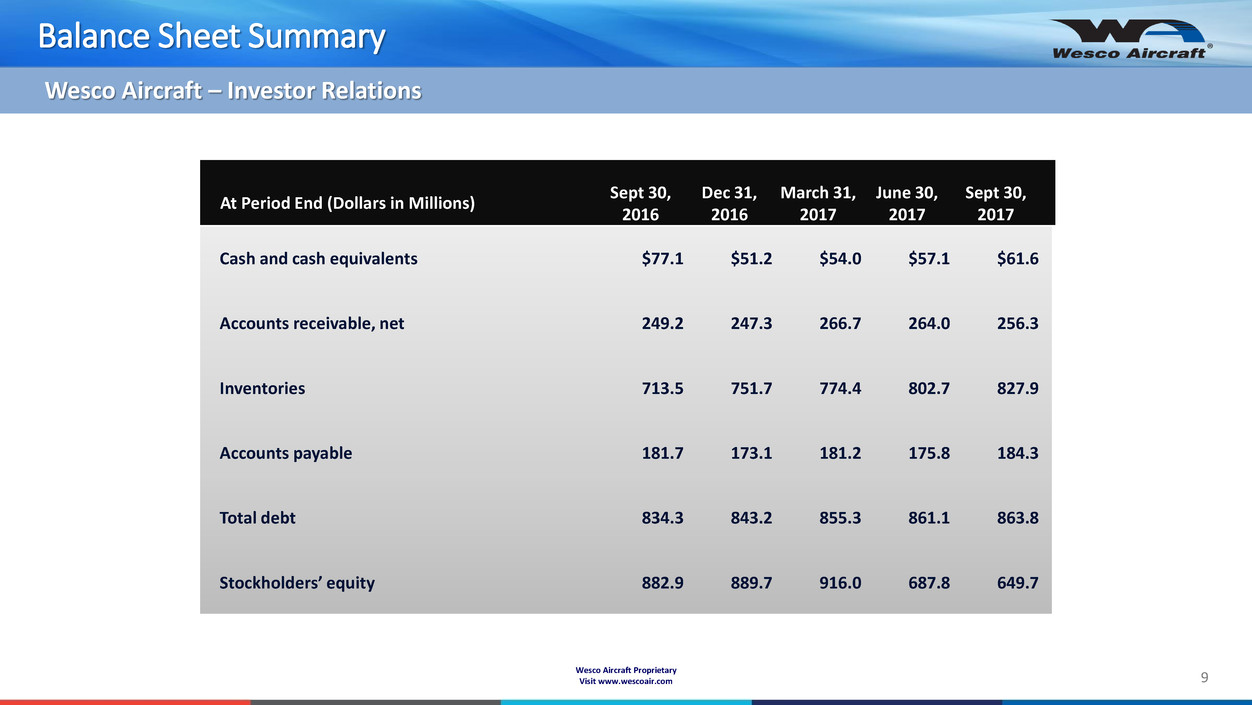
At Period End (Dollars in Millions)
Sept 30,
2016
Dec 31,
2016
March 31,
2017
June 30,
2017
Sept 30,
2017
Cash and cash equivalents $77.1 $51.2 $54.0 $57.1 $61.6
Accounts receivable, net 249.2 247.3 266.7 264.0 256.3
Inventories 713.5 751.7 774.4 802.7 827.9
Accounts payable 181.7 173.1 181.2 175.8 184.3
Total debt 834.3 843.2 855.3 861.1 863.8
Stockholders’ equity 882.9 889.7 916.0 687.8 649.7
Wesco Aircraft Proprietary
Visit www.wescoair.com
Balance Sheet Summary
9
Wesco Aircraft – Investor Relations
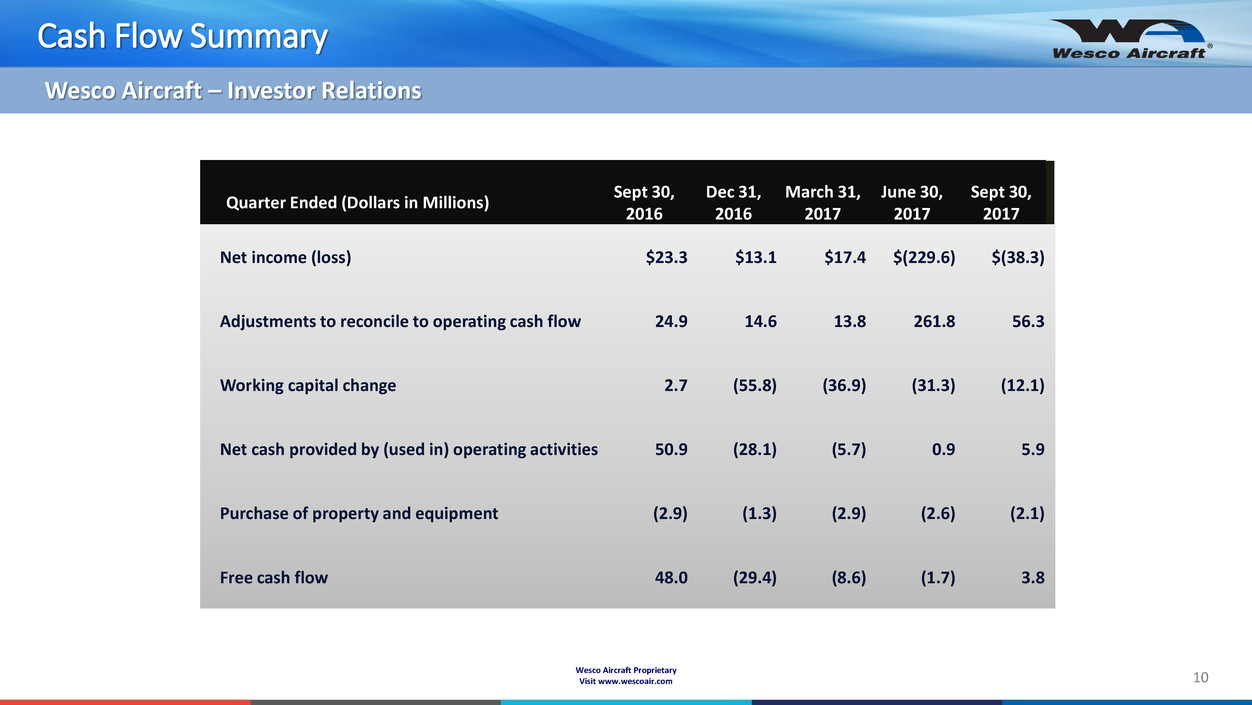
Quarter Ended (Dollars in Millions)
Sept 30,
2016
Dec 31,
2016
March 31,
2017
June 30,
2017
Sept 30,
2017
Net income (loss) $23.3 $13.1 $17.4 $(229.6) $(38.3)
Adjustments to reconcile to operating cash flow 24.9 14.6 13.8 261.8 56.3
Working capital change 2.7 (55.8) (36.9) (31.3) (12.1)
Net cash provided by (used in) operating activities 50.9 (28.1) (5.7) 0.9 5.9
Purchase of property and equipment (2.9) (1.3) (2.9) (2.6) (2.1)
Free cash flow 48.0 (29.4) (8.6) (1.7) 3.8
Wesco Aircraft Proprietary
Visit www.wescoair.com
Cash Flow Summary
10
Wesco Aircraft – Investor Relations

Wesco Aircraft Proprietary
Visit www.wescoair.com
Conclusion
11
Wesco Aircraft – Investor Relations
Challenging fiscal 2017 – leadership team actively engaged in turning around the business
Improvements in operational metrics for first time in several quarters
Accelerating process with Alix Partners to deliver tangible and sustainable improvement
Low single-digit percentage increase year-over-year in revenue expected in fiscal 2018
Primarily new business ramp up and ad-hoc sales growth
Low double-digit percentage increase year-over-year in adjusted EBITDA expected in fiscal 2018
Primarily higher sales and gross margin, stable SG&A as a percent of sales
Operational metrics expected to gain traction, leading to better second half than first half of fiscal 2018
Planning to exit year at adjusted EBITDA margin run-rate of more than 10%

APPENDIX
Wesco Aircraft Proprietary
Visit www.wescoair.com
Non-GAAP Financial Information
13
Wesco Aircraft – Investor Relations
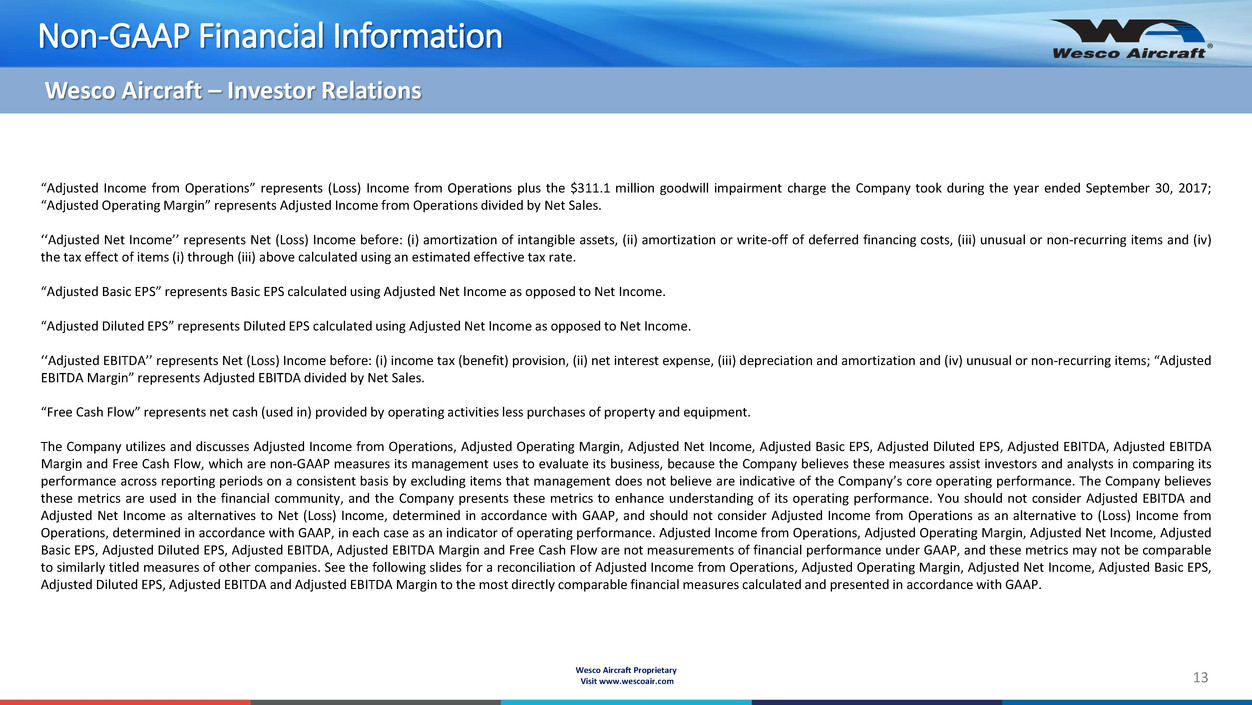
“Adjusted Income from Operations” represents (Loss) Income from Operations plus the $311.1 million goodwill impairment charge the Company took during the year ended September 30, 2017;
“Adjusted Operating Margin” represents Adjusted Income from Operations divided by Net Sales.
‘‘Adjusted Net Income’’ represents Net (Loss) Income before: (i) amortization of intangible assets, (ii) amortization or write-off of deferred financing costs, (iii) unusual or non-recurring items and (iv)
the tax effect of items (i) through (iii) above calculated using an estimated effective tax rate.
“Adjusted Basic EPS” represents Basic EPS calculated using Adjusted Net Income as opposed to Net Income.
“Adjusted Diluted EPS” represents Diluted EPS calculated using Adjusted Net Income as opposed to Net Income.
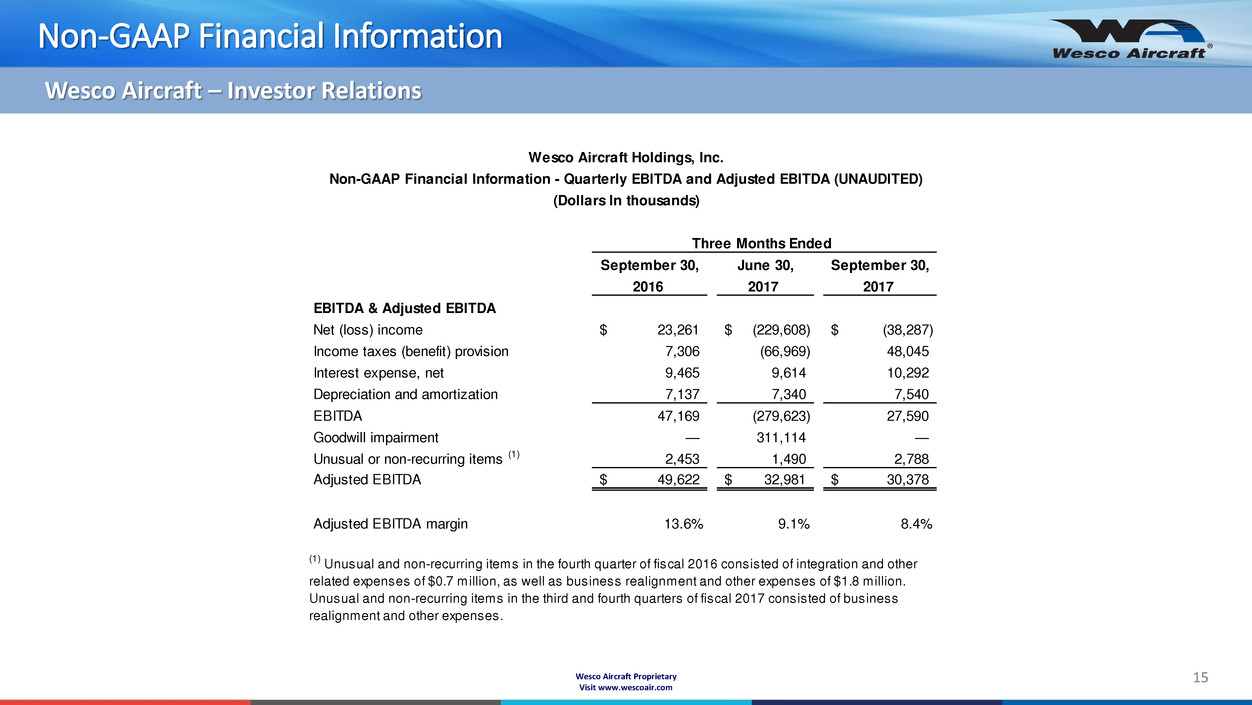
‘‘Adjusted EBITDA’’ represents Net (Loss) Income before: (i) income tax (benefit) provision, (ii) net interest expense, (iii) depreciation and amortization and (iv) unusual or non-recurring items; “Adjusted
EBITDA Margin” represents Adjusted EBITDA divided by Net Sales.
“Free Cash Flow” represents net cash (used in) provided by operating activities less purchases of property and equipment.
The Company utilizes and discusses Adjusted Income from Operations, Adjusted Operating Margin, Adjusted Net Income, Adjusted Basic EPS, Adjusted Diluted EPS, Adjusted EBITDA, Adjusted EBITDA
Margin and Free Cash Flow, which are non-GAAP measures its management uses to evaluate its business, because the Company believes these measures assist investors and analysts in comparing its
performance across reporting periods on a consistent basis by excluding items that management does not believe are indicative of the Company’s core operating performance. The Company believes
these metrics are used in the financial community, and the Company presents these metrics to enhance understanding of its operating performance. You should not consider Adjusted EBITDA and
Adjusted Net Income as alternatives to Net (Loss) Income, determined in accordance with GAAP, and should not consider Adjusted Income from Operations as an alternative to (Loss) Income from
Operations, determined in accordance with GAAP, in each case as an indicator of operating performance. Adjusted Income from Operations, Adjusted Operating Margin, Adjusted Net Income, Adjusted
Basic EPS, Adjusted Diluted EPS, Adjusted EBITDA, Adjusted EBITDA Margin and Free Cash Flow are not measurements of financial performance under GAAP, and these metrics may not be comparable
to similarly titled measures of other companies. See the following slides for a reconciliation of Adjusted Income from Operations, Adjusted Operating Margin, Adjusted Net Income, Adjusted Basic EPS,
Adjusted Diluted EPS, Adjusted EBITDA and Adjusted EBITDA Margin to the most directly comparable financial measures calculated and presented in accordance with GAAP.
Non-GAAP Financial Information
14 Wesco Aircraft Proprietary Visit www.wescoair.com
Wesco Aircraft – Investor Relations
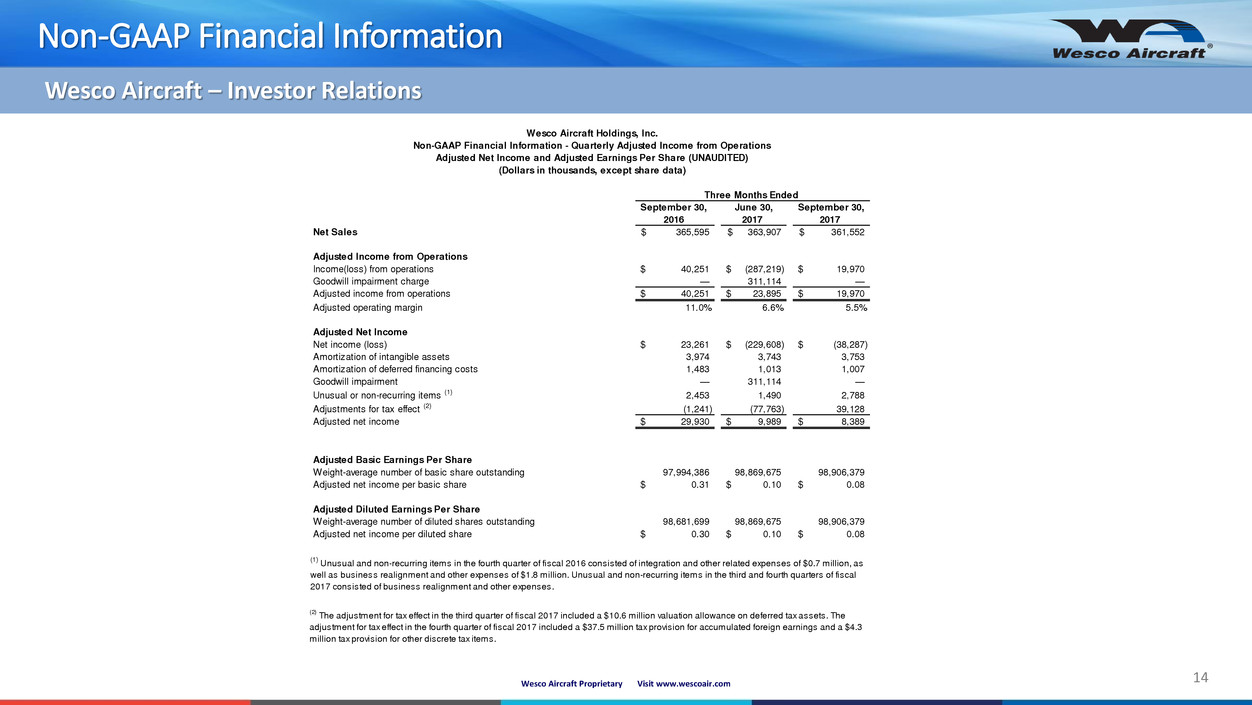
September 30, June 30, September 30,
2016 2017 2017
Net Sales 365,595$ 363,907$ 361,552$
Adjusted Income from Operations
Income(loss) from operations 40,251$ (287,219)$ 19,970$
Goodwill impairment charge — 311,114 —
Adjusted income from operations 40,251$ 23,895$ 19,970$
Adjusted operating margin 11.0% 6.6% 5.5%
Adjusted Net Income
Net income (loss) 23,261$ (229,608)$ (38,287)$
Amortization of intangible assets 3,974 3,743 3,753
Amortization of deferred financing costs 1,483 1,013 1,007
Goodwill impairment — 311,114 —
Unusual or non-recurring items (1) 2,453 1,490 2,788
Adjustments for tax effect (2) (1,241) (77,763) 39,128
Adjusted net income 29,930$ 9,989$ 8,389$
Adjusted Basic Earnings Per Share
Weight-average number of basic share outstanding 97,994,386 98,869,675 98,906,379
Adjusted net income per basic share 0.31$ 0.10$ 0.08$
Adjusted Diluted Earnings Per Share
Weight-average number of diluted shares outstanding 98,681,699 98,869,675 98,906,379
Adjusted net income per diluted share 0.30$ 0.10$ 0.08$
(1)
Unusual and non-recurring items in the fourth quarter of fiscal 2016 consisted of integration and other related expenses of $0.7 million, as
well as business realignment and other expenses of $1.8 million. Unusual and non-recurring items in the third and fourth quarters of fiscal
2017 consisted of business realignment and other expenses.
(2)
The adjustment for tax effect in the third quarter of fiscal 2017 included a $10.6 million valuation allowance on deferred tax assets. The
adjustment for tax effect in the fourth quarter of fiscal 2017 included a $37.5 million tax provision for accumulated foreign earnings and a $4.3
million tax provision for other discrete tax items.
Wesco Aircraft Holdings, Inc.
Non-GAAP Financial Information - Quarterly Adjusted Income from Operations
Adjusted Net Income and Adjusted Earnings Per Share (UNAUDITED)
(Dollars in thousands, except share data)
Three Months Ended
Non-GAAP Financial Information
15 Wesco Aircraft Proprietary
Visit www.wescoair.com
Wesco Aircraft – Investor Relations
September 30, June 30, September 30,
2016 2017 2017
EBITDA & Adjusted EBITDA
Net (loss) income 23,261$ (229,608)$ (38,287)$
Income taxes (benefit) provision 7,306 (66,969) 48,045
Interest expense, net 9,465 9,614 10,292
Depreciation and amortization 7,137 7,340 7,540
EBITDA 47,169 (279,623) 27,590
Goodwill impairment — 311,114 —
Unusual or non-recurring items (1) 2,453 1,490 2,788
Adjusted EBITDA 49,622$ 32,981$ 30,378$
Adjusted EBITDA margin 13.6% 9.1% 8.4%
(1)
Unusual and non-recurring items in the fourth quarter of fiscal 2016 consisted of integration and other
related expenses of $0.7 million, as well as business realignment and other expenses of $1.8 million.
Unusual and non-recurring items in the third and fourth quarters of fiscal 2017 consisted of business
realignment and other expenses.
Wesco Aircraft Holdings, Inc.
Non-GAAP Financial Information - Quarterly EBITDA and Adjusted EBITDA (UNAUDITED)
(Dollars In thousands)
Three Months Ended

For more information, please visit www.wescoair.com.
THANK YOU FOR YOUR INTEREST
IN WESCO AIRCRAFT
