Attached files
| file | filename |
|---|---|
| 8-K - FORM 8-K - Alta Mesa Resources, Inc. /DE | d501125d8k.htm |
Exhibit 99.1
Alta Mesa Resources, Inc. Exceptional, De-Risked Assets Experienced, Disciplined, Technology-Driven Management Investor Update November 2017
Disclaimer FORWARD-LOOKING STATEMENTS The information in this presentation and the oral statements made in connection therewith include “forward-looking statements” within the meaning of Section 27A of the Securities Act and Section 21E of the Securities Exchange Act of 1934, as amended. All statements, other than statements of present or historical fact included in this presentation, regarding Silver Run II’s proposed business combination with Alta Mesa Holdings, LP (“Alta Mesa”) and Kingfisher Midstream, LLC (“KFM”), Silver Run II’s ability to consummate the business combination, the benefits of the business combination and Silver Run II’s future financial performance following the business combination, as well as Alta Mesa’s and KFM’s strategy, future operations, financial position, estimated revenues and losses, projected costs, prospects, plans and objectives of management are forward-looking statements. When used in this presentation, including any oral statements made in connection therewith, the words “could,” “should,” “will,” “may,” “believe,” “anticipate,” “intend,” “estimate,” “expect,” “project,” the negative of such terms and other similar expressions are intended to identify forward-looking statements, although not all forward-looking statements contain such identifying words. These forward-looking statements are based on management’s current expectations and assumptions about future events and are based on currently available information as to the outcome and timing of future events. Except as otherwise required by applicable law, Silver Run II, Alta Mesa and KFM disclaim any duty to update any forward-looking statements, all of which are expressly qualified by the statements in this section, to reflect events or circumstances after the date of this presentation. Silver Run II cautions you that these forward-looking statements are subject to all of the risks and uncertainties, most of which are difficult to predict and many of which are beyond the control of Silver Run II, Alta Mesa and KFM, incident to the development, production, gathering and sale of oil, natural gas and natural gas liquids. These risks include, but are not limited to, commodity price volatility, low prices for oil and/or natural gas, global economic conditions, inflation, increased operating costs, lack of availability of drilling and production equipment, supplies, services and qualified personnel, processing volumes and pipeline throughput, uncertainties related to new technologies, geographical concentration of Alta Mesa’s and KFM’s operations, environmental risks, weather risks, security risks, drilling and other operating risks, regulatory changes, the uncertainty inherent in estimating oil and natural gas reserves and in projecting future rates of production, reductions in cash flow, lack of access to capital, Alta Mesa’s and KFM’s ability to satisfy future cash obligations, restrictions in existing or future debt agreements of Alta Mesa or KFM, the timing of development expenditures, managing Alta Mesa’s and KFM’s growth and integration of acquisitions, failure to realize expected value creation from property acquisitions, title defects and limited control over non-operated properties and our ability to complete an initial public offering of the Kingfisher midstream business. Should one or more of the risks or uncertainties described in this presentation and the oral statements made in connection therewith occur, or should underlying assumptions prove incorrect, Silver Run II’s, Alta Mesa’s and KFM’s actual results and plans could differ materially from those expressed in any forward-looking statements. RESERVE INFORMATION Reserve engineering is a process of estimating underground accumulations of hydrocarbons that cannot be measured in an exact way. The accuracy of any reserve estimate depends on the quality of available data, the interpretation of such data and price and cost assumptions made by reserve engineers. In addition, the results of drilling, testing and production activities may justify revisions of estimates that were made previously. If significant, such revisions could impact Alta Mesa’s strategy and change the schedule of any further production and development drilling. Accordingly, reserve estimates may differ significantly from the quantities of oil and natural gas that are ultimately recovered. Estimated Ultimate Recoveries, or “EURs,” refers to estimates of the sum of total gross remaining proved reserves per well as of a given date and cumulative production prior to such given date for developed wells. These quantities do not necessarily constitute or represent reserves as defined by the Securities and Exchange Commission (the “SEC”) and are not intended to be representative of anticipated future well results of all wells drilled on Alta Mesa’s STACK acreage. USE OF PROJECTIONS This presentation contains projections for Alta Mesa and KFM, including with respect to their EBITDA, net debt to EBITDA ratio and capital budget, as well as Alta Mesa’s production and KFM’s volumes, for the fiscal years 2017, 2018 and 2019. Neither Silver Run II’s nor Alta Mesa’s and KFM’s independent auditors or Alta Mesa’s independent petroleum engineering firm have audited, reviewed, compiled, or performed any procedures with respect to the projections for the purpose of their inclusion in this presentation, and accordingly, none of them expressed an opinion or provided any other form of assurance with respect thereto for the purpose of this presentation. These projections are for illustrative purposes only and should not be relied upon as being necessarily indicative of future results. In this presentation, certain of the above-mentioned projected information has been repeated (in each case, with an indication that the information is subject to the qualifications presented herein), for purposes of providing comparisons with historical data. The assumptions and estimates underlying the projected information are inherently uncertain and are subject to a wide variety of significant business, economic and competitive risks and uncertainties that could cause actual results to differ materially from those contained in the projected information. Even if our assumptions and estimates are correct, projections are inherently uncertain due to a number of factors outside our control. Accordingly, there can be no assurance that the projected results are indicative of the future performance of Silver Run II, Alta Mesa or KFM or the combined company after completion of any business combination or that actual results will not differ materially from those presented in the projected information. Inclusion of the projected information in this presentation should not be regarded as a representation by any person that the results contained in the projected information will be achieved. USE OF NON-GAAP FINANCIAL MEASURES This presentation includes non-GAAP financial measures, including EBITDA and Adjusted EBITDAX of Alta Mesa. Please refer to the Appendix for a reconciliation of Adjusted EBITDAX to net (loss) income, the most comparable GAAP measure. Silver Run II, Alta Mesa and KFM believe EBITDA and Adjusted EBITDAX are useful because they allow Silver Run II, Alta Mesa and KFM to more effectively evaluate their operating performance and compare the results of their operations from period to period and against their peers without regard to financing methods or capital structure. The computations of EBITDA and Adjusted EBITDAX may not be comparable to other similarly titled measures of other companies. Alta Mesa excludes the items listed in the Appendix from net (loss) income in arriving at Adjusted EBITDAX because these amounts can vary substantially from company to company within its industry depending upon accounting methods and book values of assets, capital structures and the method by which the assets were acquired. Adjusted EBITDAX should not be considered as an alternative to, or more meaningful than, net income as determined in accordance with GAAP or as an indicator of Alta Mesa’s operating performance or liquidity. Certain items excluded from Adjusted EBITDAX are significant components in understanding and assessing a company’s financial performance, such as a company’s cost of capital and tax structure, as well as the historic costs of depreciable assets, none of which are components of Adjusted EBITDAX. Alta Mesa’s presentation of Adjusted EBITDAX should not be construed as an inference that its results will be unaffected by unusual or non-recurring items. INDUSTRY AND MARKET DATA This presentation has been prepared by Silver Run II and includes market data and other statistical information from sources believed by Silver Run II, Alta Mesa and KFM to be reliable, including independent industry publications, government publications or other published independent sources. Some data is also based on the good faith estimates of Alta Mesa and KFM, which are derived from their review of internal sources as well as the independent sources described above. Although Silver Run II, Alta Mesa and KFM believe these sources are reliable, they have not independently verified the information and cannot guarantee its accuracy and completeness. TRADEMARKS AND TRADE NAMES Alta Mesa and KFM own or have rights to various trademarks, service marks and trade names that they use in connection with the operation of their respective businesses. This presentation also contains trademarks, service marks and trade names of third parties, which are the property of their respective owners. The use or display of third parties’ trademarks, service marks, trade names or products in this presentation is not intended to, and does not imply, a relationship with Silver Run II, Alta Mesa or KFM, or an endorsement or sponsorship by or of Silver Run II, Alta Mesa or KFM. Solely for convenience, the trademarks, service marks and trade names referred to in this presentation may appear without the ®, TM or SM symbols, but such references are not intended to indicate, in any way, that Alta Mesa or KFM will not assert, to the fullest extent under applicable law, their rights or the right of the applicable licensor to these trademarks, service marks and trade names. 2
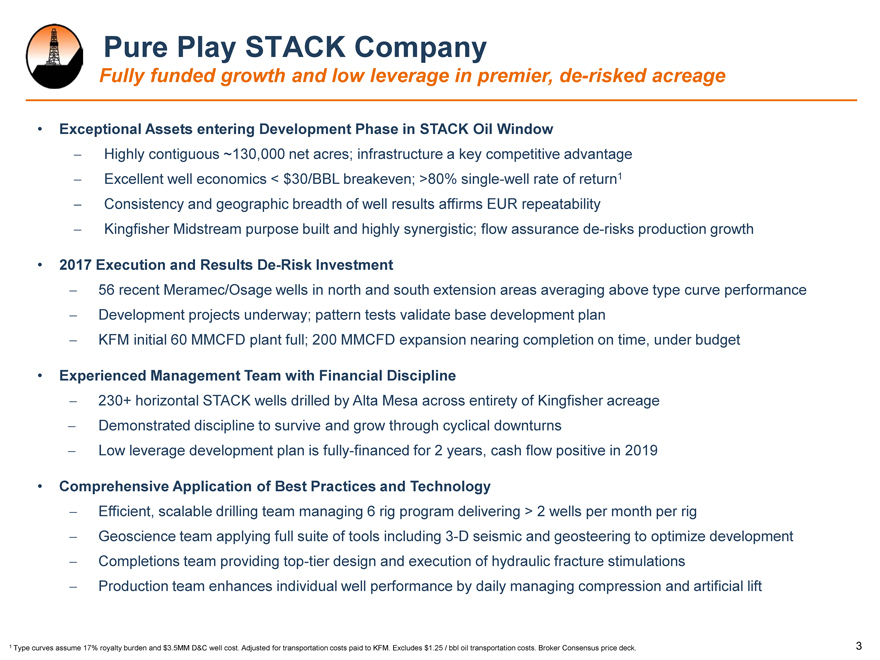
Pure Play STACK Company Fully funded growth and low leverage in premier, de-risked acreage Exceptional Assets entering Development Phase in STACK Oil Window —Highly contiguous ~130,000 net acres; infrastructure a key competitive advantage —Excellent well economics < $30/BBL breakeven; >80% single-well rate of return1 —Consistency and geographic breadth of well results affirms EUR repeatability —Kingfisher Midstream purpose built and highly synergistic; flow assurance de-risks production growth 2017 Execution and Results De-Risk Investment —56 recent Meramec/Osage wells in north and south extension areas averaging above type curve performance —Development projects underway; pattern tests validate base development plan —KFM initial 60 MMCFD plant full; 200 MMCFD expansion nearing completion on time, under budget Experienced Management Team with Financial Discipline —230+ horizontal STACK wells drilled by Alta Mesa across entirety of Kingfisher acreage —Demonstrated discipline to survive and grow through cyclical downturns —Low leverage development plan is fully-financed for 2 years, cash flow positive in 2019 Comprehensive Application of Best Practices and Technology —Efficient, scalable drilling team managing 6 rig program delivering > 2 wells per month per rig —Geoscience team applying full suite of tools including 3-D seismic and geosteering to optimize development —Completions team providing top-tier design and execution of hydraulic fracture stimulations —Production team enhances individual well performance by daily managing compression and artificial lift Type curves assume 17% royalty burden and $3.5MM D&C well cost. Adjusted for transportation costs paid to KFM. Excludes $1.25 / bbl oil transportation costs. Broker Consensus price deck. 3
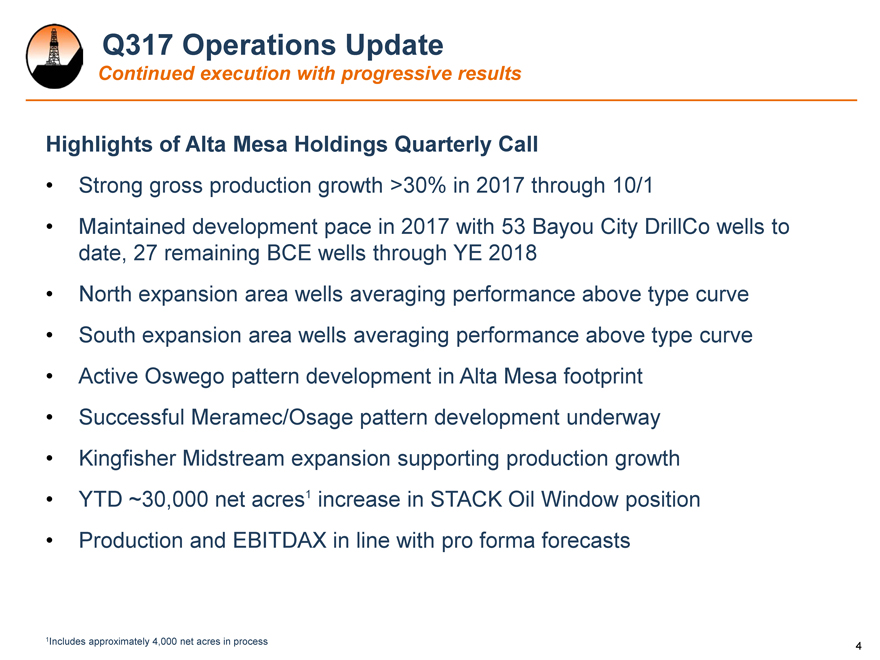
Q317 Operations Update Continued execution with progressive results Highlights of Alta Mesa Holdings Quarterly Call Strong gross production growth >30% in 2017 through 10/1 Maintained development pace in 2017 with 53 Bayou City DrillCo wells to date, 27 remaining BCE wells through YE 2018 North expansion area wells averaging performance above type curve South expansion area wells averaging performance above type curve Active Oswego pattern development in Alta Mesa footprint Successful Meramec/Osage pattern development underway Kingfisher Midstream expansion supporting production growth YTD ~30,000 net acres1 increase in STACK Oil Window position Production and EBITDAX in line with pro forma forecasts 1Includes approximately 4,000 net acres in process 4
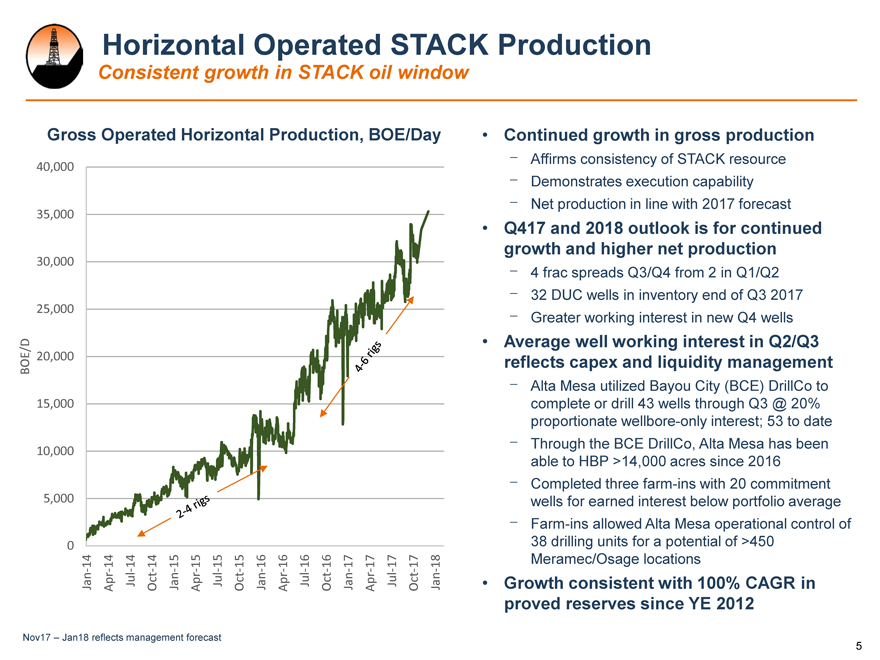
Horizontal Operated STACK Production Consistent growth in STACK oil window Gross Operated Horizontal Production, BOE/Day Continued growth in gross production 40,000 Affirms consistency of STACK resource Demonstrates execution capability 35,000 Net production in line with 2017 forecast Q417 and 2018 outlook is for continued growth and higher net production 30,000 4 frac spreads Q3/Q4 from 2 in Q1/Q2 32 DUC wells in inventory end of Q3 2017 25,000 Greater working interest in new Q4 wells BOE/D 20,000 reflects Average capex well working and liquidity interest management in Q2/Q3 Alta Mesa utilized Bayou City (BCE) DrillCo to 15,000 complete or drill 43 wells through Q3 @ 20% proportionate wellbore-only interest; 53 to date 10,000 Through the BCE DrillCo, Alta Mesa has been able to HBP >14,000 acres since 2016 Completed three farm-ins with 20 commitment 5,000 wells for earned interest below portfolio average Farm-ins allowed Alta Mesa operational control of 0 38 drilling units for a potential of >450 14 14 14 14 15 15 15 15 16 16 16 16 17 17 17 17 18 Meramec/Osage locations — — — — — — — —— Jan Apr Jul Oct Jan Apr Jul Oct Jan Apr Jul Oct Jan Apr Jul Oct Jan Growth consistent with 100% CAGR in proved reserves since YE 2012 Nov17 – Jan18 reflects management forecast 5
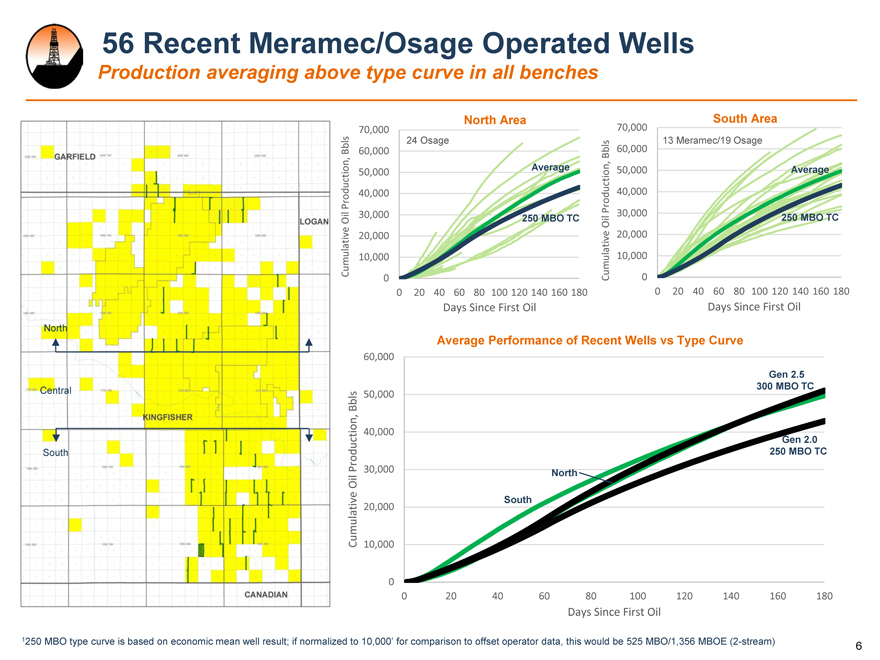
56 Recent Meramec/Osage Operated Wells Production averaging above type curve in all benches North Area South Area 70,000 70,000 Bbls 60,000 24 Osage Bbls 60,000 13 Meramec/19 Osage 50,000 Average 50,000 Average Production, 40,000 Production, 40,000 Oil 30,000 250 MBO TC Oil 30,000 250 MBO TC 20,000 20,000 Cumulative 10,000 Cumulative 10,000 0 0 0 20 40 60 80 100 120 140 160 180 0 20 40 60 80 100 120 140 160 180 Days Since First Oil Days Since First Oil North Average Performance of Recent Wells vs Type Curve 60,000 Gen 2.5 Central 50,000 300 MBO TC Bbls 40,000 Gen 2.0 South Production, 250 MBO TC 30,000 North Oil 20,000 South Cumulative 10,000 0 0 20 40 60 80 100 120 140 160 180 Days Since First Oil 1250 MBO type curve is based on economic mean well result; if normalized to 10,000’ for comparison to offset operator data, this would be 525 MBO/1,356 MBOE (2-stream) 6
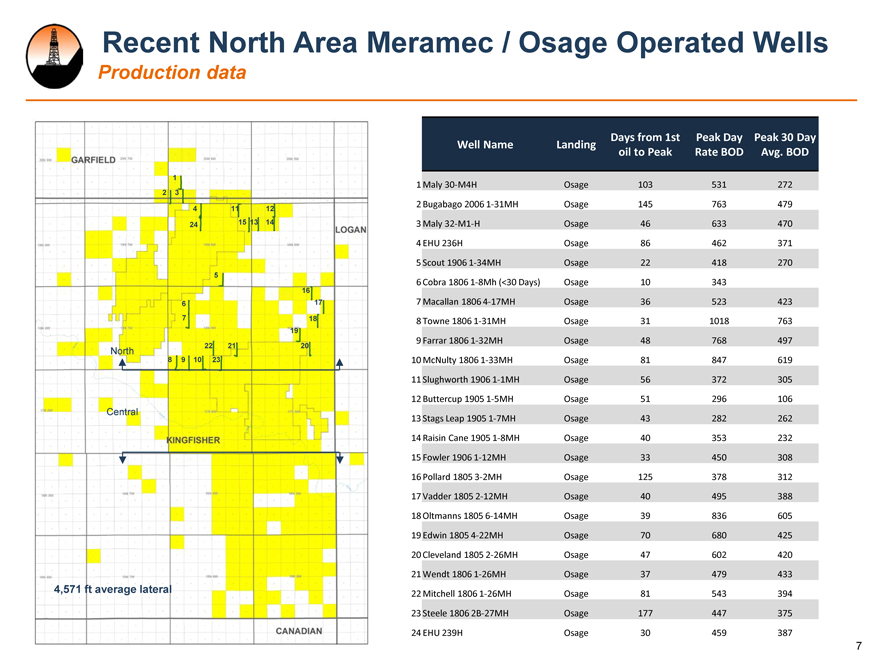
Recent North Area Meramec / Osage Operated Wells Production data Well Name Landing Days from 1st Peak Day Peak 30 Day oil to Peak Rate BOD Avg. BOD 1 1 Maly 30-M4H Osage 103 531 272 2 3 4 11 12 2 Bugabago 2006 1-31MH Osage 145 763 479 24 15 13 14 3 Maly 32-M1-H Osage 46 633 470 4 EHU 236H Osage 86 462 371 5 Scout 1906 1-34MH Osage 22 418 270 5 6 Cobra 1806 1-8Mh (<30 Days) Osage 10 343 16 6 17 7 Macallan 1806 4-17MH Osage 36 523 423 7 18 8 Towne 1806 1-31MH Osage 31 1018 763 19 9 Farrar 1806 1-32MH Osage 48 768 497 North 22 21 20 8 9 10 23 10 McNulty 1806 1-33MH Osage 81 847 619 11 Slughworth 1906 1-1MH Osage 56 372 305 12 Buttercup 1905 1-5MH Osage 51 296 106 Central 13 Stags Leap 1905 1-7MH Osage 43 282 262 14 Raisin Cane 1905 1-8MH Osage 40 353 232 15 Fowler 1906 1-12MH Osage 33 450 308 16 Pollard 1805 3-2MH Osage 125 378 312 17 Vadder 1805 2-12MH Osage 40 495 388 18 Oltmanns 1805 6-14MH Osage 39 836 605 19 Edwin 1805 4-22MH Osage 70 680 425 20 Cleveland 1805 2-26MH Osage 47 602 420 21 Wendt 1806 1-26MH Osage 37 479 433 4,571 ft average lateral 22 Mitchell 1806 1-26MH Osage 81 543 394 23 Steele 1806 2B-27MH Osage 177 447 375 24 EHU 239H Osage 30 459 387 7
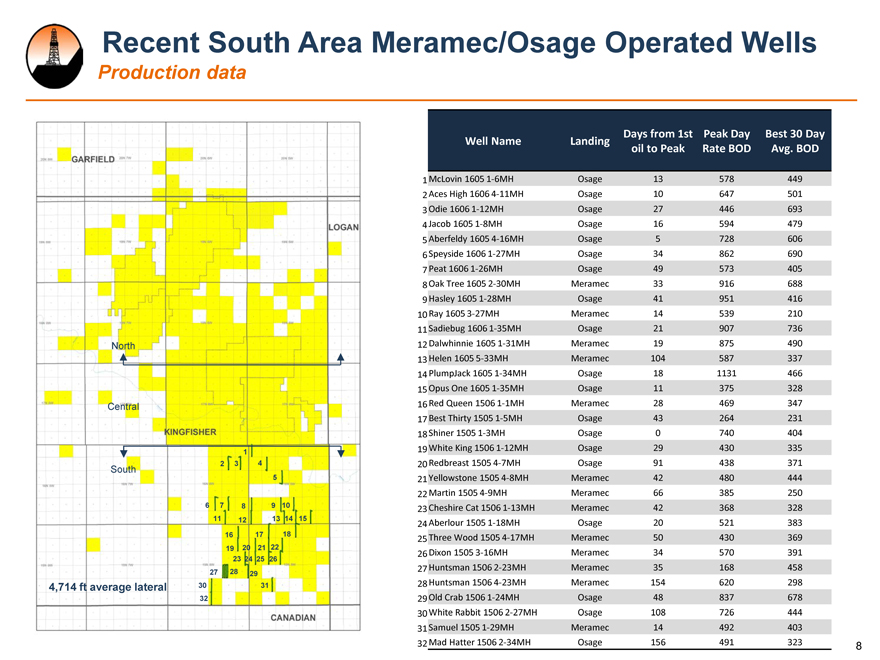
Recent South Area Meramec/Osage Operated Wells Production data Well Name Landing Days from 1st Peak Day Best 30 Day oil to Peak Rate BOD Avg. BOD 1 McLovin 1605 1-6MH Osage 13 578 449 2 Aces High 1606 4-11MH Osage 10 647 501 3 Odie 1606 1-12MH Osage 27 446 693 4 Jacob 1605 1-8MH Osage 16 594 479 5 Aberfeldy 1605 4-16MH Osage 5 728 606 6 Speyside 1606 1-27MH Osage 34 862 690 7 Peat 1606 1-26MH Osage 49 573 405 8 Oak Tree 1605 2-30MH Meramec 33 916 688 9 Hasley 1605 1-28MH Osage 41 951 416 10 Ray 1605 3-27MH Meramec 14 539 210 11 Sadiebug 1606 1-35MH Osage 21 907 736 North 12 Dalwhinnie 1605 1-31MH Meramec 19 875 490 13 Helen 1605 5-33MH Meramec 104 587 337 14 PlumpJack 1605 1-34MH Osage 18 1131 466 15 Opus One 1605 1-35MH Osage 11 375 328 Central 16 Red Queen 1506 1-1MH Meramec 28 469 347 17 Best Thirty 1505 1-5MH Osage 43 264 231 18 Shiner 1505 1-3MH Osage 0 740 404 1 19 White King 1506 1-12MH Osage 29 430 335 South 2 3 4 20 Redbreast 1505 4-7MH Osage 91 438 371 5 21 Yellowstone 1505 4-8MH Meramec 42 480 444 22 Martin 1505 4-9MH Meramec 66 385 250 6 7 8 9 10 23 Cheshire Cat 1506 1-13MH Meramec 42 368 328 11 12 13 14 15 24 Aberlour 1505 1-18MH Osage 20 521 383 16 17 18 25 Three Wood 1505 4-17MH Meramec 50 430 369 19 20 21 22 26 Dixon 1505 3-16MH Meramec 34 570 391 23 24 25 26 27 28 29 27 Huntsman 1506 2-23MH Meramec 35 168 458 4,714 ft average lateral 30 31 28 Huntsman 1506 4-23MH Meramec 154 620 298 32 29 Old Crab 1506 1-24MH Osage 48 837 678 30 White Rabbit 1506 2-27MH Osage 108 726 444 31 Samuel 1505 1-29MH Meramec 14 492 403 32 Mad Hatter 1506 2-34MH Osage 156 491 323 8
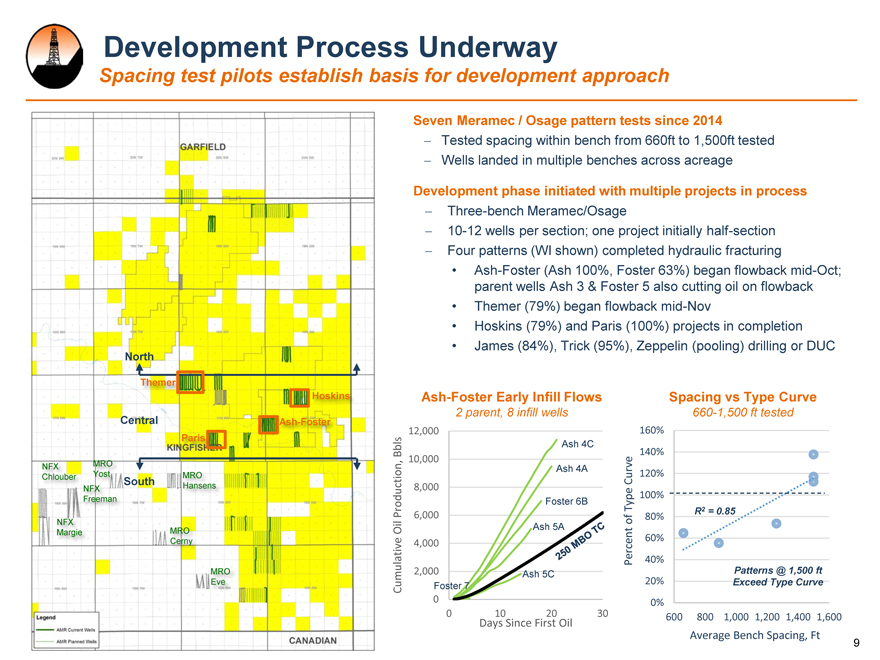
Development Process Underway Spacing test pilots establish basis for development approach Seven Meramec / Osage pattern tests since 2014 —Tested spacing within bench from 660ft to 1,500ft tested —Wells landed in multiple benches across acreage Development phase initiated with multiple projects in process —Three-bench Meramec/Osage —10-12 wells per section; one project initially half-section —Four patterns (WI shown) completed hydraulic fracturing Ash-Foster (Ash 100%, Foster 63%) began flowback mid-Oct; parent wells Ash 3 & Foster 5 also cutting oil on flowback Themer (79%) began flowback mid-Nov Hoskins (79%) and Paris (100%) projects in completion James (84%), Trick (95%), Zeppelin (pooling) drilling or DUC North Themer Hoskins Ash-Foster Early Infill Flows Spacing vs Type Curve Central Ash-Foster 2 parent, 8 infill wells 660-1,500 ft tested 12,000 160% Paris Bbls Ash 4C 140% 10,000 NFX MRO Ash 4A Chlouber Yost uth MRO Curve 120% Hansens 8,000 Freeman Foster 6B Type 100% Production, 6,000 80% R2 = 0.85 NFX of Margie MRO Oil Ash 5A Cerny 4,000 60% 40% MRO 2,000 Ash 5C Patterns @ 1,500 ft Eve Cumulative Foster 7 Percent 20% Exceed Type Curve 0 0% 0 10 20 30 600 800 1,000 1,200 1,400 1,600 Days Since First Oil Average Bench Spacing, Ft 9
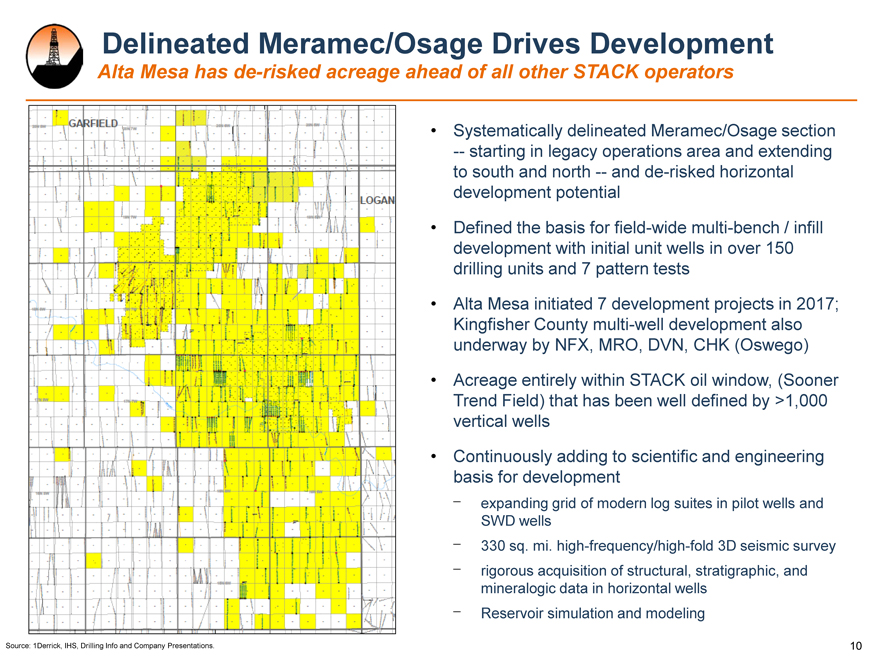
Delineated Meramec/Osage Drives Development Alta Mesa has de-risked acreage ahead of all other STACK operators Systematically delineated Meramec/Osage section — starting in legacy operations area and extending to south and north — and de-risked horizontal development potential Defined the basis for field-wide multi-bench / infill development with initial unit wells in over 150 drilling units and 7 pattern tests Alta Mesa initiated 7 development projects in 2017; Kingfisher County multi-well development also underway by NFX, MRO, DVN, CHK (Oswego) Acreage entirely within STACK oil window, (Sooner Trend Field) that has been well defined by >1,000 vertical wells Continuously adding to scientific and engineering ⎻basis for development expanding grid of modern log suites in pilot wells and ⎻ SWD wells ⎻ 330 sq. mi. high-frequency/high-fold 3D seismic survey rigorous acquisition of structural, stratigraphic, and ⎻ mineralogic data in horizontal wells Reservoir simulation and modeling Source: 1Derrick, IHS, Drilling Info and Company Presentations. 10
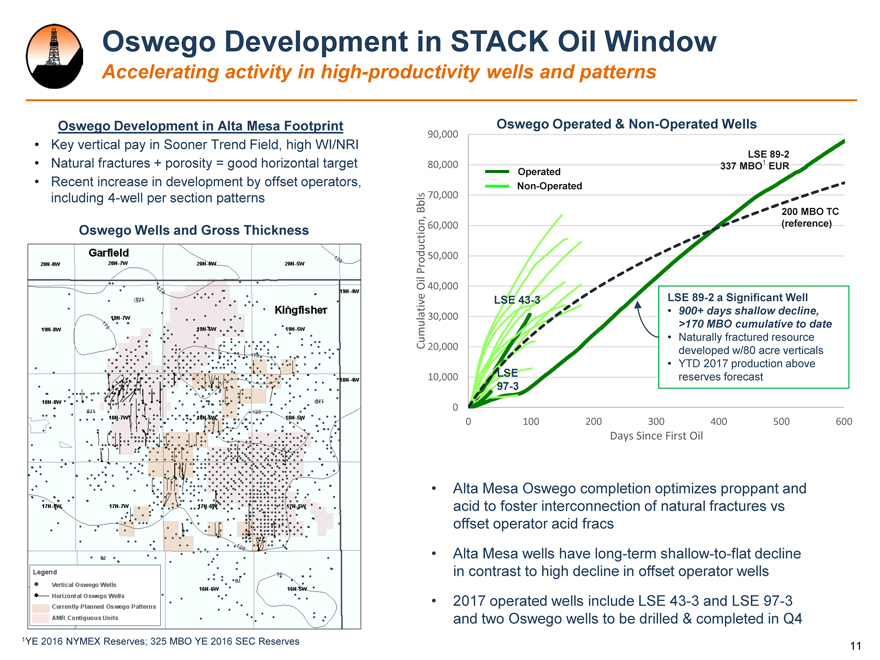
Oswego Development in STACK Oil Window Accelerating activity in high-productivity wells and patterns Oswego Development in Alta Mesa Footprint Oswego Operated & Non-Operated Wells 90,000 Key vertical pay in Sooner Trend Field, high WI/NRI LSE 89-2 Natural fractures + porosity = good horizontal target 80,000 337 MBO1 EUR Operated Recent increase in development by offset operators, Non-Operated including 4-well per section patterns Bbls 70,000 200 MBO TC Oswego Wells and Gross Thickness 60,000 (reference) Production, 50,000 Oil 40,000 LSE 43-3 LSE 89-2 a Significant Well 30,000 900+ days shallow decline, >170 MBO cumulative to date Cumulative Naturally fractured resource 20,000 developed w/80 acre verticals YTD 2017 production above 10,000 LSE reserves forecast 97-3 0 0 100 200 300 400 500 600 Days Since First Oil Alta Mesa Oswego completion optimizes proppant and acid to foster interconnection of natural fractures vs offset operator acid fracs Alta Mesa wells have long-term shallow-to-flat decline in contrast to high decline in offset operator wells 2017 operated wells include LSE 43-3 and LSE 97-3 and two Oswego wells to be drilled & completed in Q4 1YE 2016 NYMEX Reserves; 325 MBO YE 2016 SEC Reserves 11
Kingfisher Midstream Operations Update Continued execution establishes basis for 2018+ performance Kingfisher Midstream Execution Q3 2017 Adjusted EBITDA $10.5MM, >200% from Q2 2017 Operations continue to expand since August SRUN announcement1 Processing capacity increased from 60 MMCFD to 150 MMCFD Compression horsepower increased from 23,070 hp to 51,643 hp Gathering system expanded from 321 miles to 413 miles Initial 60 MMCFD cryogenic plant processing in excess of installed capacity additional volumes processed via 90 MMCFD processing agreements 200 MMCFD plant expansion on time, under budget for early Q1 2018 start Volume growth continues, including >30 DUCs in system Financial flexibility to support expansion capital and maintenance capital 1As of November 2017 12
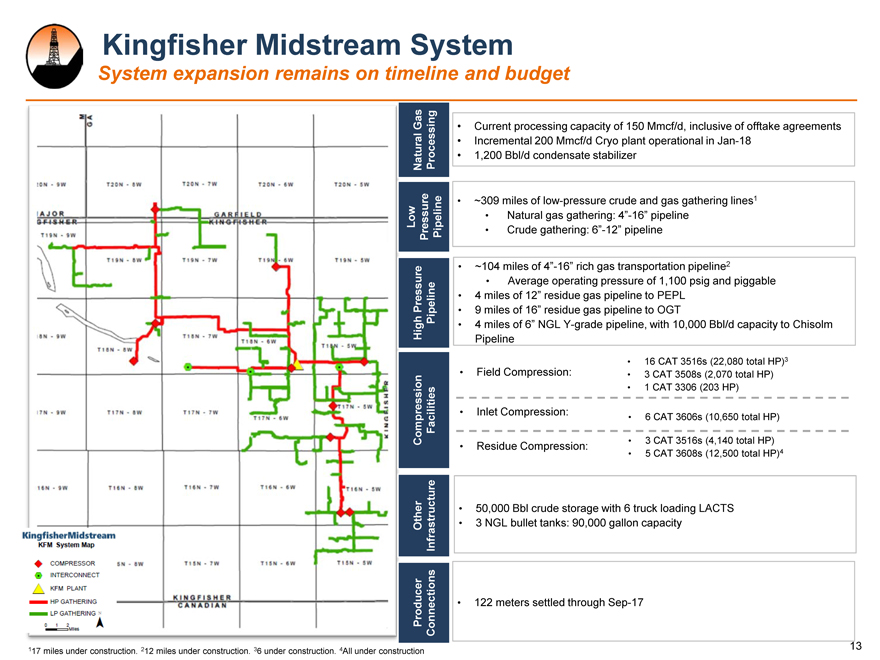
Kingfisher Midstream System System expansion remains on timeline and budget Gas Current processing capacity of 150 Mmcf/d, inclusive of offtake agreements Incremental 200 Mmcf/d Cryo plant operational in Jan-18 Natural Processing 1,200 Bbl/d condensate stabilizer ~309 miles of low-pressure crude and gas gathering lines1 Natural gas gathering: 4”-16” pipeline Low Pressure Pipeline Crude gathering: 6”-12” pipeline ~104 miles of 4”-16” rich gas transportation pipeline2 Average operating pressure of 1,100 psig and piggable 4 miles of 12” residue gas pipeline to PEPL Pressure Pipeline 9 miles of 16” residue gas pipeline to OGT High 4 miles of 6” NGL Y-grade pipeline, with 10,000 Bbl/d capacity to Chisolm Pipeline 16 CAT 3516s (22,080 total HP)3 Field Compression: 3 CAT 3508s (2,070 total HP) 1 CAT 3306 (203 HP) Inlet Compression: 6 CAT 3606s (10,650 total HP) Compression Facilities Residue Compression: 3 CAT 3516s (4,140 total HP) 5 CAT 3608s (12,500 total HP)4 50,000 Bbl crude storage with 6 truck loading LACTS Other Infrastructure 3 NGL bullet tanks: 90,000 gallon capacity Producer Connections 122 meters settled through Sep-17 117 miles under construction. 212 miles under construction. 36 under construction. 4All under construction 13
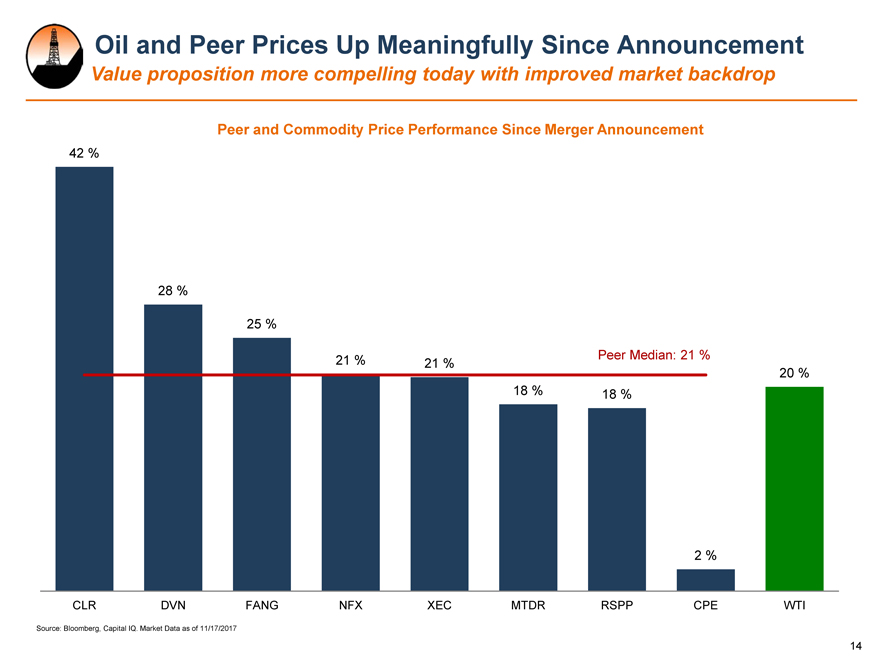
Oil and Peer Prices Up Meaningfully Since Announcement Value proposition more compelling today with improved market backdrop Peer and Commodity Price Performance Since Merger Announcement 42 % 28 % 25 % 21 % 21 % Peer Median: 21 % 20 % 18 % 18 % 2 % CLR DVN FANG NFX XEC MTDR RSPP CPE WTI Source: Bloomberg, Capital IQ. Market Data as of 11/17/2017 14
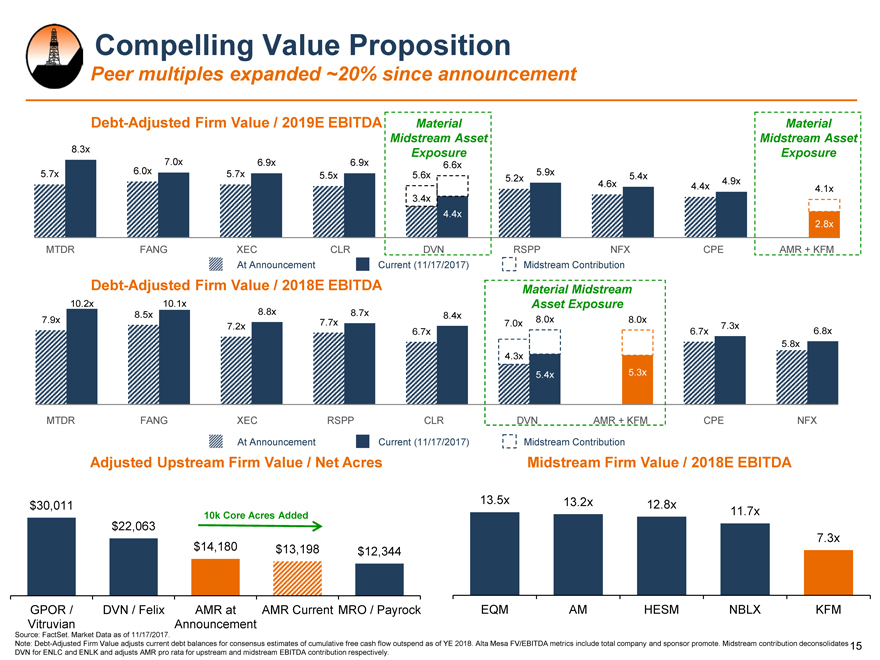
Compelling Value Proposition Peer multiples expanded ~20% since announcement Debt-Adjusted Firm Value / 2019E EBITDA Material Material Midstream Asset Midstream Asset 8.3x Exposure Exposure 7.0x 6.9x 6.9x 6.6x 5.7x 6.0x 5.7x 5.5x 5.6x 5.2x 5.9x 4.6x 5.4x 4.4x 4.9x 4.1x 3.4x 4.4x 2.8x MTDRMTDR FANGFANG XECXEC CLRCLR DVNDVN RSPPRSPP NFXNFX CPECPE AMRAMR+ KFM At Announcement Current (11/17/2017) Midstream Contribution + KFM Debt-Adjusted Firm Value / 2018E EBITDA Material Midstream 10.2x 10.1x Asset Exposure 8.5x 8.8x 8.7x 8.4x 7.9x 7.2x 7.7x 7.0x 8.0x 8.0x 7.3x 6.7x 6.7x 6.8x 5.8x 4.3x 5.4x 5.3x MTDRMTDR FANGFANG XECXEC RSPPRSPP CLRCLR DVNDVN AMRAMR+ KFM+ KFM CPECPE NFXNFX At Announcement Current (11/17/2017) Midstream Contribution Adjusted Upstream Firm Value / Net Acres Midstream Firm Value / 2018E EBITDA $30,011 13.5x 13.2x 12.8x 10k Core Acres Added 11.7x $22,063 7.3x $14,180 $13,198 $12,344 GPOR / DVN / Felix AMR at AMR Current MRO / Payrock EQM AM HESM NBLX KFM Vitruvian Announcement Source: FactSet. Market Data as of 11/17/2017. Note: Debt-Adjusted Firm Value adjusts current debt balances for consensus estimates of cumulative free cash flow outspend as of YE 2018. Alta Mesa FV/EBITDA metrics include total company and sponsor promote. Midstream contribution deconsolidates 15 DVN for ENLC and ENLK and adjusts AMR pro rata for upstream and midstream EBITDA contribution respectively.
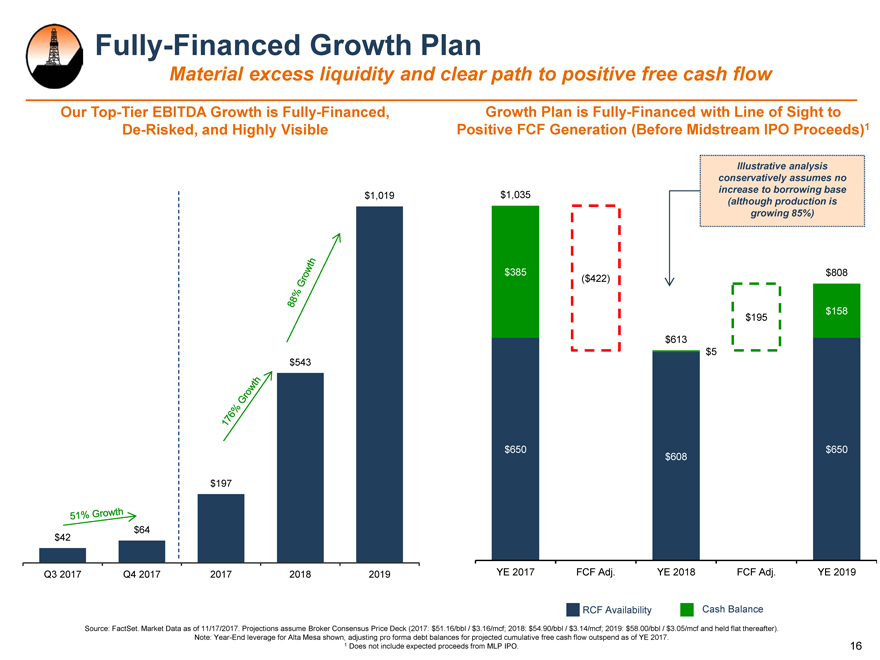
Fully-Financed Growth Plan Material excess liquidity and clear path to positive free cash flow Our Top-Tier EBITDA Growth is Fully-Financed, Growth Plan is Fully-Financed with Line of Sight to De-Risked, and Highly Visible Positive FCF Generation (Before Midstream IPO Proceeds)1 Illustrative analysis conservatively assumes no $1,019 $1,035 increase to borrowing base (although production is growing 85%) $385 $ 808 ($422) $ 195 $ 158 $613 $ 5 $543 $650 $ 650 $608 $197 $64 $42 Q3 2017 Q4 2017 2017 2018 2019 YE 2017 FCF Adj. YE 2018 FCF Adj. YE 2019 RCF Availability Cash Balance Source: FactSet. Market Data as of 11/17/2017. Projections assume Broker Consensus Price Deck (2017: $51.16/bbl / $3.16/mcf; 2018: $54.90/bbl / $3.14/mcf; 2019: $58.00/bbl / $3.05/mcf and held flat thereafter). Note: Year-End leverage for Alta Mesa shown, adjusting pro forma debt balances for projected cumulative free cash flow outspend as of YE 2017. 1 Does not include expected proceeds from MLP IPO. 16
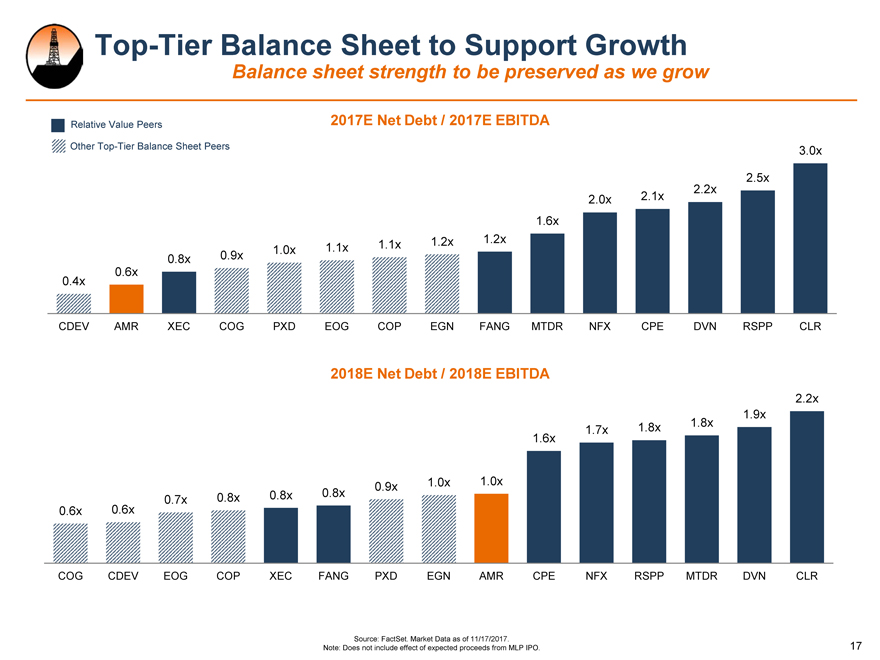
Top-Tier Balance Sheet to Support Growth Balance sheet strength to be preserved as we grow Relative Value Peers 2017E Net Debt / 2017E EBITDA Other Top-Tier Balance Sheet Peers 3.0x 2.5x 2.0x 2.1x 2.2x 1.6x 0.8x 0.9x 1.0x 1.1x 1.1x 1.2x 1.2x 0.6x 0.4x CDEV AMR XEC COG PXD EOG COP EGN FANG MTDR NFX CPE DVN RSPP CLR 2018E Net Debt / 2018E EBITDA 2.2x 1.9x 1.6x 1.7x 1.8x 1.8x 0.7x 0.8x 0.8x 0.8x 0.9x 1.0x 1.0x 0.6x 0.6x COG CDEV EOG COP XEC FANG PXD EGN AMR CPE NFX RSPP MTDR DVN CLR Source: FactSet. Market Data as of 11/17/2017. Note: Does not include effect of expected proceeds from MLP IPO. 17
Investor Update Continued execution facilitates growth Summary SRUN/AMR/KFM growing in absolute and relative value Fully-funded, low leverage growth in firmly-established resource Alta Mesa development projects underway Expansion in North and South continues to yield excellent results Alta Mesa increased core acreage, overall footprint KFM 200 MMCFD expansion on track, volumes growing Continued performance in upstream and midstream in Q3 2017 Production, EBITDAX, EBITDA in line with pro forma forecasts 18