Attached files
| file | filename |
|---|---|
| 8-K - 8-K - HomeTrust Bancshares, Inc. | htbi-20171127x8kx2.htm |

Positioned for
growth
Annual Meeting
November 27, 2017

Positioned for
growth 2
Forward-Looking Statements
This presentation includes “forward-looking statements” within the meaning of the Private Securities
Litigation Reform Act of 1995. Such statements often include words such as “believe,” “expect,”
“anticipate,” “estimate,” and “intend” or future or conditional verbs such as “will,” “would,” “should,”
“could,” or “may.” Forward-looking statements are not historical facts but instead represent
management’s current expectations and forecasts regarding future events many of which are
inherently uncertain and outside of our control. Actual results may differ, possibly materially, from
those currently expected or projected in these forward-looking statements. Factors that could cause
our actual results to differ materially from those described in the forward-looking statements, include
expected cost savings, synergies and other financial benefits from acquisitions might not be realized
within the expected time frames or at all, and costs or difficulties relating to integration matters might
be greater than expected; increased competitive pressures; changes in the interest rate environment;
changes in general economic conditions and conditions within the securities markets; legislative and
regulatory changes; and other factors described in HomeTrust’s latest annual Report on Form 10-K
and Quarterly Reports on Form 10-Q and other filings with the Securities and Exchange Commission-
which are available on our website at www.hometrustbanking.com and on the SEC’s website at
www.sec.gov. Any of the forward-looking statements that we make in this presentation or our SEC
filings are based upon management’s beliefs and assumptions at the time they are made and may turn
out to be wrong because of inaccurate assumptions we might make, because of the factors illustrated
above or because of other factors that we cannot foresee. We do not undertake and specifically
disclaim any obligation to revise any forward-looking statements to reflect the occurrence of
anticipated or unanticipated events or circumstances after the date of such statements. These risks
could cause our actual results for fiscal 2018 and beyond to differ materially from those expressed in
any forward-looking statements by, or on behalf of, us and could negatively affect our operating and
stock performance.

Positioned for
growth
HomeTrust Bancshares, Inc. Overview
Headquarters: Asheville, NC Exchange/Ticker: NASDAQ: HTBI
Founded: 1926
Number of
Employees:
489
Locations: 43 (NC, SC, VA, TN) Stock Price: $26.30
Total Assets: $3.2 billion Price to TBV: 133%
Total Loans: $2.4 billion Market Cap: $500 million
Total Deposits: $2.1 billion Average Daily Volume: 34,040
Outstanding Shares:
18,962,075 Shares Repurchased
(since Feb 19, 2013)
5,351,065
or approx. 26%
3
Financial data as of September 30, 2017
Market data as of November 22, 2017

Positioned for
growth
Phase I: Created a Foundation For Growth
Lines of Business – Infrastructure and Talent
New markets for growth
Phase II: Executing Our Strategic Plan with a Sense of Urgency
Sound and Profitable Organic Growth
Loans
Deposits
Lower our efficiency ratio
Noninterest income growth
Expense management
Streamlining current processes
Repurchase shares opportunistically
Highly accretive in-market acquisitions
Phase III: Consistently improving performance
Transitioning to a High Performing Community Bank
4

Positioned for
growth 5
Strong Footprint for Growth

Positioned for
growth 6
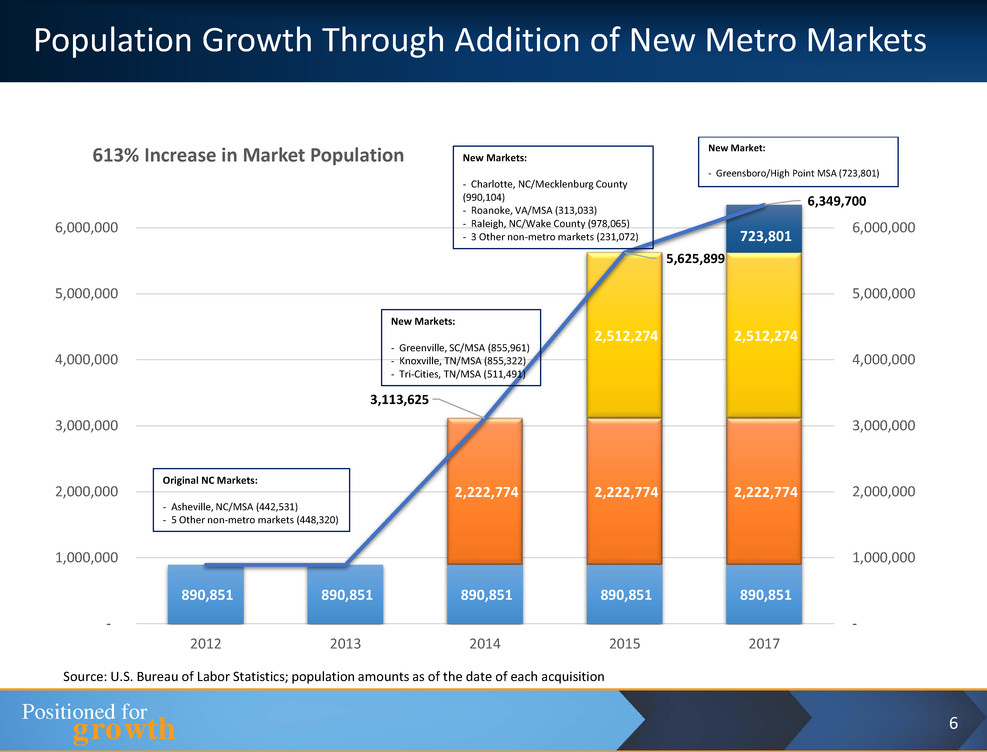
Population Growth Through Addition of New Metro Markets
890,851 890,851 890,851 890,851 890,851
2,222,774 2,222,774 2,222,774
2,512,274 2,512,274
3,113,625
5,625,899
6,349,700
-
1,000,000
2,000,000
3,000,000
4,000,000
5,000,000
6,000,000
-
1,000,000
2,000,000
3,000,000
4,000,000
5,000,000
6,000,000
2012 2013 2014 2015 2017
613% Increase in Market Population New Market:
- Greensboro/High Point MSA (723,801)
723,801
Original NC Markets:
- Asheville, NC/MSA (442,531)
- 5 Other non-metro markets (448,320)
New Markets:
- Greenville, SC/MSA (855,961)
- Knoxville, TN/MSA (855,322)
- Tri-Cities, TN/MSA (511,491)
New Markets:
- Charlotte, NC/Mecklenburg County
(990,104)
- Roanoke, VA/MSA (313,033)
- Raleigh, NC/Wake County (978,065)
- 3 Other non-metro markets (231,072)
Source: U.S. Bureau of Labor Statistics; population amounts as of the date of each acquisition

Positioned for
growth 7
Commercial Production by Market
22,571 38,151
56,969 53,551 69,902 62,413
12,264
141,336
255,636
461,851
5 5
8
15
19
30
-
5
10
15
20
25
30
2012 2013 2014 2015 2016 2017
$-
$50,000
$100,000
$150,000
$200,000
$250,000
$300,000
$350,000
$400,000
$450,000
$500,000
$550,000
Legacy New markets CRM/Lenders
88%
12%
69,538
Production by market above excludes municipal leases.
Dollars in thousands
194,887
524,264
325,538
Legacy/New Markets

Positioned for
growth 8
Loan Portfolio Composition
$
6
2
1
$
6
0
2
$
6
6
0
$
6
5
0
$
6
2
4
$
6
8
4
$200 $182
$223 $336
$459
$518 $411 $383
$615
$700
$750
$1,1
5
0
$-
$500
$1,000
$1,500
$2,000
$2,500
2012 2013 2014 2015 2016 2017
Lo
an
B
ala
n
ce
Fiscal Year
1-4 Family HELOCs & Other Consumer Commercial
5-Year CAGR of 13.81%
29%
22%
31.0%
8%
10%
Loans: 6/30/17
1-4 Family ($684MM)
HELOCs & Other Consumer ($518MM)
Commercial RE ($730MM)
Commercial Construction ($198MM)
Other Commercial ($222MM)
Commercial 48%
Dollars in millions
51%
16%
19%
3%
11%
Loans: 6/30/12
1-4 Family ($621MM) HELOCs & Other Consumer ($200MM)
Commercial RE ($239MM) Commercial Construction ($42MM)
Other Commercial ($130MM)
Commercial 33%
Increased commercial loan
portfolio by $739 million or
180% since 2012

Positioned for
growth 10/26/2017 9
Total Deposits
51% 47% 40% 31% 25%
49%
53%
60%
69%
75%
77%
$0
$250
$500
$750
$1,000
$1,250
$1,500
$1,750
$2,000
$2,250
2012* 2013 2014 2015 2016 2017
Time Deposits Core Deposits (checking, savings, money market)
$1,803
$1,155
$1,239
$1,583
$1,872
Fiscal Year Ended
$2,048
Dollars in millions
*Excludes $264.2 million in stock conversion escrow account
23%

Positioned for
growth 10/26/2017 10
Checking Accounts
$231 $256
$419
$591
$629
$780
$0
$100
$200
$300
$400
$500
$600
$700
$800
2012 2013 2014 2015 2016 2017
Dollars in millions
Fiscal Year Ended

Positioned for
growth 11
Growing Noninterest Income
New SBA Line of Business
Gain from loan sales
Third party servicer to keep overhead low
Mortgage Banking
Expanded into 5 of our new metro markets
Added 10 new mortgage loan officers in the last 12 months
Increasing rates to enhance gain on loan sales
Moving to a “mortgage banking” model and process and away from the
“traditional thrift” model
Treasury Management
Focus on increasing fees and appropriate pricing
Additional debit card revenue from purchase card program
Increased fees from new merchant services program
Increased discipline and monitoring of fee waivers and refunds – reduced
64% in fiscal 2017

Positioned for
growth 12
Creating Efficiencies/Expense Management
Consolidated 10 branch offices
Closed 6 overlapping rural offices
Consolidated 4 offices related to acquisitions
Branch optimization staffing study reduced expense $375,000
annually
Changed health care insurance providers to avoid $700,000 increase
Reduced REO-related expense by $385,000, or 21% in fiscal 2017
Achieved 50% cost savings in TriSummit acquisition

Positioned for
growth 13
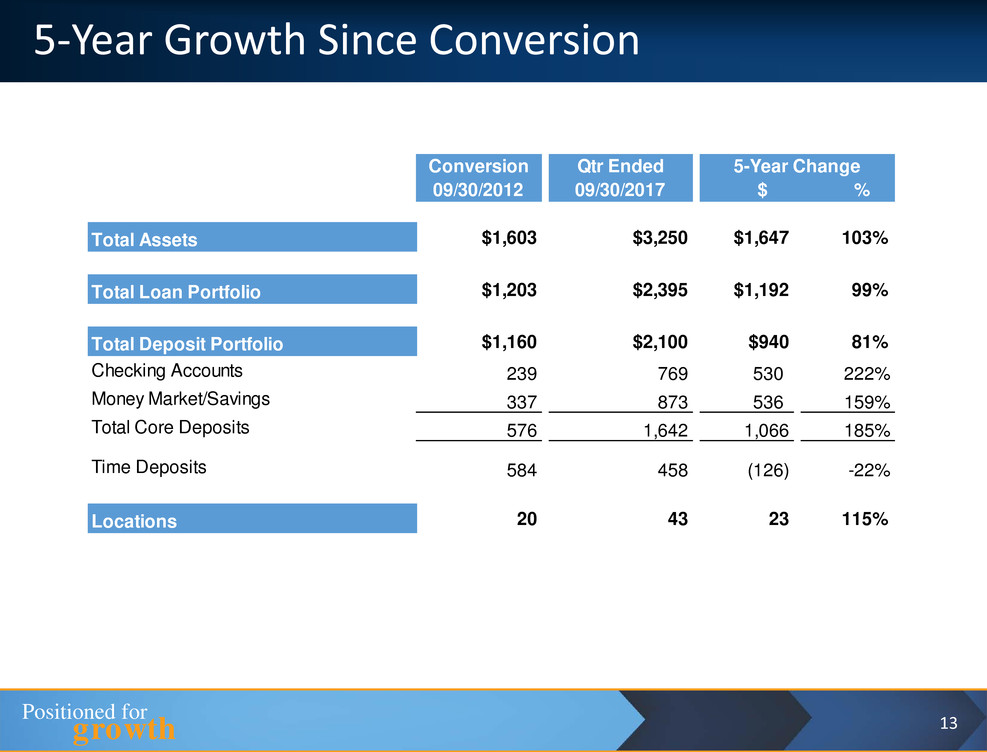
5-Year Growth Since Conversion
Conversion Qtr Ended
09/30/2012 09/30/2017 $ %
Total Assets $1,603 $3,250 $1,647 103%
Total Loan Portfolio $1,203 $2,395 $1,192 99%
Total Deposit Portfolio $1,160 $2,100 $940 81%
Checking Accounts 239 769 530 222%
Money Market/Savings 337 873 536 159%
Total Core Deposits 576 1,642 1,066 185%
Time Deposits 584 458 (126) -22%
Locations 20 43 23 115%
5-Year Change

Positioned for
growth 14
Improving Earnings Performance
$9,746
$8,256
$11,784
$12,228
$17,111
$5,595
$22,380
$0.49
$0.44
$0.61
$0.70
$0.94
$1.20
$-
$0.20
$0.40
$0.60
$0.80
$1.00
$1.20
$-
$5,000
$10,000
$15,000
$20,000
$25,000
$30,000
FY 2013 FY 2014 FY 2015 FY 2016 FY 2017 FY 2018
(annualized)
Net Income - Annualized
Net Income - Adjusted
Diluted EPS - Adjusted
Dollars in thousands
See Non-GAAP Disclosure Appendix

Positioned for
growth
100.0
120.0
140.0
160.0
180.0
200.0
220.0
240.0
07/11/12 06/30/13 06/30/14 06/30/15 06/30/2016 06/30/2017 09/30/2017
Total Return Performance
HomeTrust Bancshares, Inc. NASDAQ Bank NASDAQ Composite
Total Shareholder Return
15

Positioned for
growth 16
Fiscal Year Ended June 30, 2017 Highlights
A. As Reported 06/30/2017 06/30/2016 Amount Percent
Net income 11,847$ 11,456$ 391$ 3%
EPS - diluted 0.65$ 0.65$ -$ 0%
ROA 0.40% 0.42% (0.02%) -5%
Net interest margin (tax equivalent) 3.49% 3.37% 0.12% 3.56%
Noninterest income 15,440$ 13,503$ 1,937$ 14%
B. Core Earnings (1)
Net income 17,111$ 12,228$ 4,883$ 40%
EPS - diluted 0.94$ 0.70$ 0.24$ 34%
ROA 0.58% 0.45% 0.13% 29%
C. Organic Loan Growth
$ Growth 242,501$ 74,757$ 167,744$ 224%
% Growth 14.40% 4.43% 9.97% 225%
Loan originations:
Commercial portfolio 541,515$ 336,655$ 204,860$ 61%
Retail portfolio 305,395 266,512 38,883 15%
1-4 family originated for sale 134,258 91,963 42,295 46%
Total loan originations 981,168$ 695,130$ 286,038 41%
Year Ended Change
(Dollars in thousands, except per share amounts)
Source: Company documents previously filed with the SEC
(1) See Non-GAAP Disclosure Appendix.

Positioned for
growth 17
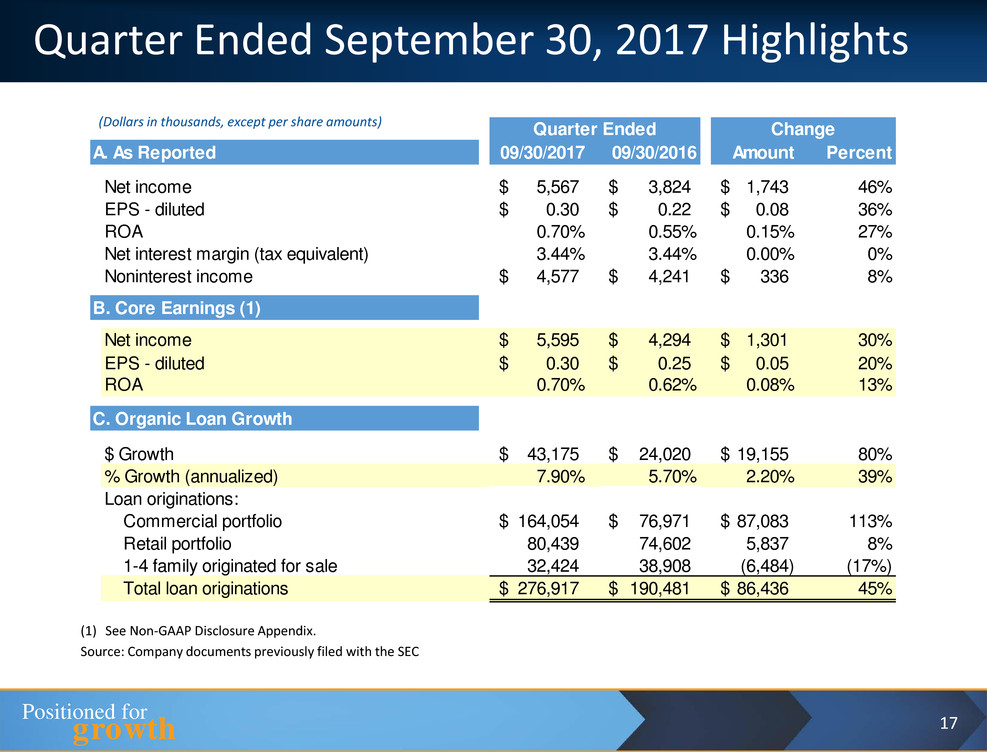
Quarter Ended September 30, 2017 Highlights
(Dollars in thousands, except per share amounts)
A. As Reported 09/30/2017 09/30/2016 Amount Percent
Net income 5,567$ 3,824$ 1,743$ 46%
EPS - diluted 0.30$ 0.22$ 0.08$ 36%
ROA 0.70% 0.55% 0.15% 27%
Net interest margin (tax equivalent) 3.44% 3.44% 0.00% 0%
Noninterest income 4,577$ 4,241$ 336$ 8%
B. Core Earnings (1)
Net income 5,595$ 4,294$ 1,301$ 30%
EPS - diluted 0.30$ 0.25$ 0.05$ 20%
ROA 0.70% 0.62% 0.08% 13%
C. Organic Loan Growth
$ Growth 43,175$ 24,020$ 19,155$ 80%
% Growth (annualized) 7.90% 5.70% 2.20% 39%
Loan originations:
Commercial portfolio 164,054$ 76,971$ 87,083$ 113%
Retail portfolio 80,439 74,602 5,837 8%
1-4 family originated for sale 32,424 38,908 (6,484) (17%)
Total loan originations 276,917$ 190,481$ 86,436$ 45%
Quarter Ended Change
(1) See Non-GAAP Disclosure Appendix.
Source: Company documents previously filed with the SEC

Positioned for
growth 18
Market Price and Price to Tangible Book
$16.96
$15.77
$16.76
$18.50
$24.40
$25.65
96.1%
89.2%
92.8% 97.1%
126.0%
129.4%
0.0%
20.0%
40.0%
60.0%
80.0%
100.0%
120.0%
140.0%
$-
$5.0
$10.0
$15.0
$20.0
$25.0
$30.0
06/30/2013 06/30/2014 06/30/2015 06/30/2016 06/30/2017 09/30/2017
Market Price per Share
Price to Tangible Book

Positioned for
growth
Transitioning to a High Performing Community Bank
19
Phase I: Created a Foundation For Growth
Phase II: Executing Our Strategic Plan with a Sense of Urgency
Transitioning to a High Performing Community Bank
Consistently improving performance
Creating value for shareholders

Positioned for
growth
Looking Ahead
The cumulative impact of our team’s
work over the past five years has
positioned HomeTrust to make fiscal
2018 an inflection point for our financial
performance and stockholder returns.
20

Positioned for
growth
Questions and Comments
In accordance with the Rules of Conduct, each shareholder
or proxyholder has an opportunity to ask questions or make
comments.
After you are recognized, proceed to the microphone.
Please identify yourself by stating your name and whether
you are a stockholder or hold the proxy for a shareholder.
In order to provide all shareholders an opportunity to
speak, questions and/or comments should be limited
to two minutes per shareholder.
Please direct all questions and comments to the Chairman,
President and Chief Executive Officer.
21

Positioned for
growth
Thank You Shareholders and
HomeTrust Team!

Positioned for
growth
Non-GAAP Disclosure Appendix
23

Positioned for
growth
In addition to results presented in accordance with generally accepted accounting principles utilized in the
United States ("GAAP"), this presentation contains certain non-GAAP financial measures, which include:
tangible book value per share, net income excluding merger-related expenses, nonrecurring state tax
expense, gain from the sale of premises and equipment, and impairment charges for branch
consolidation; and return on assets ("ROA") and earnings per share ("EPS") excluding merger expenses,
nonrecurring state tax expense, gain from the sale of premises and equipment, and impairment charges
for branch consolidation. The Company believes these non-GAAP financial measures and ratios as
presented are useful for both investors and management to understand the effects of certain items and
provides an alternative view of the Company's performance over time and in comparison to the
Company's competitors.
Management elected to obtain additional FHLB borrowings beginning in November 2014 as part of a plan
to increase net interest income. The Company believes that showing the effects of the additional
borrowings on net interest income and net interest margins is useful to both management and investors
as these measures are commonly used to measure financial institutions performance and performance
against peers.
The Company believes these measures facilitate comparison of the quality and composition of the
Company's capital and earnings ability over time and in comparison to its competitors. These non-GAAP
measures have inherent limitations, are not required to be uniformly applied and are not audited. They
should not be considered in isolation or as a substitute for total stockholders' equity or operating results
determined in accordance with GAAP. These non-GAAP measures may not be comparable to similarly
titled measures reported by other companies.
24
Non-GAAP Disclosure Reconciliation

Positioned for
growth 25
Non-GAAP Disclosure Reconciliation
Set forth below is a reconciliation to GAAP of tangible book value, tangible book value per share, and
share price to tangible book:

Positioned for
growth 26
Non-GAAP Disclosure Reconciliation
Set forth to the right is a reconciliation
to GAAP net income, ROA, and EPS as
adjusted to exclude merger-related
expenses, nonrecurring state tax
expense, gain on sale of premises and
equipment, and impairment charge for
branch consolidation:

Positioned for
growth 27
Non-GAAP Disclosure Reconciliation
Set forth below is a reconciliation to GAAP net income and EPS as adjusted to exclude merger-related expenses, nonrecurring state tax
expense, gain on sale of premises and equipment, loan loss provision (recovery), and impairment charge for branch consolidation:
