Attached files
| file | filename |
|---|---|
| 8-K - SIGNET JEWELERS LIMITED 8-K - SIGNET JEWELERS LTD | a51719393.htm |
| EX-99.1 - EXHIBIT 99.1 - SIGNET JEWELERS LTD | a51719393ex99_1.htm |
|
Exhibit 99.2
|

Third Quarter Fiscal 2018 ResultsTuesday, November 21, 2017

Forward Looking Statements & Other Disclosure Matters Forward-Looking Statements – This presentation contains statements which are forward-looking statements within the meaning of the Private Securities Litigation Reform Act of 1995. These statements, based upon management’s beliefs and expectations as well as on assumptions made by and data currently available to management, appear in a number of places throughout this document and include statements regarding, among other things, Signet’s results of operation, financial condition, liquidity, prospects, growth, strategies and the industry in which Signet operates. The use of the words “expects,” “intends,” “anticipates,” “estimates,” “predicts,” “believes,” “should,” “potential,” “may,” “forecast,” “objective,” “plan,” or “target,” and other similar expressions are intended to identify forward-looking statements. These forward-looking statements are not guarantees of future performance and are subject to a number of risks and uncertainties, including but not limited to, the benefits and outsourcing of the credit portfolio sale including future financial and operating results, the timing and expected completion of the second phase of the credit outsourcing, general economic conditions, the impact of weather-related incidents on Signet’s business, the benefits and integration of R2Net, regulatory changes following the United Kingdom’s announcement to exit from the European Union, a decline in consumer spending, the merchandising, pricing and inventory policies followed by Signet, the reputation of Signet and its brands, the level of competition in the jewelry sector, the cost and availability of diamonds, gold and other precious metals, regulations relating to customer credit, seasonality of Signet’s business, financial market risks, deterioration in customers’ financial condition, exchange rate fluctuations, changes in Signet’s credit rating, changes in consumer attitudes regarding jewelry, management of social, ethical and environmental risks, security breaches and other disruptions to Signet’s information technology infrastructure and databases, inadequacy in and disruptions to internal controls and systems, changes in assumptions used in making accounting estimates relating to items such as extended service plans and pensions, risks related to Signet being a Bermuda corporation, the impact of the acquisition of Zale Corporation on relationships, including with employees, suppliers, customers and competitors, and our ability to successfully integrate Zale Corporation’s operations and to realize synergies from the transaction.For a discussion of these and other risks and uncertainties which could cause actual results to differ materially from those expressed in any forward-looking statement, see the “Risk Factors” section of Signet's Fiscal 2017 Annual Report on Form 10-K filed with the SEC on March 16, 2017 and quarterly reports on Form 10-Q. Signet undertakes no obligation to update or revise any forward-looking statements to reflect subsequent events or circumstances, except as required by law.Non-GAAP Measures – Certain financial measures used during this presentation are considered to be “Non-GAAP Financial Measures.” For a reconciliation of these to the most directly comparable GAAP financial measures, please refer to slide 12.
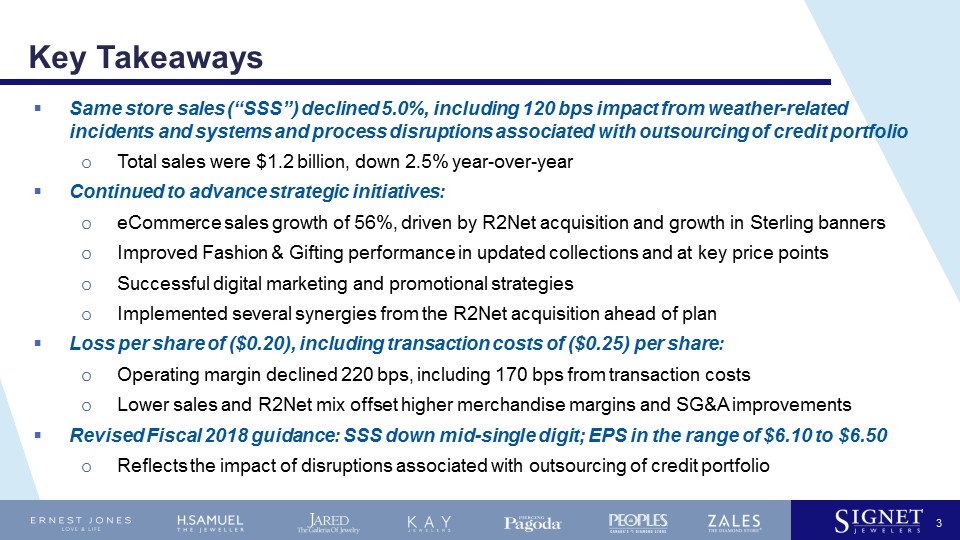
Key Takeaways Same store sales (“SSS”) declined 5.0%, including 120 bps impact from weather-related incidents and systems and process disruptions associated with outsourcing of credit portfolioTotal sales were $1.2 billion, down 2.5% year-over-yearContinued to advance strategic initiatives: eCommerce sales growth of 56%, driven by R2Net acquisition and growth in Sterling bannersImproved Fashion & Gifting performance in updated collections and at key price pointsSuccessful digital marketing and promotional strategiesImplemented several synergies from the R2Net acquisition ahead of planLoss per share of ($0.20), including transaction costs of ($0.25) per share:Operating margin declined 220 bps, including 170 bps from transaction costsLower sales and R2Net mix offset higher merchandise margins and SG&A improvementsRevised Fiscal 2018 guidance: SSS down mid-single digit; EPS in the range of $6.10 to $6.50Reflects the impact of disruptions associated with outsourcing of credit portfolio 3

Progress on Strategic Priorities 4 Streamlined promotional strategies and customer targetingEnhanced Fashion category assortmentIncreased focus on digital and social media marketingLaunched Data Management PlatformBuilding first-ever Customer Data Analytics team Customer First Strong eCommerce growth driven by R2Net acquisition and enhancements to Sterling websitesZale Hybris platform launchR2Net integration progressing well; Q4 implementations include:Diamond imagery and content technology in Jared stores24/7 customer chat on Jared.com Design-A-RingRing Try-on App for Kay OmniChannel Disciplined cost reductions driving improvement in SGA rateLowered inventory levels driven by working capital managementSimplifying and streamlining our processesDistribution center consolidation nearing completion Agility and Efficiency
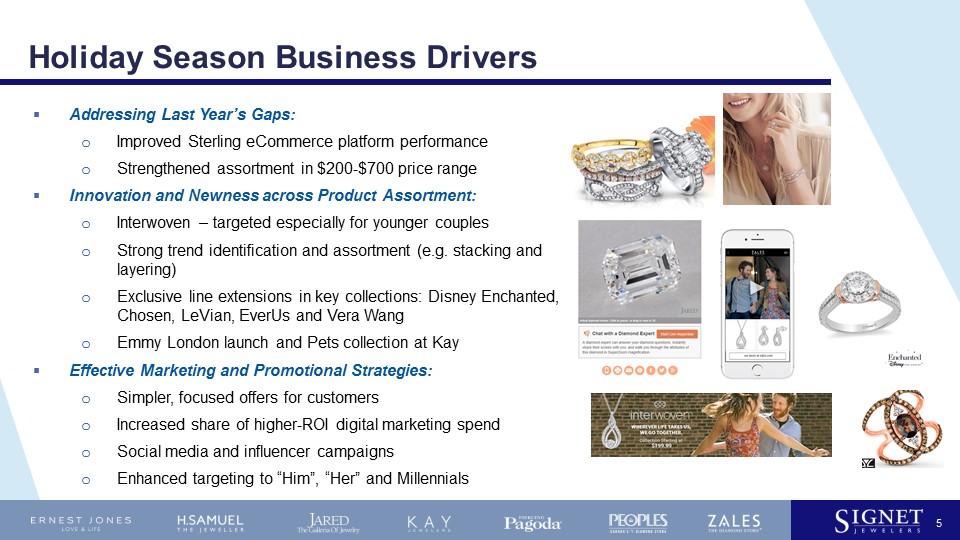
Holiday Season Business Drivers 5 Addressing Last Year’s Gaps:Improved Sterling eCommerce platform performance Strengthened assortment in $200-$700 price rangeInnovation and Newness across Product Assortment:Interwoven – targeted especially for younger couplesStrong trend identification and assortment (e.g. stacking and layering)Exclusive line extensions in key collections: Disney Enchanted, Chosen, LeVian, EverUs and Vera WangEmmy London launch and Pets collection at Kay Effective Marketing and Promotional Strategies:Simpler, focused offers for customersIncreased share of higher-ROI digital marketing spendSocial media and influencer campaignsEnhanced targeting to “Him”, “Her” and Millennials
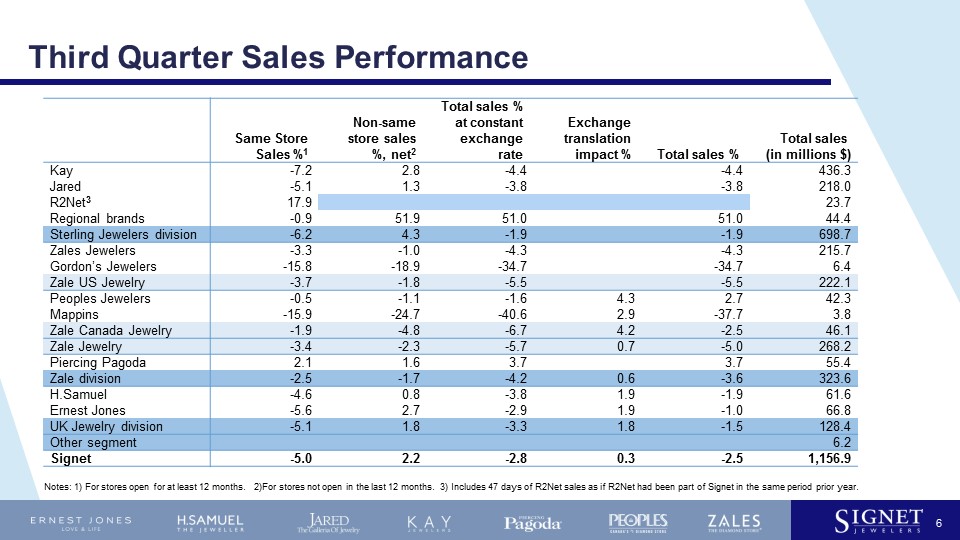
Third Quarter Sales Performance 6 Notes: 1) For stores open for at least 12 months. 2)For stores not open in the last 12 months. 3) Includes 47 days of R2Net sales as if R2Net had been part of Signet in the same period prior year. Same Store Sales %1 Non-same store sales %, net2 Total sales % at constant exchange rate Exchange translation impact % Total sales % Total sales(in millions $) Kay -7.2 2.8 -4.4 -4.4 436.3 Jared -5.1 1.3 -3.8 -3.8 218.0 R2Net3 17.9 23.7 Regional brands -0.9 51.9 51.0 51.0 44.4 Sterling Jewelers division -6.2 4.3 -1.9 -1.9 698.7 Zales Jewelers -3.3 -1.0 -4.3 -4.3 215.7 Gordon’s Jewelers -15.8 -18.9 -34.7 -34.7 6.4 Zale US Jewelry -3.7 -1.8 -5.5 -5.5 222.1 Peoples Jewelers -0.5 -1.1 -1.6 4.3 2.7 42.3 Mappins -15.9 -24.7 -40.6 2.9 -37.7 3.8 Zale Canada Jewelry -1.9 -4.8 -6.7 4.2 -2.5 46.1 Zale Jewelry -3.4 -2.3 -5.7 0.7 -5.0 268.2 Piercing Pagoda 2.1 1.6 3.7 3.7 55.4 Zale division -2.5 -1.7 -4.2 0.6 -3.6 323.6 H.Samuel -4.6 0.8 -3.8 1.9 -1.9 61.6 Ernest Jones -5.6 2.7 -2.9 1.9 -1.0 66.8 UK Jewelry division -5.1 1.8 -3.3 1.8 -1.5 128.4 Other segment 6.2 Signet -5.0 2.2 -2.8 0.3 -2.5 1,156.9

Income Statement Highlights (Percentage of Sales) 3Q Fiscal 2018 3Q Fiscal 2017 Difference Gross margin 27.8% 29.5% (170) bps SG&A 32.5% 32.6% (10) bps Credit transaction, net (1.1%) - (110) bps Other operating income 6.3% 5.8% 50 bps Operating income 0.5% 2.7% (220) bps Earnings (loss) per share ($0.20) $0.20 ($0.40) 7
Balance Sheet and Cash Flow Prudent working capital managementInventory $2.47 billion, down 6.9%, while Q3 total sales decreased 2.5%Net accounts receivable $640 million, compared to $1.6 billion LY, reflecting sale of prime accounts receivable of $960 millionFree cash flow YTD $1.3 billion, up $1.2 billion, reflecting sale of prime accounts receivableRepayment of $600 million ABS associated with the sale of prime accounts receivable 8
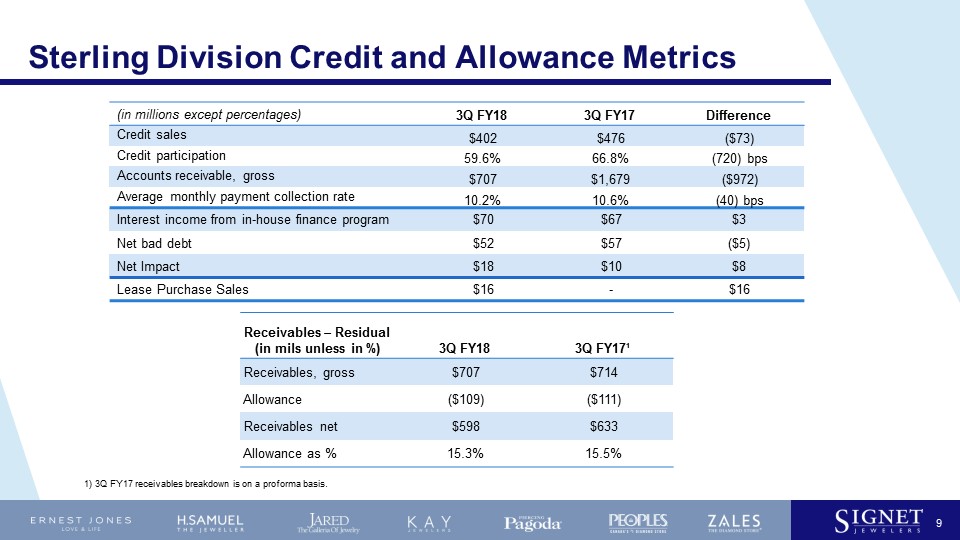
Sterling Division Credit and Allowance Metrics 9 (in millions except percentages) 3Q FY18 3Q FY17 Difference Credit sales $402 $476 ($73) Credit participation 59.6% 66.8% (720) bps Accounts receivable, gross $707 $1,679 ($972) Average monthly payment collection rate 10.2% 10.6% (40) bps Interest income from in-house finance program $70 $67 $3 Net bad debt $52 $57 ($5) Net Impact $18 $10 $8 Lease Purchase Sales $16 - $16 Receivables – Residual (in mils unless in %) 3Q FY18 3Q FY17¹ Receivables, gross $707 $714 Allowance ($109) ($111) Receivables net $598 $633 Allowance as % 15.3% 15.5% 1) 3Q FY17 receivables breakdown is on a proforma basis.
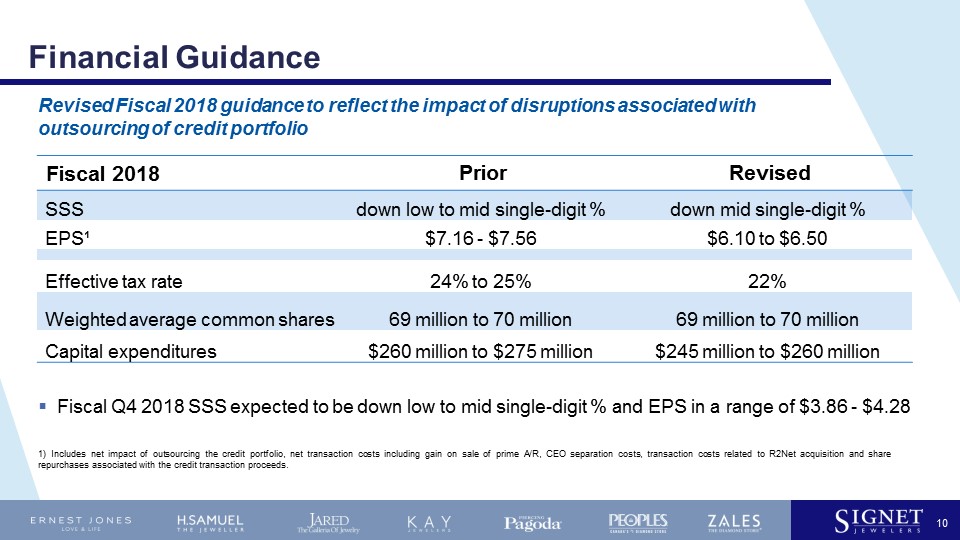
Financial Guidance 10 1) Includes net impact of outsourcing the credit portfolio, net transaction costs including gain on sale of prime A/R, CEO separation costs, transaction costs related to R2Net acquisition and share repurchases associated with the credit transaction proceeds. Fiscal 2018 Prior Revised SSS down low to mid single-digit % down mid single-digit % EPS¹ $7.16 - $7.56 $6.10 to $6.50 Effective tax rate 24% to 25% 22% Weighted average common shares 69 million to 70 million 69 million to 70 million Capital expenditures $260 million to $275 million $245 million to $260 million Revised Fiscal 2018 guidance to reflect the impact of disruptions associated with outsourcing of credit portfolio Fiscal Q4 2018 SSS expected to be down low to mid single-digit % and EPS in a range of $3.86 - $4.28

Appendix
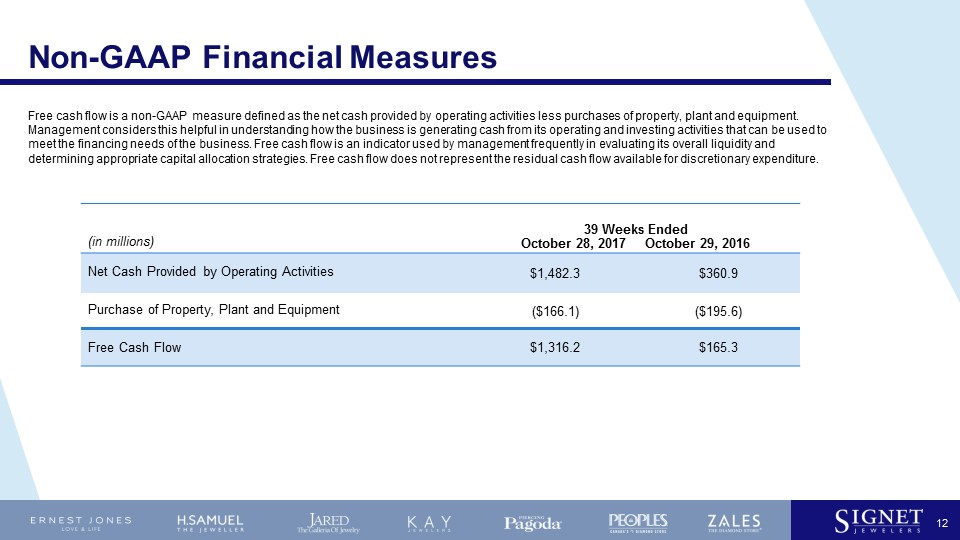
Non-GAAP Financial Measures 12 (in millions) 39 Weeks EndedOctober 28, 2017 October 29, 2016 Net Cash Provided by Operating Activities $1,482.3 $360.9 Purchase of Property, Plant and Equipment ($166.1) ($195.6) Free Cash Flow $1,316.2 $165.3 Free cash flow is a non-GAAP measure defined as the net cash provided by operating activities less purchases of property, plant and equipment. Management considers this helpful in understanding how the business is generating cash from its operating and investing activities that can be used to meet the financing needs of the business. Free cash flow is an indicator used by management frequently in evaluating its overall liquidity and determining appropriate capital allocation strategies. Free cash flow does not represent the residual cash flow available for discretionary expenditure.

Signet Jewelers Ltd.