Attached files
| file | filename |
|---|---|
| EX-99.2 - EXHIBIT 99.2 - Hospitality Investors Trust, Inc. | tv480025_ex99-2.htm |
| 8-K - 8-K - Hospitality Investors Trust, Inc. | tv480025_8k.htm |
Exhibit 99.1

American Realty Capital Hospitality Trust, Inc. Q3 2017 Investor Presentation November 21, 2017
Risk Factors Investing in our common stock involves a degree of risk . See the section entitled “Risk Factors” in the most recent Annual Report on Form 10 - K of Hospitality Investors Trust, Inc . (“HIT REIT,” the “Company” or “we”) for a discussion of the risks which should be considered in connection with the Company . Forward - Looking Statements This presentation may contain forward - looking statements . You can identify forward - looking statements by the use of forward looking terminology such as “believes,” “expects,” “may,” “will,” “would,” “could,” “should,” “seeks,” “intends,” “plans,” “projects,” “estimates,” “anticipates,” “predicts,” or “potential” or the negative of these words and phrases or similar words or phrases . Please review Risk Factors at the end of this presentation for a discussion of risks and uncertainties that could cause actual results to differ materially from our forward - looking statements. Risk Factors 2

3 Q3 2017 Highlights Property Performance ▪ Portfolio Outperformed Industry During Q3’17 and YTD September 2017 (“YTD”) − Pro forma RevPAR growth of +1.8% and +2.9% in Q3’17 and YTD vs. prior year periods, respectively − Our industry chain scales (1) averaged RevPAR growth of +1.3% and +1.3% over these same periods − Total Revenue of $167.2M and $478.0M during Q3’17 and YTD September 2017 − Q3’17 and YTD RevPAR increases have exceeded public select - service peers (+0.4% and - 0.1%) (2) ▪ Total Hotel EBITDA (3) of $52.9M and $143.8M during Q3’17 and YTD September 2017 − Experienced some headwinds on the expense side of the business, as U.S. employment tightening and state minimum wage hikes drove hotel labor costs higher ▪ Our Recently Renovated Hotels Achieved Strong Quarterly Results, which We Believe Continues to Validate our Thesis and Primary Objective of Enhancing Shareholder Value − Wave 1 (28 hotels) (4) : RevPAR growth of +5.4% in Q3’17 vs. Q3’16 − Wave 2 (six hotels) (5) : RevPAR growth of +19.5% in Q3’17 vs. Q3’16 Hotel Capital Investment ▪ Total PIP and Capital Investment for Entire Portfolio of $187M During Company Ownership as of September 2017 − The Company continues to utilize substantially all excess cash for brand - mandated PIP investments − $350M PIP program is approximately 40% complete; re maining PIP program expected to be substantially completed over the next two to three years − Renovations are expected to enhance long - term shareholder value by improving the overall quality and competitive advantage of our hotel portfolio Dispositions & Debt Capital Structure Enhancements ▪ During Q3’17, the Company Entered into Purchase and Sale Agreements to Sell Four Non - Core Hotels for a Contract Purchase Price of $17.4M (6) − If completed, these sales will allow the Company to avoid re - flagging certain of the hotels and generate proceeds that will primarily be used to redeem preferred equity interests held by affiliates of the Whitehall real estate private equity funds sponsored by Goldman Sachs (1) Represents Upscale and Upper Midscale Chain Scales as defined by Smith Travel Research based on previous year’s Average D ail y Rate (2) Reflects average Q3’17 and YTD RevPAR change of Apple Hospitality REIT (APLE), Summit Hotel Properties (INN), RLJ Lodging Tr ust (RLJ), Chatham Lodging Trust (CLDT) based on public filings made by those companies (3) See Exhibit A for further discussion of Hotel EBITDA, which is a non - GAAP financial measure (4) Represents hotels that completed brand - mandated renovations, or Property Improvement Plans (“PIPs”) in Q1 2016 (5) Represents hotels that completed PIPs in Q4 2016 (6) The Company sold two hotels in November 2017 (Hampton Inn Charleston, SC on 11/1/17 and Hampton Inn Columbus, GA on 11/15 /17 ); the remaining two pending asset sales are subject to conditions and there can be no assurance they will be completed on their current terms, or at all
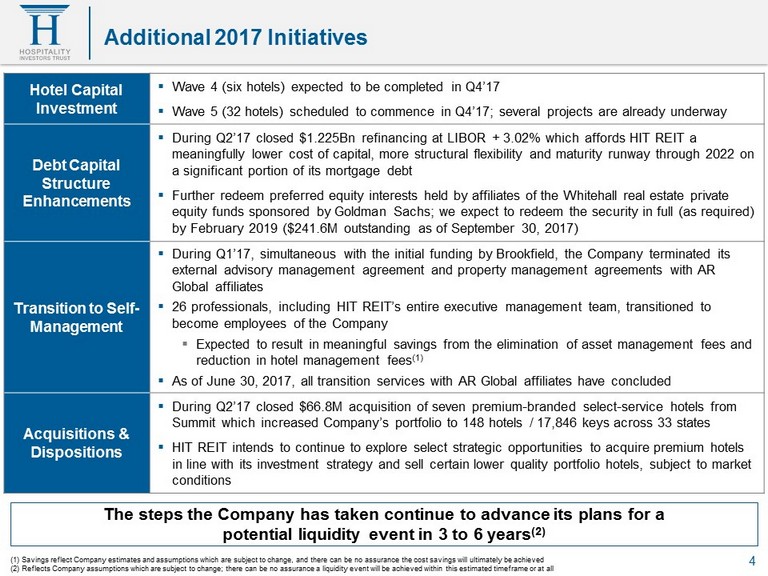
4 Additional 2017 Initiatives Hotel Capital Investment ▪ Wave 4 (six hotels) expected to be completed in Q4’17 ▪ Wave 5 (32 hotels) scheduled to commence in Q4’17; several projects are already underway Debt Capital Structure Enhancements ▪ During Q2’17 closed $1.225Bn refinancing at LIBOR + 3.02% which affords HIT REIT a meaningfully lower cost of capital, more structural flexibility and maturity runway through 2022 on a significant portion of its mortgage debt ▪ Further redeem preferred equity interests held by affiliates of the Whitehall real estate private equity funds sponsored by Goldman Sachs; we expect to redeem the security in full (as required) by February 2019 ($241.6M outstanding as of September 30, 2017) Transition to Self - Management ▪ During Q1’17 , simultaneous with the initial funding by Brookfield, the Company terminated its external advisory management agreement and property management agreements with AR Global affiliates ▪ 26 professionals, including HIT REIT’s entire executive management team, transitioned to become employees of the Company ▪ E xpected to result in meaningful savings from the elimination of asset management fees and reduction in hotel management fees (1) ▪ As of June 30, 2017, all transition services with AR Global affiliates have concluded Acquisitions & Dispositions ▪ During Q2’17 closed $66.8M acquisition of seven premium - branded select - service hotels from Summit which increased Company’s portfolio to 148 hotels / 17,846 keys across 33 states ▪ HIT REIT intends to continue to explore select strategic opportunities to acquire premium hotels in line with its investment strategy and sell certain lower quality portfolio hotels, subject to market conditions (1) Savings reflect Company estimates and assumptions which are subject to change, and there can be no assurance the cost sav ing s will ultimately be achieved (2) Reflects Company assumptions which are subject to change; there can be no assurance a liquidity event will be achieved wi thi n this estimated timeframe or at all The steps the Company has taken continue to advance its plans for a potential liquidity event in 3 to 6 years (2)
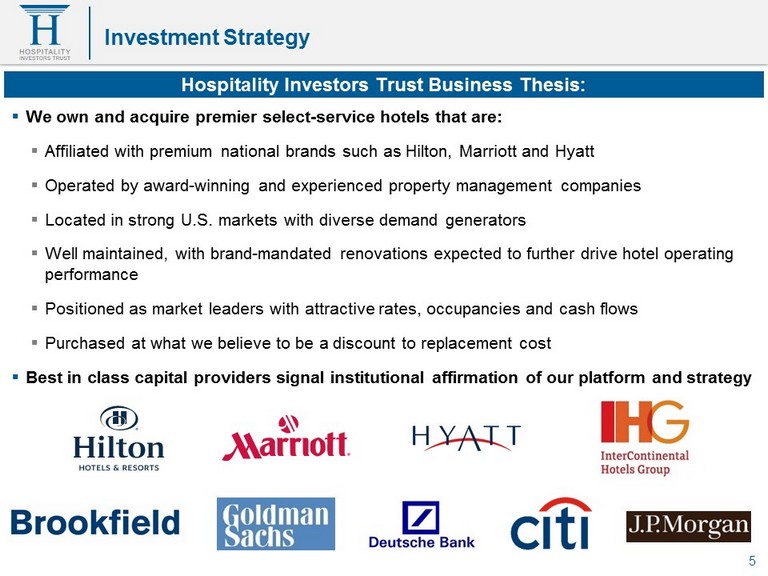
▪ We own and acquire premier select - service hotels that are: ▪ Affiliated with premium national brands such as Hilton, Marriott and Hyatt ▪ Operated by award - winning and experienced property management companies ▪ Located in strong U.S. markets with diverse demand generators ▪ Well maintained, with brand - mandated renovations expected to further drive hotel operating performance ▪ Positioned as market leaders with attractive rates, occupancies and cash flows ▪ Purchased at what we believe to be a discount to replacement cost ▪ Best in class capital providers signal institutional affirmation of our platform and strategy Hospitality Investors Trust Business Thesis: 5 Investment Strategy

6 Validation of our Thesis Significant Performance Improvement at our Recently Renovated Hotels ▪ Our 34 hotels that completed brand - mandated PIPs during Q1’16 (Wave 1) and Q4’16 (Wave 2), respectively, have experienced a significant uptick in operating performance and achieved Q3’17 strong results : ▪ Wave 1 (28 hotels): RevPAR increased by +5.4% ▪ Wave 2 (six hotels): RevPAR increased by +19.5% Q3 2017 Operating Performance: 34 Recently Renovated Hotels Wave 1 Hotels (28) Wave 2 Hotels (6) ($ in millions, except ADR & RevPAR) Q3 2017 Q3 2016 Growth Q3 2017 Q3 2016 Growth Occupancy 83.7% 80.3% 4.3% 73.1% 63.3% 15.5% ADR $124.33 $123.05 1.0% $108.94 $105.25 3.5% RevPAR $104.11 $98.78 5.4% $79.66 $66.65 19.5%
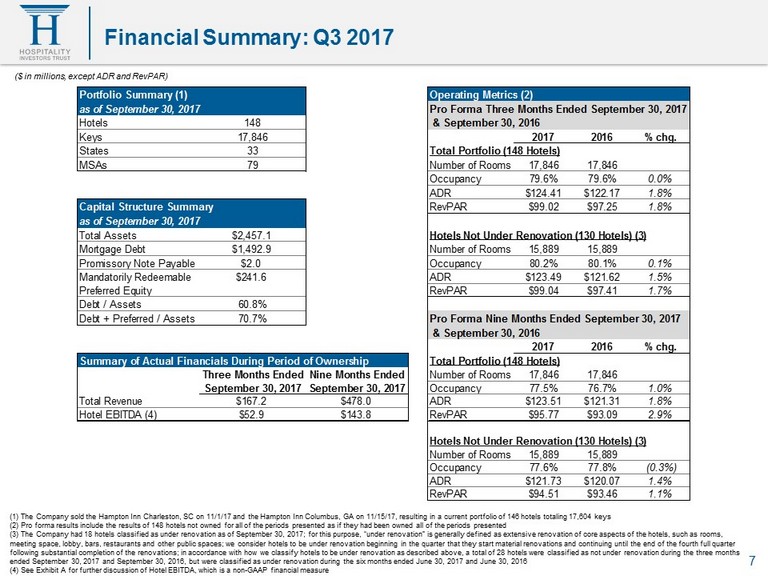
($ in millions, except ADR and RevPAR) (1) The Company sold the Hampton Inn Charleston, SC on 11/1/17 and the Hampton Inn Columbus, GA on 11/15/17, resulting in a c urr ent portfolio of 146 hotels totaling 17,604 keys (2) Pro forma results include the results of 148 hotels not owned for all of the periods presented as if they had been owned all of the periods presented (3) The Company had 18 hotels classified as under renovation as of September 30, 2017; for this purpose, “under renovation” i s g enerally defined as extensive renovation of core aspects of the hotels, such as rooms, meeting space, lobby, bars, restaurants and other public spaces; we consider hotels to be under renovation beginning in the q uar ter that they start material renovations and continuing until the end of the fourth full quarter following substantial completion of the renovations; in accordance with how we classify hotels to be under renovation as desc rib ed above, a total of 28 hotels were classified as not under renovation during the three months ended September 30, 2017 and September 30, 2016, but were classified as under renovation during the six months ended June 30, 20 17 and June 30, 2016 (4) See Exhibit A for further discussion of Hotel EBITDA, which is a non - GAAP financial measure 7 Financial Summary: Q3 2017 Portfolio Summary (1) Operating Metrics (2) as of September 30, 2017 Pro Forma Three Months Ended September 30, 2017 Hotels 148 & September 30, 2016 Keys 17,846 2017 2016 % chg. States 33 Total Portfolio (148 Hotels) MSAs 79 Number of Rooms 17,846 17,846 Occupancy 79.6% 79.6% 0.0% ADR $124.41 $122.17 1.8% Capital Structure Summary RevPAR $99.02 $97.25 1.8% as of September 30, 2017 Total Assets $2,457.1 Hotels Not Under Renovation (130 Hotels) (3) Mortgage Debt $1,492.9 Number of Rooms 15,889 15,889 Promissory Note Payable $2.0 Occupancy 80.2% 80.1% 0.1% Mandatorily Redeemable $241.6 ADR $123.49 $121.62 1.5% Preferred Equity RevPAR $99.04 $97.41 1.7% Debt / Assets 60.8% Debt + Preferred / Assets 70.7% Pro Forma Nine Months Ended September 30, 2017 & September 30, 2016 2017 2016 % chg. Summary of Actual Financials During Period of Ownership Total Portfolio (148 Hotels) Three Months Ended Nine Months Ended Number of Rooms 17,846 17,846 September 30, 2017 September 30, 2017 Occupancy 77.5% 76.7% 1.0% Total Revenue $167.2 $478.0 ADR $123.51 $121.31 1.8% Hotel EBITDA (4) $52.9 $143.8 RevPAR $95.77 $93.09 2.9% Hotels Not Under Renovation (130 Hotels) (3) Number of Rooms 15,889 15,889 Occupancy 77.6% 77.8% (0.3%) ADR $121.73 $120.07 1.4% RevPAR $94.51 $93.46 1.1%
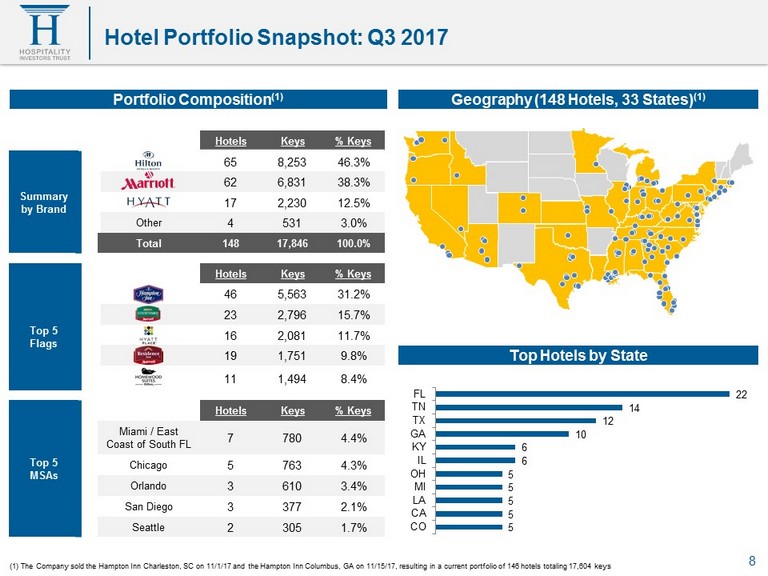
Hotels Keys % Keys Summary by Brand 65 8,253 46.3% 62 6,831 38.3% 17 2,230 12.5% Other 4 531 3.0% Total 148 17,846 100.0% Hotels Keys % Keys Top 5 Flags 46 5,563 31.2% 23 2,796 15.7% 16 2,081 11.7% 19 1,751 9.8% 11 1,494 8.4% Top 5 MSAs Hotels Keys % Keys Miami / East Coast of South FL 7 780 4.4% Chicago 5 763 4.3% Orlando 3 610 3.4% San Diego 3 377 2.1% Seattle 2 305 1.7% Portfolio Composition (1) Geography (148 Hotels, 33 States) (1) Top Hotels by State 22 14 12 10 6 6 5 5 5 5 5 FL TN TX GA KY IL OH MI LA CA CO 8 Hotel Portfolio Snapshot: Q3 2017 (1) The Company sold the Hampton Inn Charleston, SC on 11/1/17 and the Hampton Inn Columbus, GA on 11/15/17, resulting in a c urr ent portfolio of 146 hotels totaling 17,604 keys

9 Company Tender Offer ▪ The Company has commenced a self - tender offer for up to 1,000,000 shares of the Company’s common stock (the “Company Offer”) ▪ The Company Offer is in response to an unsolicited mini - tender by MacKenzie Realty Capital, Inc. (“ MacKenzie ”) for up to 300,000 shares of the Company’s common stock (the “ MacKenzie Offer”) ▪ Both the Company Offer and MacKenzie Offer are for cash in the amount of $6.75 per share, which the Company's Board of Directors believes is well below the current and potential long - term value of the Company’s common stock ▪ Purchase price of $6.75 per share is 48.9% lower than the $13.20 Estimated Per Share NAV published by the Company in June 2017 ▪ The Company’s Board of Directors strongly recommends that stockholders DO NOT tender their shares in the Company Offer or the MacKenzie Offer Note: The foregoing information with respect to the Company Tender Offer is a summary provided for informational purposes onl y a nd is not an offer to buy or the solicitation of an offer to sell any securities of the Company; the full details of the Company Tender Offer, including complete instructions on how to tender shares, are included in the Company’s Offer Materials, which have been published, sent to stockholders, and filed with the Securities and Exchange Commission
10 Conclusion ▪ We continue to see improved operating results and performance pursuant to our hotel capital investments through our PIP program, generating a strong return on capital ▪ PIP program will continue and is expected to improve the competitive position of our hotels, drive performance and ultimately maximize shareholder value ▪ Recently closed $1.225Bn refinancing affords the Company attractive long - term financing and flexibility; lending group offers best in class credit investors who we believe are willing to grow with us in the future ▪ Brookfield’s investment and HIT REIT’s transition to self - management advances the Company’s long - term plan for a potential listing or sale ▪ Board and Management continue to be committed to the Company’s stakeholders and maximizing stakeholder value

See ‘‘Risk Factors’’ beginning on page 9 of the Company’s 2016 Form 10 - K for a discussion of the risks that should be considered in connection with your investment in our common stock, including : • We have entered into agreements with Brookfield Strategic Real Estate Partners II Hospitality REIT II LLC (the “Brookfield Investor”), pursuant to which, among other things, the Brookfield Investor has purchased $135.0 million in units of a new class of limited partner interests in our operating partnership entitled “Class C Units” (the “Convertible Preferred Units”), and the Brookfield Investor has agreed to purchase additional Convertible Preferred Units in an aggregate amount of up to $265.0 million at subsequent closings (“Subsequent Closings”). We may require funds, which may not be available on favorable terms or at all, in addition to our operating cash flow, cash on hand and the proceeds that may be available from sales of Convertible Preferred Units at Subsequent Closings, which are subject to conditions, to meet our capital requirements. • The interests of the Brookfield Investor may conflict with our interests and the interests of our stockholders, and the Brookfield Investor has significant governance and other rights that could be used to control or influence our decisions or actions. • The prior approval rights of the Brookfield Investor will restrict our operational and financial flexibility and could prevent us from taking actions that we believe would be in the best interest of our business. • We no longer pay distributions and there can be no assurance we will resume paying distributions in the future. • We may not be able to make additional investments unless we are able to identify an additional source of capital on favorable terms and obtain prior approval from the Brookfield Investor. • We have a history of operating losses and there can be no assurance that we will ever achieve profitability. • We have terminated our advisory agreement with our former advisor, American Realty Capital Hospitality Advisors, LLC, and other agreements with its affiliates as part of our transition from external management to self - management. As part of this transition, our business may be disrupted and we may become exposed to risks to which we have not historically been exposed. 11 Risk Factors
12 Risk Factors • No public market currently exists, or may ever exist, for shares of our common stock and our shares are, and may continue to be, illiquid. • All of the properties we own are hotels, and we are subject to risks inherent in the hospitality industry. • Increases in interest rates could increase the amount of our debt payments. • We have incurred substantial indebtedness, which may limit our future operational and financial flexibility. • We depend on our operating partnership and its subsidiaries for cash flow and are effectively structurally subordinated in right of payment to their obligations, which include distribution and redemption obligations to holders of Convertible Preferred Units and the preferred equity interests issued by two of our subsidiaries that indirectly own 115 of our hotels. • The amount we would be required to pay holders of Convertible Preferred Units in a fundamental sale transaction may discourage a third party from acquiring us in a manner that might otherwise result in a premium price to our stockholders. • We may fail to realize the expected benefits of our acquisitions of hotels within the anticipated timeframe or at all and we may incur unexpected costs. • Increases in labor costs could adversely affect the profitability of our hotels. • Our operating results will be affected by economic and regulatory changes that have an adverse impact on the real estate market in general, and we may not be profitable or realize growth in the value of our real estate properties. • A prolonged economic slowdown, a lengthy or severe recession or declining real estate values could harm our investments. • Our real estate investments are relatively illiquid and subject to some restrictions on sale, and therefore we may not be able to dispose of properties at the time of our choosing or on favorable terms. • Our failure to continue to qualify to be treated as a real estate investment trust for U.S. federal income tax purposes could have a material adverse effect on us.
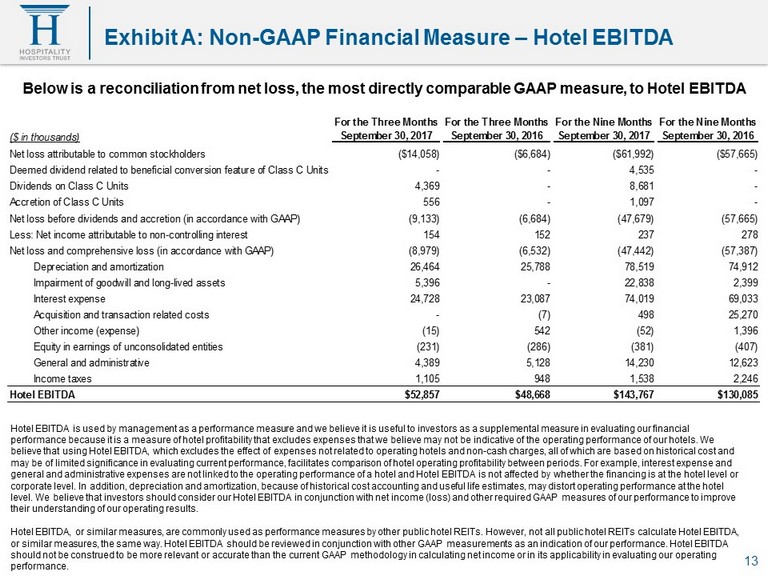
Below is a reconciliation from net loss, the most directly comparable GAAP measure, to Hotel EBITDA Hotel EBITDA is used by management as a performance measure and we believe it is useful to investors as a supplemental measur e i n evaluating our financial performance because it is a measure of hotel profitability that excludes expenses that we believe may not be indicative of th e o perating performance of our hotels. We believe that using Hotel EBITDA, which excludes the effect of expenses not related to operating hotels and non - cash charges, all of which are based on historical cost and may be of limited significance in evaluating current performance, facilitates comparison of hotel operating profitability bet wee n periods. For example, interest expense and general and administrative expenses are not linked to the operating performance of a hotel and Hotel EBITDA is not affected b y w hether the financing is at the hotel level or corporate level. In addition, depreciation and amortization, because of historical cost accounting and useful life estimates, ma y distort operating performance at the hotel level. We believe that investors should consider our Hotel EBITDA in conjunction with net income (loss) and other required GA AP measures of our performance to improve their understanding of our operating results. Hotel EBITDA, or similar measures, are commonly used as performance measures by other public hotel REITs. However, not all pu bli c hotel REITs calculate Hotel EBITDA, or similar measures, the same way. Hotel EBITDA should be reviewed in conjunction with other GAAP measurements as an indicati on of our performance. Hotel EBITDA should not be construed to be more relevant or accurate than the current GAAP methodology in calculating net income or in its ap plicability in evaluating our operating performance. 13 Exhibit A: Non - GAAP Financial Measure – Hotel EBITDA For the Three Months For the Three Months For the Nine Months For the Nine Months ($ in thousands) September 30, 2017 September 30, 2016 September 30, 2017 September 30, 2016 Net loss attributable to common stockholders ($14,058) ($6,684) ($61,992) ($57,665) Deemed dividend related to beneficial conversion feature of Class C Units - - 4,535 - Dividends on Class C Units 4,369 - 8,681 - Accretion of Class C Units 556 - 1,097 - Net loss before dividends and accretion (in accordance with GAAP) (9,133) (6,684) (47,679) (57,665) Less: Net income attributable to non-controlling interest 154 152 237 278 Net loss and comprehensive loss (in accordance with GAAP) (8,979) (6,532) (47,442) (57,387) Depreciation and amortization 26,464 25,788 78,519 74,912 Impairment of goodwill and long-lived assets 5,396 - 22,838 2,399 Interest expense 24,728 23,087 74,019 69,033 Acquisition and transaction related costs - (7) 498 25,270 Other income (expense) (15) 542 (52) 1,396 Equity in earnings of unconsolidated entities (231) (286) (381) (407) General and administrative 4,389 5,128 14,230 12,623 Income taxes 1,105 948 1,538 2,246 Hotel EBITDA $52,857 $48,668 $143,767 $130,085 13