Attached files
| file | filename |
|---|---|
| 8-K - 8-K - GUGGENHEIM CREDIT INCOME FUND 2019 | gcif-iform8xk2017q3overview.htm |
 | Exhibit 99.1 | |
GUGGENHEIM CREDIT INCOME FUND
THIRD QUARTER 2017 OVERVIEW
This overview contains details about the portfolio and operating results for the quarter ended September 30, 2017 of Guggenheim Credit Income Fund ("GCIF" or the "Company") and its feeder funds, Guggenheim Credit Income Fund — I ("GCIF - I") and Guggenheim Credit Income Fund 2016 T ("GCIF 2016 T"). This overview should be read in conjunction with the GCIF - I and GCIF 2016 T Quarterly Reports on Form 10-Q, which each incorporate the GCIF Quarterly Report on Form 10-Q, as filed with the U.S. Securities and Exchange Commission (the "SEC") on November 9, 2017.
Highlights
• | On August 10, 2017, GCIF’s Board of Trustees accepted the resignation of Carey Credit Advisors, LLC as GCIF’s investment advisor and appointed Guggenheim Partners Investment Management, LLC ("Guggenheim") as GCIF’s interim advisor, effective as of September 11, 2017. Subsequently, on October 20, 2017, shareholders approved a new investment advisory agreement between Guggenheim and GCIF, effective as of that date. Under the new investment advisory agreement, Guggenheim lowered base management fees to an annual rate of 1.75% of average gross assets, resulting in savings that will directly benefit shareholders. For further details please see Company SEC filings at www.sec.gov. |
• | As of September 30, 2017, GCIF had total assets of $407 million, compared to total assets of $305 million as of December 31, 2016. |
• | During the three months ended September 30, 2017, GCIF invested $33 million, 57% of which was in directly originated debt investments, with sales and paydowns totaling $30 million for the same period. |
• | GCIF's portfolio investments at fair value totaled $381 million as of September 30, 2017, of which 96% was in senior debt investments. The portfolio consisted of 99 investments across 68 portfolio companies. |
• | GCIF's gross portfolio yield as of September 30, 2017 was 8.8%, compared to 8.2% as of December 31, 2016.1 |
• | As of September 30, 2017, GCIF had one debt investment on non-accrual status, which represented 0.8% of total investments on both a fair value basis and an amortized cost basis. |
• | Please see below for feeder fund specific highlights for the period ended September 30, 2017: |
Nine Months Ended September 30, 2017 | ||||
GCIF - I 3 | GCIF 2016 T 4 | |||
Distributions paid per share | $1.36 | $0.48 | ||
Total investment return - net asset value (non-annualized)2 | 5.66 | % | 5.27 | % |
Total assets ($ in thousands) | $41,184 | $162,474 | ||
Net asset value per share | $25.84 | $9.11 | ||
Gross proceeds from offering ($ in thousands) | $21,174 | $49,197 | ||
________________________
(1) Weighted average effective yield is calculated as the effective yield of each investment and weighted by its amortized cost as compared to the aggregate amortized cost of all investments. Effective yield is the return earned on investments net of any discount, premium, or issuance costs. Effective portfolio yield for the total debt portfolio is calculated before considering the impact of leverage or any operating expenses, and cash, restricted cash, non-income producing assets and equity investments are excluded.
(2) Total investment return-net asset value is a measure of the change in total value for shareholders who held the company’s common shares at the beginning and end of the period, including distributions declared during the period. Total investment return-net asset value is based on (i) net asset value per share on the first day of the period, (ii) the net asset value per share on the last day of the period, plus any shares issued in connection with the reinvestment of monthly distributions, and (iii) distributions payable relating to the ownership of shares, if any, on the last day of the period. The total investment return-net asset value calculation assumes that (i) monthly cash distributions are reinvested in accordance with the Company’s distribution reinvestment plan and (ii) the shares issued pursuant to the distribution reinvestment plan are issued at the then current public offering price, net of sales load, on each monthly distribution payment date. Since there is no public market for the company’s shares, terminal market value per share is assumed to be equal to net asset value per share on the last day of the period presented. Investment performance is presented without regard to sales load that may be incurred by shareholders in the purchase of the Company’s common shares. The Company’s performance changes over time and currently may be different than that shown above. Past performance is no guarantee of future results. Total investment return-net asset value is not annualized.
(3) In connection with the current transition of the investment advisory function of GCIF to Guggenheim, GCIF - I's current offering has been temporarily suspended, effective August 23, 2017.
(4) GCIF 2016 T concluded its public offering on April 28, 2017, having raised $164 million since inception.
- 1 -
Business Environment
High-yield bonds and leveraged loans delivered their seventh consecutive quarter of positive returns, amid tighter spreads and still-improving credit conditions. High-yield corporate bonds posted 6.5 percent year-to-date returns through the end of the third quarter, while bank loans returned 3.0 percent.
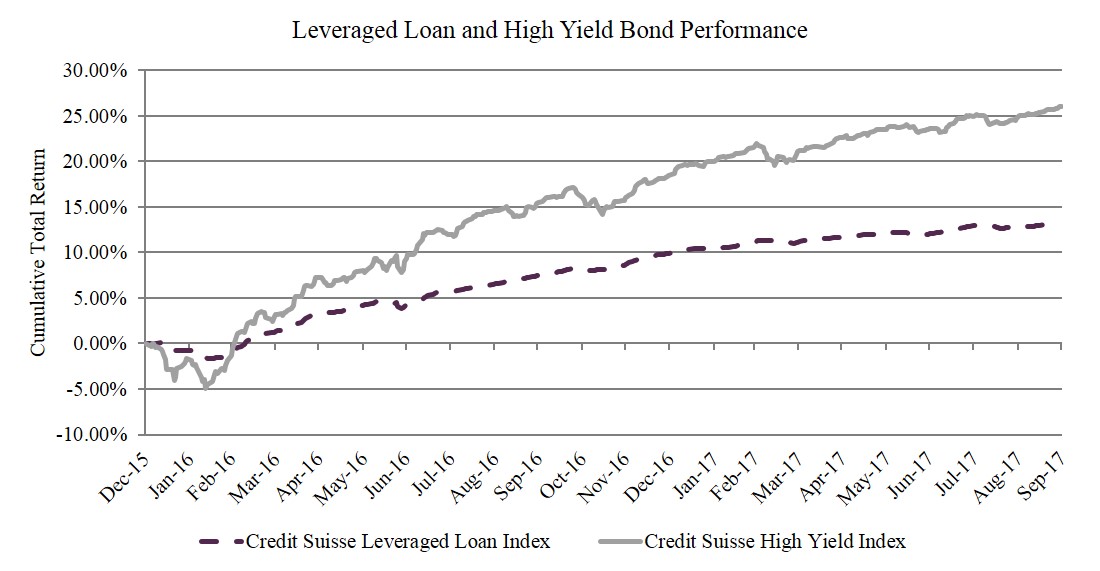
Despite mixed mutual fund flows over the quarter, demand for below investment grade credit remains intact, as demonstrated by healthy new issue activity and rising prices on the syndicated market. On the borrower side, the positive earnings growth seen is mitigating the effect on leverage ratios of borrowers raising more debt. Economic tailwinds have continued to support profitability growth in the below investment grade asset classes, driving leverage levels of existing issuers in the high yield bond market lower for a fifth consecutive quarter according to Bank of America Merrill Lynch research. In the middle market, a strong technical backdrop has allowed borrowers to push leverage levels modestly higher on new issue transactions throughout the year according to LCD.
While broad fundamental improvements, such as leverage ratios, on the surface have supported spread tightening in 2017, we still see weak credits beneath the surface. When borrowers do not maintain sufficient cash on their balance sheets, operating cash flows, or net debt as compared to interest expenses, there is increased risk that they will not be able to service interest expenses should market conditions worsen. Looking ahead, the strengthening economy and the unabated investor need for income should underpin positive performance in high yield and bank loans, but the chasm between strong and weak credits grows as borrowers take on increasing levels of debt. In the current market environment, with spreads continually tightening and high yield and bank loans trading above par in many instances, evaluating credit metrics of high-yield borrowers on a more granular level is increasingly important.
We believe that, in this credit environment, experienced credit managers are critical to the success of credit investors. While we remain constructive on credit and will be opportunistic during times of technical dislocations in the syndicated markets, we believe that direct origination will be the primary source of opportunity in the near term. We believe that GCIF's Advisor’s extensive resources in credit research and direct origination capabilities will allow us to continue investing in new assets with attractive yields while remaining in the senior credit position of portfolio companies' capital structures to protect against the downside when the market conditions shift.
Investment Activity, Investment Performance, and Portfolio Update
As the syndicated bank loan markets remain competitive, we continue to see lower yields and fewer loan covenants making the syndicated market less attractive for sourcing debt investments from a risk/reward standpoint. As such, our investment focus remains concentrated in directly originated investments, where we seek attractive yields that allow us to largely remain in senior positions of companies' capital structures.
During the three months ended September 30, 2017, our investment activity was concentrated in sourcing debt investments through direct origination (57%) and primary issuance channels (43%). Investment activity consisted of $33 million in new commitments, including commitments to five new portfolio companies.
- 2 -
The following table presents our investment activity for the three months ended September 30, 2017 (dollars in thousands):
Three Months Ended September 30, 2017 | |||
Total Assets | $ | 406,590 | |
Total Fair Value of Investments | $ | 381,054 | |
Gross Portfolio Yield | 8.8 | % | |
Investment activity segmented by access channel: | |||
Direct origination | $ | 18,443 | |
Primary issuance | 14,091 | ||
Secondary market transactions | — | ||
Total investment activity | 32,534 | ||
Investments sold or repaid | (29,993 | ) | |
Net investment activity | $ | 2,541 | |
Portfolio companies at beginning of period | 67 | ||
Number of added portfolio companies | 5 | ||
Number of exited portfolio companies | (4 | ) | |
Portfolio companies at period end | 68 | ||
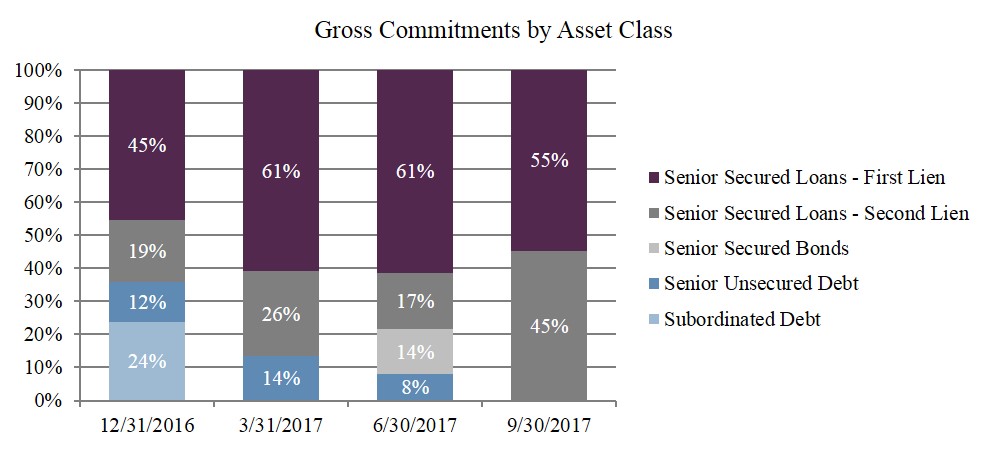
As discussed above, while syndicated loan market yields continue to tighten, GCIF's investment focus is concentrated in directly originated transactions that are also senior secured in order to seek to better protect investors against the downside when the market environment eventually shifts. During third quarter of 2017, 100% of investment commitments were to senior secured debt investments.
Investment commitments by quarter and by asset class as of each of the last four quarters was as follows:
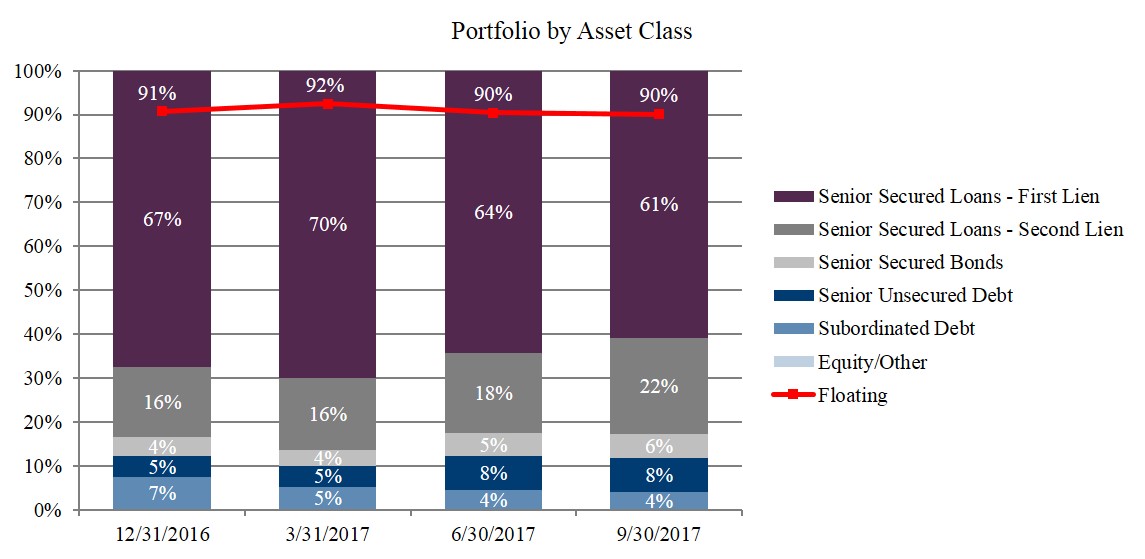
As of September 30, 2017, the portfolio consisted of $381 million of total investments at fair value and, consistent with prior quarters, our debt portfolio remains predominately invested in senior debt investments which represented 96% of the portfolio at fair value. We believe senior secured debt investments provide for downside protection which is particularly important given today's credit environment.
- 3 -
Set forth below is the composition of the portfolio by asset class for each quarter end based on fair value:
As of September 30, 2017, there were 68 portfolio companies in which GCIF held 99 investments. The weighted average portfolio company age, based on fair value, was 46 years as of September 30, 2017. Furthermore, and aligned with our strategy of mitigating industry specific risk, the companies comprising the GCIF portfolio were diversified across 19 industries. Set forth below are the industry concentrations in GCIF's portfolio as of September 30, 2017 by fair value:
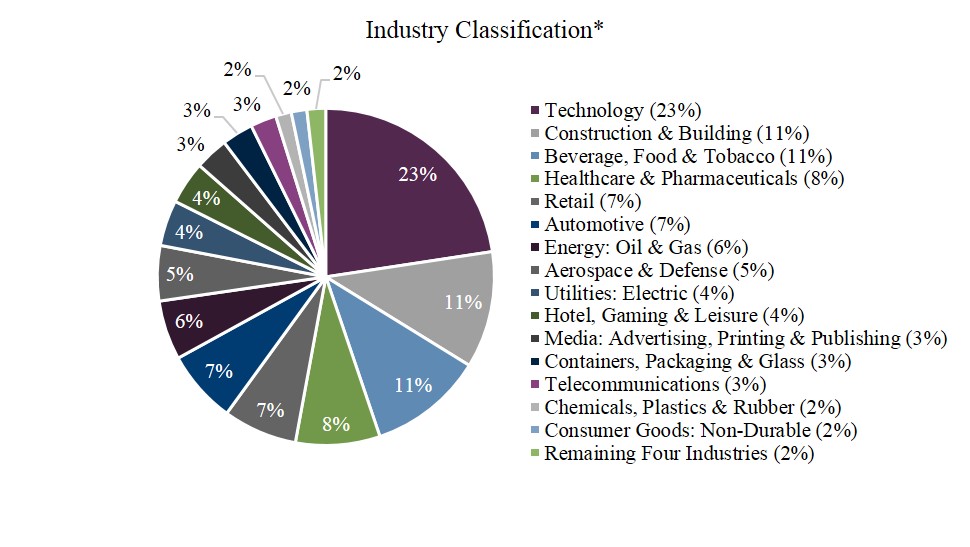
________________________
(*) Industry classifications based upon Moody's standard industry classifications.
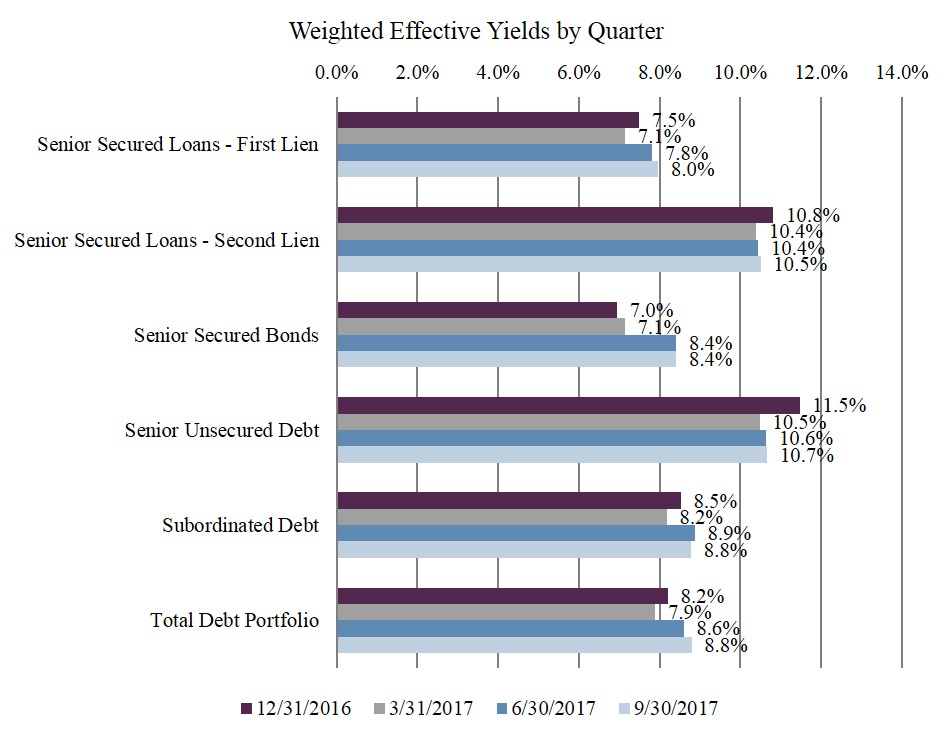
As spreads have tightened in the secondary market, GCIF's Advisor continues to actively deploy capital into directly originated transactions, achieving a gross portfolio yield of 8.8% as of September 30, 2017, compared to 8.2% as of December 31, 2016.
- 4 -
Set forth below are the weighted average effective yields, by investment type, as of each of the prior four quarters:
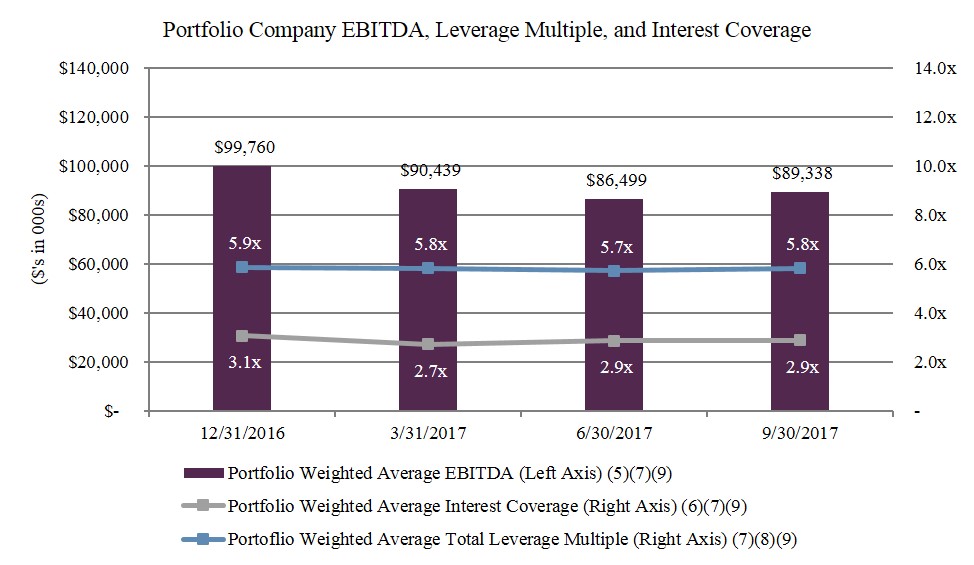
Set forth below are the weighted average EBITDA, weighted average total leverage multiple, and weighted average interest rate coverage of GCIF's portfolio companies.
________________________
(5) | Based on trailing twelve months EBITDA as most recently reported by portfolio companies. Weighted average portfolio company EBITDA is calculated using weights based on amortized cost. The inputs and computations of EBITDA are not consistent across all portfolio companies. EBITDA is a non-GAAP financial measure. For a particular portfolio company, EBITDA is generally defined as net income before net interest expense, income tax expense, depreciation and amortization. EBITDA amounts are estimated from the most recent portfolio company's financial statements, have not been independently verified by GCIF or its Advisor, may reflect a normalized or adjusted amounts, typically exclude expenses deemed unusual or non-recurring, and typically include add backs for items deemed appropriate to present normalized earnings. Accordingly, neither GCIF nor its Advisor makes any representation or warranty in respect of this information. |
(6) | Weighted average interest coverage represents the portfolio company’s EBITDA as a multiple of interest expense. Portfolio company credit statistics are derived from the most recently available portfolio company financial statements, have not been independently verified by GCIF or its Advisors, and may reflect a normalized or adjusted amount. Accordingly, neither GCIF nor its Advisors makes any representation or warranty in respect of this information. |
(7) | Portfolio weighted average EBITDA, weighted average total leverage multiple, and weighted average interest coverage ratio data includes information solely in respect of portfolio companies in which GCIF has a debt investment. |
(8) | Weighted average total leverage multiple represents the portfolio company’s total debt as a multiple of EBITDA. Portfolio company credit statistics are derived from the most recently available portfolio company financial statements, have not been independently verified by |
- 5 -
GCIF or its Advisors, and may reflect a normalized or adjusted amount. Accordingly, neither GCIF nor its Advisors makes any representation or warranty in respect of this information.
(9) | EBITDA is a non-GAAP financial measure. For a particular portfolio company, EBITDA is generally defined as net income before net interest expense, income tax expense, depreciation and amortization. EBITDA amounts are estimated from the most recent portfolio company's financial statements, have not been independently verified by GCIF or its Advisor, may reflect a normalized or adjusted amounts, typically exclude expenses deemed unusual or non-recurring, and typically include add backs for items deemed appropriate to present normalized earnings. Accordingly, neither GCIF nor its Advisor makes any representation or warranty in respect of this information. |
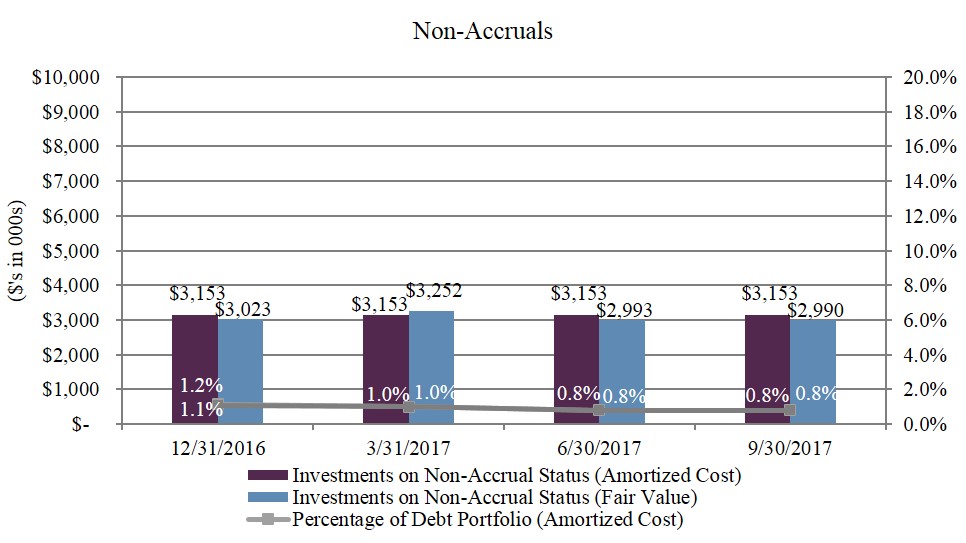
As of September 30, 2017, GCIF had one debt investment on non-accrual status, which represented less than 1% of total investments on both a fair value and amortized cost basis. In May of 2016, the portfolio company voluntarily filed a petition to reorganize under Chapter 11 of the U.S. Bankruptcy Code, and the bankruptcy workout was still underway as of September 30, 2017. We are actively monitoring the situation and continuously evaluating our position.
The following chart shows debt investments on non-accrual status based on their amortized cost and fair value for each of the prior four quarters.
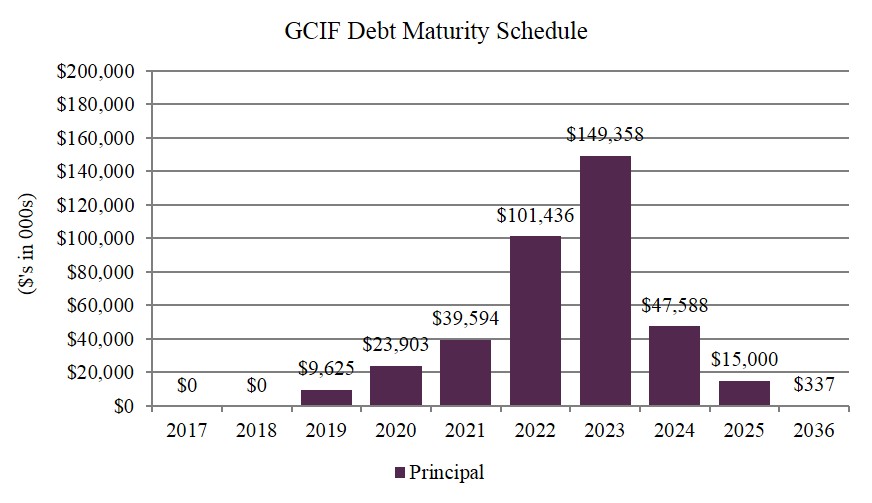
The following chart shows the maturity schedule of GCIF's debt investments, excluding unfunded commitments, based on their principal amount as of September 30, 2017.
- 6 -
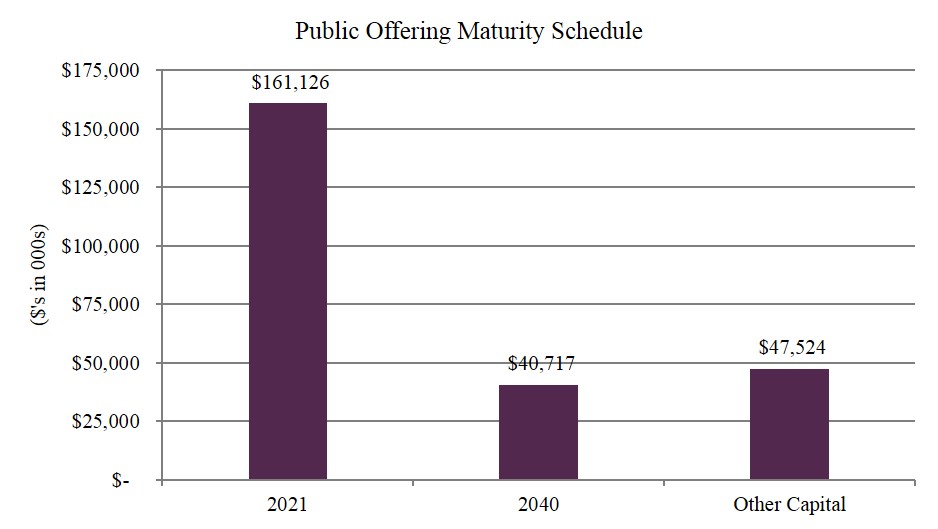
GCIF's publicly offered feeder funds, GCIF 2016 T and GCIF - I, which have committed to seek liquidity events on or before December 31, 2021 and December 31, 2040, respectively, collectively represented 81% of GCIF's total ownership as of September 30, 2017. The following chart shows the liquidity schedule of GCIF's publicly offered feeder funds as of September 30, 2017 based on the net assets of GCIF.
About Guggenheim Credit Income Fund
GCIF is a non-traded business development company ("BDC") that invests primarily in large, privately negotiated loans to private middle market U.S. companies. GCIF is the master fund which pools investor capital raised through its feeder fund offerings, such as GCIF - I and GCIF 2016 T. GCIF is managed by Guggenheim and is designed to provide investors with current income, capital preservation, and, to a lesser extent, capital appreciation. GCIF and its feeder fund offerings share the same investment objectives and strategies and all portfolio investments and corporate borrowings are held at GCIF.
About Guggenheim Partners, LLC
Guggenheim Investments represents the investment management businesses of Guggenheim Partners and includes Guggenheim, an SEC-registered investment adviser. Guggenheim Partners is a privately-held, global financial services firm with over 2,300 employees and more than $295 billion in total assets under management as of September 30, 2017. It produces customized solutions for its clients, which include institutions, governments and agencies, corporations, insurance companies, investment advisors, family offices, and individual investors.
Guggenheim Investments manages $243 billion in assets across fixed income, equity, and alternatives as of September 30, 2017 (includes leverage of $11.6bn for assets under management and $0.4bn for assets for which we provide administrative services). Its 275+ investment professionals perform research to understand market trends and identify undervalued opportunities in areas that are often complex and underfollowed. This approach to investment management has enabled Guggenheim to deliver long-term results to its clients.
Within Guggenheim Investments is the Guggenheim Corporate Credit Team, which is responsible for all corporate credit strategies and asset management of $85.3 billion. A unified credit platform is utilized for all strategies and is organized by industry as opposed to asset class, which increases its ability to uncover relative value opportunities and to identify and source opportunities. The scale of the platform, combined with the expertise across a wide range of industries and in-house legal resources, allows Guggenheim to be a solution provider to the market and maintain an active pipeline of investment opportunities.
Cautionary Statement Concerning Forward-Looking Statements
This document contains forward-looking statements within the meaning of the Federal securities laws. These statements are not guarantees of future performance and are subject to risks, uncertainties and other factors, some of which are beyond our control, are difficult to predict and could cause actual results to differ materially from those expressed or forecasted in the forward-looking statements. GCIF, GCIF - I, and GCIF 2016 T undertake no obligation to update any forward-looking statements contained herein to conform the statements to actual results or changes in their expectations. A number of factors may cause GCIF’s, GCIF - I's and GCIF 2016 T's actual results, performance or achievement to differ materially from those anticipated. For further information on factors that could impact GCIF, GCIF - I, and GCIF 2016 T performance, please review GCIF’s, GCIF - I's, and GCIF 2016 T's respective filings at the SEC website at www.sec.gov.
- 7 -