Attached files
| file | filename |
|---|---|
| EX-32.2 - EXHIBIT 32.2 - Viacom Inc. | via-20170930x10kexhibit322.htm |
| EX-32.1 - EXHIBIT 32.1 - Viacom Inc. | via-20170930x10kexhibit321.htm |
| EX-31.2 - EXHIBIT 31.2 - Viacom Inc. | via-20170930x10kexhibit312.htm |
| EX-31.1 - EXHIBIT 31.1 - Viacom Inc. | via-20170930x10kexhibit311.htm |
| EX-24.1 - EXHIBIT 24.1 - Viacom Inc. | a201710-kexhibit241.htm |
| EX-23.1 - EXHIBIT 23.1 - Viacom Inc. | a201710-kexhibit231.htm |
| EX-21.1 - EXHIBIT 21.1 - Viacom Inc. | a201710-kexhibit211.htm |
UNITED STATES
SECURITIES AND EXCHANGE COMMISSION
Washington, D.C. 20549
FORM 10-K | ||||
ý | ANNUAL REPORT PURSUANT TO SECTION 13 OR 15(d) OF THE SECURITIES EXCHANGE ACT OF 1934 |
For the fiscal year ended September 30, 2017 | |
OR
¨ | TRANSITION REPORT PURSUANT TO SECTION 13 OR 15(d) OF THE SECURITIES EXCHANGE ACT OF 1934 |
For the transition period from ______ to _______ | |
Commission File Number 001-32686
VIACOM INC.
(Exact name of registrant as specified in its charter)
DELAWARE | 20-3515052 | |
(State or other jurisdiction of incorporation or organization) | (I.R.S. Employer Identification Number) | |
1515 Broadway New York, NY 10036 (212) 258-6000 (Address, including zip code, and telephone number, including area code, of registrant’s principal executive offices) | ||||
Securities Registered Pursuant to Section 12(b) of the Act:
Title of Each Class | Name of Each Exchange on Which Registered | |
Class A Common Stock, $0.001 par value | NASDAQ Global Select Market | |
Class B Common Stock, $0.001 par value | NASDAQ Global Select Market | |
Securities Registered Pursuant to Section 12(g) of the Act:
None
(Title Of Class)
Indicate by check mark if the registrant is a well-known seasoned issuer, as defined in Rule 405 of the Securities Act. Yes ý No ¨
Indicate by check mark if the registrant is not required to file reports pursuant to Section 13 or Section 15(d) of the Act. Yes ¨ No ý
Indicate by check mark whether the registrant (1) has filed all reports required to be filed by Section 13 or 15(d) of the Securities Exchange Act of 1934 during the preceding 12 months (or for such shorter period that the registrant was required to file such reports), and (2) has been subject to such filing requirements for the past 90 days. Yes ý No ¨
Indicate by check mark whether the registrant has submitted electronically and posted on its corporate Web site, if any, every Interactive Data File required to be submitted and posted pursuant to Rule 405 of Regulation S-T during the preceding 12 months (or such shorter period that the registrant was required to submit and post such files). Yes ý No ¨
Indicate by check mark if disclosure of delinquent filers pursuant to Item 405 of Regulation S-K is not contained herein, and will not be contained, to the best of the registrant’s knowledge, in definitive proxy or information statements incorporated by reference in Part III of this Form 10-K or any amendment to this Form 10-K. ý
Indicate by check mark whether the registrant is a large accelerated filer, an accelerated filer, a non-accelerated filer, smaller reporting company, or an emerging growth company. See definitions of “large accelerated filer,” “accelerated filer,” “smaller reporting company” and “emerging growth company” in Rule 12b-2 of the Exchange Act.
Large accelerated filer x | Accelerated filer ¨ | Non-accelerated filer ¨ (Do not check if a smaller reporting company) | Smaller reporting company ¨ | Emerging growth company ¨ | ||||
If an emerging growth company, indicate by check mark if the registrant has elected not to use the extended transition period for complying with any new or revised financial accounting standards provided pursuant to Section 13(a) of the Exchange Act. ¨
Indicate by check mark whether the registrant is a shell company (as defined in Rule 12b-2 of the Act). Yes ¨ No ý
As of the close of business on March 31, 2017, the last business day of the registrant’s most recently completed second fiscal quarter, there were 49,431,379 shares of the registrant’s Class A common stock, par value $0.001 per share, and 351,557,942 shares of its Class B common stock, par value $0.001 per share, outstanding. The aggregate market value of Class A common stock held by non-affiliates as of March 31, 2017 was approximately $487.0 million (based upon the closing price of $48.75 per share as reported by the NASDAQ Global Select Market on March 31, 2017, the last trading day of the quarter). The aggregate market value of Class B common stock held by non-affiliates as of March 31, 2017 was approximately $16.4 billion (based upon the closing price of $46.62 per share as reported by the NASDAQ Global Select Market on March 31, 2017, the last trading day of the quarter).
As of October 31, 2017, 49,431,181 shares of our Class A common stock and 352,826,905 shares of our Class B common stock were outstanding.
DOCUMENTS INCORPORATED BY REFERENCE
Portions of Viacom Inc.’s Notice of 2018 Annual Meeting of Stockholders and Proxy Statement to be filed with the Securities and Exchange Commission pursuant to Regulation 14A of the Securities Exchange Act of 1934, as amended, are incorporated by reference into this Annual Report on Form 10-K (Portion of Item 5; Part III).
TABLE OF CONTENTS
Item 1. | ||
Item 1A. | ||
Item 1B. | ||
Item 2. | ||
Item 3. | ||
Item 4. | ||
Item 5. | ||
Item 6. | ||
Item 7. | ||
Item 7A. | ||
Item 8. | ||
Item 9. | ||
Item 9A. | ||
Item 9B. | ||
Item 10. | ||
Item 11. | ||
Item 12. | ||
Item 13. | ||
Item 14. | ||
Item 15. | ||
PART I
Item 1. Business.
OVERVIEW
Viacom is home to premier global media brands that create compelling entertainment content - including television programs, motion pictures, short-form content, games, consumer products, podcasts, live events and social media experiences - for audiences in more than 180 countries on various platforms and devices. We operate through two reportable segments: Media Networks and Filmed Entertainment, each of which is described below.
In fiscal year 2017, following a comprehensive review of our operations and performance, we began to execute against a new business strategy that is built on the following key pillars:
• | We have designated key brands - Nickelodeon, Nick Jr., MTV, BET, Comedy Central and Paramount - as our highest priority, “flagship” brands. Our flagship brands are unique from our other brands, in that they have compelling, valuable and distinct brand propositions; serve diverse, substantial audiences with content largely owned by us; and have global reach and distribution potential across linear, digital, film, consumer products, and live events and experiences. We have also focused on opportunities to bring the best of Paramount Pictures to our Media Networks business, and the best of our Media Networks business to Paramount Pictures. |
• | We are elevating our approach to content and talent, by building our content pipeline and embracing new formats. We are working to transform our approach to talent development by creating new opportunities for our key talent across our networks and film studio. |
• | We are deepening our partnerships to drive new distribution and advertising revenue, including through advanced advertising, data, marketing and co-production agreements. |
• | We are extending the reach of our brands in both the physical world (through live events, recreation and similar experiences) and the digital world. |
• | We are optimizing and energizing our organization, by focusing on our culture and shared vision and values. |
We were organized as a Delaware corporation in 2005 in connection with our separation from CBS Corporation (“CBS”), which was effective January 1, 2006. Our principal offices are located at 1515 Broadway, New York, New York 10036. Our telephone number is (212) 258-6000 and our website is www.viacom.com. Information included on or accessible through our website is not intended to be incorporated into this report. References in this document to “Viacom,” “Company,” “we,” “us” and “our” mean Viacom Inc. and our consolidated subsidiaries, unless the context requires otherwise.
MEDIA NETWORKS
Overview
Our Media Networks segment provides high-quality entertainment content, services and related branded products for consumers in targeted demographics attractive to advertisers, content distributors and retailers. We create, acquire and distribute programming and other content for our audiences worldwide, distributed through cable, satellite and broadband services, on linear, streaming and on-demand bases, via a variety of owned and third party platforms including televisions, branded apps and sites, for viewing on a wide range of devices such as connected televisions, PCs, tablets, smartphones and other connected devices. The Media Networks segment also licenses its brands for consumer products and recreational opportunities, and produces live events.
Our Media Networks segment operates globally as Viacom Media Networks, through three brand groups based on target audience, similarity of programming and other factors:
• | our Global Entertainment Group offers content that reaches a diverse group of adults and young adults who love comedy, music, pop culture and general entertainment; |
• | the Nickelodeon Group offers content designed for kids ages 2 to 17 and their families; and |
• | BET Networks offers content targeted to African-American audiences and consumers of Black culture. |
1
Globally, our program services reach approximately 4.3 billion cumulative television subscribers in 183 countries and 43 languages, via 300 locally programmed and operated television channels, including Nickelodeon®, Nick Jr.®, MTV®, BET®, Comedy Central®, SPIKE® (which will be rebranded as Paramount Network™ in the United States (“U.S.”) in January 2018), VH1®, TV Land®, CMT®, Logo® and our program services created specifically for international audiences, such as British public service broadcaster (“PSB”) Channel 5® (in the United Kingdom (“UK”)), Telefe® (in Argentina), Colors® (in India) and Paramount Channel™ (in a variety of territories). In fiscal year 2017, our Media Networks segment launched 16 new channels, including in East Asia, Russia and various parts of Europe. Cumulative television subscribers aggregate total subscribers to each Viacom owned and operated, joint venture and licensee channel.
Our Media Networks brands develop and operate an extensive portfolio of online, mobile and app experiences, including “TV Everywhere” apps, that provide their target audiences with video streaming of long-form and short-form programming content, games and interactive features, across shows, events, news, music, community, culture and, for our younger audiences, educational and learning activities. During the quarter ended September 30, 2017, our Media Networks online properties, in the aggregate, averaged approximately 44.5 million unique visitors per month domestically, and according to internal data, 454 million content streams each month. Our brands also provide branded experiences across several streaming services and social media platforms, as well as live events and branded consumer products.
Media Networks Properties
Our most significant Media Networks properties are discussed below. Unless otherwise indicated, the domestic television household numbers are according to Nielsen, the Internet monthly unique user and video stream data is according to comScore Media/Video Metrix (U.S. data only unless otherwise indicated), and the average app usage data and the international reach statistics are derived from internal data coupled with external sources when available.

• | Nickelodeon, now in its 38th year, is a diverse, global business and a recognized leader in kids and family entertainment. Nickelodeon has been the number-one-rated advertising-supported basic cable network for 22 consecutive years, featuring leading original and licensed series for kids across animation, live action and preschool formats. Nickelodeon produces and distributes television programming worldwide, has a global consumer products licensing business and licenses its brands for recreation experiences such as hotels, theme parks and live entertainment. |
• | Programming highlights in fiscal year 2017 included the series premieres of Dude Perfect, I am Frankie and Hunter Street; returning hits The Loud House, School of Rock, Alvinnn!!! and the Chipmunks, Game Shakers, Henry Danger, Nicky, Ricky, Dicky & Dawn, The Thundermans, Teenage Mutant Ninja Turtles and SpongeBob SquarePants; and tentpole events such as Kids’ Choice Awards, Kids’ Choice Sports, The HALO Awards and Worldwide Day of Play. |
• | During the evening and overnight hours, Nick at Nite airs on the same linear cable channel on which Nickelodeon airs during the daytime, and features licensed contemporary family comedies, such as Friends, George Lopez, The Goldbergs, Fresh Prince of Bel-Air and Full House. |
• | In September 2017, Nickelodeon and Nick at Nite reached approximately 602 million cumulative television subscribers in 177 countries worldwide, excluding branded programming blocks. |
• | In the quarter ended September 30, 2017, our Nick online properties in the aggregate averaged 2.6 million monthly unique visitors domestically and, according to internal data, 56 million content video streams each month. Nickelodeon has garnered 249 million cumulative followers across social media platforms. |
• | With 28 films to date, Nickelodeon has deepened its partnership with Paramount Films, working together to develop a slate of branded films based on some of Nick’s most iconic franchises and characters. |
• | Nickelodeon has taken steps to expand its footprint in the physical world, with the 2016 opening of the Nickelodeon Resort in Punta Cana, multiple PAW Patrol live tours around the world and licensing our intellectual property in theme parks. |
• | Nickelodeon developed SpongeBob SquarePants, a live musical stage production, in conjunction with an award-winning, premier Broadway team. The musical is now in previews and scheduled to formally open on Broadway in December 2017. |
2

• | Nick Jr. seeks to educate and entertain preschoolers, providing kids an opportunity to engage with characters they love while building their imaginations, gaining key cognitive and social-emotional skills and learning about the world around them. Nick Jr. offers parents and their kids entertaining and enriching activities geared toward their interests, ages and developmental levels. |
• | Programming highlights in fiscal year 2017 included hits such as PAW Patrol, Blaze and The Monster Machines, Shimmer and Shine and Rusty Rivets and licensed originals such as Peppa Pig, Teletubbies and Max & Ruby. |
• | In September 2017, Nick Jr. reached approximately 217 million cumulative television subscribers in 148 countries worldwide. |
• | In the quarter ended September 30, 2017, our Nick Jr. online properties in the aggregate averaged 2.3 million monthly unique visitors domestically and, according to internal data, 278 million content video streams each month. Nick Jr. has garnered 10 million cumulative followers across social media platforms. |
• | NOGGIN is Nickelodeon’s advertising-free, direct-to-consumer, over-the-top (“OTT”) preschool video subscription service, featuring over 1,000 full-length library episodes, plus short-form and educational content. In fiscal year 2017, we launched a slate of play-along videos that allow preschoolers to engage with their favorite characters and navigate through enhanced educational experiences that promote science, technology, engineering, math and social-emotional skills. |

• | MTV is a global youth culture brand that creates original music and pop culture content. MTV Play, a multiplatform video streaming offering for adults available in approximately 27 countries and territories, provides on demand access to fans’ favorite shows and live streaming of the MTV linear channel in support of our TV Everywhere partnerships. |
• | Programming highlights in fiscal year 2017 included the long-running Teen Mom, Teen Mom II, Catfish: The TV Show, Ridiculousness, Are You The One? and The Challenge franchise. New series launches in fiscal year 2017 included Teen Mum, SafeWord, Siesta Key and Fear Factor. In October 2017, MTV relaunched its signature hit, Total Request Live, airing live from the MTV Studio in Times Square. |
• | MTV’s signature programming event is the MTV Video Music Awards, which in 2017 drew 5.4 million viewers across its live linear simulcast. On Twitter, the VMAs trended globally for 13 hours, was the number-one trending topic in the U.S. from 7:00 p.m. to 11:00 p.m. (ET) on the night it aired, and at the show’s peak accounted for eight of the top 12 U.S. trending topics. MTV’s additional annual tentpole programming events included the MTV European Music Awards, MTV Movie and TV Awards and MTV Fandom Awards. |
• | In September 2017, MTV reached approximately 945 million cumulative television subscribers in 179 countries worldwide. |
• | In the quarter ended September 30, 2017, our MTV online properties in the aggregate averaged approximately 11.5 million monthly unique visitors domestically and approximately 48 million content video streams each month. MTV has garnered 245 million cumulative followers across social media platforms. |

• | BET is a leading consumer brand in the urban marketplace, and the nation’s leading provider of entertainment, music, news and public affairs programming to African-American audiences. BET Play, a direct-to-consumer OTT offering for adults available in approximately 100 countries and territories, provides hundreds of hours of content, including BET original series, awards shows, stand-up comedy, reality shows and documentaries. |
• | In fiscal year 2017, we entered into a comprehensive, multi-year content partnership with award-winning writer, director, producer, actor and playwright Tyler Perry, encompassing television, film and short-form video. Beginning in 2019, Tyler Perry will produce approximately 90 episodes annually of original drama and comedy series for BET and other Viacom networks, and we will have exclusive licensing rights on this programming, as well as exclusive distribution rights to Tyler Perry’s short-form video content. The partnership extends through 2024. |
3
• | Programming highlights in fiscal year 2017 included the premieres of Tales, Face Value and 50 Central; returning favorites such as Being Mary Jane, Real Husbands of Hollywood, The Game and Sunday Best All Stars; and acquisitions such as House of Payne and Martin. BET’s tentpoles and live events in 2017 included the fifth annual BET Experience, BET’s weekend-long celebration of music, entertainment and Black culture, which was attended by 165,000 people and featured the 2017 BET Awards; BET Honors Awards; Black Girls Rock; BET Hip Hop Awards; Soul Train Awards and Celebration of Gospel. BET’s programming received 5 NAACP Image Awards nominations and 2 wins in 2017. |
• | In September 2017, BET reached approximately 226 million cumulative television subscribers in 73 countries worldwide. |
• | In the quarter ended September 30, 2017, our BET online properties in the aggregate averaged approximately 14.2 million monthly unique visitors domestically and, according to internal data, 8 million content video streams each month. BET has garnered 42 million cumulative followers across social media platforms. |

• | Comedy Central is a leading destination for comedic talent and all things comedy, featuring award-winning late night, sketch, scripted and animated series and stand-up specials and series, as well as a Global Podcast network. In June 2017, Comedy Central hosted its first Colossal Clusterfest, a three-day festival in San Francisco that featured an unprecedented mix of world-class standup comedy, live music and interactive reproductions of sets of iconic television shows. |
• | Programming highlights in fiscal year 2017 included The Daily Show with Trevor Noah, series premieres of The Jim Jefferies Show, The President Show and The Opposition with Jordan Klepper, new seasons of returning favorites including South Park, Broad City and Tosh.0, local versions of Drunk History and acquisitions such as The Big Bang Theory, Friends, Impractical Jokers and Family Guy. |
• | In September 2017, Comedy Central reached approximately 372 million cumulative television subscribers in 146 countries worldwide. |
• | In the quarter ended September 30, 2017, our Comedy Central online properties in the aggregate averaged approximately 5.6 million monthly unique visitors domestically and, according to internal data, approximately 23 million content video streams each month. Comedy Central has garnered 168 million cumulative followers across social media platforms. |

• | In January 2018, we will rebrand Spike in the U.S. as the Paramount Network - a premier general entertainment brand that we expect will enhance our offerings for adults 18 to 49. We anticipate that Paramount Network will leverage the best in our original scripted and non-scripted programming, and feature high-quality original and third party programming, movies and documentaries, and combat sports. |
• | Paramount Network programming will feature a six-part event series Waco, a drama focused on the Branch Davidians; Yellowstone, a drama starring Kevin Costner and written and directed by critically-acclaimed screenwriter Taylor Sheridan; American Woman, a period piece starring Alicia Silverstone from award-winning producer John Wells; and Heathers, a 10-episode anthology based on the 1988 cult classic film of the same name. Paramount Network will also feature the culturally-relevant documentary Rest in Power: The Trayvon Martin Story, and new episodes of the multiplatform global hit Lip Sync Battle, Ink Master, Ink Angels, Bar Rescue and Bellator MMA. |
• | Spike programming highlights in fiscal year 2017 included returning franchises Lip Sync Battle, Ink Master and Bar Rescue, and tentpoles such as Spike’s One Night Only tribute to Alec Baldwin. The Lip Sync Battle multiplatform franchise continues to expand with Lip Sync Battle Shorties, which will premiere in early 2018 on Nickelodeon, hosted by Nick Cannon and JoJo Siwa, and featuring younger, non-celebrity competitors lip-syncing to their favorite pop songs. |
• | In September 2017, Spike reached approximately 146 million cumulative television subscribers in 11 countries worldwide. |
4
• | In the quarter ended September 30, 2017, our Spike online properties in the aggregate averaged approximately 990,000 monthly unique visitors domestically and, according to internal data, 5 million content video streams each month. Spike has garnered 21 million cumulative followers across social media platforms. |

• | VH1 is a leading lifestyle brand for millennials, with pop culture, celebrities and lifestyle topics, including original series, exclusive events and entertainment news. |
• | Programming highlights in fiscal year 2017 included the critically acclaimed original program RuPaul’s Drag Race, which won three Emmy Awards in 2017, Basketball Wives, the Love and Hip Hop franchise, Black Ink Crew, Hip Hop Squares, Martha and Snoop's Potluck Dinner Party, Signed and Baller Wives and VH1’s premier tentpole event Hip Hop Honors. |
• | In September 2017, VH1 reached approximately 274 million cumulative television subscribers in 117 countries worldwide. |
• | In the quarter ended September 30, 2017, our VH1 online properties in the aggregate averaged approximately 3.9 million monthly unique visitors domestically and 23 million content video streams each month. VH1 has garnered 42 million cumulative followers across social media platforms. |

• | TV Land features a mix of original programming, classic and contemporary television shows, specials and iconic movies that appeal to adults aged 25 to 54. The channel is split into two dayparts - TV Land Classic airs during weekdays with beloved series like M*A*S*H*, and TV Land airs in the evening hours and on weekends, focusing on our original series and more modern acquisitions that appeal to adults aged 40 and older. In September 2017, TV Land experienced its highest ratings since 2014. |
• | Programming highlights in fiscal year 2017 included returning original favorites Younger (which experienced its highest-rated and most-watched season to date) and Teachers (which also experienced its highest-rated season to date), and licensed favorites such as Everybody Loves Raymond, The King of Queens and new acquisition Mom. |
• | In September 2017, TV Land reached approximately 87 cumulative television subscribers, airing only in the U.S. |
• | In the quarter ended September 30, 2017, our TV Land online properties in the aggregate averaged approximately 501,000 monthly unique visitors domestically and, according to internal data, 4 million content video streams each month. TV Land has garnered 7 million cumulative followers across social media platforms. |

• | CMT is a leading country music and lifestyle destination, offering a mix of original series, music events and specials. CMT also has a 24-hour linear music channel, CMT Music, and online radio station, CMT Radio. |
• | Programming highlights in fiscal year 2017 included returning favorites Nashville, I Love Kellie Pickler, Still the King, Steve Austin's Broken Skull Challenge and Dallas Cowboys Cheerleaders; and tentpole events and music programming such as the annual CMT Music Awards, CMT Artists of the Year and CMT Crossroads. |
• | In September 2017, CMT reached approximately 109 million cumulative television subscribers in 9 countries worldwide. |
• | In the quarter ended September 30, 2017, our CMT online properties in the aggregate averaged approximately 1.1 million monthly unique visitors domestically and, according to internal data, 1.5 million content video streams each month. CMT has garnered 13 million cumulative followers across social media platforms. |

• | Logo is a leading entertainment brand inspired by the LGBTQ community. Logo features one-of-a-kind personalities, shows, specials and unique stories. |
5
• | Programming highlights in fiscal year 2017 included the Emmy Award-winning Logo Documentary Films, as well as Trailblazer Honors, Logo’s signature tentpole event. |
• | In September 2017, Logo reached approximately 48 million cumulative television subscribers, airing only in the U.S. |
• | In the quarter ended September 30, 2017, our Logo online properties in the aggregate averaged approximately 2.2 million monthly unique visitors domestically and, according to internal data, 1.5 million content video streams each month. Logo has garnered 8 million cumulative followers across social media platforms. |

• | Channel 5, a PSB in the UK, and its affiliated channels air a broad mix of popular content, including factual programming, entertainment, reality, sports, acquired and original drama, and preschool programming through its award-winning Milkshake brand. |
• | Programming highlights in fiscal year 2017 included Blind Date, Cruising with Jane McDonald, Paddington Station 24/7, and popular returning series such as Celebrity Big Brother, The Yorkshire Vet and Caught on Camera. |
• | In September 2017, Channel 5 reached approximately 179 million cumulative television subscribers in the United Kingdom. |

• | In November 2016, we acquired Televisión Federal S.A. (“Telefe”), one of the main free-to-air channels and biggest content producers in Argentina. Our acquisition of Telefe added 10 channels to our portfolio of international television networks. |
• | Programming highlights in fiscal year 2017 included national telenovelas such as Educando a Nina, Amar Después de Amar and Golpe al Corazón, international telenovelas including Moisés y Los 10 Mandamientos, El Sultán and Josué y La Tierra Prometida, original reality series such as Dueños de la Cocina and the 30th season of the popular program Susana Giménez. |
• | In September 2017, Telefe reached approximately 23 cumulative television subscribers in 19 countries worldwide. |

• | Paramount Channel is a 24-hour movie channel featuring classic and contemporary films from the Paramount library and other Hollywood studios as well as domestic and international television series. Paramount Channel is available free-to-air in Spain and Italy, and on basic cable television in France, Hungary, Russia, Romania, Poland, South East Asia and various Latin American countries, including Brazil, Mexico, Chile and Argentina. Paramount Channel is expected to continue to expand internationally. |
• | Programming highlights for fiscal year 2017 included The Indiana Jones Trilogy, Transformers, Forrest Gump, Shrek, the Godfather trilogy and acquisitions such as Gotham and NCIS. |
• | In September 2017, Paramount Channel reached approximately 119 million cumulative television subscribers in 116 countries worldwide. |

• | Colors is a highly-rated Hindi-language general entertainment pay television channel operated by our Viacom 18 joint venture in India. Colors is available in India and over 100 additional countries, including the U.S., Canada, the UK, parts of Europe, the Middle East and North Africa (e.g., United Arab Emirates, Tanzania, Uganda, Kenya and Rwanda), Asia Pacific (e.g., Australia, New Zealand, Singapore and Indonesia) and South-East Asia (e.g., Nepal, Bangladesh, Sri Lanka and The Maldives). |
6
• | The Colors brand is also extended to the English language through Colors Infinity, an English general entertainment channel, and to other Indian regional languages through the regional general entertainment channels COLORS Marathi, COLORS Kannada, COLORS Super, COLORS Bangla, COLORS Oriya and COLORS Gujarati, all of which feature fiction shows, reality programming and feature films. |
• | In addition, our Viacom 18 joint venture operates two Hindi language channels under its brand Rishtey, which is a free-to-air Hindi general entertainment channel, and a pay television Hindi movie channel, Rishtey Cineplex. |
• | In September 2017, Colors and Rishtey reached approximately 593 million cumulative television subscribers in 104 countries worldwide. |
In addition, our Media Networks properties include:

• | TeenNick appeals to kids ages 6 to 11 and features Nickelodeon original live action hits, signature originals and The Splat, a programming block targeting millennials with iconic Nick library content from the 1990s. |

• | Nicktoons is a leading cartoon destination for kids featuring signature franchises and fan favorites, as well as the Nick Sports block. |

• | Nick Music is a 24-hour music video destination featuring a Nickelodeon-curated lineup which gives kids their favorite Top 40 hits from breakout artists and ever-popular hit-makers. |

• | MTV2 is a music and lifestyle destination with content targeting male millennials aged 12 to 34 and featuring original music, live-action sports and irreverent lifestyle programming. |

• | MTV Classic features a mix of fan-favorite series and music programming from MTV’s history, with a special focus on the 1990s and early 2000s. |

• | mtvU is an on-air, online and on-campus network created by and for the college audience. |
7

• | MTV Live is a music-centric high-definition television channel. |

• | BET Her, formerly Centric, is the first network designed for black women, reflecting the lifestyle of today’s African-American and multicultural adult viewer and delivering a variety of culturally relevant movies, series, music, live performances, specials and reality programming. Centric was rebranded to BET Her in October 2017. |

• | BET Gospel features gospel music and spiritual programming. |

• | BET Hip Hop spotlights hip hop music programming and performances. |
Media Networks Revenues
Our Media Networks segment generates revenues in three categories: (i) the sale of advertising and marketing services, (ii) affiliate fees from distributors of our programming and program services and (iii) ancillary activities such as consumer products. In fiscal year 2017, advertising revenues, affiliate revenues and ancillary revenues were approximately 48%, 46% and 6%, respectively, of total revenues for the Media Networks segment.
Revenues from the Media Networks segment accounted for 76%, 79% and 78% of our revenues for the fiscal years 2017, 2016 and 2015, respectively, after the elimination of intercompany revenues.
Advertising Revenues
Our Media Networks segment generates revenues from the sale of advertising and from marketing services. Our advertising revenues generally depend on the number of viewers and viewership demographics. Demand and pricing for our advertising depend on the attractiveness of our offerings to advertisers, viewership and overall market conditions.
Ratings and demographic information for advertising purposes are determined by third-party research companies such as The Nielsen Company (US), LLC (“Nielsen”) and comScore, Inc. (“comScore”), sometimes also including third- and first-party data.
Our Media Networks properties appeal to various key audiences attractive to advertisers. For example, MTV appeals to teens and young adults, Nickelodeon appeals to kids and their families and BET appeals to African-American audiences. We also drive additional demand through integrated sales of multi-platform advertising and marketing opportunities and through our integrated marketing services, providing unique branded entertainment and custom sponsorship opportunities to our advertisers.
Domestically, we sell a certain amount of our advertising inventory in advance each year in the upfront market, and other inventory in the scatter market closer to the time a program airs. Upfront sales and pricing for each new cable broadcast year are largely established in our third fiscal quarter and reflected in advertising revenue principally beginning in the first quarter of our subsequent fiscal year as marketing plans are finalized and orders are fulfilled to deliver advertising across various programs and dayparts. Pricing for advertising within our programming is generally established based on projected impression delivery, which may be guaranteed on a fixed price per impression unit basis. For advertising sold based on impression guarantees, audience deficiency may result in an obligation to deliver subsequent additional units, reducing inventory available
8
for scatter sales. Scatter advertising is sold throughout the year at pricing reflecting market conditions at the time of sale and customization of services delivered. Most scatter advertising is also sold based on impression guarantees. To the extent we do not satisfy contracted audience ratings, we record deferred revenue until such time that the impression guarantee has been satisfied.
Internationally, advertising markets vary from jurisdiction to jurisdiction; however, we do not typically sell our inventory in advance in an upfront market. The majority of our international inventory is sold in the equivalent of the U.S. scatter market, and in a number of markets we are represented by third-party sales houses. The terms of these relationships vary. For example, in the UK, which is our largest market outside the U.S., we are represented by a third party to whom we sell the inventory on our television channels in the form of commercial impacts at a price calculated in accordance with a pre-agreed pricing metric, and the third party then resells those impacts to UK agencies and advertisers. In Argentina, our inventory is sold to advertisers either directly or through advertising agencies.
Our advertising revenues may be affected by the strength of advertising markets and general economic conditions, and may fluctuate depending on the success of our programming, as measured by viewership, at any given time. Measured viewership may vary due to the success of our programming (due to, among other things, the timing of availability of new episodes of popular programming and the performance of competing programs and other entertainment alternatives for viewers), the platforms on which our programming is available, as well as variations related to the methods used by third parties to measure viewership. Advertising revenues may also fluctuate due to seasonal variations, the timing of holidays and significant programming events such as awards shows and premieres. Typically, advertising revenues are highest in the first quarter of our fiscal year.
We continue to invest in proprietary data platforms and advanced analytics that enable our customers to better target and measure the impact of their advertising. Our Viacom VantageTM platform combines data from multiple sources, which may include both first- and third-party data, in a predictive environment to deliver enhanced consumer targeting and campaign measurement. Viacom VelocityTM is our branded content agency offering full-service marketing that seamlessly integrates clients’ brands into custom content across our platforms. Customized programs and proprietary analytics provide a strategic perspective on engagement across multiple social platforms including Facebook, Twitter, YouTube, Instagram, Snapchat and Tumblr.
In fiscal year 2017, Viacom created a consortium with Fox Networks Group and Turner to form OpenAP, the television industry’s first open platform for cross-publisher audience targeting, enabling advertisers and agencies to define and customize the audiences they want to reach across member networks, with consistent standards of measurement and independent third party posting for advertising campaigns.
We are also working with distributors of our programming to evolve our multi-platform advertising offerings to include targeting and customization through Vantage, Velocity and OpenAP.
Affiliate Revenues
Our affiliate revenues are generated through fees from distributors of our programming and program services, such as cable television operators, direct-to-home satellite television operators, mobile networks and subscription video-on-demand and other OTT services.
Our agreements with multichannel television service providers are generally multi-year carriage agreements with set rate increases. The amount of fees we receive is generally a function of the number of subscribers and the rates we receive per subscriber. Expirations of these affiliate agreements are staggered. We are also working with these distributors to create new and improved pay television revenue opportunities.
Under subscription video-on-demand and other similar OTT agreements, we make certain programs available for distribution on one or more dates, and our revenue under these OTT agreements is recognized upon the availability of the programs licensed; therefore, revenue will fluctuate depending on the timing of when programming is made available throughout the license period.
Ancillary Revenues
Our Media Networks ancillary revenues are principally derived from (i) our consumer products activities, which include licensing our brands and intellectual property, as well as creation and publishing of interactive games across various platforms (including mobile, PC and console), (ii) recreational experiences and live events, (iii) viewing of our programming through electronic sell-through and download-to-rent services and the sale of DVDs and Blu-ray discs and (iv) television syndication of our content.
9
Our ancillary revenues vary based on consumer spending, the popularity of our programming, the volume of content available during a particular period and acceptance of our and our partners’ products.
Media Networks Competition
Our media networks generally compete with other widely distributed cable networks, the broadcast television networks and digital programming services and platforms. Our media networks compete for advertising revenue with other cable and broadcast television networks, social media platforms, other connected outlets such as websites, apps and other online experiences, radio programming and print media. Each programming service competes for audience share with competitors’ programming services that target or include the same audience. For example, Nickelodeon’s programming and services compete for younger viewers, and BET’s programming and services compete for consumers of African-American culture, with other entertainment services, including cable and broadcast networks, digital distribution outlets and other content platforms. We also compete with other cable networks for affiliate fees and distribution. Our networks compete with other content creators for directors, actors, writers, producers and other creative talent and for new program ideas and the acquisition of popular programming. Competition from these sources may affect our revenues and costs.
FILMED ENTERTAINMENT
Overview
Our Filmed Entertainment segment develops, produces, finances, acquires and distributes motion pictures, television programming and other entertainment content under the Paramount Pictures®, Paramount PlayersTM, Paramount Animation® and Paramount TelevisionTM divisions, in various markets and media worldwide, for itself and for third parties. It partners on various projects with key Viacom franchises, including Nickelodeon Movies and MTV Films.
Paramount Pictures is a major global producer and distributor of filmed entertainment and has an extensive library consisting of approximately 1,200 motion picture titles produced by Paramount, acquired rights to approximately 2,300 additional motion pictures and a number of television programs. Paramount’s library includes many Academy Award® winners, including Titanic, Braveheart, Forrest Gump, The Godfather, There Will Be Blood and Wings, which won the first Academy Award® ever awarded for Best Picture in 1929, and recent Academy Award best picture nominees such as Arrival, Fences, The Big Short, Selma and The Wolf of Wall Street. The Paramount library also includes classics such as The Ten Commandments, Breakfast at Tiffany’s and Sunset Boulevard and a number of successful franchises such as Transformers, Star Trek, Mission: Impossible and Paranormal Activity.
In June 2017, we announced the establishment of Paramount Players, a new production division that aims to expand Paramount’s slate of films by partnering with our Media Networks flagship brands to develop, produce and market distinctive feature films in order to bring more of our leading brands to movie audiences around the world. These co-branded films will be distributed by Paramount with a unique emphasis on marketing campaigns and integrations benefiting from the global reach of our flagship networks. Paramount Players will also focus on smaller budget films reflecting specific genres and target audiences.
Paramount Animation is focused on creating high-quality animated films and has various projects in production and development, including upcoming releases Sherlock Gnomes and Amusement Park. Amusement Park is a feature film expected to be released in 2019, to be followed by an Amusement Park television series on Nickelodeon. Going forward, we anticipate that Paramount Animation will release one to two animated films per year.
Motion pictures produced, acquired and/or distributed by the Filmed Entertainment segment are generally first exhibited theatrically in domestic and/or international markets and then released in various markets through electronic sell-through, DVDs and Blu-ray discs, transactional video-on-demand, subscription video-on-demand, pay television, cable television and free television, free video-on-demand and by airlines and hotels. In fiscal year 2017, the Filmed Entertainment segment released 14 films in the domestic and international theatrical markets, including Transformers: The Last Knight, xXx: The Return of Xandar Cage, Baywatch, Ghost In The Shell, Jack Reacher: Never Go Back, Arrival and Fences. Paramount expects its total film slate to include approximately 10 theatrical releases in fiscal year 2018 as it continues to rebuild its film slate under its new divisions.
Paramount Television draws on Paramount’s extensive library of film properties and develops original programming for television and digital platforms. In fiscal year 2017, Paramount Television produced Shooter, 13 Reasons Why and Berlin Station. Paramount Television also has various other programs in production, including The Alienist for TNT, Jack Ryan for Amazon, and Maniac and The Haunting for Netflix, as well as School of Rock (produced by Nickelodeon), 3 Days of the Condor (produced by DirecTV) and Lemony Snicket’s A Series of Unfortunate Events (produced by Netflix). In addition, it has
10
numerous projects in development. Paramount Television’s first project, 2016’s live television event Grease Live, received 10 Emmy nominations, winning five.
Motion Picture Production, Distribution and Financing


Paramount produces many of the motion pictures it releases and also acquires films for distribution from third parties. In some cases, Paramount co-finances and/or co-distributes films with third parties, including other studios. Paramount also enters into film-specific financing and slate financing arrangements from time to time under which third parties participate in the financing of the costs of a film or group of films, typically in exchange for a partial copyright interest. Paramount distributes motion pictures worldwide or in select territories or media, and may engage third-party distributors for certain pictures in certain territories.
Paramount has recently extended and expanded its relationship with Skydance, a producer and co-financier of many Paramount motion pictures. The new agreement extends to 2022 and includes a Paramount “first look” for projects initiated by Skydance, including smaller budget and animated projects.
In November 2017, Paramount Pictures and Hasbro, Inc. (“Hasbro”) announced a new exclusive agreement to produce and distribute content based on Hasbro’s expansive list of brands, as well as original stories. Paramount and Hasbro will partner on live action and animated films, with Hasbro’s Allspark Pictures and Allspark Animation having a role in development and production. The agreement expands the companies’ existing relationship, under which Paramount and Hasbro have partnered on five Transformers films, two G.I. Joe films and the first Transformers spinoff - Bumblebee - which is scheduled for theatrical release in December 2018.
Domestically, Paramount generally performs its own marketing and distribution services for theatrical releases and its own sales and marketing services for home entertainment releases. Paramount has an agreement with Universal Studios for certain back-office and distribution services for all physical DVD and Blu-ray discs released by Paramount in the U.S. and Canada. Paramount also distributes CBS’s library of television and other library content on DVD and Blu-ray disc on a worldwide basis under an agreement that runs through 2020.
Internationally, Paramount, through its international affiliates, generally distributes its theatrical releases through its own distribution operations or, in some territories, through United International Pictures, a company that Paramount and Universal Studios own jointly. For home entertainment releases, Paramount’s physical DVD and Blu-ray discs are distributed in certain international territories by Universal Pictures Home Entertainment and in certain other territories by Paramount licensees.
Paramount also distributes films domestically and internationally on electronic sell-through, transactional video-on-demand, subscription video-on-demand and television platforms. In the first domestic pay television distribution window, Paramount’s feature films initially theatrically released in the U.S. are generally exhibited on EPIX, a multi-platform premium entertainment service that offers Paramount, MGM, Lions Gate Films and certain third-party films, as well as original content, through a premium pay television channel and television and digital subscription video-on-demand services.
Producing, marketing and distributing motion pictures and television programming can involve significant costs. The timing of a motion picture’s release can also cause our financial results to vary. For example, marketing costs are generally incurred before and throughout the theatrical release of a film and, to a lesser extent, other distribution windows, and are expensed as incurred. As a result, we typically incur losses with respect to a particular film prior to and during the film’s theatrical exhibition, and recoupment of investment as well as profitability for the film may not be realized until well after its theatrical release. Therefore, the results of the Filmed Entertainment segment can be volatile as films work their way through the various distribution windows.
Filmed Entertainment Revenues
Our Filmed Entertainment segment generates revenues in four categories: (i) the release and/or distribution of motion pictures theatrically, (ii) the release and/or distribution of film and television product through home entertainment, (iii) the licensing of film and television product to television and digital platforms and (iv) other ancillary activities. In fiscal year 2017, theatrical
11
revenues, home entertainment revenues, licensing revenues and ancillary revenues were approximately 25%, 26%, 40% and 9%, respectively, of total revenues for the Filmed Entertainment segment.
Revenues from the Filmed Entertainment segment accounted for 24%, 21% and 22% of our revenues for the fiscal years 2017, 2016 and 2015, respectively, after the elimination of intercompany revenues.
Theatrical Revenues
Paramount generates revenues worldwide from the theatrical release and/or distribution of motion pictures, primarily from audience ticket sales. In addition to the traditional 2D format, certain of Paramount’s theatrical releases are made available in 3D and/or IMAX format, tickets that are generally sold at premium pricing.
Each motion picture is a separate and distinct product with its revenues, and ultimate profitability, dependent upon many factors, among which audience response, domestically and internationally, is of fundamental importance. Theatrical revenues may also be affected by the number, timing and mix of releases and competitive offerings in any given period, consumer tastes and consumption habits, and overall economic conditions, including trends in discretionary spending. The theatrical success of a motion picture is a significant factor in determining the revenues it is likely to generate in home entertainment markets and licensing arrangements for television and other platforms. Revenues from motion picture theatrical releases tend to be cyclical with increases around the holidays that fall during the first quarter of our fiscal year, and in the summer months during our fourth quarter.
In fiscal year 2017, Paramount theatrically released in domestic and/or international markets Transformers: The Last Knight, Arrival, Jack Reacher: Never Go Back, Baywatch, Fences, Office Christmas Party, xXx: The Return of Xander Cage, Ghost in the Shell, Allied, Monster Trucks, Rings, mother!, Silence and An Inconvenient Sequel: Truth to Power. In addition to Daddy’s Home 2, which was released in November 2017, Paramount’s fiscal year 2018 slate is expected to include Downsizing, Sherlock Gnomes and Mission: Impossible 6.
Home Entertainment Revenues
Home entertainment revenues are derived from the worldwide sales and distribution of DVDs and Blu-ray discs relating to the motion pictures released theatrically by Paramount and programming of other Viacom brands such as Nickelodeon, MTV, Comedy Central and BET, as well as certain acquired films and content distributed on behalf of third parties such as CBS. Home entertainment revenues are also derived from the viewing of our films on a “transactional” basis through transactional video-on-demand and electronic sell-through services around the world, for a fee and/or on a revenue-sharing basis.
Our home entertainment revenues may be affected by the number, timing and mix of releases and competitive offerings in any given period, consumer tastes and consumption habits, the prominence given by distributors and retailers to our releases compared to those of our competitors, and overall economic conditions, including trends in discretionary spending.
Key home entertainment releases in fiscal year 2017 included Star Trek Beyond, Jack Reacher: Never Go Back, Arrival, xXx: The Return of Xander Cage, Ghost In The Shell, Transformers: The Last Knight, Fences, Allied, Baywatch, Monster Trucks and Office Christmas Party.
Licensing Revenues
Paramount generates fees by licensing, around the world on a territory by territory basis, films and television programs produced, acquired or distributed by Paramount, for a fee or on a revenue-sharing basis, to subscription video-on-demand, pay and basic cable television, free television and free video-on-demand services.
Revenue from the licensing of film and television exhibition rights is recognized upon availability for airing by the licensee and will fluctuate depending on the number and mix of available titles in any given territory.
Licensing revenues in fiscal year 2017 were generated from films that were licensed to various platforms, including Star Trek Beyond, Jack Reacher: Never Go Back, Teenage Mutant Ninja Turtles: Out of the Shadows, xXx: The Return of Xander Cage, Allied and Arrival, and from distribution of Paramount Television titles including Shooter, 13 Reasons Why and Berlin Station.
Ancillary Revenues
Paramount generates ancillary revenues by providing production and facilities services to third parties, primarily at Paramount’s studio lot. Paramount also generates ancillary revenues by licensing its brands for consumer products, themed restaurants, hotels and resorts, live stage plays, film clips and theme parks and other location-based entertainment projects.
12
Filmed Entertainment Competition
Our Filmed Entertainment segment competes for audiences for its motion pictures, television programming and other entertainment content with the motion pictures and content released by other major motion picture studios, independent film producers and television producers, as well as with other forms of entertainment and consumer spending outlets. Our competitive position primarily depends on the amount and quality of the content produced, its distribution and marketing success and public response. We also compete for creative talent, including producers, actors, directors and writers, and scripts for motion pictures, all of which are essential to our success. Our motion picture brands also compete with studios and other producers of entertainment content for distribution of motion pictures through the various distribution windows (such as television and home entertainment) and on digital platforms. Competition from these sources may affect our revenues and costs.
SOCIAL RESPONSIBILITY
Viacommunity is the umbrella effort representing all of Viacom’s social impact programs.
Through the power of entertainment, Viacommunity works to inspire social change hand-in-hand with the people we serve, the employees with whom we work, and the communities in which we operate. Some of Viacommunity’s key areas of focus include building diverse and inclusive societies, promoting healthy living, inspiring future generations through education and empowering our employees with the tools, resources and freedom to truly make a difference.
Following are just a few examples of our efforts:

Get Schooled
In partnership with Viacom, Get Schooled leverages the power of pop culture to inspire and empower students to graduate from high school and succeed in college. The organization has been recognized by Fast Company as a Most Innovative company, partners with over 2,000 middle and high schools around the country and engages close to two million students.

MTV Staying Alive Foundation
Our international media networks’ multi-award-winning MTV Staying Alive Foundation engages in fighting the stigma, spread and threat of the HIV and AIDS epidemic globally by creating engaging media content such as MTV Shuga and funding youth-led, grassroots prevention projects.

MTV Look Different
MTV’s Emmy Award-winning “Look Different” campaign helps America’s youth better recognize and challenge hidden racial, gender and anti-LGBT biases, empowering them to create a more equal future.
13

VH1 Save The Music Foundation
The VH1 Save The Music Foundation is a nonprofit organization dedicated to restoring instrumental music education programs in America’s public schools, and raising awareness about the importance of music as part of each child’s complete education. Founded in 1997, VH1 Save The Music was the first organization in existence dedicated to restoring music programs in America’s schools. Over 20 years, the foundation has donated more than $53 million worth of new musical instruments to 2,030 public schools in 251 school districts around the country, impacting the lives of more than three million public school students.

Nickelodeon’s Worldwide Day of Play
Nickelodeon encourages kids to get up and get active on its annual Worldwide Day of Play by suspending programming for three hours in the afternoon across its platforms while thousands of local partners nationwide host activities focused on “just” playing. The Road to Worldwide Day of Play, underway throughout the summer, travels to communities where kids are hometown heroes making play happen.

Logo Global Ally
Global Ally is an international storytelling project from Logo that provides an inside look into the lives of LGBTQ people from all corners of the world, and provides ways for an American audience to learn more, take action, and support LGBTQ people around the world.

Paramount’s Kindergarten to Cap & Gown
Paramount has a long and proud tradition of giving back with a corporate social responsibility program focused on four key initiatives: supporting public education; protecting the environment; combating HIV/AIDS; and promoting volunteerism. By offering employee engagement opportunities, coupled with financial and in-kind contributions, Paramount supports numerous local, national, and global non-profit organizations. Kindergarten to Cap & Gown - Paramount’s signature education program - mentors students through their educational experience, targeting four partner schools in Paramount’s Los Angeles neighborhood.

Viacommunity’s Talent for Good
At Viacommunity, one of the best ways to leverage the power of the Viacom brands and give back to the communities we serve is through the unique expertise of our creative and talented employees. Through this skills-based volunteering program, employees can strengthen their skills and build new ones, while giving back to the causes they care about most.
REGULATION AND PROTECTION OF OUR INTELLECTUAL PROPERTY
We are, fundamentally, a media content company, so the trademark, copyright, patent and other intellectual property laws that protect our brands and entertainment content are of paramount importance to us. Our businesses and the intellectual property
14
they create or acquire are subject to and affected by laws and regulations of U.S. federal, state and local governmental authorities, as well as laws and regulations of countries other than the U.S. and pan-national bodies such as the European Union (“EU”). The laws and regulations affecting our businesses are constantly subject to change as are the protections that those laws and regulations afford us. The discussion below describes certain, but not all, present and proposed laws and regulations affecting our businesses.
Certain Regulations Affecting Our Business
Children’s Programming
Our business is subject to various regulations, both in the U.S. and abroad, applicable to children’s programming. For example, since 1990, federal legislation and rules of the U.S. Federal Communications Commission (the “FCC”) have limited the amount and content of commercial matter that may be shown on cable channels during programming designed for children 12 years of age and younger, and since 2006 the FCC has limited the display of certain commercial website addresses during children’s programming. In early 2017, the FCC initiated a review of its media rules with the objective of eliminating or modifying those that are outdated, unnecessary or unduly burdensome. We are participating in the FCC’s review process. In addition, some policymakers have sought limitations on food and beverage marketing in media popular with children and teens. Restrictions on the television advertising of foods high in fat, salt and sugar to children aged 15 and under have been in place in the UK since 2007 and were enacted in Ireland in 2013. Various laws with similar objectives have also been enacted in France, Mexico, Chile, Peru, Taiwan and South Korea, and significant pressure for similar restrictions continues to be felt globally, most acutely in Australia, Brazil, Canada, Colombia, India, Slovenia, South Africa and Turkey. The implementation of these or similar limitations and restrictions could have a negative impact on our Media Networks advertising revenues, particularly for our networks with programming for children and teens.
Children’s Privacy
Other laws and regulations intended to protect the interests of children include measures designed to protect the privacy of minors online. The U.S. Children’s Online Privacy Protection Act limits the collection of personal information online from children under 13 years of age by operators of websites or online services. We have been required to limit some functionality on our websites and apps as a result of these regulations. Such regulations also limit the types of advertising we are able to sell on these sites and apps and impose strict liability on us for certain actions of Viacom, advertisers and other third parties, which could affect advertising demand and pricing. State and federal policymakers are also considering regulatory and legislative methods to protect consumer privacy on the Internet, and these efforts have focused particular attention on children and teens.
UK Regulations Affecting Channel 5 Business
As a PSB in the UK, Channel 5 is subject to certain OFCOM broadcasting regulations that impose detailed obligations including mandating the proportion of total programming and programming during peak hours that must be original productions; the hours devoted to news and current affairs; and the proportion of commissioned programming that must be made by independent producers. Channel 5 has also undertaken to air a certain amount of UK-originated children’s programming. Like all UK broadcasters, Channel 5 must abide by the OFCOM Broadcasting Code, which contains content and scheduling regulations relating to harm and offense, protection of individuals under the age of 18, privacy, fairness and product placement, and by OFCOM’s Code on the Scheduling of Television Advertising, which contains regulations on the amount and scheduling of advertising.
Argentine Regulations Affecting Telefe Business
Telefe is governed by Argentina’s Media Law 26522, as amended by Decree 267/1515. A legislative drafting committee is currently drafting a new media and communications law that will govern both the media and telecommunications businesses in Argentina, and the proposed legislation is expected to be released for public consultation in 2018. We will assess the impact of the proposal on our businesses at that time.
EU Commission’s Digital Single Market Strategy
The European Commission (the “EC”) continues to pursue its Digital Single Market (“DSM”) Strategy, which contains a broad range of proposals designed to create a more complete EU-wide market for digital goods and services, several of which are likely to impact Viacom’s businesses. The territorial nature of copyright has been identified by the EC as one of the main barriers to a single European market, and there has been strong pressure from politicians to undermine content owners’ commercial freedom to distribute exclusively on a territorial basis.
The EC published DSM-related legislative proposals in each of May 2016 and September 2016. Several of these proposals are of particular relevance to Viacom’s business practices in Europe given their impact on content owners’ exclusive control over distribution decisions for film and television productions. On June 8, 2017, the Portability Regulation came into force, requiring online content providers to ensure that their subscribers can access content while temporarily in another EU country. Another regulation currently under consideration by the EU Parliament and Council seeks to extend the EU Satellite and Cable Directive
15
to permit EU-wide licenses for rights included in broadcasters’ online ancillary services, with the aim of making it easier for platforms to respond to passive sales requests for those services from other EU countries without contravening copyright law. A further proposal would entitle talent to seek additional non-contractual compensation through the courts for highly-successful works, which would raise our operating expenses.
The EC will be making a number of reforms to the Audio-Visual Media Services Directive, which sets content and advertising rules for European broadcasters. A liberalization of advertising minutage restrictions on linear channels could cause shifts of advertising spending between broadcasters with an adverse impact on some international channels in certain EU countries. In addition, changes to the operation of the ‘country of origin’ rule, which allows pan-EU broadcasters to be regulated in a single EU jurisdiction, could increase scrutiny of our licensing location decisions, and allow countries to impose levies on services licensed outside of their jurisdiction. The reforms are currently the subject of EU Parliamentary and Council scrutiny, with final agreement expected in the first half of 2018.
Restrictions on Film Distribution
In addition to the regulations regarding territorial licensing in the EU discussed above, numerous countries around the world impose restrictions on the number and nature of films that may be distributed in that country. Such regulations in China have the greatest impact, as only 34 foreign films can be distributed annually on a revenue share basis based on box office performance. Those films are selected by relevant authorities in China.
Personal Data Transfers from the EU to the U.S and EU Data Protection Laws
Viacom’s operations rely upon the ability to access or transfer personal data internationally, including between the EU and the U.S. The EU-U.S. Privacy Shield (“Privacy Shield”) is a framework that became effective in July 2016 for the permitted transfer of personal data from the EU to the U.S. Viacom self-certified to the Privacy Shield effective October 28, 2016. Nevertheless, some of the mechanisms permitting transfer of personal data from the EU to the U.S. have been subject to legal challenges, the outcomes of which remain uncertain. Moreover, the Privacy Shield framework is subject to annual review by the relevant EU and U.S. authorities and the outcome of such future reviews is uncertain. In addition, the new EU General Data Protection Regulation, which becomes enforceable on May 25, 2018, will continue to regulate international data transfers while expanding other data protection compliance obligations and authorizing significantly increased fines for noncompliance, requiring additional compliance resources and efforts on our part.
Program Access
Under the U.S. Communications Act of 1934, as amended, vertically integrated cable programmers are generally prohibited from entering into exclusive distribution arrangements or offering different prices, terms or conditions to competing MVPDs unless the differential is justified by certain permissible factors set forth in the regulations promulgated by the FCC. Our wholly-owned program services are not currently subject to these program access rules. Because we and CBS are under common control, each company’s businesses, as well as the businesses of any other commonly controlled company, may be attributable to the other companies for purposes of the program access rules, and therefore the businesses and conduct of CBS could have the effect of making us subject to the rules. In September 2016, the FCC proposed to expand the scope of its rules implementing the program access provisions of the Communications Act. If Viacom or its programming agreements were to become subject to the program access rules, our flexibility to negotiate the most favorable terms available for our content and our ability to offer cable television operators exclusive programming could be adversely affected.
Protecting our Content from Copyright Theft
The unauthorized reproduction, distribution, exhibition or other exploitation of copyrighted material interferes with the market for copyrighted works and disrupts our ability to distribute and monetize our content. The theft of motion pictures, television and other entertainment content presents a significant challenge to our industry, and we take a number of steps to address this concern. Where possible, we make use of technological protection tools, such as encryption, to protect our content. We are actively engaged in enforcement and other activities to protect our intellectual property, including: monitoring online destinations that distribute or otherwise infringe our content and sending takedown or cease and desist notices in appropriate circumstances; using filtering technologies employed by some user-generated content sites; and pursuing litigation and referrals to law enforcement with respect to websites and other online platforms that distribute or facilitate the distribution and exploitation of our content without authorization. We also are actively engaged in educational outreach to the creative community, labor unions, state and federal government officials and other stake holders in an effort to marshal greater resources to combat copyright theft. Additionally, we participate in various industry-wide enforcement initiatives, public relations programs and legislative activities on a worldwide basis. We have had notable success with site-blocking efforts in Europe and Asia, which can be effective in diverting consumers from piracy platforms to legitimate platforms.
Notwithstanding these efforts and the many legal protections that exist to combat piracy, the proliferation of content theft and technological tools with which to carry it out continue to be a challenge. The failure to maintain enhanced legal protections and
16
enforcement tools and to update those tools as threats evolve could make it more difficult for us to adequately protect our intellectual property, which could negatively impact its value and further increase the costs of enforcing our rights as we continue to expend substantial resources to protect our content.
INTELLECTUAL PROPERTY
We create, own and distribute intellectual property worldwide. It is our practice to protect our motion pictures, programs, content, brands, formats, characters, games, publications and other original and acquired works, and ancillary goods and services. The following brands, logos, trade names, trademarks and related trademark families are a few of those strongly identified with the product lines they represent and are significant assets of the Company: Viacom®, Nickelodeon®, Nick Jr.®, MTV®, BET®, Comedy Central®, Paramount Network™, SPIKE®, Nick at Nite®, Nicktoons®, TeenNick®, MTV2®, MTV Classic®, VH1®, CMT®, TV Land®, Logo®, Channel 5® (UK), Telefe® (Argentina), Colors®, Paramount Channel™, mtvU®, Palladia®, BET Networks®, BET HerTM, BET Gospel®, BET Hip Hop®, BET.com®, BET Mobile®, Tr3s®, Paramount Pictures®, Paramount Vantage®, Paramount Classics®, Paramount Animation®, Paramount Players™, Insurge Pictures®, MTV Films®, Nickelodeon Movies™, Paramount Television™ and other domestic and international program services and digital properties.
EMPLOYEES AND LABOR MATTERS
As of September 30, 2017, we employed approximately 10,750 full-time and part-time employees worldwide, and had approximately 900 additional project-based staff on our payroll. We also use many other temporary employees in the ordinary course of our business.
Our Filmed Entertainment segment, through in-house, affiliated and third-party production service companies, engages the services of writers, directors, performers, musicians and various crew members who are subject to certain industry-wide and/or specially negotiated collective bargaining agreements. The Alliance of Motion Picture and Television Producers (“AMPTP”) is a multi-employer trade association, which, along with and on behalf of hundreds of member companies including Paramount Pictures, negotiates the industry-wide collective bargaining agreements with these parties. The AMPTP agreements with the crew (U.S. and British Columbia), musicians and Canadian performers and directors expire in fiscal year 2018. Certain collective bargaining agreements that apply to specific companies have been negotiated in the past, and we expect will be negotiated as the need arises in the future.
Our Media Networks segment, through in-house and third-party production service companies, engages for certain of our productions the services of writers, directors, performers, musicians and various crew members who are subject to certain specially negotiated collective bargaining agreements or one-off agreements. Since these agreements are entered into on a per-channel or per-project basis, negotiations occur on various agreements throughout the year.
Any dispute with the labor organizations that represent any of these parties could disrupt our operations and reduce our revenues.
FINANCIAL INFORMATION ABOUT SEGMENTS AND FOREIGN AND DOMESTIC OPERATIONS
For a description of risks attendant to our foreign operations, see “Item 1A. Risk Factors.” Financial and other information by reportable segment and revenues by geographic area for fiscal years 2017, 2016 and 2015 are set forth in Note 19 to our Consolidated Financial Statements.
AVAILABLE INFORMATION
We file annual, quarterly and current reports, proxy and information statements and other information with the Securities and Exchange Commission (the “SEC”). Our annual reports on Form 10-K, quarterly reports on Form 10-Q, current reports on Form 8-K and any amendments to such reports filed with or furnished to the SEC pursuant to the Securities Exchange Act of 1934, as amended, will be available free of charge on our website at www.viacom.com (under “Investor Relations”) as soon as reasonably practicable after the reports are filed with the SEC. These documents are also available on the SEC’s website at www.sec.gov.
CAUTIONARY STATEMENT CONCERNING FORWARD-LOOKING STATEMENTS
This Annual Report on Form 10-K, including “Item 7. Management’s Discussion and Analysis of Results of Operations and Financial Condition,” contains both historical and forward-looking statements. All statements that are not statements of historical fact are, or may be deemed to be, forward-looking statements. Forward-looking statements reflect our current expectations concerning future results, objectives, plans and goals, and involve known and unknown risks, uncertainties and other factors that are difficult to predict and which may cause future results, performance or achievements to differ. These risks, uncertainties and other factors are discussed in “Item 1A. Risk Factors” below. Other risks, or updates to the risks discussed
17
below, may be described in our news releases and filings with the SEC, including but not limited to our reports on Form 10-Q and Form 8-K. The forward-looking statements included in this document are made only as of the date of this document, and we do not have any obligation to publicly update any forward-looking statements to reflect subsequent events or circumstances.
OUR EXECUTIVE OFFICERS
The following table sets forth the name, age and position of each person who serves as a Viacom executive officer.
Name | Age | Position |
Robert M. Bakish | 53 | President and Chief Executive Officer; Director |
Christa A. D’Alimonte | 48 | Executive Vice President, General Counsel and Secretary |
Wade Davis | 45 | Executive Vice President, Chief Financial Officer |
Katherine Gill-Charest | 53 | Senior Vice President, Controller and Chief Accounting Officer |
DeDe Lea | 53 | Executive Vice President, Global Government Affairs |
Scott Mills | 49 | Executive Vice President, Chief Administrative Officer |
Information about each of our executive officers is set forth below.
Robert M. Bakish | Mr. Bakish has been our President and Chief Executive Officer, and a member of our Board of Directors, since December 2016, having served as Acting President and Chief Executive Officer beginning November 2016. Mr. Bakish joined the predecessor of Viacom in 1997 and has held leadership positions throughout the organization, including as President and Chief Executive Officer of Viacom International Media Networks and its predecessor company, MTV Networks International, from 2007 to 2016. He served as Executive Vice President, Operations and Viacom Enterprises of Viacom’s predecessor; as Executive Vice President and Chief Operating Officer of MTV Networks Advertising Sales; and as Senior Vice President, Planning, Development and Technology at Viacom’s predecessor. Before joining Viacom’s predecessor in 1997, Mr. Bakish was a partner with Booz Allen & Hamilton in its Media and Entertainment practice. Mr. Bakish has served as a director of Avid Technology, Inc. since 2009. |
Christa A. D’Alimonte | Ms. D’Alimonte has been our Executive Vice President, General Counsel and Secretary since April 2017. Prior to that, she was Senior Vice President, Deputy General Counsel and Assistant Secretary beginning in November 2012. Prior to joining Viacom, Ms. D’Alimonte was a partner of Shearman & Sterling LLP, where she was Deputy Practice Group Leader of the Firm’s Global Mergers & Acquisitions group. She first joined Shearman & Sterling in 1993 and became a partner in 2001. |
Wade Davis | Mr. Davis has been our Executive Vice President, Chief Financial Officer since November 2012. Prior to that, he served as Executive Vice President, Strategy and Corporate Development beginning in August 2009, as Senior Vice President, Mergers & Acquisitions and Strategic Planning from January 2007 to August 2009 and as Senior Vice President of Mergers & Acquisitions beginning January 2006. Prior to joining Viacom, Mr. Davis was an investment banker in the technology and media sectors for more than a decade. |
Katherine Gill-Charest | Ms. Gill-Charest has been our Senior Vice President, Controller and Chief Accounting Officer since October 2010. Prior to that, she was Senior Vice President, Deputy Controller beginning in April 2010 and Vice President, Deputy Controller from May 2007 to April 2010. Prior to joining Viacom, Ms. Gill-Charest served as Chief Accounting Officer of WPP Group USA from November 2005 to May 2007 and as its Vice President, Group Reporting from February 2001 to November 2005. |
DeDe Lea | Ms. Lea has been our Executive Vice President, Global Government Affairs since January 2013, having previously served as Executive Vice President, Government Relations beginning in November 2005. Prior to that, she was Senior Vice President, Government Relations of the predecessor of Viacom beginning in September 2005. Prior to that, she served as Vice President of Government Affairs at Belo Corp. from 2004 to 2005 and as Vice President, Government Affairs of Viacom’s predecessor from 1997 to 2004. |
18
Scott Mills | Mr. Mills has been our Executive Vice President, Chief Administrative Officer since May 2015. Previously, he was Executive Vice President, Human Resources and Administration beginning in October 2012. Prior to that, he was President and Chief Operating Officer of BET Networks beginning in July 2007, its President of Digital Media from August 2006 to July 2007 and its Chief Financial Officer beginning in 2003. He first joined BET Networks in 1997, serving as Senior Vice President of Strategy & Business Development, and served as Executive Vice President and Chief Operating Officer of BET Interactive from 1999 to 2003. Mr. Mills has served as a director of Principal Financial Group Inc. since July 2016. |
Item 1A. Risk Factors.
A wide range of risks may affect our business and financial condition and results of operations, now and in the future. We consider the risks described below to be the most significant. There may be other currently unknown or unpredictable economic, business, competitive, regulatory or other factors that could have material adverse effects on our future results.
Our Success Depends on Our Ability to Maintain Attractive Brands and Produce Popular Programming, Motion Pictures and Other Entertainment Content, which is Difficult to Predict
Our ability to maintain attractive brands and generate popular entertainment content, successful tentpole events and consumer-oriented retail and hospitality offerings are key to the success of our business and our ability to generate revenues. The production and distribution of programming, motion pictures and other entertainment content is inherently risky because the revenues we derive from various sources primarily depend on our ability to satisfy consumer tastes and expectations in a consistent manner. The popularity of our content is affected by our ability to maintain or develop strong brand awareness and target key audiences, the quality and attractiveness of competing entertainment content and the availability of alternative forms of entertainment and leisure time activities, including online, mobile and other offerings. Audience tastes change frequently and it is a challenge to anticipate what offerings will be successful at any point in time. We invest substantial capital in our content, including in the production of original content on our networks, in our motion pictures and in our television production business, before learning the extent to which it will garner critical success and popularity with consumers. In addition, general economic conditions affect our audience’s discretionary spending and therefore their willingness to access our content.
In our Media Networks businesses, the popularity of our brands and programming has a significant impact on the revenues we are able to generate from advertising, affiliate fees, consumer products, and other licensing activities. Our ability to successfully predict and adapt to changing consumer tastes and preferences outside the U.S. also impacts our ability to expand our presence internationally. In our Filmed Entertainment business, the theatrical performance of a motion picture affects not only the theatrical revenues we receive but also those from other distribution channels, such as home entertainment, television, various other platforms and apps and licensed consumer products. As a result, a lack of popularity of our offerings could have a material adverse effect on our results of operations in a particular period or over a longer term.
New Technologies, Distribution Platforms and Packaging, as Well as Changes in Consumer Behavior, May Negatively Affect Our Viewership, Revenue and Profitability
Technology and business models in our industry continue to evolve rapidly and new distribution platforms, and increased competition from new entrants and emerging technologies, have added to the complexity of maintaining predictable revenue streams.
Technological advancements have driven changes in consumer behavior and have empowered consumers to seek more control over when, where and how they consume content. For example, consumers are increasingly using time-shifting and advertising blocking technologies that enable users to fast-forward or circumvent advertisements. Substantial use of these technologies could impact the attractiveness of our programming to advertisers, adversely affecting our advertising revenues. In addition, the evolution of consumer preferences away from linear pay television, away from physical towards digital services, and away from rental and purchased services towards subscription services, and the substantial increase in availability of programming without advertising or measurement, may continue to have an adverse impact on our revenues.
In addition, in response to perceived consumer demand, distributors of programming and program services are continuing to develop alternative offerings for consumers, including smaller programming packages known as “skinny bundles,” which are delivered at lower costs than traditional offerings and sometimes allow the consumer to create a customized package of networks; subscription video-on-demand services; ad-supported, free online video products; and original programming hosted on social media platforms. If these alternative offerings continue to gain traction and our networks are not included in those packages, or if consumers increasingly favor alternative offerings over traditional cable subscriptions, we may experience a decline in viewership and ultimately demand for our programming, which could lead to lower affiliate and advertising
19
revenues. These changing distribution models may also impact our ability to negotiate carriage deals on terms favorable to us, thereby having an adverse impact on our revenues.
The Loss of Affiliation Agreements, Renewal on Less Favorable Terms or Adverse Interpretations Could Cause Our Revenues to Decline, and Consolidation Among Distributors Could Continue to Have an Adverse Effect on Our Revenue and Profitability
We are dependent upon our agreements with cable television, direct-to-home satellite television and telecommunications operators, subscription and advertising supported video-on-demand services, and other distributors of our programming and program services. Our affiliate agreements generally have fixed terms that vary by market and distributor, and there can be no assurance that these agreements will be renewed in the future, or renewed on favorable terms, including but not limited to those related to pricing and programming tiers. The loss of favorable packaging and positioning, the loss of carriage on the most widely available cable and satellite programming tiers or the failure to renew our agreements with any distributor could reduce the distribution of our programming and program services and decrease the potential audience for our programs, thereby negatively affecting our growth prospects and revenues from both advertising and affiliate fees.
Similarly, our revenues are dependent on the compliance of major distributors with the terms of our affiliation agreements. As these agreements have grown in complexity, the number of disputes regarding the interpretation, and even validity, of the agreements has grown, resulting in greater uncertainty and, from time to time, litigation seeking to circumscribe enforcement of our rights. For example, some of our distribution agreements may contain “most favored nation” (“MFN”) clauses, which provide that if we enter into an agreement with a distributor and such agreement includes specified terms that are more favorable than those held by a distributor holding an MFN right, we must offer some of those terms to the distributor holding the MFN right. These clauses are generally complex and may lead to disagreement over interpretation and application of such clause. In addition, disagreements with a distributor on the interpretation or validity of an agreement could adversely impact our revenues from both advertising and affiliate fees, as well as our relationship with that distributor.
In addition, consolidation among cable and satellite distributors and telecommunications operators has given the largest operators considerable leverage and market power in their relationships with programmers. We currently have agreements in place with the major U.S. cable and satellite operators and this consolidation has affected, and could continue to affect, our ability to maximize the value of our content through those distributors. In addition, many of the countries and territories in which we distribute our networks also have a small number of dominant distributors. Continued consolidation within the industry could reduce the number of distributors that carry our programming, subject our affiliate revenues to greater volume discounts, impact our ability to effectively compete for audiences, advertising revenue, and distribution, and further increase the negotiating leverage of the cable and satellite television system operators.
All of these factors could have an adverse effect on our business, financial condition or results of operations.
Advertising Market Conditions Could Cause Our Revenues and Operating Results to Decline Significantly
We derive substantial revenues from the sale of advertising on a variety of platforms, and a decline in advertising expenditures could have a significant adverse effect on our revenues and operating results in any given period. The strength of the advertising market can fluctuate in response to the economic prospects of specific advertisers or industries, advertisers’ current spending priorities and the economy in general, and this may adversely affect our advertising revenues. Natural and other disasters, acts of terrorism, political uncertainty or hostilities could lead to a reduction in advertising expenditures as a result of disrupted programming and services, uninterrupted news coverage and economic uncertainty. Our ability to generate advertising revenue is also dependent on demand for our content, the consumers in our targeted demographics, advertising rates and results observed by advertisers. In addition, the pricing and volume of advertising may be affected by shifts in spending toward online and mobile offerings from more traditional media, or toward new ways of purchasing advertising, such as through automated purchasing and advertising exchanges, some or all of which may not be as advantageous to the Company as current advertising methods.
Deficiencies in Audience Measurement on Various Platforms May Adversely Impact Our Advertising Revenues
Advertising sales are largely dependent on audience measurement, and the results of audience measurement techniques can vary for a variety of reasons, including the platforms on which viewing is measured and variations in the employed statistical sampling methods. While Nielsen’s statistical sampling method is the primary measurement technique used in our television advertising sales, we measure and monetize our campaign reach and frequency on and across digital platforms based on other third-party data as well as first-party data using a variety of methods including the number of impressions served and demographics. In addition, multi-platform campaign verification remains in its infancy, and viewership on tablets, smartphones
20
and other mobile devices, which continues to grow rapidly, still is not measured by any one consistently applied method. These variations and changes could have a significant effect on our advertising revenues.
Our New Strategic Direction May Not be Effective in Achieving Our Strategic and Operating Objectives, and Our Efforts May Increase Costs or Otherwise Adversely Affect our Business, Results of Operations and Financial Condition
In February 2017, following significant changes in our senior leadership and a comprehensive review of our operations and performance, we announced a new strategy centered on the following initiatives: focusing on six flagship brands, elevating our approach to content and talent, deepening our partnerships to drive new distribution and advertising revenue, extending the reach of our brands in the digital and physical world, and continuing to optimize and energize our organization. We may not be successful in achieving our strategic and operating objectives and generating revenues and operating income, and our efforts to execute our strategic plan may increase costs or otherwise adversely affect the profitability of our business.
For example:
• | The reallocation of resources to the six flagship brands, and revamped programming strategies at the brands, may not be effective in generating improved ratings and market share. |
• | Ongoing efforts to improve relationships with distribution partners may stall or fail to generate sufficient cooperation, leaving us unable to expand our relationships with these parties. |
• | Steps taken by Paramount’s new leadership team to revamp upcoming film slates may not lead to the anticipated turnaround in a timely manner. |
• | Efforts to de-lever our balance sheet to help maintain an investment grade rating may not succeed or yield the anticipated benefits. |
The success of our business also depends on achieving our inorganic strategic objectives, including through mergers and acquisitions, which may present risks that could impact our operations and earnings. Pursuing and completing such acquisition transactions may involve significant time, effort and resources, and there can be no assurance that such transactions will be successfully implemented.
Service Disruptions or Failures of, or Intrusions Upon, the Company’s or its Vendors’ Networks, Information Systems and Other Technologies Could Result in the Disclosure of Confidential or Valuable Business Information, Disruption of Our Businesses, Damage to Our Brands and Reputation, Legal Exposure and Financial Losses
Networks, information systems and other technologies, including technology systems used in connection with the production and distribution of our programming and motion pictures by the Company or our third-party vendors (“Systems”) are critical to our business activities, and shutdowns or service disruptions of, and intrusions upon, these Systems pose increasing risks. Such shutdowns, disruptions and intrusions may be caused by third-party hacking of computers and systems; dissemination of computer viruses, worms, malware, ransomware and other destructive or disruptive software; denial of service attacks and other bad acts; human error; and power outages, natural disasters, extreme weather, terrorist attacks or other similar events. Shutdowns, disruptions and intrusions from such events could have an adverse impact on the Company, its employees and its audiences, including degradation or disruption of service, loss of data and damage to equipment and data. System redundancy may be ineffective or inadequate, and the Company’s disaster recovery and business continuity planning may not be sufficient to cover everything that could happen. Significant events could result in a disruption of the Company’s operations, reduced revenues, the loss of or damage to the integrity of data used by management to make decisions and operate the Company’s businesses, viewer or advertiser dissatisfaction or a loss of viewers or advertisers, and damage to the Company’s reputation or brands. The Company may not have adequate insurance coverage to compensate it for any losses associated with such events.
The Company is also subject to risks caused by the misappropriation, misuse, falsification or intentional or accidental release or loss of data or programming content maintained in the Systems of the Company or our third-party vendors, including proprietary and personal information (of third parties, employees and users of our online, mobile and app offerings), business information including intellectual property, or other confidential information. Outside parties may attempt to penetrate the Company’s Systems or those of our third-party vendors or fraudulently induce employees, partners or users of our online, mobile and app offerings to disclose sensitive or confidential information in order to gain access to our data or our users’ data, or our programming. The number and sophistication of attempted and successful information security breaches in the U.S. have increased in recent years. If a material breach of the Company’s Systems or those of our third-party vendors occurs, the market perception of the effectiveness of the Company’s information security measures could be harmed, the Company could lose
21
advertisers as well as users of our online, mobile and app offerings and viewers, and our reputation, brands and credibility could be damaged. In addition, if a material breach of the Company’s Systems occurs, the Company could be required to expend significant amounts of money and other resources to repair or replace such Systems or to comply with notification requirements. The Company could also be subject to actions by regulatory authorities and claims asserted in private litigation in the event of a breach of the Company’s or our third-party vendors’ Systems.
Because the techniques used to obtain unauthorized access to, or disable, degrade or sabotage, these Systems change frequently and often are not recognized until launched against a target, we may be unable to anticipate these techniques, implement adequate preventative measures or remediate any intrusion on a timely or effective basis. Moreover, the development and maintenance of these preventative and detective measures is costly and requires ongoing monitoring and updating as technologies change and efforts to overcome security measures become more sophisticated. Despite the Company’s efforts, the possibility of these events occurring cannot be eliminated.
Theft of Our Content, Including Digital Copyright Theft and Other Unauthorized Exhibitions of Our Content, May Decrease Revenue Received from Our Programming, Motion Pictures and Other Entertainment Content and Adversely Affect Our Businesses and Profitability
The success of our businesses depends in part on our ability to maintain and monetize our intellectual property rights in our entertainment content. We are fundamentally a content company and theft of our brands, motion pictures and home entertainment products, television programming, digital content and other intellectual property affects us and the value of our content. Copyright theft is particularly prevalent in many parts of the world that lack effective copyright and technical protective measures similar to those existing in the U.S. and Europe and/or that lack effective enforcement of such measures. Such foreign copyright theft often creates a supply of pirated content for major markets as well. The interpretation of copyright, piracy and other laws as applied to our content, and our piracy detection and enforcement efforts, remain in flux, and some methods of copyright enforcement have encountered political opposition. The failure to appropriately enforce and/or the weakening of existing intellectual property laws could make it more difficult for us to adequately protect our intellectual property and negatively affect its value.
Content theft is made easier by the wide availability of higher bandwidth and reduced storage costs, as well as tools that undermine encryption and other security features and enable infringers to cloak their identities online. In addition, we and our numerous production and distribution partners operate various technology systems in connection with the production and distribution of our programming and motion pictures, and intentional or unintentional acts could result in unauthorized access to our content. The increasing use of digital formats and technologies heightens this risk. For example, new mobile broadcasting tools enable users to livestream content, including copyrighted content, which can lead to content theft and could have an adverse impact on the monetization of our content. Unauthorized access to our content could result in the premature release of motion pictures or television shows as well as a reduction in legitimate audiences, which would likely have significant adverse effects on the value of the affected programming.
Copyright theft has an adverse effect on our business because it reduces the revenue that we are able to receive from the legitimate sale and distribution of our content, undermines lawful distribution channels, reduces the public’s perceived value of our content and inhibits our ability to recoup or profit from the costs incurred to create such works. While legal protections exist, piracy and technological tools with which to engage in copyright theft continue to escalate, evolve and present challenges for enforcement. We are actively engaged in enforcement and other activities to protect our intellectual property, and it is likely that we will continue to expend substantial resources in connection with these efforts. Efforts to prevent the unauthorized reproduction, distribution and exhibition of our content may affect our profitability and may not be successful in preventing harm to our business.
Increased Costs for Programming, Motion Pictures and Other Rights, and Judgments We Make on the Potential Performance of our Content, May Adversely Affect Our Profits
In our Media Networks segment, we have historically produced a significant amount of original programming and other content, and as part of our business strategy we are reallocating resources to our flagship brands, in part with the aim of developing higher quality and quantity of original content. The Filmed Entertainment segment’s core business involves the production, marketing and distribution of motion pictures and television series, the costs of which are significant.
We also acquire programming, motion pictures and television series, as well as a variety of digital content and other ancillary rights such as consumer and home entertainment product offerings, and we pay license fees, royalties and/or contingent
22
compensation in connection with these acquired rights. We also license various music rights from the major record companies, music publishers and performing rights organizations, and some of these sources are highly consolidated.
Our investments in original and acquired programming are significant and involve complex negotiations with numerous third parties, and rapid changes in consumer behavior have increased the risk associated with the success of all kinds of programming. As such, there can be no assurance that we will recoup our investments in programming, motion pictures and other content when the content is broadcast or distributed.
The accounting for the expenses we incur in connection with our programming, motion pictures and other content requires that we make judgments about the potential success and useful life of the program or motion picture. If our estimates prove to be incorrect, it may result in decreased profitability and the accelerated recognition of the expense and/or write-down of the value of the asset. For example, we estimate the ultimate revenues of a motion picture before it is released based on a number of factors, and we then update our estimate of ultimate revenues, including following a film’s initial theatrical release, based on expected future and actual results. If we reduce our estimate of ultimate revenues, it may result in the accelerations of capitalized film cost amortization. Similarly, if we determine it is no longer advantageous for us to air a program on our media networks, we would accelerate our amortization of the program costs.
The Loss of Key Talent Could Disrupt Our Business and Adversely Affect Our Revenues
Our business depends upon the continued efforts, abilities and expertise of not only our corporate and divisional executive teams, but also the various creative talent and entertainment personalities with whom we work. For example, we employ or contract with several entertainment personalities with loyal audiences and we produce motion pictures with highly regarded directors, producers, writers, actors and other talent. These individuals are important to achieving the success of our programs, motion pictures and other content. There can be no assurance that these individuals will remain with us or will retain their current appeal, or that the costs associated with retaining this and new talent will be reasonable. If we fail to retain these individuals on current terms or if our entertainment personalities lose their current appeal or we fail to attract new talent, our revenues and profitability could be adversely affected.
Our Businesses Operate in Highly Competitive Industries
Companies in the cable network, motion picture, digital and consumer product industries depend on the popularity of content, appeal to advertisers and solid distribution relationships. Competition for content, audiences, advertising and distribution is intense and comes from broadcast television, other cable networks (including our own), OTT distributors, social media content distributors, movie studios and independent film producers and distributors, consumer products companies and other entertainment outlets and platforms, as well as from search, social networks, program guides and “second screen” applications. Competition also comes from pirated content.
Increased competition from additional entrants into the market for development and production of original programming, such as Apple, Facebook, YouTube, Netflix, Amazon and Hulu, increases our content costs as creating competing high quality, original content can require significant investment. In addition, as competition with these entrants for the creation and acquisition of quality programming continues to escalate, the complexity of negotiations over acquired rights to the content and the value of the rights we acquire or retain may increase, leading to increased acquisition costs, and our ability to successfully acquire content of the highest quality may face greater uncertainty.
Our ability to compete successfully depends on a number of factors, including our ability to create or acquire high quality and popular programs and films, adapt to new technologies and distribution platforms, and achieve widespread distribution for our content. More content consumption options increase competition for viewers as well as for programming and creative talent, which can decrease our audience ratings, and therefore potentially our advertising revenues.
In addition, our competitors include market participants with interests in multiple media businesses that are often vertically integrated, whereas our Media Networks businesses generally rely on distribution relationships with third parties. As more cable and satellite operators, Internet service providers, other content distributors, aggregators and search providers create or acquire their own content, they may have significant competitive advantages, which could adversely affect our ability to negotiate favorable terms and distribution or otherwise compete effectively in the delivery marketplace. Our competitors could also have preferential access to important technologies, customer data or other competitive information.
There can be no assurance that we will be able to compete successfully in the future against existing or new competitors, or that competition will not have a material adverse effect on our business, financial condition or results of operations.
23
Our Revenues, Expenses and Operating Results May Vary Based on the Timing, Mix, Number and Availability of Our Motion Pictures and Other Programming and on Seasonal Factors
Our revenues, expenses and operating results fluctuate due to the timing, mix, number and availability of our theatrical motion pictures, home entertainment releases and programs for licensing. For example, our operating results may increase or decrease during a particular period relative to the corresponding period in the prior year due to differences in the number and/or mix of films released and the timing of delivery of programming to television and digital distributors. Our operating results also fluctuate due to the timing of the recognition of marketing expenses, which are typically largely incurred prior to the release of motion pictures, with the recognition of related revenues in later periods.
Our business also has experienced and is expected to continue to experience seasonality due to, among other things, seasonal advertising patterns and seasonal influences on audiences’ viewing habits and attendance. Typically, our revenue from advertising is highest in the first quarter of our fiscal year due to the holiday season, among other factors, and revenue from motion pictures is highest in the summer and around holidays. The effects of these variances make it difficult to estimate future operating results based on the results of any specific quarter.
The Failure, Destruction and/or Breach of Satellites and Facilities that We Depend Upon to Distribute Our Programming Could Adversely Affect Our Business and Results of Operations
We use satellite systems, fiber and other methods to transmit our program services to cable television operators and other distributors worldwide. The distribution facilities include uplinks, communications satellites and downlinks. Notwithstanding certain back-up and redundant systems, transmissions may be disrupted as a result of power outages, natural disasters, extreme weather, terrorist attacks, failures or impairments of communications satellites or on-ground uplinks or downlinks used to transmit programming or other similar events. Currently, there are a limited number of communications satellites available for the transmission of programming. If a disruption occurs, we may not be able to secure alternate distribution facilities in a timely manner. Failure to do so could have a material adverse effect on our business and results of operations. There can be no assurance that such failure or breach would not have an adverse effect on our business, financial condition or results of operations.
Political and Economic Conditions in a Variety of Markets around the World Could Have an Adverse Effect on Our Businesses and Harm Our Financial Condition
Our businesses operate and have customers, partners and audiences worldwide, and we are focused on expanding our international operations in key markets, some of which are emerging markets. For that reason, economic conditions in many different markets around the world affect a number of aspects of our businesses, in particular revenues in both domestic and international markets derived from advertising sales, theatrical releases, home entertainment distribution, television licensing and sales of consumer products. Economic conditions in each market can also impact the businesses of our partners who purchase advertising on our networks by causing them to reduce their spending on advertising, and can impact our audience’s discretionary spending. In addition, as we have expanded our international operations, our exposure to foreign currency fluctuations against the U.S. dollar has increased. Such fluctuations could have an adverse effect on our results of operations and net asset balances, and there is no assurance that downward trending currencies will rebound or that stable currencies will remain stable in any period.
In addition, our businesses are exposed to certain political and economic risks inherent in conducting a global business. These include, among others:
• | changes in the regulatory environment in the markets where we operate, including the imposition of new regulations or changed interpretations of existing regulations, particularly regarding repatriation of profits, taxation rules and procedures, tariffs or other trade barriers, currency exchange controls, permit requirements, restrictions on foreign ownership or investment, export and market access restrictions, privacy and data protection regulations, exceptions and limitations on copyright and censorship; |
• | retaliatory actions by governments reacting to changes in other countries, including in the U.S.; |
• | potential for longer payment cycles; |
• | issues related to the presence of corruption in certain markets and changes in anti-corruption laws and regulations; |
24
• | increased risk of political instability in some markets as well as conflict and sanctions preventing us from accessing those markets; |
• | wars, acts of terrorism or other hostilities; and |
• | other financial, political, economic or other uncertainties. |
For example, the formal two-year process governing the UK’s departure from the EU (“Brexit”) began on March 29, 2017. Depending upon the ultimate terms of Brexit, the UK could lose access to the single EU market and to the global trade deals negotiated by the EU on behalf of its members. The effects of the Brexit vote and the perceptions as to the impact of the withdrawal of the UK from the EU may adversely affect business activity, political stability and economic and market conditions in the UK, the Eurozone, the EU and elsewhere and could contribute to instability in global financial and foreign exchange markets, including volatility in the value of the Euro and the British Pound. In addition, Brexit could lead to additional political, legal and economic instability and uncertainty in the EU, including changes in the regulatory environment, which could impact our ability to use UK law under “country of origin” rules for programming in the EU, potential trade barriers between the UK and the EU and between the UK and other countries, and potential content production quota regulations. Given that a portion of our business is conducted in the EU, including the UK, any of these effects of Brexit, and others we cannot anticipate, could have a material adverse effect on our business, operating results, financial condition and cash flows.
These political and economic risks could create instability in any of the markets where our businesses derive revenues, which could result in a reduction of revenue or loss of investment that adversely affects our businesses and harms our financial condition.
Changes in U.S. or Foreign Laws or Regulations May Have an Adverse Effect on Our Business
Our program services and online, mobile and app properties are subject to a variety of laws and regulations, including those relating to intellectual property, content regulation, user privacy, data protection and consumer protection, among others. For example, privacy regulations make it difficult to measure viewership by children. In addition, federal legislators and regulators have proposed voluntary guidelines on advertising to children in an effort to combat unhealthy eating and childhood obesity, and have considered imposing limitations on the marketing of certain movies and regulating product placement and other program sponsorship arrangements. All of these regulations affect our Nickelodeon businesses in particular. The threat of regulatory action or increased scrutiny that deters certain advertisers from advertising or reaching their intended audiences could adversely affect advertising revenue. In addition, the U.S. Congress, the FCC and certain foreign governments currently have under consideration, and may in the future adopt, new laws, regulations and policies regarding a wide variety of matters that could directly or indirectly affect the operations or ownership of our media properties.
Our businesses are also impacted by the laws and regulations of the foreign jurisdictions in which we or our partners operate, including operating license requirements, quotas, tax regimes, currency restrictions and data protection regimes. Laws in some non-U.S. jurisdictions differ in significant respects from those in the U.S., and the enforcement of such laws can be inconsistent and unpredictable. This could impact our ability to expand our operations and undertake activities that we believe are beneficial to our business.
Our businesses could be adversely affected by new laws and regulations, the threat that additional laws or regulations may be forthcoming, as well as our ability to enforce legal rights and changes in existing laws (or changes in interpretation) by courts and regulators. We could be required to change or limit certain of our business practices, which could impact our ability to generate revenues. We could also incur substantial costs to comply with new laws and regulations, or substantial fines and penalties or other liabilities if we fail to comply with new or existing laws or regulations.
We Could be Subject to Material Liabilities as a Result of Changes in Tax Laws, Regulations and Administrative Practices, Interpretations and Policies
We are subject to taxation in the U.S. and numerous international jurisdictions. Our tax rates are impacted by the tax laws, regulations and administrative practices, interpretations and policies in federal, state and local and international territories where our businesses operate, and may be subject to significant change. In addition, our tax returns are routinely audited and litigation or settlements may occur. Such changes, audit settlements or litigation may result in the recognition of an additional charge to our income tax provision in the period and may adversely affect our effective income tax rate or cash payments and may therefore affect our results of operations, financial condition and cash flows.
25
Our Obligations Related to Litigation and Joint Ventures Could Adversely Impact Our Financial Condition
We are involved in pending and threatened legal proceedings from time to time, the outcome of which is inherently uncertain and difficult to predict. We have also made certain investments in joint ventures and have future funding obligations, which may not be recouped until well after our initial investment, if at all. It is uncertain at what point any of these or new liabilities may affect us, and there can be no assurance that our reserves are sufficient to cover these liabilities in their entirety or any one of these liabilities when it becomes due. Therefore, there can be no assurance that these liabilities will not have an adverse effect on our financial condition.
We Could Be Adversely Affected by Strikes and Other Union Activity
We and our business partners engage the services of writers, directors, actors and other talent, trade employees and others who are subject to collective bargaining agreements. Some of our collective bargaining agreements are industry-wide agreements, and we may lack practical control over the negotiations and terms of the agreements. In addition, any labor disputes may disrupt our operations and reduce our revenues, and we may not be able to negotiate favorable terms for a renewal, which could increase our costs.
Through National Amusements’ Voting Control of Viacom and CBS, Certain Directors and Stockholders May Face Actual or Potential Conflicts of Interest, and National Amusements is in a Position to Control Actions that Require, or May be Accomplished by, Stockholder Approval
National Amusements, directly and indirectly, is the controlling stockholder of both Viacom and CBS. National Amusements owns shares in Viacom representing approximately 79.8% of the voting interest in Viacom and approximately 10% of Viacom’s combined common stock. National Amusements is controlled by Sumner M. Redstone, our Chairman Emeritus, who is the Chairman and Chief Executive Officer of National Amusements, through the Sumner M. Redstone National Amusements Trust (the “SMR Trust”), which owns shares in National Amusements representing 80% of the voting interest of National Amusements. The shares representing the other 20% of the voting interest of National Amusements are held through a trust controlled by Shari E. Redstone, who is Mr. Redstone’s daughter and the non-executive Vice Chair of Viacom’s Board of Directors and the President and a member of the Board of Directors of National Amusements. The shares of National Amusements held by the SMR Trust are voted solely by Mr. Redstone until such time as his incapacity or death. Upon Mr. Redstone’s incapacity or death, (1) Ms. Redstone will also become a trustee of the SMR Trust and (2) the shares of National Amusements held by the SMR Trust will be voted by the trustees of the SMR Trust. The current trustees include Mr. Redstone and David R. Andelman, a member of the boards of directors of National Amusements and CBS. The current Board of Directors of National Amusements includes Mr. Redstone, Ms. Redstone and Mr. Andelman. In addition, Mr. Redstone serves as Chairman Emeritus of CBS and Ms. Redstone serves as non-executive Vice Chair of CBS.
The National Amusements ownership structure and the common directors among National Amusements, Viacom and CBS could create, or appear to create, potential conflicts of interest when the directors and controlling stockholder of the commonly controlled entities face decisions that could have different implications for each entity. For example, potential conflicts of interest, or the appearance thereof, could arise in connection with the resolution of any dispute between us and CBS, or when we and CBS enter into any commercial arrangements with each other, despite review by our directors not affiliated with CBS. Our certificate of incorporation and the CBS certificate of incorporation both contain provisions related to corporate opportunities that may be of interest to us and to CBS, and these provisions create the possibility that a corporate opportunity of one company may be used for the benefit of the other company.
In addition, National Amusements’ voting control of us allows it to control the outcome of corporate actions that require, or may be accomplished by, stockholder approval, including the election and removal of directors and transactions involving a change in control. For so long as National Amusements retains voting control of us, our stockholders other than National Amusements will be unable to affect the outcome of any corporate actions. The interests of National Amusements may not be the same as the interests of our other stockholders, who must rely on our independent directors to represent their interests.
We, National Amusements and CBS, and our Respective Businesses, Are Attributable to Each Other for Certain Regulatory Purposes, Which May Limit Business Opportunities or Impose Additional Costs
So long as we, National Amusements and CBS are under common control, each company’s businesses, as well as the businesses of any other commonly controlled company, may be attributable to the other companies for purposes of U.S. and non-U.S. antitrust rules and regulations, certain rules and regulations of the FCC, certain rules under the Employee Retirement Income Security Act of 1974 and certain rules regarding political campaign contributions in the U.S., among others. The businesses of each company may continue to be attributable to the other companies for FCC and other purposes even after the
26
companies cease to be commonly controlled, if the companies share common officers, directors, or attributable stockholders. As a result, the businesses and conduct of any of these other companies may have the effect of limiting the activities or strategic business alternatives available to us, including limitations to which we contractually agreed in connection with our separation from CBS, or may impose additional costs on us.
Item 1B. Unresolved Staff Comments.
Not applicable.
Item 2. Properties.
In addition to the properties described below, we own and lease office, studio, production and warehouse space and broadcast, antenna and satellite transmission facilities throughout the U.S. and around the world for our businesses. We consider our properties adequate for our present needs.
Viacom
• | Our world headquarters is located at 1515 Broadway, New York, New York, where we lease approximately 1.4 million square feet for executive, administrative and business offices for the Company and certain of our operating divisions. The lease runs through June 2031, with two renewal options based on market rates at the time of renewal for ten years each. |
Media Networks
• | In addition to occupying space at 1515 Broadway in New York, we lease the following major office facilities: (a) approximately 400,000 square feet at 345 Hudson Street, New York, New York, through 2022, (b) approximately 278,000 square feet at 1540 Broadway, New York, New York, through 2021, and (c) approximately 210,000 square feet of office space at 1575 North Gower Street, Los Angeles, California, through 2028. |
• | Viacom Media Networks’ Network Operations Center in Hauppauge, New York contains approximately 65,000 square feet of floor space on approximately nine acres of owned land. Its Global Business Services Center in Franklin, Tennessee contains approximately 23,000 square feet of office space under a lease that expires in 2022, and its Global Business Services Center in Budapest, Hungary contains approximately 40,500 square feet of office space under a lease that expires in 2020. |
• | The Nickelodeon Animation Studio at 203-231 West Olive Avenue, Burbank, California contains approximately 180,000 square feet of studio and office space, leased under 2 leases expiring in 2036. |
• | Nickelodeon’s Live Action Studio contains approximately 108,000 square feet of stage and office space at Burbank Studios, 3000 West Alameda Avenue, Burbank, California, under a lease expiring in 2024. |
• | Viacom International Studios located at 50 NW 14th Street, Miami, Florida, contains approximately 60,000 square feet of sound stages, production facilities and office space, under a facilities license agreement expiring in 2018. |
• | CMT’s headquarters in Nashville, Tennessee occupies approximately 86,000 square feet of space for CMT’s executive, administrative and business offices and its studios, under leases expiring in 2020. |
• | Internationally, we occupy approximately 140,000 square feet of space at our owned and leased Hawley Crescent facilities in London, and Telefe occupies approximately 362,000 square feet of office, studio and production space at its owned and leased facilities in Buenos Aires. |
Filmed Entertainment
• | Paramount owns the Paramount Pictures Studio situated at 5555 Melrose Avenue, Los Angeles, California, located on approximately 62 acres of land, and containing approximately 1.85 million square feet of floor space used for executive, administrative and business offices, sound stages, production facilities, theatres, equipment facilities and other ancillary uses. Paramount has embarked on a planned 25-year expansion and revitalization project for the studio. |
27
• | Paramount Pictures International has offices in Chiswick, West London, where it leases approximately 33,000 square feet of space used for executive, administrative and business offices and a viewing cinema through 2024. |
Item 3. Legal Proceedings.
Litigation is inherently uncertain and always difficult to predict. However, based on our understanding and evaluation of the relevant facts and circumstances, we believe that the legal matters described below and other litigation to which we are a party are not likely, in the aggregate, to have a material adverse effect on our results of operations, financial position or operating cash flows.
Purported Derivative Action
On July 20, 2016, a purported derivative action was commenced in Delaware Chancery Court by a purported Viacom stockholder against Viacom and its directors. The complaint alleged that Viacom’s directors breached their fiduciary duties to Viacom in connection with compensation paid to Mr. Redstone and that these breaches permitted a waste of corporate assets and the unjust enrichment of Mr. Redstone. On October 25, 2017, the Court granted Viacom’s motion to dismiss the action.
Item 4. Mine Safety Disclosures.
Not applicable.
28
PART II
Item 5. Market for Viacom Inc.’s Common Equity, Related Stockholder Matters and Issuer Purchases of Equity Securities.
Our voting Class A common stock and non-voting Class B common stock are listed and traded on The NASDAQ Global Select Market under the symbols “VIA” and “VIAB”, respectively.
The table below shows, for the periods indicated, the high and low sales prices per share of our Class A and Class B common stock as reported in FactSet markets services.
Sales Price | |||||||
Low | High | ||||||
Class A common stock – Fiscal 2017 | |||||||
4th Quarter | $ | 36.35 | $ | 42.55 | |||
3rd Quarter | $ | 36.25 | $ | 49.00 | |||
2nd Quarter | $ | 38.60 | $ | 48.80 | |||
1st Quarter | $ | 38.05 | $ | 43.55 | |||
Class A common stock – Fiscal 2016 | |||||||
4th Quarter | $ | 38.61 | $ | 50.40 | |||
3rd Quarter | $ | 37.90 | $ | 50.81 | |||
2nd Quarter | $ | 33.88 | $ | 50.55 | |||
1st Quarter | $ | 41.30 | $ | 54.69 | |||
Class B common stock – Fiscal 2017 | |||||||
4th Quarter | $ | 26.65 | $ | 36.77 | |||
3rd Quarter | $ | 33.30 | $ | 46.70 | |||
2nd Quarter | $ | 35.50 | $ | 46.72 | |||
1st Quarter | $ | 33.94 | $ | 39.93 | |||
Class B common stock – Fiscal 2016 | |||||||
4th Quarter | $ | 34.11 | $ | 46.69 | |||
3rd Quarter | $ | 34.40 | $ | 46.29 | |||
2nd Quarter | $ | 30.11 | $ | 47.47 | |||
1st Quarter | $ | 39.01 | $ | 53.35 | |||
During fiscal 2017 and 2016, our Board of Directors declared the following cash dividends to stockholders of record on both our voting Class A common stock and non-voting Class B common stock:
Declaration Date | Dividend per Share | Record Date | Payment Date | ||
August 2, 2017 | $0.20 | September 15, 2017 | October 2, 2017 | ||
May 18, 2017 | $0.20 | June 15, 2017 | July 3, 2017 | ||
February 6, 2017 | $0.20 | March 15, 2017 | April 3, 2017 | ||
October 31, 2016 | $0.20 | December 15, 2016 | January 3, 2017 | ||
September 21, 2016 | $0.20 | September 26, 2016 | October 3, 2016 | ||
May 18, 2016 | $0.40 | June 15, 2016 | July 1, 2016 | ||
January 14, 2016 | $0.40 | March 13, 2016 | April 1, 2016 | ||
November 11, 2015 | $0.40 | December 15, 2015 | January 4, 2016 | ||
As of October 31, 2017, there were 1,330 record holders of our Class A common stock and 19,524 record holders of our Class B common stock.
29
Performance Graph
The following graph compares the cumulative total stockholder return of our Class A common stock and our Class B common stock with the cumulative total stockholder return of the companies listed in the Standard & Poor’s 500 Index and a peer group of companies comprised of The Walt Disney Company, Twenty-First Century Fox Inc. (News Corporation prior to June 2013), Time Warner Inc., CBS Corporation, Discovery Communications, Inc. and Scripps Networks Interactive Inc.
The performance graph assumes $100 invested on September 30, 2012 in each of our Class A common stock, our Class B common stock, the S&P 500 Index and the stock of our peer group companies, including reinvestment of dividends, for the years ended September 30, 2013, 2014, 2015, 2016 and 2017.
Total Cumulative Stockholder Return
For the Years Ended September 30, 2013, 2014, 2015, 2016 and 2017
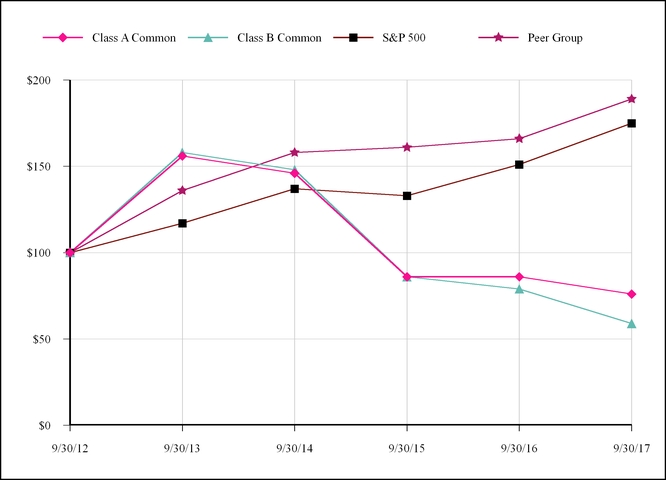
9/30/12 | 9/30/13 | 9/30/14 | 9/30/15 | 9/30/16 | 9/30/17 | |||||||
Class A Common | $100 | $156 | $146 | $86 | $86 | $76 | ||||||
Class B Common | $100 | $158 | $148 | $86 | $79 | $59 | ||||||
S&P 500 | $100 | $117 | $137 | $133 | $151 | $175 | ||||||
Peer Group | $100 | $136 | $158 | $161 | $166 | $189 | ||||||
Equity Compensation Plan Information
Information required by this item will be contained in the Proxy Statement for our 2018 Annual Meeting of Stockholders under the heading “Equity Compensation Plan Information,” which information is incorporated herein by reference.
30
Item 6. Selected Financial Data.
The selected Consolidated Statement of Earnings data for the years ended September 30, 2017, 2016 and 2015 and the Consolidated Balance Sheet data as of September 30, 2017 and 2016 should be read in conjunction with the audited financial statements, Management’s Discussion and Analysis of Results of Operations and Financial Condition and other financial information presented elsewhere in this report. The selected Consolidated Statement of Earnings for the years ended September 30, 2014 and 2013 and the Consolidated Balance Sheet data as of September 30, 2015, 2014 and 2013 have been derived from audited financial statements not included herein.
CONSOLIDATED STATEMENT OF EARNINGS DATA
Year Ended September 30, | |||||||||||||||||||
(in millions, except per share amounts) | 2017 | 2016 | 2015 | 2014 | 2013 | ||||||||||||||
Revenues | $ | 13,263 | $ | 12,488 | $ | 13,268 | $ | 13,783 | $ | 13,794 | |||||||||
Operating income | $ | 2,489 | $ | 2,526 | $ | 3,112 | $ | 4,082 | $ | 3,836 | |||||||||
Net earnings from continuing operations (Viacom and noncontrolling interests) | $ | 1,919 | $ | 1,471 | $ | 2,002 | $ | 2,464 | $ | 2,449 | |||||||||
Net earnings from continuing operations attributable to Viacom | $ | 1,871 | $ | 1,436 | $ | 1,922 | $ | 2,392 | $ | 2,407 | |||||||||
Net earnings from continuing operations per share attributable to Viacom: | |||||||||||||||||||
Basic | $ | 4.68 | $ | 3.62 | $ | 4.78 | $ | 5.54 | $ | 4.95 | |||||||||
Diluted | $ | 4.67 | $ | 3.61 | $ | 4.73 | $ | 5.43 | $ | 4.86 | |||||||||
Weighted average number of common shares outstanding: | |||||||||||||||||||
Basic | 399.9 | 396.5 | 402.2 | 432.1 | 486.2 | ||||||||||||||
Diluted | 400.6 | 398.0 | 406.0 | 440.2 | 494.8 | ||||||||||||||
Dividends declared per share of Class A and Class B common stock | $ | 0.80 | $ | 1.40 | $ | 1.46 | $ | 1.26 | $ | 1.15 | |||||||||
CONSOLIDATED BALANCE SHEET DATA
September 30, | |||||||||||||||||||
(in millions) | 2017 | 2016 | 2015 | 2014 | 2013 | ||||||||||||||
Total assets | $ | 23,698 | $ | 22,508 | $ | 22,143 | $ | 22,985 | $ | 23,710 | |||||||||
Total debt | $ | 11,119 | $ | 11,913 | $ | 12,285 | $ | 12,699 | $ | 11,818 | |||||||||
Total Viacom stockholders’ equity | $ | 6,035 | $ | 4,277 | $ | 3,538 | $ | 3,719 | $ | 5,193 | |||||||||
Total equity | $ | 6,119 | $ | 4,330 | $ | 3,599 | $ | 3,747 | $ | 5,190 | |||||||||
31
Item 7. Management’s Discussion and Analysis of Results of Operations and Financial Condition.
Management’s discussion and analysis of results of operations and financial condition is provided as a supplement to and should be read in conjunction with the consolidated financial statements and related notes to enhance the understanding of our results of operations, financial condition and cash flows. References in this document to “Viacom,” “Company,” “we,” “us” and “our” mean Viacom Inc. and our consolidated subsidiaries, unless the context requires otherwise.
Significant components of the management’s discussion and analysis of results of operations and financial condition section include:
Page | ||
• | Overview: The overview section provides a summary of Viacom and our reportable business segments and the principal factors affecting our results of operations. | |
• | Results of Operations: The results of operations section provides an analysis of our results on a consolidated and reportable segment basis for the three years ended September 30, 2017. In addition, we provide a discussion of items that affect the comparability of our results of operations. | |
• | Liquidity and Capital Resources: The liquidity and capital resources section provides a discussion of our cash flows for the three years ended September 30, 2017, and of our outstanding debt, commitments and contingencies existing as of September 30, 2017. | |
• | Market Risk: The market risk section discusses how we manage exposure to market and interest rate risks. | |
• | Critical Accounting Policies and Estimates: The critical accounting policies and estimates section provides detail with respect to accounting policies that are considered by management to require significant judgment and use of estimates and that could have a significant impact on our financial statements. | |
• | Other Matters: The other matters section provides a discussion of related party transactions and agreements. | |
OVERVIEW
Summary
We are home to premier global media brands that create compelling entertainment content - including television programs, motion pictures, short-form content, games, consumer products, podcasts, live events and social media experiences - for audiences in more than 180 countries on various platforms and devices.
In fiscal year 2017, following significant changes in our senior leadership and a comprehensive review of our operations and performance, we began to execute against a new business strategy that includes, among other things, the designation of six brands - Nickelodeon, Nick Jr., MTV, BET, Comedy Central and Paramount - as our highest priority, “flagship” brands.
We operate through two reportable segments: Media Networks and Filmed Entertainment. Our measure of segment performance is adjusted operating income. We define adjusted operating income for our segments as operating income, before equity-based compensation and certain other items identified as affecting comparability, when applicable. Equity-based compensation is excluded from our segment measure of performance since it is set and approved by the Compensation Committee of Viacom’s Board of Directors in consultation with corporate executive management, and is included as a component of consolidated adjusted operating income.
Media Networks
Our Media Networks segment provides entertainment content, services and related branded products for consumers in targeted demographics attractive to advertisers, content distributors and retailers. We create, acquire and distribute programming and other content for our audiences worldwide, distributed through cable, satellite and broadband services, on linear, streaming and on-demand bases, via a variety of owned and third party platforms, including televisions, branded apps and sites, for viewing on a wide range of devices such as connected televisions, PCs, tablets, smartphones and other connected devices. The Media Networks segment also licenses its brands for consumer products and recreational opportunities, and produces live events.
32
Management’s Discussion and Analysis
of Results of Operations and Financial Condition
(continued)
Our Media Networks segment operates globally as Viacom Media Networks through three brand groups, our Global Entertainment Group, the Nickelodeon Group and BET Networks. Globally, our program services reach approximately 4.3 billion cumulative television subscribers in 183 countries and 43 languages, via 300 locally programmed and operated television channels, including Nickelodeon, Nick Jr., MTV, BET, Comedy Central, SPIKE (which will be rebranded as Paramount Network in the United States in January 2018), VH1, TV Land, CMT, Logo and our program services created specifically for international audiences, such as British public service broadcaster Channel 5 (in the United Kingdom), Telefe (in Argentina), Colors (in India) and Paramount Channel (in a variety of territories). Cumulative television subscribers aggregate total subscribers to each Viacom owned and operated, joint venture and licensee channel.
Our Media Networks segment generates revenues in three categories: (i) the sale of advertising and marketing services, (ii) affiliate fees from distributors of our programming and program services and (iii) ancillary activities such as consumer products.
Advertising Revenues
Our Media Networks segment generates revenues from the sale of advertising and from marketing services. Our advertising revenues generally depend on the number of viewers and viewership demographics. Demand and pricing for our advertising depend on the attractiveness of our offerings to advertisers, viewership, and overall market conditions. We also drive additional demand through integrated sales of multi-platform advertising and marketing opportunities and through our integrated marketing services, providing unique branded entertainment and custom sponsorship opportunities to our advertisers. Our advertising revenues may be affected by the strength of advertising markets and general economic conditions, and may fluctuate depending on the success of our programming, as measured by viewership, at any given time. Measured viewership may vary due to the success of our programming (due to, among other things, the timing of availability of new episodes of popular programming and the performance of competing programs and other entertainment alternatives for viewers), the platforms on which our programming is available, as well as variations related to the methods used by third parties to measure viewership. Advertising revenues may also fluctuate due to seasonal variations, the timing of holidays and significant programming events such as awards shows and premieres. Typically, advertising revenues are highest in the first quarter of our fiscal year. We continue to invest in proprietary data platforms and advanced analytics that enable our customers to better target and measure the impact of their advertising, including our Viacom Vantage platform and the OpenAP consortium we created with Fox Networks Group and Turner. Additionally, we have a branded content agency, Viacom Velocity, that integrates clients’ brands into custom content across our platforms. We are also working with distributors of our programming to evolve our multi-platform advertising offerings to include targeting and customization through Vantage, Velocity and OpenAP.
Affiliate Revenues
Our affiliate revenues are generated through fees from distributors of our programming and program services, such as cable television operators, direct-to-home satellite television operators, mobile networks and subscription video-on-demand and other over-the-top (“OTT”) services. Our agreements with multichannel television service providers are generally multi-year carriage agreements with set rate increases. The amount of fees we receive is generally a function of the number of subscribers and the rates we receive per subscriber. Expirations of these affiliate agreements are staggered. We are also working with these distributors to create new and improved pay television revenue opportunities. Under subscription video-on-demand and other similar OTT agreements, we make certain programs available for distribution on one or more dates, and our revenue under these OTT agreements is recognized upon the availability of the programs licensed; therefore, revenue will fluctuate depending on the timing of when programming is made available throughout the license period.
Ancillary Revenues
Our Media Networks ancillary revenues are principally derived from (i) our consumer products activities, which include licensing our brands and intellectual property, as well as creation and publishing of interactive games across various platforms (including mobile, PC and console), (ii) recreational experiences and live events, (iii) viewing of our programming through electronic sell-through and download-to-rent services and the sale of DVDs and Blu-Ray discs and (iv) television syndication of our content. Our ancillary revenues vary based on consumer spending, the popularity of our programming, the volume of content available during a particular period and acceptance of our and our partners’ products.
Media Networks segment expenses consist of operating expenses, selling, general and administrative (“SG&A”) expenses and depreciation and amortization.
Operating expenses are comprised of costs related to original and acquired programming, including programming amortization, expenses associated with the distribution of home entertainment products and consumer products licensing, participations and residuals, royalties, integrated marketing expenses and other costs of sales. SG&A expenses consist primarily of employee compensation, marketing, research and professional service fees and facility and occupancy costs. Depreciation and
33
Management’s Discussion and Analysis
of Results of Operations and Financial Condition
(continued)
amortization expenses reflect depreciation of fixed assets, including transponders financed under capital leases, and amortization of finite-lived intangible assets.
Filmed Entertainment
Our Filmed Entertainment segment develops, produces, finances, acquires and distributes motion pictures, television programming and other entertainment content under the Paramount Pictures, Paramount Players, Paramount Animation and Paramount Television divisions, in various markets and media worldwide, for itself and for third parties. It partners on various projects with key Viacom franchises, including Nickelodeon Movies and MTV Films.
Motion pictures produced, acquired and/or distributed by the Filmed Entertainment segment are generally first exhibited theatrically in domestic and/or international markets and then released in various markets through electronic sell-through, DVDs and Blu-ray discs, transactional video-on-demand, subscription video-on-demand, pay television, cable television and free television, free video-on-demand and by airlines and hotels. Paramount Television draws on Paramount’s extensive library of film properties and develops original programming for television and digital platforms.
Producing, marketing and distributing motion pictures and television programming can involve significant costs. The timing of a motion picture’s release can also cause our financial results to vary. For example, marketing costs are generally incurred before and throughout the theatrical release of a film and, to a lesser extent, other distribution windows, and are expensed as incurred. As a result, we typically incur losses with respect to a particular film prior to and during the film’s theatrical exhibition, and recoupment of investment as well as profitability for the film may not be realized until well after its theatrical release. Therefore, the results of the Filmed Entertainment segment can be volatile as films work their way through the various distribution windows.
Our Filmed Entertainment segment generates revenues in four categories: (i) the release and/or distribution of motion pictures theatrically, (ii) the release and/or distribution of film and television product through home entertainment, (iii) the licensing of film and television product to television and digital platforms and (iv) other ancillary activities.
Theatrical Revenues
Paramount generates revenues worldwide from the theatrical release and/or distribution of motion pictures, primarily from audience ticket sales. Each motion picture is a separate and distinct product with its revenues, and ultimate profitability, dependent upon many factors, among which audience response, domestically and internationally, is of fundamental importance. Theatrical revenues may also be affected by the number, timing and mix of releases and competitive offerings in any given period, consumer tastes and consumption habits, and overall economic conditions, including trends in discretionary spending. The theatrical success of a motion picture is a significant factor in determining the revenues it is likely to generate in home entertainment markets and licensing arrangements for television and other platforms. Revenues from motion picture theatrical releases tend to be cyclical with increases around the holidays that fall during the first quarter of our fiscal year, and in the summer months during our fourth quarter.
Home Entertainment Revenues
Home entertainment revenues are derived from the worldwide sales and distribution of DVDs and Blu-ray discs relating to the motion pictures released theatrically by Paramount and programming of other Viacom brands such as Nickelodeon, MTV, Comedy Central and BET, as well as certain acquired films and content distributed on behalf of third parties such as CBS Corporation (“CBS”). Home entertainment revenues are also derived from the viewing of our films on a “transactional” basis through transactional video-on-demand and electronic sell-through services around the world, for a fee and/or on a revenue sharing basis. Our home entertainment revenues may be affected by the number, timing and mix of releases and competitive offerings in any given period, consumer tastes and consumption habits, the prominence given by distributors and retailers to our releases compared to those of our competitors, and overall economic conditions, including trends in discretionary spending.
Licensing Revenues
Paramount generates fees by licensing, around the world on a territory by territory basis, films and television programs produced, acquired or distributed by Paramount, for a fee or on a revenue sharing basis, to subscription video-on-demand, pay and basic cable television, free television and free video-on-demand services. Revenue from the licensing of film and television exhibition rights is recognized upon availability for airing by the licensee and will fluctuate depending on the number and mix of available titles in any given territory.
34
Management’s Discussion and Analysis
of Results of Operations and Financial Condition
(continued)
Ancillary Revenues
Paramount generates ancillary revenues by providing production and facilities services to third parties, primarily at Paramount’s studio lot. Paramount also generates ancillary revenues by licensing its brands for consumer products, themed restaurants, hotels and resorts, live stage plays, film clips and theme parks and other location-based entertainment projects.
Filmed Entertainment segment expenses consist of operating expenses, SG&A expenses and depreciation and amortization.
Operating expenses principally include the amortization of costs of our released feature films and television programming (including participations and residuals), print and advertising expenses and other distribution costs. SG&A expenses include employee compensation, facility and occupancy costs, professional service fees and other overhead costs. Depreciation and amortization expense principally consists of depreciation of fixed assets.
RESULTS OF OPERATIONS
Our summary consolidated results of operations are presented below for the years ended September 30, 2017, 2016 and 2015.
2017 vs. 2016 | 2016 vs. 2015 | ||||||||||||||||||||||||
Year Ended September 30, | Better/(Worse) | Better/(Worse) | |||||||||||||||||||||||
(in millions, except per share amounts) | 2017 | 2016 | 2015 | $ | % | $ | % | ||||||||||||||||||
GAAP | |||||||||||||||||||||||||
Revenues | $ | 13,263 | $ | 12,488 | $ | 13,268 | $ | 775 | 6 | % | $ | (780 | ) | (6 | )% | ||||||||||
Operating income | 2,489 | 2,526 | 3,112 | (37 | ) | (1 | ) | (586 | ) | (19 | ) | ||||||||||||||
Net earnings from continuing operations attributable to Viacom | 1,871 | 1,436 | 1,922 | 435 | 30 | (486 | ) | (25 | ) | ||||||||||||||||
Diluted EPS from continuing operations | 4.67 | 3.61 | 4.73 | 1.06 | 29 | (1.12 | ) | (24 | ) | ||||||||||||||||
Non-GAAP* | |||||||||||||||||||||||||
Adjusted operating income | $ | 2,743 | $ | 2,732 | $ | 3,920 | $ | 11 | — | $ | (1,188 | ) | (30 | )% | |||||||||||
Adjusted net earnings from continuing operations attributable to Viacom | 1,511 | 1,465 | 2,210 | 46 | 3 | (745 | ) | (34 | ) | ||||||||||||||||
Adjusted diluted EPS from continuing operations | 3.77 | 3.68 | 5.44 | 0.09 | 2 | (1.76 | ) | (32 | ) | ||||||||||||||||
* See “Factors Affecting Comparability” section below for a reconciliation of our reported results to our adjusted results, which are calculated on a non-GAAP basis. | |||||||||||||||||||||||||
Factors Affecting Comparability
The Consolidated Financial Statements reflect our results of operations, financial position and cash flows reported in accordance with accounting principles generally accepted in the United States of America (“GAAP”). Our results have been affected by certain items identified as affecting comparability. Accordingly, when applicable, we use non-GAAP measures such as consolidated adjusted operating income, adjusted earnings from continuing operations before provision for income taxes, adjusted provision for income taxes, adjusted net earnings from continuing operations attributable to Viacom and adjusted diluted earnings per share (“EPS”) from continuing operations, among other measures, to evaluate our actual operating performance and for planning and forecasting of future periods. We believe that the adjusted results provide relevant and useful information for investors because they clarify our actual operating performance, make it easier to compare our results with those of other companies and allow investors to review performance in the same way as our management. Since these are not measures of performance calculated in accordance with GAAP, they should not be considered in isolation of, or as a substitute for, operating income, earnings from continuing operations before provision for income taxes, provision for income taxes, net earnings from continuing operations attributable to Viacom and diluted EPS from continuing operations as indicators of operating performance and they may not be comparable to similarly titled measures employed by other companies.
The following tables reconcile our reported results (GAAP) to our adjusted results (non-GAAP) for the years ended September 30, 2017, 2016 and 2015. The tax impacts included in the tables below have been calculated using the rates applicable to the adjustments presented.
35
Management’s Discussion and Analysis
of Results of Operations and Financial Condition
(continued)
2017
Year Ended September 30, 2017 | |||||||||||||||||||
(in millions, except per share amounts) | Operating Income | Earnings from Continuing Operations Before Provision for Income Taxes | Provision for Income Taxes | Net Earnings from Continuing Operations Attributable to Viacom | Diluted EPS from Continuing Operations | ||||||||||||||
Reported results (GAAP) | $ | 2,489 | $ | 2,212 | $ | 293 | $ | 1,871 | $ | 4.67 | |||||||||
Factors Affecting Comparability: | |||||||||||||||||||
Restructuring and programming charges | 381 | 381 | 135 | 246 | 0.61 | ||||||||||||||
Gain on asset sales | (127 | ) | (412 | ) | (116 | ) | (285 | ) | (0.71 | ) | |||||||||
Loss on extinguishment of debt | — | 20 | 7 | 13 | 0.03 | ||||||||||||||
Investment impairment | — | 10 | 4 | 6 | 0.01 | ||||||||||||||
Discrete tax benefit | — | — | 340 | (340 | ) | (0.84 | ) | ||||||||||||
Adjusted results (Non-GAAP) | $ | 2,743 | $ | 2,211 | $ | 663 | $ | 1,511 | $ | 3.77 | |||||||||
Restructuring and programming charges: We recognized a pre-tax charge of $381 million, reflecting $237 million of restructuring charges and $144 million of programming charges resulting from the execution of our flagship brand strategy and strategic initiatives at Paramount. See Note 14 of the Consolidated Financial Statements for additional information. As we continue to evaluate our strategic initiatives, we may incur additional restructuring and other charges in fiscal 2018.
Gain on asset sales: In 2017, a consolidated entity completed the sale of broadcast spectrum in connection with the FCC’s broadcast spectrum auction. The sale resulted in a pre-tax gain of $127 million recorded within Operating income, with $11 million attributable to the noncontrolling interest. We also completed the sale of our 49.76% interest in EPIX in 2017, resulting in a pre-tax gain of $285 million recorded within non-operating gains and losses in the Consolidated Statement of Earnings.
Loss on extinguishment of debt: We redeemed senior notes and debentures totaling $3.3 billion in 2017, resulting in the recognition of a net pre-tax extinguishment loss of $20 million within Other Items, net in the Consolidated Statement of Earnings.
Investment impairment: We recognized a $10 million impairment loss included within Other items, net in the Consolidated Statement of Earnings in connection with the write-down of a cost method investment in 2017.
Discrete tax benefit: The net discrete tax benefit was principally related to the recognition of foreign tax credits realized during the fourth fiscal quarter of 2017 on the distribution to Viacom’s U.S. group of certain securities, the reversal of a valuation allowance on capital loss carryforwards in connection with the sale of our investment in EPIX and the release of tax reserves with respect to certain effectively settled tax positions.
2016
Year Ended September 30, 2016 | |||||||||||||||||||
(in millions, except per share amounts) | Operating Income | Earnings from Continuing Operations Before Provision for Income Taxes | Provision for Income Taxes | Net Earnings from Continuing Operations Attributable to Viacom | Diluted EPS from Continuing Operations | ||||||||||||||
Reported results (GAAP) | $ | 2,526 | $ | 1,990 | $ | 519 | $ | 1,436 | $ | 3.61 | |||||||||
Factors Affecting Comparability: | |||||||||||||||||||
Restructuring | 206 | 206 | 75 | 131 | 0.33 | ||||||||||||||
Discrete tax benefit | — | — | 102 | (102 | ) | (0.26 | ) | ||||||||||||
Adjusted results (Non-GAAP) | $ | 2,732 | $ | 2,196 | $ | 696 | $ | 1,465 | $ | 3.68 | |||||||||
Restructuring charge: We recognized a pre-tax restructuring charge of $206 million in connection with the separation of certain senior executives. The restructuring charge includes the cost of separation payments of $138 million and the acceleration of equity-based compensation expense of $68 million. See Note 14 of the Consolidated Financial Statements for additional information.
36
Management’s Discussion and Analysis
of Results of Operations and Financial Condition
(continued)
Discrete tax benefit: The net discrete tax benefit was principally related to a tax accounting method change granted by the Internal Revenue Service, the release of tax reserves with respect to certain effectively settled tax positions and the recognition of capital loss carryforwards, partially offset by a reduction in qualified production activity tax benefits as a result of retroactively reenacted legislation.
2015
Year Ended September 30, 2015 | |||||||||||||||||||
(in millions, except per share amounts) | Operating Income | Earnings from Continuing Operations Before Provision for Income Taxes | Provision for Income Taxes | Net Earnings from Continuing Operations Attributable to Viacom | Diluted EPS from Continuing Operations | ||||||||||||||
Reported results (GAAP) | $ | 3,112 | $ | 2,503 | $ | 501 | $ | 1,922 | $ | 4.73 | |||||||||
Factors Affecting Comparability: | |||||||||||||||||||
Restructuring and programming charges | 784 | 784 | 264 | 520 | 1.28 | ||||||||||||||
Loss on pension settlement | 24 | 24 | 9 | 15 | 0.04 | ||||||||||||||
Loss on extinguishment of debt | — | 18 | 7 | 11 | 0.03 | ||||||||||||||
Discrete tax benefit | — | — | 258 | (258 | ) | (0.64 | ) | ||||||||||||
Adjusted results (Non-GAAP) | $ | 3,920 | $ | 3,329 | $ | 1,039 | $ | 2,210 | $ | 5.44 | |||||||||
Restructuring and programming charges: We recognized a pre-tax charge of $784 million, reflecting $578 million of programming charges and a $206 million restructuring charge associated with workforce reductions. See Note 14 of the Consolidated Financial Statements for additional information.
Loss on pension settlement: The pre-tax non-cash charge of $24 million was driven by the settlement of pension benefits of certain participants of our funded pension plan.
Loss on extinguishment of debt: In September 2015, we redeemed $550 million of the total $918 million outstanding of our 6.250% Senior Notes due April 2016, at a redemption price equal to the sum of the principal amount and a make-whole amount, together totaling $568 million, and accrued interest of $14 million. As a result of the redemption, we recognized a pre-tax extinguishment loss of $18 million within Other Items, net in the Consolidated Statement of Earnings.
Discrete tax benefit: During 2015, we reorganized certain non-U.S. subsidiaries in order to facilitate a more efficient movement of non-U.S. cash and to support the expansion of key areas for growth internationally. The net discrete tax benefit was principally related to excess foreign tax credits attributable to a taxable repatriation of non-U.S. earnings from reorganized entities and the release of tax reserves with respect to certain effectively settled tax positions.
YEAR ENDED SEPTEMBER 30, 2017 vs. 2016
Consolidated Results of Operations
Revenues
Worldwide revenues increased $775 million, or 6%, to $13.263 billion in the year ended September 30, 2017. Filmed Entertainment revenues increased $627 million, or 24%, and Media Networks revenues increased $154 million, or 2%, with both segments reflecting increases across all revenue streams.
Expenses
Total expenses increased $939 million, or 9%, to $10.901 billion in the year ended September 30, 2017, principally reflecting higher segment expenses, as well as current year restructuring and programming charges of $381 million, compared with $206 million of restructuring charges in the prior year. Filmed Entertainment expenses increased $462 million, or 15%, primarily reflecting higher operating expenses. Media Networks expenses increased $341 million, or 5%, principally driven by higher operating and SG&A expenses.
Operating
Operating expenses increased $752 million, or 11%, to $7.436 billion in the year ended September 30, 2017. Consolidated operating expenses include a programming charge of $144 million in the current year, as described in more detail in “Factors Affecting Comparability”. Filmed Entertainment operating expenses increased $445 million, or 16%, and Media Networks operating expenses increased $169 million, or 4%.
37
Management’s Discussion and Analysis
of Results of Operations and Financial Condition
(continued)
Selling, General and Administrative
SG&A expenses increased $154 million, or 5%, to $3.005 billion in the year ended September 30, 2017, reflecting higher segment expenses of $186 million, partially offset by a decrease in equity-based compensation of $41 million, primarily driven by management changes. Media Networks SG&A expenses increased $163 million, or 7%, and Filmed Entertainment SG&A expenses increased $23 million, or 7%.
Restructuring
As discussed in “Factors Affecting Comparability”, restructuring charges of $237 million and $206 million were recognized in the years ended September 30, 2017 and 2016, respectively.
Gain on Asset Sale
As discussed in “Factors Affecting Comparability”, the year ended September 30, 2017 includes a $127 million gain on the sale of broadcast spectrum.
Operating Income
Operating income decreased $37 million, or 1%, to $2.489 billion in the year ended September 30, 2017, reflecting the operating results discussed above. Excluding the items discussed in “Factors Affecting Comparability”, adjusted operating income increased $11 million to $2.743 billion in the year ended September 30, 2017. Filmed Entertainment adjusted operating results improved $165 million, or 37%, principally reflecting the lapping of a prior year film impairment charge and higher profits from Paramount Television productions. Media Networks adjusted operating income decreased $187 million, or 5%, to $3.297 billion, as higher revenues were more than offset by increased expenses.
Income Taxes
Our effective income tax rate was 13.2% in the year ended September 30, 2017. The net discrete tax benefit of $340 million, taken together with the discrete tax impact of the other factors affecting comparability, reduced the effective income tax rate by 16.8 percentage points. Excluding the impact of discrete tax items, our adjusted effective income tax rate was 30.0% in 2017, a decline of 1.7 percentage points from the prior year, primarily driven by the change in the mix of domestic and international income.
Our effective income tax rate was 26.1% in the year ended September 30, 2016. The net discrete tax benefit of $102 million, taken together with the discrete tax impact of the restructuring charge, reduced the effective income tax rate by 5.6 percentage points. Excluding the impact of discrete tax items, our adjusted effective income tax rate was 31.7% in 2016.
Net Earnings from Continuing Operations Attributable to Viacom
Net earnings from continuing operations attributable to Viacom increased $435 million, or 30%, to $1.871 billion in the year ended September 30, 2017, principally due to gains on asset sales. Excluding the items discussed in “Factors Affecting Comparability”, adjusted net earnings from continuing operations attributable to Viacom increased $46 million, or 3%, to $1.511 billion in the year ended September 30, 2017, driven by the decrease in adjusted effective tax rate and increase in adjusted operating income.
Diluted Earnings Per Share from Continuing Operations
Diluted EPS from continuing operations increased $1.06 per diluted share to $4.67 in the year ended September 30, 2017, reflecting the impact of net earnings. Excluding the items discussed in “Factors Affecting Comparability”, adjusted diluted EPS from continuing operations increased $0.09 per diluted share to $3.77. Foreign exchange had an unfavorable $0.05 impact on diluted and adjusted diluted EPS from continuing operations.
Segment Results of Operations
Transactions between reportable segments are accounted for as third-party arrangements for the purposes of presenting segment results of operations. Typical intersegment transactions include the purchase of advertising by the Filmed Entertainment segment on Media Networks’ properties and the purchase of Filmed Entertainment’s feature film and television content by Media Networks.
38
Management’s Discussion and Analysis
of Results of Operations and Financial Condition
(continued)
Media Networks
Year Ended September 30, | Better/(Worse) | |||||||||||||
(in millions) | 2017 | 2016 | $ | % | ||||||||||
Revenues by Component | ||||||||||||||
Advertising | $ | 4,862 | $ | 4,809 | $ | 53 | 1 | % | ||||||
Affiliate | 4,638 | 4,556 | 82 | 2 | ||||||||||
Ancillary | 596 | 577 | 19 | 3 | ||||||||||
Total revenues by component | $ | 10,096 | $ | 9,942 | $ | 154 | 2 | % | ||||||
Expenses | ||||||||||||||
Operating | $ | 4,232 | $ | 4,063 | $ | (169 | ) | (4 | )% | |||||
Selling, general and administrative | 2,392 | 2,229 | (163 | ) | (7 | ) | ||||||||
Depreciation and amortization | 175 | 166 | (9 | ) | (5 | ) | ||||||||
Total expenses | $ | 6,799 | $ | 6,458 | $ | (341 | ) | (5 | )% | |||||
Adjusted Operating Income | $ | 3,297 | $ | 3,484 | $ | (187 | ) | (5 | )% | |||||
Revenues
Worldwide revenues increased $154 million, or 2%, to $10.096 billion in the year ended September 30, 2017. Worldwide revenues include a 3-percentage point favorable impact from the acquisition of Televisión Federal S.A. (“Telefe”). Domestic revenues decreased $70 million, or 1%, to $7.969 billion. International revenues increased $224 million, or 12%, to $2.127 billion. Excluding a 5-percentage point unfavorable impact from foreign exchange, international revenues increased 17%, primarily driven by an 11-percentage point favorable impact from the Telefe acquisition.
Advertising
Worldwide advertising revenues increased $53 million, or 1%, to $4.862 billion in the year ended September 30, 2017. Foreign exchange had a 2-percentage point unfavorable impact on worldwide advertising revenues. Worldwide advertising revenues include a 4-percentage point favorable impact from the acquisition of Telefe. Domestic advertising revenues decreased $85 million, or 2%, to $3.753 billion, reflecting higher pricing, more than offset by lower impressions. International advertising revenues increased $138 million, or 14%, to $1.109 billion. Excluding an 8-percentage point unfavorable impact from foreign exchange, international advertising revenues increased 22%, primarily driven by an 18-percentage point favorable impact from the Telefe acquisition, as well as growth in Europe.
Affiliate
Worldwide affiliate revenues increased $82 million, or 2%, to $4.638 billion in the year ended September 30, 2017. Domestic affiliate revenues increased $39 million, or 1%, to $3.920 billion, principally reflecting rate increases and higher revenues from subscription video-on-demand and other OTT agreements, partially offset by a decline in subscribers. We expect domestic affiliate revenues to decline at a high single-digit rate in the first and second quarters of fiscal 2018 due to the impact of subscriber declines, renewal rate resets with certain distributors and lower subscription video-on-demand revenues, with improvement in the second half of the year resulting in a mid-single-digit rate decline for fiscal 2018. International affiliate revenues increased $43 million, or 6%, to $718 million. Excluding a 3-percentage point unfavorable impact from foreign exchange, international affiliate revenues increased 9%, driven by the impact of rate increases, subscriber growth, new channel launches and subscription video-on-demand and other OTT agreements, as well as a 2-percentage point favorable impact from the Telefe acquisition.
Ancillary
Worldwide ancillary revenues increased $19 million, or 3%, to $596 million in the year ended September 30, 2017. Worldwide ancillary revenues include a 2-percentage point favorable impact from the acquisition of Telefe. Domestic ancillary revenues decreased $24 million, or 8%, to $296 million, principally driven by lower consumer product revenue. International ancillary revenues increased $43 million, or 17%, to $300 million, principally driven by higher consumer product revenue and the acquisition of Telefe, which had a 6-percentage point favorable impact on international ancillary revenues.
Expenses
Media Networks segment expenses increased $341 million, or 5%, to $6.799 billion in the year ended September 30, 2017. Worldwide expenses include an unfavorable 3-percentage point impact from the acquisition of Telefe.
39
Management’s Discussion and Analysis
of Results of Operations and Financial Condition
(continued)
Operating
Operating expenses increased $169 million, or 4%, to $4.232 billion in the year ended September 30, 2017. Programming costs increased $127 million, or 3%, primarily due to the acquisition of Telefe. Distribution and other expenses increased $42 million, or 10%, driven by increased participation and royalty costs on certain distribution and advertising agreements.
Selling, General and Administrative
SG&A expenses increased $163 million, or 7%, to $2.392 billion in the year ended September 30, 2017, reflecting a 3-percentage point increase due to the acquisition of Telefe, and higher employee-related and advertising and promotion costs.
Adjusted Operating Income
Adjusted operating income decreased $187 million, or 5%, to $3.297 billion in the year ended September 30, 2017, reflecting the operating results discussed above.
Filmed Entertainment
Year Ended September 30, | Better/(Worse) | |||||||||||||
(in millions) | 2017 | 2016 | $ | % | ||||||||||
Revenues by Component | ||||||||||||||
Theatrical | $ | 808 | $ | 605 | $ | 203 | 34 | % | ||||||
Home entertainment | 849 | 783 | 66 | 8 | ||||||||||
Licensing | 1,315 | 1,100 | 215 | 20 | ||||||||||
Ancillary | 317 | 174 | 143 | 82 | ||||||||||
Total revenues by component | $ | 3,289 | $ | 2,662 | $ | 627 | 24 | % | ||||||
Expenses | ||||||||||||||
Operating | $ | 3,183 | $ | 2,738 | $ | (445 | ) | (16 | )% | |||||
Selling, general and administrative | 342 | 319 | (23 | ) | (7 | ) | ||||||||
Depreciation and amortization | 44 | 50 | 6 | 12 | ||||||||||
Total expenses | $ | 3,569 | $ | 3,107 | $ | (462 | ) | (15 | )% | |||||
Adjusted Operating Loss | $ | (280 | ) | $ | (445 | ) | $ | 165 | 37 | % | ||||
Revenues
Worldwide revenues increased $627 million, or 24%, to $3.289 billion in the year ended September 30, 2017. Domestic revenues increased $267 million, or 20%, to $1.628 billion. International revenues increased $360 million, or 28%, to $1.661 billion.
Theatrical
Worldwide theatrical revenues increased $203 million, or 34%, to $808 million in the year ended September 30, 2017, principally driven by the release of Transformers: The Last Knight. Other significant current year releases included xXx: Return of Xander Cage, Baywatch, Ghost in the Shell, Jack Reacher: Never Go Back and Arrival, compared with Star Trek Beyond, Daddy’s Home, Teenage Mutant Ninja Turtles: Out of the Shadows and The Big Short in the prior year. Domestic theatrical revenues decreased 9%, while international theatrical revenues increased 86%, due to the strong international performance of Transformers: The Last Knight.
Home Entertainment
Worldwide home entertainment revenues increased $66 million, or 8%, to $849 million in the year ended September 30, 2017, primarily reflecting higher carryover revenues, driven by Teenage Mutant Ninja Turtles: Out of the Shadows, as well as catalog distribution revenues. Significant current year releases included Star Trek Beyond, Jack Reacher: Never Go Back and Arrival, while prior year releases included Mission: Impossible - Rogue Nation, Terminator: Genisys and Daddy’s Home. Foreign exchange had a 4-percentage point unfavorable impact on international home entertainment revenues. Domestic and international home entertainment revenues increased 11% and 3%, respectively.
Licensing
Licensing revenues increased $215 million, or 20%, to $1.315 billion in the year ended September 30, 2017, primarily driven by Paramount Television productions, including Shooter, 13 Reasons Why and Berlin Station. Domestic and international licensing revenues increased 32% and 13%, respectively.
40
Management’s Discussion and Analysis
of Results of Operations and Financial Condition
(continued)
Ancillary
Ancillary revenues increased $143 million, or 82%, to $317 million in the year ended September 30, 2017. Domestic ancillary revenues increased 89%, driven by the sale of a partial copyright interest in certain films released during the first half of the year in connection with an agreement then in place. International ancillary revenues increased 59%.
Expenses
Filmed Entertainment segment expenses increased $462 million, or 15%, to $3.569 billion in the year ended September 30, 2017.
Operating
Operating expenses increased $445 million, or 16%, to $3.183 billion in the year ended September 30, 2017. Distribution and other costs, principally print and advertising expenses, increased $426 million, or 37%, primarily driven by higher marketing costs for our current year film slate and a charge resulting from the termination of a slate financing agreement. Film costs increased $19 million, or 1%, primarily driven by the current year slate, including the release of Transformers: The Last Knight, partially offset by the lapping of a prior year impairment charge.
Selling, General and Administrative
SG&A expenses increased $23 million, or 7%, to $342 million in the year ended September 30, 2017, primarily driven by higher employee-related costs.
Adjusted Operating Loss
Adjusted operating loss was $280 million in the year ended September 30, 2017, compared with $445 million in 2016, an improvement of $165 million, or 37%, reflecting the operating results discussed above. Operating losses reflect the recognition of print and advertising expenses incurred in the period, generally before and throughout the theatrical release of a film, while revenues for the respective film are recognized as earned through its theatrical exhibition and subsequent distribution windows.
YEAR ENDED SEPTEMBER 30, 2016 vs. 2015
Consolidated Results of Operations
Revenues
Worldwide revenues decreased $780 million, or 6%, to $12.488 billion in the year ended September 30, 2016. Media Networks revenues decreased $548 million, or 5%, principally reflecting lower affiliate and advertising revenues. Filmed Entertainment revenues decreased $221 million, or 8%, principally driven by lower theatrical revenues.
Expenses
Total expenses decreased $194 million, or 2%, to $9.962 billion in the year ended September 30, 2016. The decrease in expenses results from a comparison with the $784 million of restructuring and programming charges and $24 million loss on pension settlement in the prior year, partially offset by higher segment expenses and a restructuring charge of $206 million in the current year. Filmed Entertainment expenses increased $335 million, or 12%, driven by higher operating expenses. Media Networks expenses increased $111 million, or 2%, principally driven by SG&A expenses.
Operating
Operating expenses decreased $184 million, or 3%, to $6.684 billion in the year ended September 30, 2016. The decrease in operating expenses results from a comparison with the $578 million programming charge in the prior year, partially offset by higher Filmed Entertainment operating expenses.
Selling, General and Administrative
SG&A expenses decreased $9 million to $2.851 billion in the year ended September 30, 2016. The decrease in SG&A expenses reflects a decline in Filmed Entertainment SG&A expenses of $50 million, or 14%, and a comparison with the $24 million loss on pension settlement in the prior year, partially offset by an increase of Media Networks SG&A expenses of $91 million, or 4%.
Operating Income
Operating income decreased $586 million, or 19%, to $2.526 billion in the year ended September 30, 2016, reflecting the operating results discussed above. Excluding the items discussed in “Factors Affecting Comparability”, adjusted operating income decreased $1.188 billion, or 30%, to $2.732 billion in the year ended September 30, 2016. Media Networks adjusted operating income decreased $659 million, or 16%, to $3.484 billion, primarily reflecting revenue declines and increased expenses. Filmed Entertainment adjusted operating results decreased $556 million, reflecting the underperformance of current
41
Management’s Discussion and Analysis
of Results of Operations and Financial Condition
(continued)
year films and an impairment charge related to the expected performance of an unreleased film. In addition, corporate expenses decreased $22 million, or 9%, principally due to lower employee-related costs partially offset by expenses resulting from corporate governance matters.
Income Taxes
Our effective income tax rate was 26.1% in the year ended September 30, 2016. The net discrete tax benefit of $102 million, taken together with the discrete tax impact of restructuring, reduced the effective income tax rate by 5.6 percentage points. Excluding the impact of discrete tax items, our adjusted effective income tax rate was 31.7% in 2016.
Our effective income tax rate was 20.0% in the year ended September 30, 2015. The net discrete tax benefit of $258 million, taken together with the discrete tax impact of the other factors affecting comparability, reduced the effective income tax rate by 11.2 percentage points. Excluding the impact of discrete tax items, our adjusted effective income tax rate was 31.2% in 2015.
Net Earnings from Continuing Operations Attributable to Viacom
Net earnings from continuing operations attributable to Viacom decreased $486 million, or 25%, to $1.436 billion in the year ended September 30, 2016, principally due to the decline in tax-effected operating income described above, partially offset by lower interest expense, foreign exchange losses and net earnings attributable to noncontrolling interests. Excluding the items discussed in “Factors Affecting Comparability”, adjusted net earnings from continuing operations attributable to Viacom decreased $745 million, or 34%, to $1.465 billion in the year ended September 30, 2016.
Diluted Earnings Per Share from Continuing Operations
Diluted EPS from continuing operations decreased $1.12 per diluted share to $3.61 in the year ended September 30, 2016, reflecting the impact of net earnings. Excluding the items discussed in “Factors Affecting Comparability”, adjusted diluted EPS from continuing operations decreased $1.76 per diluted share to $3.68. Foreign exchange had an unfavorable $0.05 impact on diluted and adjusted diluted EPS from continuing operations.
Segment Results of Operations
Media Networks
Year Ended September 30, | Better/(Worse) | |||||||||||||
(in millions) | 2016 | 2015 | $ | % | ||||||||||
Revenues by Component | ||||||||||||||
Advertising | $ | 4,809 | $ | 5,007 | $ | (198 | ) | (4 | )% | |||||
Affiliate | 4,556 | 4,908 | (352 | ) | (7 | ) | ||||||||
Ancillary | 577 | 575 | 2 | — | ||||||||||
Total revenues by component | $ | 9,942 | $ | 10,490 | $ | (548 | ) | (5 | )% | |||||
Expenses | ||||||||||||||
Operating | $ | 4,063 | $ | 4,047 | $ | (16 | ) | — | % | |||||
Selling, general and administrative | 2,229 | 2,138 | (91 | ) | (4 | ) | ||||||||
Depreciation and amortization | 166 | 162 | (4 | ) | (2 | ) | ||||||||
Total expenses | $ | 6,458 | $ | 6,347 | $ | (111 | ) | (2 | )% | |||||
Adjusted Operating Income | $ | 3,484 | $ | 4,143 | $ | (659 | ) | (16 | )% | |||||
Revenues
Worldwide revenues decreased $548 million, or 5%, to $9.942 billion in the year ended September 30, 2016, driven primarily by lower affiliate and advertising revenues. Domestic revenues were $8.039 billion, a decrease of $596 million, or 7%. International revenues were $1.903 billion, an increase of $48 million, or 3%. Foreign exchange had a 7-percentage point unfavorable impact on international revenues.
Advertising
Worldwide advertising revenues decreased $198 million, or 4%, to $4.809 billion in the year ended September 30, 2016. Domestic advertising revenues decreased 5%. While pricing increased, softer ratings and reduced unit loads at certain of our networks contributed to lower audience delivery, reducing impressions and associated revenue. International advertising revenues were substantially flat. Excluding foreign exchange, which had a 9-percentage point unfavorable impact, international advertising revenues increased 9%, driven by growth in Europe.
42
Management’s Discussion and Analysis
of Results of Operations and Financial Condition
(continued)
Affiliate
Worldwide affiliate revenues decreased $352 million, or 7%, to $4.556 billion in the year ended September 30, 2016. Domestic affiliate revenues decreased 9%, principally reflecting a difficult comparison to the prior year which included higher revenues from subscription video-on-demand and other OTT arrangements. Excluding the impact from the timing of product available under subscription video-on-demand and other OTT arrangements, domestic affiliate revenues declined in the low-single digits, due to a modest decline in subscribers and the impact of rate equalization due to the consolidation of certain distributor agreements, partially offset by rate increases across the remaining subscriber base. International revenues increased 3%. Excluding the impact of foreign exchange, which had a 7-percentage point unfavorable impact, international affiliate revenues increased 10%, driven by new channel launches, increased subscribers, rate increases and the completion of certain subscription video-on-demand and other OTT arrangements.
Ancillary
Worldwide ancillary revenues increased $2 million to $577 million in the year ended September 30, 2016. Domestic ancillary revenues decreased 6%, principally reflecting lower television syndication revenue. International ancillary revenues increased 9%. Excluding the impact of foreign exchange, which had a 5-percentage point unfavorable impact, international ancillary revenues increased 14%, driven by increased licensing revenue.
Expenses
Media Networks segment expenses increased $111 million, or 2%, to $6.458 billion in the year ended September 30, 2016.
Operating
Operating expenses increased $16 million to $4.063 billion in the year ended September 30, 2016. Programming costs increased $72 million, or 2%. Programming costs increased primarily reflecting 4-percentage points from our continuing investment in original content, partially offset by the net benefit attributable to abandoned or impaired programming. Distribution and other expenses decreased $56 million, or 11%, primarily driven by lower participation and residuals costs on subscription video-on-demand arrangements.
Selling, General and Administrative
SG&A expenses increased $91 million, or 4%, to $2.229 billion in the year ended September 30, 2016, principally driven by higher costs for advertising and promotion, severance and data research, partially offset by 3-percentage points of benefit from our 2015 restructuring.
Adjusted Operating Income
Adjusted operating income decreased $659 million, or 16%, to $3.484 billion in the year ended September 30, 2016, reflecting the operating results discussed above.
Filmed Entertainment
Year Ended September 30, | Better/(Worse) | |||||||||||||
(in millions) | 2016 | 2015 | $ | % | ||||||||||
Revenues by Component | ||||||||||||||
Theatrical | $ | 605 | $ | 841 | $ | (236 | ) | (28 | )% | |||||
Home entertainment | 783 | 871 | (88 | ) | (10 | ) | ||||||||
Licensing | 1,100 | 980 | 120 | 12 | ||||||||||
Ancillary | 174 | 191 | (17 | ) | (9 | ) | ||||||||
Total revenues by component | $ | 2,662 | $ | 2,883 | $ | (221 | ) | (8 | )% | |||||
Expenses | ||||||||||||||
Operating | $ | 2,738 | $ | 2,350 | $ | (388 | ) | (17 | )% | |||||
Selling, general and administrative | 319 | 369 | 50 | 14 | ||||||||||
Depreciation and amortization | 50 | 53 | 3 | 6 | ||||||||||
Total expenses | $ | 3,107 | $ | 2,772 | $ | (335 | ) | (12 | )% | |||||
Adjusted Operating Income/(Loss) | $ | (445 | ) | $ | 111 | $ | (556 | ) | NM | |||||
NM - Not Meaningful | ||||||||||||||
43
Management’s Discussion and Analysis
of Results of Operations and Financial Condition
(continued)
Revenues
Worldwide revenues decreased $221 million, or 8%, to $2.662 billion in the year ended September 30, 2016, principally driven by lower theatrical revenues. Domestic revenues were $1.361 billion, a decrease of $13 million, or 1%. International revenues were $1.301 billion, a decrease of $208 million, or 14%, with foreign exchange having a 3-percentage point unfavorable impact on international revenues.
Theatrical
Worldwide theatrical revenues decreased $236 million, or 28%, to $605 million in the year ended September 30, 2016. Revenues from our 2016 releases decreased $189 million principally due to the comparison with the performance of Mission: Impossible - Rogue Nation in the prior year. Significant 2016 releases included Star Trek Beyond, Daddy’s Home, Teenage Mutant Ninja Turtles: Out of the Shadows, The Big Short and 10 Cloverfield Lane, compared with Mission: Impossible - Rogue Nation, Terminator: Genisys, The SpongeBob Movie: Sponge Out of Water and Interstellar in the prior year. Carryover revenues decreased $47 million principally reflecting revenues in the prior year from Teenage Mutant Ninja Turtles. Domestic and international theatrical revenues decreased 13% and 41%, respectively. Foreign exchange had a 3-percentage point unfavorable impact on international theatrical revenues.
Home Entertainment
Worldwide home entertainment revenues decreased $88 million, or 10%, to $783 million in the year ended September 30, 2016, principally reflecting lower revenues associated with third-party distribution and catalog titles. Domestic home entertainment revenues remained substantially flat and international home entertainment revenues decreased 24%. Foreign exchange had a 4-percentage point unfavorable impact on international home entertainment revenues.
Licensing
Licensing revenues increased $120 million, or 12%, to $1.100 billion in the year ended September 30, 2016, primarily driven by subscription video-on-demand licensing fees. Domestic and international licensing revenues increased 11% and 13%, respectively.
Ancillary
Ancillary revenues decreased $17 million, or 9%, to $174 million in the year ended September 30, 2016. Domestic ancillary revenues remained flat, while international ancillary revenues decreased 30%, principally due to lower merchandising revenues from Transformers: Age of Extinction.
Expenses
Filmed Entertainment segment expenses increased $335 million, or 12%, to $3.107 billion in the year ended September 30, 2016.
Operating
Operating expenses increased $388 million, or 17%, to $2.738 billion in the year ended September 30, 2016. Distribution and other costs, principally print and advertising expenses, increased $225 million, or 24%, primarily driven by higher marketing costs for our 2016 film slate. Film costs increased $163 million, or 11%, including a $115 million impairment charge related to the expected performance of an unreleased film and higher television production costs.
Selling, General and Administrative
SG&A expenses decreased $50 million, or 14%, to $319 million in the year ended September 30, 2016, principally driven by lower employee costs, including 8-percentage points of benefit from our 2015 restructuring, and other discretionary cost decreases.
Adjusted Operating Income/(Loss)
Adjusted operating loss was $445 million in the year ended September 30, 2016, compared with adjusted operating income of $111 million in 2015. The decline in results reflects the underperformance of 2016 films, such as Teenage Mutant Ninja Turtles: Out of the Shadows and Zoolander 2, as well as the impairment charge discussed above.
44
Management’s Discussion and Analysis
of Results of Operations and Financial Condition
(continued)
LIQUIDITY AND CAPITAL RESOURCES
Liquidity
Sources and Uses of Cash
Our primary source of liquidity is cash provided through the operations of our businesses. We have access to external financing sources such as our $2.5 billion five-year revolving credit facility and the capital markets. Our principal uses of cash from operations include the creation of new programming and film content, acquisitions of third-party content, and interest and income tax payments. We also use cash for the repayment of debt, quarterly cash dividends, capital expenditures and acquisitions of businesses, as well as discretionary share repurchases under our stock repurchase program, as deemed appropriate.
The Media Networks segment consistently generates a significant percentage of our cash flow from operating activities. Advertising is generally purchased by large media buying agencies and our affiliate revenues are earned from cable and direct-to-home satellite television operators and other distributors. The Filmed Entertainment segment’s operational results and ability to generate cash flow from operations substantially depend on the number and timing of films and television series in development and production, the level and timing of print and advertising costs, and the public’s response to our theatrical film and home entertainment releases. In general, our segments require relatively low levels of capital expenditures in relation to our annual cash flow from operations. This contributes to our ability to generate cash flow for future investment in our content and business operations, which we expect to be able to maintain over time.
We use commercial paper borrowings, backstopped by our credit facility, and the credit facility to fund short-term domestic liquidity needs principally driven by the timing of our domestic operating cash flows. Our cash and cash equivalents totaled $1.389 billion as of September 30, 2017, of which $1.135 billion was held by our foreign subsidiaries and is substantially all deemed indefinitely reinvested in our foreign operations. While we currently do not intend or foresee a need for repatriating funds held in our foreign subsidiaries, should we require additional capital in the U.S., we could elect to repatriate these funds or access external financing. Repatriating funds could result in a higher effective tax rate and cash taxes paid.
We believe that our cash flows from operating activities together with our credit facility provide us with adequate resources to fund our anticipated ongoing cash requirements. We anticipate that future debt maturities will be funded with cash and cash equivalents, cash flows from operating activities and future access to capital markets, including our credit facility.
We may continue to access external financing from time to time depending on our cash requirements, assessments of current and anticipated market conditions and after-tax cost of capital. Our access to capital markets can be impacted by factors outside our control, including economic conditions; however, we believe that our strong cash flows and balance sheet, our credit facility and our credit rating will provide us with adequate access to funding given our expected cash needs. Any new borrowing cost would be affected by market conditions and short and long-term debt ratings assigned by independent rating agencies, and there can be no assurance that we will be able to access capital markets on terms and conditions that will be favorable to us.
Cash Flows
The following tables include information driving the change in cash and cash equivalents and a reconciliation of net cash provided by operating activities (GAAP) to free cash flow and operating free cash flow (non-GAAP) for each of the years ended September 30, 2017, 2016 and 2015. We define free cash flow as net cash provided by operating activities minus capital expenditures, plus excess tax benefits from equity-based compensation awards (actual tax deductions in excess of amounts previously recognized, which is included within financing activities in the statement of cash flows), as applicable. We define operating free cash flow as free cash flow, excluding the impact of the cash premium on the extinguishment of debt, as applicable. Free cash flow and operating free cash flow are non-GAAP measures. Management believes the use of these measures provides investors with an important perspective on, in the case of free cash flow, our liquidity, including our ability to service debt and make investments in our businesses, and, in the case of operating free cash flow, our liquidity from ongoing activities.
45
Management’s Discussion and Analysis
of Results of Operations and Financial Condition
(continued)
Change in cash and cash equivalents (in millions) | Year Ended September 30, | Better/(Worse) $ | |||||||||||||||||
2017 | 2016 | 2015 | 2017 vs. 2016 | 2016 vs. 2015 | |||||||||||||||
Net cash provided by operating activities | $ | 1,671 | $ | 1,371 | $ | 2,313 | $ | 300 | $ | (942 | ) | ||||||||
Net cash provided by/(used in) investing activities | 329 | (299 | ) | (257 | ) | 628 | (42 | ) | |||||||||||
Net cash used in financing activities | (1,010 | ) | (1,173 | ) | (2,477 | ) | 163 | 1,304 | |||||||||||
Effect of exchange rate changes on cash and cash equivalents | 20 | (26 | ) | (73 | ) | 46 | 47 | ||||||||||||
Net change in cash and cash equivalents | $ | 1,010 | $ | (127 | ) | $ | (494 | ) | $ | 1,137 | $ | 367 | |||||||
Reconciliation of net cash provided by operating activities to free cash flow and operating free cash flow | |||||||||||||||||||
Net cash provided by operating activities (GAAP) | $ | 1,671 | $ | 1,371 | $ | 2,313 | $ | 300 | $ | (942 | ) | ||||||||
Capital expenditures | (195 | ) | (172 | ) | (142 | ) | (23 | ) | (30 | ) | |||||||||
Excess tax benefits | 1 | — | 43 | 1 | (43 | ) | |||||||||||||
Free cash flow (Non-GAAP) | 1,477 | 1,199 | 2,214 | 278 | (1,015 | ) | |||||||||||||
Debt retirement premium | 33 | — | 18 | 33 | (18 | ) | |||||||||||||
Operating free cash flow (Non-GAAP) | $ | 1,510 | $ | 1,199 | $ | 2,232 | $ | 311 | $ | (1,033 | ) | ||||||||
Operating Activities
Cash provided by operating activities was $1.671 billion in 2017, an increase of $300 million compared with 2016, primarily reflecting lower film production spend, partially offset by other unfavorable working capital requirements, including higher income tax payments. See Note 17 of the Consolidated Financial Statements for more information regarding income tax payments.
Cash provided by operating activities was $1.371 billion in 2016, a decrease of $942 million compared with 2015, reflecting the impact from lower net earnings, higher film and television production spending and unfavorable working capital requirements.
Investing Activities
Cash provided by investing activities was $329 million in 2017, principally reflecting net proceeds of $593 million from the sale of our investment in EPIX, $147 million from the sale of certain broadcast spectrum and $108 million from the sale of marketable securities, partially offset by the acquisition of Telefe for $336 million, net of cash acquired, and capital expenditures.
Cash used in investing activities was $299 million in 2016, principally reflecting capital expenditures and contributions made into grantor trusts in connection with the separation of certain senior executives. See Note 14 of the Consolidated Financial Statements for additional information.
Cash used in investing activities was $257 million in 2015, principally reflecting capital expenditures and our investment in Prism TV Private Limited.
Financing Activities
Cash used in financing activities was $1.010 billion in 2017, principally reflecting net payments of $783 million from debt transactions and dividend payments of $319 million, partially offset by stock option exercise proceeds of $172 million.
Cash used in financing activities was $1.173 billion in 2016, primarily driven by dividend payments of $635 million, debt repayments of $368 million and the settlement of share repurchases totaling $100 million.
Cash used in financing activities was $2.477 billion in 2015, driven by the settlement of share repurchases totaling $1.548 billion, dividend payments of $564 million and net payments of $410 million from debt transactions.
46
Management’s Discussion and Analysis
of Results of Operations and Financial Condition
(continued)
Capital Resources
Capital Structure and Debt
Our debt outstanding as of September 30, 2017 and 2016 is as follows:
Debt (in millions) | September 30, | ||||||
2017 | 2016 | ||||||
Notes and debentures | $ | 11,065 | $ | 11,793 | |||
Capital leases and other obligations | 54 | 120 | |||||
Total debt | $ | 11,119 | $ | 11,913 | |||
Notes and Debentures
In 2017, we issued $2.6 billion of junior debentures and senior notes and redeemed $3.331 billion of senior notes and debentures.
Our issuances of debt were comprised of:
• | $650 million in aggregate principal amount of fixed-to-floating rate junior subordinated debentures due 2057 at par, callable in 5 years (the “5-year Hybrid debentures”) |
• | $650 million in aggregate principal amount of fixed-to-floating rate junior subordinated debentures due 2057 at par, callable in 10 years (the “10-year Hybrid debentures” and, together with the 5-year Hybrid debentures, the “Hybrid Debentures”) |
• | $400 million in aggregate principal amount of 2.250% senior notes due 2022 at a price equal to 99.692% of the principal amount (the “2022 Senior Notes”) |
• | $900 million in aggregate principal amount of 3.450% senior notes due 2026 at a price equal to 99.481% of the principal amount (the “2026 Senior Notes” and, together with the 2022 Senior Notes, the “Senior Notes”) |
The 5-year Hybrid debentures accrue interest at a rate of 5.875% until February 28, 2022, on which date the rate will switch to a floating rate based on three-month LIBOR plus 3.895%, reset quarterly. The 10-year Hybrid debentures accrue interest at a rate of 6.250% until February 28, 2027, on which date the rate will switch to a floating rate based on three-month LIBOR plus 3.899%, reset quarterly. The Hybrid Debentures can be called by us at any time after the expiration of the fixed-rate period. The proceeds, net of issuance fees and expenses, from the issuance of the Hybrid Debentures and the Senior Notes were $2.569 billion.
The Hybrid Debentures’ subordination, interest deferral option and extended term provide significant credit protection measures for senior creditors and as a result of these features, the debentures were awarded a 50% equity credit by S&P and Fitch, and a 25% equity credit by Moody’s.
The interest rate payable on the Senior Notes will be subject to adjustment from time to time if Moody’s Investors Services, Inc. or S&P Global Ratings downgrades (or downgrades and subsequently upgrades) the credit rating assigned to the Senior Notes. The interest rate on the Senior Notes would increase by 0.25% upon each credit agency downgrade up to a maximum of 2.00%, and would similarly be decreased for subsequent upgrades.
In 2017, we redeemed $3.331 billion of senior notes and debentures for a redemption price of $3.333 billion. As a result of the redemptions, we recognized a net pre-tax extinguishment loss of $20 million within Other Items, net in the Consolidated Statement of Earnings, which included $18 million of unamortized debt discount and issuance fees.
Our outstanding notes and debentures provide for certain covenant packages typical for an investment grade company. There is an acceleration trigger for the majority of the notes and debentures in the event of a change in control under specified circumstances coupled with ratings downgrades due to the change in control, as well as certain optional redemption provisions for our junior debentures.
At September 30, 2017 and 2016, the total unamortized discount and issuance fees and expenses related to our outstanding notes and debentures was $457 million and $459 million, respectively.
Credit Facility: At September 30, 2017 and 2016, there were no amounts outstanding under our $2.5 billion revolving credit facility due November 2019. The average credit facility amount outstanding for the twelve months ending September 30, 2017
47
Management’s Discussion and Analysis
of Results of Operations and Financial Condition
(continued)
was $33 million, which had a weighted average interest rate of 1.91%. The credit facility is used for general corporate purposes and to support commercial paper outstanding, if any. The borrowing rate under the credit facility is LIBOR plus a margin ranging from 1.25% to 2.25% based on our current public debt rating. The credit facility has one principal financial covenant that requires our interest coverage for the most recent four consecutive fiscal quarters to be at least 3.0x, which we met as of September 30, 2017.
Commercial Paper: At September 30, 2017 and 2016, there was no commercial paper outstanding. The average commercial paper outstanding for the twelve months ending September 30, 2017 was $759 million, which had a weighted average interest rate of 1.53%.
Stock Repurchase Program: During 2017, we did not repurchase any shares of Class B common stock. During 2016 and 2015, we repurchased 2.1 million and 21.1 million shares under the program for an aggregate price of $100 million and $1.5 billion, respectively, leaving $4.9 billion of remaining capacity under our $20.0 billion stock repurchase program.
Commitments and Contingencies
Our commitments primarily consist of programming and talent commitments, operating and capital lease arrangements, and purchase obligations for goods and services. These arrangements result from our normal course of business and represent obligations that may be payable over several years. See Note 11 of the Consolidated Financial Statements for additional information. Additionally, we are subject to a redeemable put option (see Note 10 to our Consolidated Financial Statements).
Guarantees: In the course of our business, we both provide and receive the benefit of indemnities that are intended to allocate certain risks associated with business transactions. Similarly, we may remain contingently liable for various obligations of a business that has been divested in the event that a third party does not live up to its obligations under an indemnification agreement.
Leases - We have certain indemnification obligations with respect to leases primarily associated with the previously discontinued operations of Famous Players Inc. (“Famous Players”). In addition, we have certain indemnities provided by the acquirer of Famous Players.
Other - We have indemnification obligations with respect to letters of credit and surety bonds primarily used as security against non-performance in the normal course of business.
Legal Matters: See Note 11 of the Consolidated Financial Statements for information regarding legal matters.
Film Financing Arrangements: From time to time we enter into film financing arrangements that involve the sale of a partial copyright interest in a film to third-party investors. Since the investors typically have the risks and rewards of ownership proportionate to their ownership in the film, we generally record the amounts received for the sale of copyright interest as a reduction of the cost of the film and related cash flows are reflected in net cash flow from operating activities. We also enter into collaborative arrangements with other studios to jointly finance and distribute theatrical productions (“co-financing arrangements”). A co-financing arrangement typically involves joint ownership of the film asset with each partner responsible for distribution of the film in specific territories. The partners share in the profits and losses of the film in accordance with their respective ownership interest.
In December 2016, we entered into a three-year strategic cooperation and slate financing agreement with Huahua Media (“Huahua”). Pursuant to the agreement, Huahua agreed to co-finance 25% of Paramount’s cost of its slate of films for a three-year period, with an option for an additional year. The arrangement included the sale of a partial copyright interest in certain films released during the first half of the year. Such interests were recorded as ancillary revenue as the films were substantially complete at the time of execution of the arrangement. In November 2017, following recent changes to Chinese foreign investment policies and delays in receipt of scheduled payments, Paramount and Huahua mutually agreed to terminate their agreement. In connection with the termination, a net $59 million charge was recorded in the fourth fiscal quarter of 2017. Paramount also announced it has secured a series of individual agreements with other financing partners that will provide committed or expected financing for approximately 25% of the production costs of Paramount’s film slate for fiscal 2018 and 2019.
48
Management’s Discussion and Analysis
of Results of Operations and Financial Condition
(continued)
Contractual Obligations
Our contractual obligations include amounts reflected on our balance sheet, as well as off-balance sheet arrangements. At September 30, 2017, our significant contractual obligations, including payments due for the next five fiscal years and thereafter, were as follows:
Contractual Obligations (in millions) | Total | 2018 | 2019-2020 | 2021-2022 | Thereafter | ||||||||||||||
Off-balance Sheet Arrangements | |||||||||||||||||||
Programming and talent commitments (1) | $ | 2,085 | $ | 659 | $ | 841 | $ | 416 | $ | 169 | |||||||||
Operating leases (2) | 1,625 | 223 | 270 | 271 | 861 | ||||||||||||||
Purchase obligations (3) | 1,165 | 522 | 432 | 190 | 21 | ||||||||||||||
On-Balance Sheet Arrangements | |||||||||||||||||||
Capital lease obligations (4) | $ | 59 | $ | 21 | $ | 31 | $ | 6 | $ | 1 | |||||||||
Debt | 11,522 | — | 803 | 1,590 | 9,129 | ||||||||||||||
Interest payments (5) | 10,633 | 561 | 1,085 | 998 | 7,989 | ||||||||||||||
Other long-term obligations (6) | 2,398 | 1,537 | 697 | 164 | — | ||||||||||||||
(1) | Programming and talent commitments include $1.731 billion relating to media networks programming and $354 million for talent contracts. |
(2) | Operating leases include long-term non-cancelable operating lease commitments for office space, equipment, transponders, studio facilities and vehicles. |
(3) | Purchase obligations include agreements to purchase goods or services that are enforceable and legally binding and that specify all significant terms, including open purchase orders. |
(4) | Capital lease obligations include capital leases for satellite transponders. |
(5) | Interest payments on our junior subordinated debentures subsequent to the expiration of their fixed-rate periods have been included based on their current fixed rates. |
(6) | Other long-term obligations principally consist of participations, residuals and programming obligations for content that is available for airing. |
The table above does not include payments which may result from our defined benefit pension plans of $455 million, unrecognized tax benefits of $193 million, including interest and penalties, interest payments to be made under our credit facility and for commercial paper outstanding, $248 million of redeemable noncontrolling interest and lease indemnification obligations of approximately $194 million. The amount and timing of payments with respect to these items are subject to a number of uncertainties such that we are unable to make sufficiently reliable estimations of future payments.
MARKET RISK
We are exposed to market risk related to foreign currency exchange rates and interest rates. We use or expect to use derivative financial instruments to modify exposure to risks from fluctuations in foreign currency exchange rates and interest rates. In accordance with our policy, we do not use derivative instruments unless there is an underlying exposure, and we do not hold or enter into financial instruments for speculative trading purposes.
Foreign Exchange Risk
We conduct business in various countries outside the U.S., resulting in exposure to movements in foreign exchange rates when translating from the foreign local currency to the U.S. Dollar.
We use foreign currency forward contracts to economically hedge anticipated cash flows and foreign currency balances in such currencies as the British Pound, the Euro, the Brazilian Real, the Japanese Yen, the Australian Dollar and the Canadian Dollar. We also enter into forward contracts to hedge future production costs and programming obligations. The change in fair value of non-designated foreign exchange contracts is included in current period earnings as part of Other items, net in the Consolidated Statements of Earnings. We manage the use of foreign exchange derivatives centrally.
At September 30, 2017 and 2016, the notional value of all foreign exchange contracts was $869 million and $1.149 billion, respectively. In 2017, $287 million related to our foreign currency balances and $582 million related to future production costs. In 2016, $874 million related to our foreign currency balances and $275 million related to future production costs.
Interest Rate Risk
A portion of our interest expense is exposed to movements in short-term rates. A 1% change to the weighted average interest rate on commercial paper and credit facility amounts outstanding in 2017 would increase or decrease interest expense by approximately $8 million. Also, interest expense for future long-term debt issues is exposed to movements in long-term rates. Interest rate hedges may be used to modify both of these exposures at our discretion. There were no interest rates hedges outstanding at September 30, 2017 and 2016.
49
Management’s Discussion and Analysis
of Results of Operations and Financial Condition
(continued)
Viacom has issued notes and debentures that, at September 30, 2017, had an outstanding balance of $11.1 billion and an estimated fair value of $11.6 billion. A 1% increase or decrease in the level of interest rates would decrease or increase the fair value of the notes and debentures by approximately $900 million and $1.1 billion, respectively.
Credit Risk
We continually monitor our positions with, and credit quality of, our customers and the financial institutions that are counterparties to our financial instrument agreements. We are exposed to credit loss in the event of nonpayment by our customers and nonperformance by the counterparties to our financial instrument agreements. However, we do not anticipate nonperformance by the counterparties to our financial instrument agreements and we believe our allowance for doubtful accounts is sufficient to cover any anticipated nonpayment by our customers.
CRITICAL ACCOUNTING POLICIES AND ESTIMATES
The preparation of our financial statements in conformity with GAAP requires management to make estimates, judgments and assumptions that affect the amounts reported in the consolidated financial statements and accompanying notes. On an ongoing basis, we evaluate our estimates, which are based on historical experience and on various other assumptions that we believe are reasonable under the circumstances. The result of these evaluations forms the basis for making judgments about the carrying values of assets and liabilities and the reported amount of expenses that are not readily apparent from other sources. Actual results may differ from these estimates.
Our critical accounting policies are those that are considered by management to require significant judgment and use of estimates and that could have a significant impact on our financial statements. An understanding of our critical accounting policies is necessary to analyze our financial results. Our critical accounting policies include our accounting for film and television production costs, acquired programming rights, revenue recognition, income taxes and goodwill and other intangible assets. The risks and uncertainties involved in applying our critical accounting policies are provided below. Unless otherwise noted, we applied our critical accounting policies and estimation methods consistently in all material respects and for all periods presented, and have discussed such policies with our Audit Committee. For a summary of our significant accounting policies see Note 2 of the Consolidated Financial Statements.
Film and Television Production Costs
We capitalize feature film and television production costs, on a title-specific basis, as Inventory, net in the Consolidated Balance Sheets. We use an individual-film-forecast-computation method to amortize original production costs and to accrue estimated liabilities for residuals and participations over the applicable title’s life cycle based upon the ratio of current period to estimated remaining total gross revenues (“ultimate revenues”) for each title. The estimate of ultimate revenues impacts the timing of amortization and accrual of residuals and participations.
Our estimate of ultimate revenues for feature films includes revenues from all sources that are estimated to be earned within 10 years from the date of a film’s initial theatrical release. For acquired film libraries, our estimate of ultimate revenues is for a period within 20 years from the date of acquisition. For feature films, prior to release we estimate ultimate revenues based on the historical performance of similar content and pre-release market research (including test market screenings), as well as incorporating factors of the content itself, including, but not limited to, the expected number of theaters and markets in which the original content will be released, the genre of the original content and the past box office performance of the lead actors and actresses. We believe the most sensitive factor affecting our estimate of ultimate revenues for films intended for theatrical release is theatrical exhibition, as subsequent markets have historically exhibited a high correlation to theatrical performance. Upon a film’s initial release we update our estimate of ultimate revenues based on expected future and actual results. Our estimates of revenues from succeeding windows and markets are revised based on historical relationships to theatrical performance and an analysis of current market trends. We also review and revise estimates of ultimate revenue and participation costs as of each reporting date to reflect the most current available information. If estimates for a film are revised, the difference between amortization expense determined using the new estimate and any amounts previously expensed during that fiscal year are charged or credited to our Consolidated Statement of Earnings in the quarter in which the estimates are revised. The most sensitive factor affecting our estimates for films subsequent to their initial release is the extent of home entertainment sales achieved. In addition to theatrical performance, home entertainment sales vary based on a variety of factors including demand for our titles, the volume and quality of competing products, marketing and promotional strategies, as well as economic conditions.
Ultimate revenues for television programming are limited to the amount of contracted revenue. Accordingly, television production costs in excess of the amount of contracted revenue are expensed as incurred. For original programming broadcast
50
Management’s Discussion and Analysis
of Results of Operations and Financial Condition
(continued)
on our networks, capitalized original programming costs are amortized utilizing an individual-film-forecast-computation method over the applicable title’s ultimate revenues based on genre and historical experience, beginning with the month of initial exhibition. The most sensitive factor affecting ultimate revenues is ratings, which are an indication of audience acceptance and directly impact the level of advertising revenues we will be able to generate during the airing of the programming. Poor ratings may result in abandonment of a program, which would require the immediate write-off of any unamortized production costs.
If we believe that the release of our content will not be or has not been favorably received, then we would assess whether the fair value of such content is less than the unamortized portion of its capitalized costs and, if need be, recognize an impairment charge for the amount by which the unamortized capitalized costs exceed the fair value. We utilize the individual-film-forecast-computation method (adjusted to incorporate revenue and related costs, including future exploitation costs, if any, expected to occur in periods beyond 10 years from the date of a film’s initial release) to develop the cash flows which are subsequently discounted to compute the fair value of a title that is being assessed for impairment. The discount rate utilized takes into account the time value of money as well as a risk premium. The risk premium reflects the uncertainties of realizing the expected cash flows of a title which is impacted by the title’s position within its product life cycle.
Acquired Programming Rights
Costs incurred in acquiring program rights, including advances, are capitalized and amortized to operating expenses over the license period or projected useful life of the programming, if shorter, commencing upon availability, based on estimated future airings. Program rights and the related liabilities are recorded at the commencement of the licensing period when the cost of the programming is known or reasonably determinable, the program material has been accepted and the programming is available for airing. If initial airings are expected to generate higher revenues an accelerated method of amortization is used. Determining factors used in estimating the useful life of programming include the expected number of future airings, which may differ from the contracted number of airings, the length of the license period and expected future revenues to be generated from the programming. The cost basis of acquired programming is the capitalized cost of each program and is equal to the cost of the programming pursuant to the license agreement less the cumulative amortization recorded for the program. Capitalized costs of rights to program materials are reported in our Consolidated Balance Sheets at the lower of unamortized cost or estimated net realizable value. We evaluate net realizable value of acquired rights programming on a daypart basis. A daypart is defined as an aggregation of programs broadcast during a particular time of day or an aggregation of programs of a similar type. We aggregate similar programming based on the specific demographic targeted by each respective program service. Net realizable value is determined by estimating advertising revenues to be derived from the future airing of the programming within the daypart as well as an allocation of affiliate revenues to programming. An impairment charge may be necessary if our estimates of future cash flows of similar programming are insufficient or if programming is abandoned.
Revenue Recognition
Multiple-Element Arrangements
We enter into arrangements under which we perform multiple revenue-generating activities. We allocate consideration to separate units of account in the arrangement and recognize the associated revenue as each unit of account is delivered.
Advertising revenues are principally generated from the sale of advertising time comprised of multiple commercial units. Each advertising spot comprises a deliverable for accounting purposes. Consideration for these arrangements is allocated among the individual advertising spots based on relative fair value using Viacom-specific prices.
Subscription video-on-demand and other OTT arrangements include certain programs made available to distributors on one or more dates for a fixed fee. Consideration for such arrangements is allocated among the programs based on relative fair value using management’s best estimate considering viewing performance and other factors.
Gross versus Net Revenue
We earn and recognize revenues as a distributor on behalf of third parties and through outsourced agency agreements. In such cases, determining whether revenue should be reported on a gross or net basis is based on management’s assessment of who our customer is in the transaction. To the extent the end consumer is our customer, we act as the principal in a transaction and revenues earned from the end user are reported on a gross basis. This determination involves judgment and is based on an evaluation of the facts and circumstances of the terms of an arrangement.
Revenue Allowances
In accordance with the accounting guidance related to revenue recognition when a right of return exists, revenue allowances are recorded to adjust amounts originally invoiced to the estimated net realizable value of a particular product. Upon the sale of DVDs and Blu-ray discs to wholesalers and retailers, we record a reduction of revenue for the impact of estimated future
51
Management’s Discussion and Analysis
of Results of Operations and Financial Condition
(continued)
returns, rebates and other incentives (“estimated returns”). In determining estimated returns, we consider numerous sources of qualitative and quantitative evidence including forecasted sales data, customers’ rights of return, units shipped and units remaining at retail, historical return rates for similar product, current economic trends, competitive environment, promotions and sales strategies.
Forecasted sales data is determined by comparing a particular release to product that has similar characteristics where applicable, such as franchise, genre, box office levels and release patterns, using regression analysis, decay rates and other tools. Based on the results of this analysis and the sales strategies to be used for the release, we reserve an appropriate percentage of each dollar of product revenue on a title taking into consideration the qualitative and quantitative factors described above. Forecasted sales data is reviewed and updated throughout each quarter and is consistent with the projections of ultimate revenues used in applying the individual-film-forecast-computation method to amortize our film costs. Accordingly, a change in forecasted sales affects both the revenue allowance and related expenses. Actual sell-through data is reviewed as it becomes available against the forecasted sales data to ensure that estimates continue to be consistent with actual sales performance.
Our estimate of future returns affects reported revenue and operating income. If we underestimate the impact of future returns in a particular period, then we may record less revenue and related expenses in later periods when returns exceed the estimated amounts. If we overestimate the impact of future returns in a particular period, then we may record additional revenue and related expenses in later periods when returns are less than estimated. An incremental change of 1% in our estimated sales returns rate (i.e., provisions for returns divided by gross sales of related product) for DVDs and Blu-ray products would have a $9 million impact on our total revenue for the year ended September 30, 2017. This revenue impact would be partially offset by a corresponding impact on related expenses depending on the margin associated with a specific film and other factors.
Income Taxes
Significant judgment is required in determining our annual provision for income taxes and evaluating our income tax positions. Our tax rates are impacted by the tax laws, regulations and policies in federal, state and local and international territories where our businesses operate. Changes to these laws and regulations and uncertainty generated by the prospect of future tax legislation may also affect our income tax positions, in addition to other factors, including our global mix of earnings, acquisitions and dispositions, as well as the tax characteristics of our income. In determining our income tax provisions on a jurisdiction basis, we are required to make judgments on the need to record deferred tax assets and liabilities, including the realizability of deferred tax assets. A valuation allowance for deferred tax assets is established if it is more likely than not that a deferred tax asset will not be realized. In evaluating uncertain tax positions, we make determinations of the application of complex tax rules, regulations and practices. We evaluate our uncertain tax positions quarterly based on many factors including, but not limited to, new facts, changes in tax law and interpretations as well as information received from regulators. A change in any one of these factors could change our evaluation of an existing uncertain tax position, resulting in the recognition of an additional charge or benefit to our income tax provision in the period and may result in fluctuations in our effective income tax rate. Additionally, our income tax returns are routinely audited and settlements of issues raised in these audits sometimes affect our income tax provisions. The resolution of audit issues and income tax positions taken may take extended periods of time due to the length of examinations by tax authorities and the possible extension of statutes of limitations.
A 1% change in our effective income tax rate would result in additional income tax expense of approximately $22 million for the year ended September 30, 2017.
We indefinitely reinvest the earnings of substantially all of our foreign subsidiaries outside the U.S. We do not provide for U.S. taxes on earnings of our foreign subsidiaries for which the earnings are indefinitely reinvested.
Goodwill
Goodwill at September 30, 2017 relates to our reporting units Global Entertainment Group ($4.3 billion), Nickelodeon Group ($3.1 billion), BET Networks ($2.7 billion) and Paramount ($1.6 billion). We have elected to perform the two-step quantitative goodwill impairment test in 2017. We test goodwill for impairment on August 31 of each year. The first step of a quantitative goodwill impairment test is to identify a potential impairment by comparing the fair value of a reporting unit with its carrying amount. The second step, if necessary, compares the implied fair value of the reporting unit’s goodwill with the carrying amount of that goodwill. The implied fair value of goodwill is determined in the same manner as the amount of goodwill recognized in a business combination.
The estimates of fair value of a reporting unit are determined based on a discounted cash flow analysis. A discounted cash flow analysis requires us to make various judgmental assumptions, including assumptions about the timing and amount of future cash flows, growth rates and discount rates. Given the inherent uncertainty in determining these assumptions, actual results may
52
Management’s Discussion and Analysis
of Results of Operations and Financial Condition
(continued)
differ from those used in our valuations. To facilitate a better understanding of how these valuations are determined, a discussion of our significant assumptions, including a sensitivity analysis with respect to their impact on the estimated value of our reporting units, is provided below.
The assumptions about future cash flows and growth rates are based on the budget and long-term business plans of each reporting unit. Such assumptions take into account numerous factors including historical experience, anticipated economic conditions, advertising sales and ratings trends, terms of affiliate license arrangements and anticipated terms of renewals, projected costs for production and programming, number and expected financial performance of films expected to be produced and distributed each year and changes in the reporting unit cost structures.
Discount rate assumptions for each reporting unit take into account our assessment of the risks inherent in the future cash flows of the respective reporting unit, an assessment of market rates and the capital structure of comparable entities.
In determining the fair value of our reporting units, we used the following assumptions:
• | Expected cash flows underlying our business plans for the periods 2018 through 2022. |
• | Cash flows beyond 2022 are projected to grow at a perpetual growth rate, which we estimated at between 2.5% and 3%. |
• | In order to risk adjust the cash flow projections in determining fair value, we utilized a discount rate of approximately 7.4% to 9.4% for each of our reporting units. |
Based on our assessment using the assumptions described above, a hypothetical 20% reduction in the estimated fair value in each of our reporting units would not result in an impairment condition.
We have performed a sensitivity analysis to illustrate the impact of changes in assumptions underlying the first step of the impairment test. Based on our assessment:
• | a one percentage point decrease in the growth rate of cash flow over the periods 2018 through 2022 would reduce the indicated fair value of our reporting units by a range of approximately 4% to 6% and would not result in an impairment of any reporting unit; |
• | a one percentage point decrease in the perpetual growth rate would reduce the indicated fair value of each of our reporting units by a range of approximately 12% to 14% and would not result in an impairment of any reporting unit; and |
• | a one percentage point increase in the discount rate would reduce the indicated fair value of each of our reporting units by a range of approximately 14% to 17% and would not result in an impairment of any reporting unit. |
Finite-Lived Intangible Assets
We evaluate whether there has been an impairment of finite-lived intangible assets if a triggering event indicates that an impairment may exist. The impairment test employed for finite-lived intangible assets (e.g., broadcast license, trade names and customer lists), which is performed at the lowest level of cash flows associated with the asset, first requires a comparison of undiscounted future cash flows against the carrying value of the asset. If the carrying value exceeds the undiscounted cash flows, the asset would be written down to its fair value. Significant judgments in this area involve determining whether a triggering event has occurred, the determination of the cash flows for the assets involved and the discount rate to be applied in determining fair value.
53
Management’s Discussion and Analysis
of Results of Operations and Financial Condition
(continued)
OTHER MATTERS
Related Parties
In the ordinary course of business we enter into transactions with related parties, including National Amusements, Inc. (“National Amusements”), CBS, their respective subsidiaries and affiliates, and companies that we account for under the equity method of accounting. See Note 20 to the Consolidated Financial Statements for details regarding the related party transactions and their impact on the Financial Statements.
Agreements with CBS Corporation
In connection with our separation from CBS, effective as of January 1, 2006 (the “separation”), we and CBS entered into a Separation Agreement, a Transition Services Agreement and a Tax Matters Agreement, as well as certain other agreements to govern the terms of the separation and certain of the ongoing relationships between CBS and us after the separation. These related party arrangements are more fully described below.
Pursuant to the Separation Agreement, each company is obligated to indemnify the other company and the other company’s officers, directors and employees for any losses arising out of its failure to perform or discharge any of the liabilities it assumed pursuant to the Separation Agreement, including with respect to certain legal matters, its businesses as conducted as of the date of the separation and its breaches of shared contracts.
Subject to limited exceptions, the Separation Agreement provides that none of Viacom, any subsidiary of Viacom or any person that is controlled by Viacom after the separation will own or acquire an interest in a radio or television broadcast station, television broadcast network or daily newspaper, if such ownership or acquisition would (i) cause CBS, any subsidiary of CBS or any entity controlled by CBS after the date of the separation to be in violation of U.S. federal laws limiting the ownership or control of radio broadcast stations, television broadcast stations and/or television broadcast networks or (ii) limit in any manner at any time under such laws CBS’s ability to acquire additional interests in a radio or television broadcast station and/or television broadcast network. These restrictions will terminate when none of Mr. Redstone, National Amusements, NAIRI Inc. or any of their successors, assigns or transferees are deemed to have interests in both CBS and Viacom that are attributable under applicable U.S. federal laws.
The Separation Agreement also provides that neither Viacom, any subsidiary of Viacom or any person controlled by Viacom nor CBS, any subsidiary of CBS or any person controlled by CBS will acquire any asset, enter into any agreement or accept or agree to any condition that purports to bind, or subjects to a legal order, the other company, its subsidiaries or any person it controls without such other party’s written consent.
Item 7A. Quantitative and Qualitative Disclosures About Market Risk.
Disclosures on our market risk are included in “Management’s Discussion and Analysis of Results of Operations and Financial Condition – Market Risk.”
54
Item 8. Financial Statements and Supplementary Data.
Index to financial statements and supplementary data: | |
Consolidated Statements of Earnings for the years ended September 30, 2017, 2016 and 2015 | |
Consolidated Statements of Comprehensive Income for the years ended September 30, 2017, 2016 and 2015 | |
Consolidated Statements of Stockholders’ Equity for the years ended September 30, 2017, 2016 and 2015 | |
55
MANAGEMENT’S REPORT ON INTERNAL CONTROL OVER FINANCIAL REPORTING
Management has prepared and is responsible for our consolidated financial statements and related notes. Management is also responsible for establishing and maintaining adequate internal control over financial reporting as defined in Rules 13a-15(f) and 15d-15(f) under the Securities Exchange Act of 1934, as amended. Viacom Inc. and its subsidiaries’ (the “Company”) internal control over financial reporting includes those policies and procedures that (i) pertain to the maintenance of records that, in reasonable detail, accurately and fairly reflect the transactions and dispositions of the assets of the Company; (ii) provide reasonable assurance that transactions are recorded as necessary to permit preparation of financial statements in accordance with generally accepted accounting principles, and that receipts and expenditures of the Company are being made only in accordance with the authorizations of management and directors of the Company; and (iii) provide reasonable assurance regarding prevention or timely detection of unauthorized acquisition, use, or disposition of the Company’s assets that could have a material effect on the financial statements.
Internal control over financial reporting is designed to provide reasonable assurance regarding the reliability of financial reporting and the preparation of financial statements prepared for external purposes in accordance with generally accepted accounting principles. Because of its inherent limitations, internal control over financial reporting may not prevent or detect misstatements. Also, projections of any evaluation of effectiveness to future periods are subject to the risks that controls may become inadequate because of changes in conditions, or that the degree of compliance with the policies or procedures may deteriorate.
Under the supervision and with the participation of management, including our personal participation, we conducted an assessment of the effectiveness of internal control over financial reporting based on the framework in Internal Control – Integrated Framework (2013) as issued by the Committee of Sponsoring Organizations of the Treadway Commission. Based on this assessment, management determined that as of September 30, 2017, Viacom maintained effective internal control over financial reporting.
The effectiveness of our internal control over financial reporting as of September 30, 2017 has been audited by PricewaterhouseCoopers LLP, an independent registered public accounting firm, as stated in their report included herein.
VIACOM INC. | |
By: | /S/ ROBERT M. BAKISH |
Robert M. Bakish | |
President and Chief Executive Officer | |
By: | /S/ WADE DAVIS |
Wade Davis | |
Executive Vice President, Chief Financial Officer | |
By: | /S/ KATHERINE GILL-CHAREST |
Katherine Gill-Charest | |
Senior Vice President, Controller (Chief Accounting Officer) | |
56
REPORT OF INDEPENDENT REGISTERED PUBLIC ACCOUNTING FIRM
To the Board of Directors and Stockholders of Viacom Inc.
In our opinion, the consolidated financial statements listed in the index appearing under Item 8 present fairly, in all material respects, the financial position of Viacom Inc. and its subsidiaries (the “Company”) as of September 30, 2017 and 2016 and the results of their operations and their cash flows for each of the three years in the period ended September 30, 2017, in conformity with accounting principles generally accepted in the United States of America. In addition, in our opinion, the financial statement schedule listed in the index appearing under Item 8 presents fairly, in all material respects, the information set forth therein when read in conjunction with the related consolidated financial statements. Also in our opinion, the Company maintained, in all material respects, effective internal control over financial reporting as of September 30, 2017, based on criteria established in Internal Control - Integrated Framework (2013) issued by the Committee of Sponsoring Organizations of the Treadway Commission (COSO). The Company’s management is responsible for these financial statements and financial statement schedule, for maintaining effective internal control over financial reporting and for its assessment of the effectiveness of internal control over financial reporting, included in Management’s Report on Internal Control over Financial Reporting appearing under Item 8. Our responsibility is to express opinions on these financial statements, on the financial statement schedule, and on the Company’s internal control over financial reporting based on our integrated audits. We conducted our audits in accordance with the standards of the Public Company Accounting Oversight Board (United States). Those standards require that we plan and perform the audits to obtain reasonable assurance about whether the financial statements are free of material misstatement and whether effective internal control over financial reporting was maintained in all material respects. Our audits of the financial statements included examining, on a test basis, evidence supporting the amounts and disclosures in the financial statements, assessing the accounting principles used and significant estimates made by management, and evaluating the overall financial statement presentation. Our audit of internal control over financial reporting included obtaining an understanding of internal control over financial reporting, assessing the risk that a material weakness exists, and testing and evaluating the design and operating effectiveness of internal control based on the assessed risk. Our audits also included performing such other procedures as we considered necessary in the circumstances. We believe that our audits provide a reasonable basis for our opinions.
A company’s internal control over financial reporting is a process designed to provide reasonable assurance regarding the reliability of financial reporting and the preparation of financial statements for external purposes in accordance with generally accepted accounting principles. A company’s internal control over financial reporting includes those policies and procedures that (i) pertain to the maintenance of records that, in reasonable detail, accurately and fairly reflect the transactions and dispositions of the assets of the company; (ii) provide reasonable assurance that transactions are recorded as necessary to permit preparation of financial statements in accordance with generally accepted accounting principles, and that receipts and expenditures of the company are being made only in accordance with authorizations of management and directors of the company; and (iii) provide reasonable assurance regarding prevention or timely detection of unauthorized acquisition, use, or disposition of the company’s assets that could have a material effect on the financial statements.
Because of its inherent limitations, internal control over financial reporting may not prevent or detect misstatements. Also, projections of any evaluation of effectiveness to future periods are subject to the risk that controls may become inadequate because of changes in conditions, or that the degree of compliance with the policies or procedures may deteriorate.
/s/ PricewaterhouseCoopers LLP
New York, New York
November 16, 2017
57
VIACOM INC.
CONSOLIDATED STATEMENTS OF EARNINGS
Year Ended September 30, | |||||||||||
(in millions, except per share amounts) | 2017 | 2016 | 2015 | ||||||||
Revenues | $ | 13,263 | $ | 12,488 | $ | 13,268 | |||||
Expenses: | |||||||||||
Operating | 7,436 | 6,684 | 6,868 | ||||||||
Selling, general and administrative | 3,005 | 2,851 | 2,860 | ||||||||
Depreciation and amortization | 223 | 221 | 222 | ||||||||
Restructuring | 237 | 206 | 206 | ||||||||
Total expenses | 10,901 | 9,962 | 10,156 | ||||||||
Gain on asset sale | 127 | — | — | ||||||||
Operating income | 2,489 | 2,526 | 3,112 | ||||||||
Interest expense, net | (618 | ) | (616 | ) | (657 | ) | |||||
Equity in net earnings of investee companies | 81 | 87 | 102 | ||||||||
Gain on sale of EPIX | 285 | — | — | ||||||||
Other items, net | (25 | ) | (7 | ) | (54 | ) | |||||
Earnings from continuing operations before provision for income taxes | 2,212 | 1,990 | 2,503 | ||||||||
Provision for income taxes | (293 | ) | (519 | ) | (501 | ) | |||||
Net earnings from continuing operations | 1,919 | 1,471 | 2,002 | ||||||||
Discontinued operations, net of tax | 3 | 2 | — | ||||||||
Net earnings (Viacom and noncontrolling interests) | 1,922 | 1,473 | 2,002 | ||||||||
Net earnings attributable to noncontrolling interests | (48 | ) | (35 | ) | (80 | ) | |||||
Net earnings attributable to Viacom | $ | 1,874 | $ | 1,438 | $ | 1,922 | |||||
Amounts attributable to Viacom: | |||||||||||
Net earnings from continuing operations | $ | 1,871 | $ | 1,436 | $ | 1,922 | |||||
Discontinued operations, net of tax | 3 | 2 | — | ||||||||
Net earnings attributable to Viacom | $ | 1,874 | $ | 1,438 | $ | 1,922 | |||||
Basic earnings per share attributable to Viacom: | |||||||||||
Continuing operations | $ | 4.68 | $ | 3.62 | $ | 4.78 | |||||
Discontinued operations | 0.01 | 0.01 | — | ||||||||
Net earnings | $ | 4.69 | $ | 3.63 | $ | 4.78 | |||||
Diluted earnings per share attributable to Viacom: | |||||||||||
Continuing operations | $ | 4.67 | $ | 3.61 | $ | 4.73 | |||||
Discontinued operations | 0.01 | — | — | ||||||||
Net earnings | $ | 4.68 | $ | 3.61 | $ | 4.73 | |||||
Weighted average number of common shares outstanding: | |||||||||||
Basic | 399.9 | 396.5 | 402.2 | ||||||||
Diluted | 400.6 | 398.0 | 406.0 | ||||||||
Dividends declared per share of Class A and Class B common stock | $ | 0.80 | $ | 1.40 | $ | 1.46 | |||||
See accompanying notes to Consolidated Financial Statements
58
VIACOM INC.
CONSOLIDATED STATEMENTS OF COMPREHENSIVE INCOME
Year Ended September 30, | |||||||||||
(in millions) | 2017 | 2016 | 2015 | ||||||||
Net earnings (Viacom and noncontrolling interests) | $ | 1,922 | $ | 1,473 | $ | 2,002 | |||||
Other comprehensive income/(loss), net of tax: | |||||||||||
Foreign currency translation adjustments | 29 | (101 | ) | (237 | ) | ||||||
Defined benefit pension plans | 37 | (65 | ) | (7 | ) | ||||||
Cash flow hedges | 7 | 1 | 1 | ||||||||
Other comprehensive income/(loss) (Viacom and noncontrolling interests) | 73 | (165 | ) | (243 | ) | ||||||
Comprehensive income | 1,995 | 1,308 | 1,759 | ||||||||
Less: Comprehensive income attributable to noncontrolling interests | 47 | 28 | 78 | ||||||||
Comprehensive income attributable to Viacom | $ | 1,948 | $ | 1,280 | $ | 1,681 | |||||
See accompanying notes to Consolidated Financial Statements
59
VIACOM INC.
CONSOLIDATED BALANCE SHEETS
September 30, | |||||||
(in millions, except par value) | 2017 | 2016 | |||||
ASSETS | |||||||
Current assets: | |||||||
Cash and cash equivalents | $ | 1,389 | $ | 379 | |||
Receivables, net | 2,970 | 2,712 | |||||
Inventory, net | 919 | 844 | |||||
Prepaid and other assets | 523 | 587 | |||||
Total current assets | 5,801 | 4,522 | |||||
Property and equipment, net | 978 | 932 | |||||
Inventory, net | 3,982 | 4,032 | |||||
Goodwill | 11,665 | 11,400 | |||||
Intangibles, net | 313 | 315 | |||||
Other assets | 959 | 1,307 | |||||
Total assets | $ | 23,698 | $ | 22,508 | |||
LIABILITIES AND EQUITY | |||||||
Current liabilities: | |||||||
Accounts payable | $ | 431 | $ | 453 | |||
Accrued expenses | 869 | 773 | |||||
Participants' share and residuals | 825 | 801 | |||||
Program obligations | 712 | 692 | |||||
Deferred revenue | 463 | 419 | |||||
Current portion of debt | 19 | 17 | |||||
Other liabilities | 434 | 517 | |||||
Total current liabilities | 3,753 | 3,672 | |||||
Noncurrent portion of debt | 11,100 | 11,896 | |||||
Participants' share and residuals | 384 | 358 | |||||
Program obligations | 477 | 311 | |||||
Deferred tax liabilities, net | 294 | 381 | |||||
Other liabilities | 1,323 | 1,349 | |||||
Redeemable noncontrolling interest | 248 | 211 | |||||
Commitments and contingencies (Note 11) | |||||||
Viacom stockholders' equity: | |||||||
Class A common stock, par value $0.001, 375.0 authorized; 49.4 and 49.4 outstanding, respectively | — | — | |||||
Class B common stock, par value $0.001, 5,000.0 authorized; 353.0 and 347.6 outstanding, respectively | — | — | |||||
Additional paid-in capital | 10,119 | 10,139 | |||||
Treasury stock, 393.8 and 399.4 common shares held in treasury, respectively | (20,590 | ) | (20,798 | ) | |||
Retained earnings | 17,124 | 15,628 | |||||
Accumulated other comprehensive loss | (618 | ) | (692 | ) | |||
Total Viacom stockholders' equity | 6,035 | 4,277 | |||||
Noncontrolling interests | 84 | 53 | |||||
Total equity | 6,119 | 4,330 | |||||
Total liabilities and equity | $ | 23,698 | $ | 22,508 | |||
See accompanying notes to Consolidated Financial Statements
60
VIACOM INC.
CONSOLIDATED STATEMENTS OF CASH FLOWS
Year Ended September 30, | |||||||||||
(in millions) | 2017 | 2016 | 2015 | ||||||||
OPERATING ACTIVITIES | |||||||||||
Net earnings (Viacom and noncontrolling interests) | $ | 1,922 | $ | 1,473 | $ | 2,002 | |||||
Discontinued operations, net of tax | (3 | ) | (2 | ) | — | ||||||
Net earnings from continuing operations | 1,919 | 1,471 | 2,002 | ||||||||
Reconciling items: | |||||||||||
Depreciation and amortization | 223 | 221 | 222 | ||||||||
Feature film and program amortization | 4,739 | 4,568 | 4,925 | ||||||||
Equity-based compensation | 68 | 163 | 101 | ||||||||
Equity in net earnings and distributions from investee companies | (14 | ) | (83 | ) | (95 | ) | |||||
Gain on asset sales | (412 | ) | — | — | |||||||
Deferred income taxes | (174 | ) | 254 | (82 | ) | ||||||
Operating assets and liabilities, net of acquisitions: | |||||||||||
Receivables | (132 | ) | 149 | 124 | |||||||
Production and programming | (4,412 | ) | (5,102 | ) | (4,826 | ) | |||||
Accounts payable and other current liabilities | (207 | ) | (229 | ) | (9 | ) | |||||
Other, net | 73 | (41 | ) | (49 | ) | ||||||
Net cash provided by operating activities | 1,671 | 1,371 | 2,313 | ||||||||
INVESTING ACTIVITIES | |||||||||||
Acquisitions and investments, net | (378 | ) | (58 | ) | (115 | ) | |||||
Capital expenditures | (195 | ) | (172 | ) | (142 | ) | |||||
Proceeds received from asset sales | 848 | — | — | ||||||||
Grantor trust proceeds/(contributions) | 54 | (69 | ) | — | |||||||
Net cash provided by/(used in) investing activities | 329 | (299 | ) | (257 | ) | ||||||
FINANCING ACTIVITIES | |||||||||||
Borrowings | 2,569 | — | 990 | ||||||||
Debt repayments | (3,352 | ) | (368 | ) | (1,400 | ) | |||||
Purchase of treasury stock | — | (100 | ) | (1,548 | ) | ||||||
Dividends paid | (319 | ) | (635 | ) | (564 | ) | |||||
Excess tax benefits on equity-based compensation awards | 1 | — | 43 | ||||||||
Exercise of stock options | 172 | 11 | 146 | ||||||||
Other, net | (81 | ) | (81 | ) | (144 | ) | |||||
Net cash used in financing activities | (1,010 | ) | (1,173 | ) | (2,477 | ) | |||||
Effect of exchange rate changes on cash and cash equivalents | 20 | (26 | ) | (73 | ) | ||||||
Net change in cash and cash equivalents | 1,010 | (127 | ) | (494 | ) | ||||||
Cash and cash equivalents at beginning of period | 379 | 506 | 1,000 | ||||||||
Cash and cash equivalents at end of period | $ | 1,389 | $ | 379 | $ | 506 | |||||
See accompanying notes to Consolidated Financial Statements
61
VIACOM INC.
CONSOLIDATED STATEMENTS OF STOCKHOLDERS’ EQUITY
(in millions) | Common Stock (shares) | Common Stock/ Additional Paid-In Capital | Treasury Stock | Retained Earnings | Accumulated Other Comprehensive Loss | Total Viacom Stockholders’ Equity | Noncontrolling Interests | Total Equity | ||||||||||||||||||||||
September 30, 2014 | 414.2 | $ | 9,772 | $ | (19,225 | ) | $ | 13,465 | $ | (293 | ) | $ | 3,719 | $ | 28 | $ | 3,747 | |||||||||||||
Net earnings | — | — | — | 1,922 | — | 1,922 | 80 | 2,002 | ||||||||||||||||||||||
Other comprehensive loss, net of income tax benefit of $8 | — | — | — | — | (241 | ) | (241 | ) | (2 | ) | (243 | ) | ||||||||||||||||||
Noncontrolling interests | — | — | — | (18 | ) | — | (18 | ) | (45 | ) | (63 | ) | ||||||||||||||||||
Dividends declared | — | — | — | (589 | ) | — | (589 | ) | — | (589 | ) | |||||||||||||||||||
Purchase of treasury stock | (21.1 | ) | — | (1,500 | ) | — | — | (1,500 | ) | — | (1,500 | ) | ||||||||||||||||||
Equity-based compensation and other | 5.0 | 245 | — | — | — | 245 | — | 245 | ||||||||||||||||||||||
September 30, 2015 | 398.1 | 10,017 | (20,725 | ) | 14,780 | (534 | ) | 3,538 | 61 | 3,599 | ||||||||||||||||||||
Net earnings | — | — | — | 1,438 | — | 1,438 | 35 | 1,473 | ||||||||||||||||||||||
Other comprehensive loss, net of income tax benefit of $31 | — | — | — | — | (158 | ) | (158 | ) | (7 | ) | (165 | ) | ||||||||||||||||||
Noncontrolling interests | — | — | — | (32 | ) | — | (32 | ) | (36 | ) | (68 | ) | ||||||||||||||||||
Dividends declared | — | — | — | (558 | ) | — | (558 | ) | — | (558 | ) | |||||||||||||||||||
Purchase of treasury stock | (2.1 | ) | — | (100 | ) | — | — | (100 | ) | — | (100 | ) | ||||||||||||||||||
Equity-based compensation and other | 1.0 | 122 | 27 | — | — | 149 | — | 149 | ||||||||||||||||||||||
September 30, 2016 | 397.0 | 10,139 | (20,798 | ) | 15,628 | (692 | ) | 4,277 | 53 | 4,330 | ||||||||||||||||||||
Net earnings | — | — | — | 1,874 | — | 1,874 | 48 | 1,922 | ||||||||||||||||||||||
Other comprehensive income/(loss), net of income tax expense of $27 | — | — | — | — | 74 | 74 | (1 | ) | 73 | |||||||||||||||||||||
Noncontrolling interests | — | — | — | (57 | ) | — | (57 | ) | (16 | ) | (73 | ) | ||||||||||||||||||
Dividends declared | — | — | — | (321 | ) | — | (321 | ) | — | (321 | ) | |||||||||||||||||||
Equity-based compensation and other | 5.4 | (20 | ) | 208 | — | — | 188 | — | 188 | |||||||||||||||||||||
September 30, 2017 | 402.4 | $ | 10,119 | $ | (20,590 | ) | $ | 17,124 | $ | (618 | ) | $ | 6,035 | $ | 84 | $ | 6,119 | |||||||||||||
See accompanying notes to Consolidated Financial Statements
62
VIACOM INC.
NOTES TO CONSOLIDATED FINANCIAL STATEMENTS
NOTE 1. BASIS OF PRESENTATION
Description of Business
Viacom is home to premier global media brands that create compelling entertainment content - including television programs, motion pictures, short-form content, games, consumer products, podcasts, live events and social media experiences - for audiences in more than 180 countries on various platforms and devices. Viacom operates through two reportable segments: Media Networks and Filmed Entertainment. The Media Networks segment provides entertainment content, services and related branded products for consumers in targeted demographics attractive to advertisers, content distributors and retailers through three brand groups: the Global Entertainment Group, the Nickelodeon Group and BET Networks. The Filmed Entertainment segment develops, produces, finances, acquires and distributes motion pictures, television programming and other entertainment content under the Paramount Pictures, Paramount Players, Paramount Animation and Paramount Television divisions, in various markets and media worldwide, for itself and for third parties. It partners on various projects with key Viacom franchises, including Nickelodeon Movies and MTV Films. References in this document to “Viacom,” “Company,” “we,” “us” and “our” mean Viacom Inc. and our consolidated subsidiaries, unless the context requires otherwise.
The consolidated financial statements present the Company’s financial results for the years ended September 30, 2017 (“2017”), September 30, 2016 (“2016”) and September 30, 2015 (“2015”).
Use of Estimates
Preparing financial statements in conformity with accounting principles generally accepted in the United States of America (“GAAP”) requires management to make estimates, judgments and assumptions that affect the reported amounts of assets and liabilities as of the dates presented and the reported amounts of revenues and expenses during the periods presented. Significant estimates inherent in the preparation of the accompanying Consolidated Financial Statements include estimates of film ultimate revenues, product returns, potential outcome of uncertain tax positions, fair value of acquired assets and liabilities, fair value of equity-based compensation and pension benefit assumptions. Estimates are based on past experience and other considerations reasonable under the circumstances. Actual results may differ from these estimates.
Reclassifications
Certain prior year amounts have been reclassified to conform to the 2017 presentation.
Recent Accounting Pronouncements
Definition of a Business
In January 2017, the Financial Accounting Standards Board (“FASB”) issued Accounting Standards Update (“ASU”) 2017-01 - Clarifying the Definition of a Business, which changes the definition of a business for accounting purposes. Under the new guidance, an entity first determines whether substantially all of the fair value of a set of assets acquired is concentrated in a single identifiable asset or a group of similar identifiable assets. If this threshold is met, the set of assets is not deemed to be a business. If the threshold is not met, the entity then evaluates whether the set of assets meets the requirement to be deemed a business, which at a minimum, requires there to be an input and a substantive process that together significantly contribute to the ability to create outputs. The guidance is effective for the first interim period of our 2019 fiscal year, with early adoption permitted. During the quarter ended September 30, 2017, we adopted the new guidance on a prospective basis.
Income Taxes
In October 2016, the FASB issued ASU 2016-16 - Income Taxes: Intra-Entity Transfers of Assets Other Than Inventory. ASU 2016-16 will require the tax effects of intercompany transactions, other than sales of inventory, to be recognized currently, eliminating an exception under current GAAP in which the tax effects of intra-entity asset transfers are deferred until the transferred asset is sold to a third party or otherwise recovered through use. The guidance will be effective for the first interim period of our 2019 fiscal year, with early adoption permitted. As of September 30, 2017, the Company had approximately $200 million of unrecorded net deferred tax assets, primarily related to an intra-entity transfer of assets. Once recorded, the deferred tax assets will be amortized over the next 12 years.
Statement of Cash Flows
In August 2016, the FASB issued ASU 2016-15 - Statement of Cash Flows: Classification of Certain Cash Receipts and Cash Payments. ASU 2016-15 addresses how certain cash receipts and cash payments are presented and classified in the statement of cash flows. The guidance will be effective for the first interim period of our 2019 fiscal year, with early adoption permitted. The
63
new standard will impact our statement of cash flows by increasing cash flow from operating activities and decreasing cash flow from financing activities in periods when debt prepayment or debt extinguishment costs are paid.
Financial Instruments
In connection with its financial instruments project, the FASB issued ASU 2016-13 - Financial Instruments - Credit Losses: Measurement of Credit Losses on Financial Instruments in June 2016 and ASU 2016-01 - Financial Instruments - Overall: Recognition and Measurement of Financial Assets and Financial Liabilities in January 2016.
• | ASU 2016-13 introduces a new impairment model for most financial assets and certain other instruments. For trade and other receivables, held-to-maturity debt securities, loans and other instruments, entities will be required to use a forward-looking “expected loss” model that will replace the current “incurred loss” model and generally will result in earlier recognition of allowances for losses. The guidance will be effective for the first interim period of our 2021 fiscal year, with early adoption in fiscal year 2020 permitted. |
• | ASU 2016-01 addresses certain aspects of recognition, measurement, presentation and disclosure of financial instruments. Among other provisions, the new guidance requires the fair value measurement of investments in certain equity securities. For investments without readily determinable fair values, entities have the option to either measure these investments at fair value or at cost adjusted for changes in observable prices minus impairment. All changes in measurement will be recognized in net income. The guidance will be effective for the first interim period of our 2019 fiscal year. Early adoption is not permitted, except for certain provisions relating to financial liabilities. |
We are currently evaluating the impact of the new standards.
Equity-Based Compensation
In March 2016, the FASB issued ASU 2016-09 - Compensation - Stock Compensation: Improvements to Employee Share-Based Payment Accounting. ASU 2016-09 includes provisions intended to simplify various aspects related to how share-based payments are accounted for and presented in the financial statements, such as requiring all income tax effects of awards to be recognized in the income statement when the awards vest or are settled and allowing a policy election to account for forfeitures as they occur. In addition, all related cash flows resulting from share-based payments will be reported as operating activities on the statement of cash flows. The guidance will be effective for the first interim period of our 2018 fiscal year, with early adoption permitted. The new standard will impact our financial statements by increasing or decreasing our income tax provision and increasing cash flow from operating activities.
Leases
In February 2016, the FASB issued ASU 2016-02 - Leases. ASU 2016-02 requires lessees to recognize a right-of-use asset and a lease liability on the balance sheet for most leases. For income statement purposes, leases will be classified as either operating or finance, generally resulting in straight-line expense recognition for operating leases (similar to current operating leases) and accelerated expense recognition for financing leases (similar to current capital leases). The guidance will be effective for the first interim period of our 2020 fiscal year, with early adoption permitted. See Note 11 for additional information regarding our future minimum lease commitments as of September 30, 2017. The guidance is required to be adopted retrospectively. We are still evaluating the impact of the new guidance on our consolidated financial statements.
Revenue Recognition
In May 2014, the FASB issued ASU 2014-09 - Revenue from Contracts with Customers, a comprehensive revenue recognition model that supersedes the current revenue recognition requirements and most industry-specific guidance. Subsequent accounting standard updates have also been issued which amend and/or clarify the application of ASU 2014-09. The guidance provides a five step framework to recognize revenue to depict the transfer of goods or services to customers in an amount that reflects the consideration it expects to be entitled to in exchange for those goods or services. The guidance will be effective for the first interim period of our 2019 fiscal year (with early adoption permitted beginning with our 2018 fiscal year), and allows adoption either under a full retrospective or a modified retrospective approach.
We are assessing the potential impact of adopting this guidance and finalizing our implementation plan. Our assessment includes designing appropriate changes to our processes, systems and controls to support the recognition and disclosure requirements under the new guidance. We expect that the new standard will impact the timing of revenue recognition for renewals or extensions of existing licensing agreements for intellectual property, which upon adoption will be recognized as revenue when the renewal term begins rather than when the agreement is extended or renewed under guidance currently in effect. We have not identified any other significant impacts to our consolidated financial statements based on our assessment to date. Our continued evaluation of the expected impact of the new guidance or the issuance of additional interpretations, if any, could result in an impact that is different from our preliminary conclusions. We will determine the method of transition to adopt the new standard as we move closer to finalizing our implementation plan.
64
NOTE 2. SUMMARY OF SIGNIFICANT ACCOUNTING POLICIES
Principles of Consolidation
Our consolidated financial statements include the accounts of Viacom Inc., its subsidiaries and variable interest entities (“VIEs”) where we are considered the primary beneficiary, after elimination of intercompany accounts and transactions. Investments in business entities in which Viacom lacks control but does have the ability to exercise significant influence over operating and financial policies are accounted for using the equity method. Our proportionate share of net income or loss of the entity is recorded in Equity in net earnings of investee companies in the Consolidated Statements of Earnings.
Business Combinations
We account for business combinations using the acquisition method of accounting. Under the acquisition method, once control is obtained of a business, 100% of the assets, liabilities and certain contingent liabilities acquired, including amounts attributed to noncontrolling interests, are recorded at fair value. Any transaction costs are expensed as incurred.
Foreign Currency Translation and Remeasurement
Assets and liabilities of subsidiaries with a functional currency other than the United States (“U.S.”) Dollar are translated into U.S. Dollars using period-end exchange rates, while results of operations are translated at exchange rates during the period. Foreign currency translation gains and losses are included as a component of Accumulated other comprehensive loss in the Consolidated Balance Sheets. Substantially all of our foreign operations use the local currency as the functional currency. Subsidiaries that enter into transactions denominated in currencies other than their functional currency will result in remeasurement gains and losses which are reflected within Other items, net in the Consolidated Statements of Earnings.
Revenue Recognition
We recognize revenue when it is realized or realizable and earned. We consider revenue realized or realizable and earned when there is persuasive evidence of an arrangement, delivery has occurred, the sales price is fixed or determinable, and collectability is reasonably assured. Determining whether some or all of these criteria have been met involves assumptions and judgments that can have a significant impact on the timing and amount of revenue we report. This includes the evaluation of multiple element arrangements for bundled advertising sales and content licenses, which involves allocating the consideration among individual deliverables within the bundled arrangement.
Advertising Revenues: Revenue from the sale of advertising earned by the Media Networks segment is recognized, net of agency commissions, when the advertisement is aired and the contracted audience rating is met. For advertising sold based on impression guarantees, audience deficiency may result in an obligation to deliver subsequent additional units. To the extent we do not satisfy contracted audience ratings, we record deferred revenue until such time that the impression guarantee has been satisfied.
Film and Television Production Revenues: Theatrical revenue is recognized from theatrical distribution of motion pictures upon exhibition. For sales of DVDs and Blue-ray discs to wholesalers and retailers, revenue is recognized upon the later of delivery or the date that those products are made widely available for sale by retailers. Revenue for transactional video-on-demand and similar arrangements are recognized as the films are exhibited based on end-customer purchases as reported by the distributor. Revenue from the licensing of film and television exhibition rights is recognized upon availability for airing by the licensee.
Affiliate Revenues: Affiliate revenues from cable television operators, direct-to-home satellite television operators and mobile networks are recognized by the Media Networks segment as the service is provided to the distributor. Fees associated with arrangements with subscription video-on-demand and other over-the-top (“OTT”) services are recognized upon program availability.
Ancillary Revenues: Revenue associated with consumer products and brand licensing is typically recognized utilizing contractual royalty rates applied to sales amounts reported by licensees. Revenue from licensing of our programming content for download-to-own and download-to-rent services is recognized when we are notified by the multi-platform retailer that the product has been downloaded and all other revenue recognition criteria are met.
Multiple-Element Arrangements: We enter into arrangements under which we perform multiple revenue-generating activities. We allocate consideration to separate units of account in the arrangement and recognize the associated revenue as each unit of account is delivered.
Advertising revenues are principally generated from the sale of advertising time comprised of multiple commercial units. Each advertising spot comprises a deliverable for accounting purposes. Consideration for these arrangements is allocated among the individual advertising spots based on relative fair value using Viacom-specific prices.
65
Subscription video-on-demand and other OTT arrangements include certain programs made available to distributors on one or more dates for a fixed fee. Consideration for such arrangements is allocated among the programs based on relative fair value using management’s best estimate considering viewing performance and other factors.
Gross versus Net Revenue: We earn and recognize revenues as a distributor on behalf of third parties and through outsourced agency agreements. In such cases, determining whether revenue should be reported on a gross or net basis is based on management’s assessment of who our customer is in the transaction. To the extent the end consumer is our customer, we act as the principal in a transaction and revenues earned from the end user are reported on a gross basis. This determination involves judgment and is based on an evaluation of whether we have the substantial risks and rewards under the terms of an arrangement.
Revenue Allowances: We record a provision for sales returns and allowances at the time of sale based upon an estimate of future returns, rebates and other incentives (“estimated returns”). In determining estimated returns, we consider numerous sources of qualitative and quantitative evidence including forecasted sales data, customers’ rights of return, units shipped and units remaining at retail, historical return rates for similar product, current economic trends, competitive environment, promotions and sales strategies. Reserves for accounts receivable are based on amounts estimated to be uncollectible. Our reserve for sales returns and allowances was $79 million and $93 million at September 30, 2017 and 2016, respectively. Our allowance for doubtful accounts was $49 million and $44 million at September 30, 2017 and 2016, respectively.
Advertising Expense
We expense advertising costs as they are incurred. We incurred total advertising expenses of $1.335 billion in 2017, $987 million in 2016 and $748 million in 2015.
Equity-Based Compensation
We measure the cost of employee services received in exchange for an award of equity instruments based on the grant date fair value of the award. The fair value received is recognized in earnings over the period during which an employee is required to provide service.
Income Taxes
Our provision for income taxes includes the current tax owed on the current period earnings, as well as a deferred provision which reflects the future tax consequences attributable to differences between the financial statement carrying amounts of existing assets and liabilities and their respective income tax bases. Deferred tax assets and liabilities are measured using enacted tax rates expected to apply to taxable income in the years in which those temporary differences are expected to be recovered or settled. Changes in existing tax laws and rates, their related interpretations, as well as the uncertainty generated by the prospect of tax legislation in the future may affect the amounts of deferred tax liabilities or the realizability of deferred tax assets. Deferred tax assets and deferred tax liabilities are classified as noncurrent and are included in Other Assets and Deferred tax liabilities, net, respectively, within the Consolidated Balance Sheets.
For tax positions we have taken or expect to take in a tax return, we apply a more likely than not assessment (i.e., there is a greater than 50 percent chance) about whether the tax position will be sustained upon examination by the appropriate tax authority with full knowledge of all relevant information. Amounts recorded for uncertain tax positions are periodically assessed, including the evaluation of new facts and circumstances, to ensure sustainability of the position. Interest and penalties related to uncertain tax positions are included in the Provision for income taxes in the Consolidated Statements of Earnings. Liabilities for uncertain tax positions are classified as Other liabilities – noncurrent in the Consolidated Balance Sheets.
Earnings per Common Share
Basic earnings per common share is computed by dividing Net earnings attributable to Viacom by the weighted average number of common shares outstanding during the period. The determination of diluted earnings per common share includes the weighted average number of common shares plus the dilutive effect of equity awards based upon the application of the treasury stock method. Anti-dilutive common shares are excluded from the calculation of diluted earnings per common share.
Comprehensive Income
Comprehensive income includes net earnings, foreign currency translation adjustments, amortization of amounts related to defined benefit plans, unrealized gains and losses on certain derivative financial instruments, and unrealized gains and losses on investments in equity securities which are publicly traded.
Cash and Cash Equivalents
All highly liquid investments with maturities of three months or less at the date of purchase are considered to be cash equivalents.
66
Inventory
Inventories related to film and television productions (which include direct production costs, production overhead, acquisition costs and development costs) are stated at the lower of amortized cost or fair value. Acquired program rights and obligations are recorded based on the gross amount of the liability when the license period has begun, and when the program is accepted and available for airing. Acquired programming is stated at the lower of unamortized cost or net realizable value. Film, television and acquired programming inventories are included as a component of Inventory, net, in the Consolidated Balance Sheets. Film, television and acquired programming costs, including inventory amortization, development costs, residuals and participations and impairment charges, if any, are included within Operating expenses in the Consolidated Statements of Earnings.
Film and television production costs: We use an individual-film-forecast-computation method to amortize film costs and to accrue estimated liabilities for residuals and participations over the applicable title’s life cycle based upon the ratio of current period to estimated remaining total gross revenues (“ultimate revenues”) for each title. The estimate of ultimate revenues impacts the timing of amortization and accrual of residuals and participations. Our estimate of ultimate revenues for feature films includes revenues from all sources that are estimated to be earned within 10 years from the date of a film’s initial theatrical release. For acquired film libraries, our estimate of ultimate revenues is for a period within 20 years from the date of acquisition. These estimates are periodically reviewed and adjustments, if any, will result in changes to inventory amortization rates, estimated accruals for residuals and participations or possibly the recognition of an impairment charge to operating income. Film development costs that have not been set for production are expensed within three years unless they are abandoned earlier, in which case these projects are written down to their estimated fair value in the period the decision to abandon the project is determined. We have a rigorous greenlight process designed to manage the risk of loss or abandonment.
Capitalized original programming costs are amortized utilizing an individual-film-forecast-computation method over the applicable title’s ultimate revenues based on genre and historical experience, beginning with the month of initial exhibition. Original programming costs that have not been greenlit for production are expensed. An impairment charge is recorded when the fair value of the television program is less than the unamortized production cost or abandoned.
Acquired programming: Costs incurred in acquiring program rights, including advances, are capitalized and amortized over the license period or projected useful life of the programming, if shorter, commencing upon availability, based on estimated future airings. If initial airings are expected to generate higher revenues an accelerated method of amortization is used. Net realizable value of acquired rights programming is evaluated quarterly by us on a daypart basis, which is defined as an aggregation of programs broadcast during a particular time of day or an aggregation of programs of a similar type. We aggregate similar programming based on the specific demographic targeted by each respective program service. Net realizable value is determined by estimating advertising revenues to be derived from the future airing of the programming within the daypart as well as an allocation of affiliate revenue to the programming. An impairment charge may be necessary if our estimates of future cash flows of similar programming are insufficient or if programming is abandoned.
Home entertainment inventory: Home entertainment inventory is valued at the lower of cost or net realizable value. Cost is determined using the average cost method.
Property and Equipment
Property and equipment is stated at cost. Depreciation is calculated using the straight-line method. Leasehold improvements are amortized using the straight-line method over the shorter of their useful lives or the life of the lease. Costs associated with repairs and maintenance of property and equipment are expensed as incurred.
Goodwill, Intangible Assets and Other Long-Lived Assets
Goodwill represents the residual difference between the consideration paid for a business and the fair value of the net assets acquired. Goodwill is not amortized, but rather is tested annually for impairment, on August 31 each year, or sooner when circumstances indicate impairment may exist. Goodwill is tested for impairment at the reporting unit level, which is an operating segment, or a business which is one level below that operating segment.
Identifiable intangible assets with finite lives are amortized over their estimated useful lives, which range up to 20 years, and identifiable intangible assets with indefinite lives are not amortized, but rather are tested annually for impairment, or sooner when circumstances indicate impairment may exist. Amortizable intangible assets and other long-lived assets are tested for impairment utilizing an income approach based on undiscounted cash flows upon the occurrence of certain triggering events and, if impaired, are written down to fair value. The impairment test is performed at the lowest level of cash flows associated with the asset.
67
Investments
Our investments primarily consist of investments in equity. Investments in which we have a significant influence, but not a controlling interest, are accounted for using the equity method. Other investments are carried at fair value, to the extent publicly traded, with unrealized gains and losses recorded in other comprehensive income, or at cost. We monitor our investments for impairment at least annually and make appropriate reductions in carrying values if we determine that an impairment charge is required based on qualitative and quantitative information. Our investments are included in Other assets – noncurrent in the Consolidated Balance Sheets.
Guarantees
At the inception of a guarantee, we recognize a liability for the fair value of an obligation assumed by issuing the guarantee. The related liability is subsequently reduced as utilized or extinguished and increased if there is a probable loss associated with the guarantee which exceeds the value of the recorded liability.
Treasury Stock
Treasury stock is accounted for using the cost method.
Fair Value Measurements
Fair value is defined as the price that would be received to sell an asset or paid to transfer a liability in an orderly transaction between market participants. The framework for measuring fair value provides a hierarchy that prioritizes the inputs to valuation techniques used in measuring fair value. The hierarchy gives the highest priority to unadjusted quoted prices in active markets for identical assets or liabilities (Level 1 measurement) and the lowest priority to unobservable inputs (Level 3 measurement). The three levels of the fair value hierarchy are as follows:
• | Level 1 – Inputs to the valuation methodology are unadjusted quoted prices for identical assets or liabilities in active markets. |
• | Level 2 – Inputs to the valuation methodology include: quoted prices for similar assets or liabilities in active markets; quoted prices for identical or similar assets or liabilities in inactive markets; inputs other than quoted prices that are observable for the asset or liability; inputs that are derived principally from or corroborated by observable market data by correlation or other means. |
• | Level 3 – Inputs to the valuation methodology are unobservable and significant to the fair value measurement. |
Derivative Financial Instruments
Derivative financial instruments are recorded on the Consolidated Balance Sheets as assets or liabilities and measured at fair value. For derivatives designated as hedges of the fair value of assets or liabilities, the changes in fair value of both the derivatives and the hedged items are recorded in current earnings as part of Other items, net in the Consolidated Statements of Earnings. For derivatives designated as cash flow hedges, the effective portion of the changes in fair value of the derivatives is recorded in Accumulated other comprehensive loss in the Consolidated Balance Sheets and subsequently recognized in earnings when the hedged items impact income. The fair value of derivative financial instruments is included in Prepaid and other assets and Other liabilities – current in the Consolidated Balance Sheets. Changes in the fair value of derivatives not designated as hedges and the ineffective portion of cash flow hedges are recorded in earnings. We do not hold or enter into financial instruments for speculative trading purposes.
Pension Benefits
Our defined benefit pension plans principally consist of both funded and unfunded noncontributory plans covering the majority of domestic employees and retirees. The funded defined benefit pension plan and unfunded pension plans are currently frozen to future benefit accruals. The expense we recognize is determined using certain assumptions, including the expected long-term rate of return and discount rate, among others. We recognize the funded status of our defined benefit plans (other than a multiemployer plan) as an asset or liability in the Consolidated Balance Sheets and recognize the changes in the funded status in the year in which the changes occur through Accumulated other comprehensive loss in the Consolidated Balance Sheets.
NOTE 3. ACCOUNTS RECEIVABLE
We had $486 million and $547 million of noncurrent trade receivables as of September 30, 2017 and 2016, respectively. Accounts receivables are principally related to long-term television license arrangements at Filmed Entertainment and subscription video-on-demand and other OTT arrangements at Media Networks. These amounts are included within Other assets - noncurrent in our Consolidated Balance Sheets. Such amounts are due in accordance with the underlying terms of the
68
respective agreements with companies that are investment grade or with which we have historically done business under similar terms. We have determined that credit loss allowances are generally not considered necessary for these amounts.
NOTE 4. ACQUISITION AND INVESTMENTS
Acquisition
On November 15, 2016, we acquired Televisión Federal S.A. (“Telefe”), one of the main free-to-air channels and biggest content producers in Argentina, for $336 million, net of cash acquired. Telefe adds to our portfolio of international TV networks and accelerates our growth strategy in Argentina.
The following table summarizes our allocation of the purchase price as of the acquisition date:
Purchase Price Allocation (in millions) | |||||
Current assets | $ | 88 | |||
Goodwill | 258 | ||||
Intangible assets | 49 | ||||
Property and equipment | 73 | ||||
Other assets | 13 | ||||
Assets acquired | 481 | ||||
Accounts payable and accrued expenses | 55 | ||||
Other liabilities | 90 | ||||
Liabilities assumed | 145 | ||||
$ | 336 | ||||
The goodwill, which is not deductible for tax purposes, reflects the Company-specific synergies arising from the acquisition. Intangible assets primarily consist of trade names and broadcast licenses with a useful life of 15 years.
The operating results of Telefe in the current and prior year are not material.
Investments
Our equity method investments total $258 million and $542 million, as of September 30, 2017 and 2016, respectively.
We hold an equity interest of 50% in Viacom 18, a joint venture in India that owns and operates regional entertainment channels.
On May 11, 2017, we completed the sale of our 49.76% interest in EPIX, a premium entertainment network, to Metro-Goldwyn-Mayer. The sale resulted in proceeds of $593 million, net of transaction costs of $4 million, and a gain of $285 million. In addition, prior to the closing of the sale, EPIX paid a dividend, of which our pro rata share was $37 million.
Our cost method investments total $98 million and $96 million as of September 30, 2017 and 2016, respectively. During the year ended September 30, 2017, we recognized an impairment loss of $10 million to write-down a cost method investment. The impairment charge is included in Other items, net, in the Consolidated Statement of Earnings.
Variable Interest Entities
In the normal course of business, we enter into joint ventures or make investments with business partners that support our underlying business strategy and provide us the ability to enter new markets to expand the reach of our brands, develop new programming and/or distribute our existing content. In certain instances, an entity in which we make an investment may qualify as a VIE. In determining whether we are the primary beneficiary of a VIE, we assess whether we have the power to direct matters that most significantly impact the activities of the VIE and have the obligation to absorb losses or the right to receive benefits from the VIE that could potentially be significant to the VIE.
69
Our Consolidated Balance Sheets include amounts related to consolidated VIEs totaling $159 million in assets and $8 million in liabilities as of September 30, 2017, and $190 million in assets and $57 million in liabilities as of September 30, 2016. In 2017, a consolidated VIE completed the sale of broadcast spectrum in connection with the FCC’s broadcast spectrum auction. The sale resulted in proceeds of $147 million, a portion of which was used to repay outstanding debt, and a pre-tax gain of $127 million, with $11 million attributable to the noncontrolling interest.
NOTE 5. PROPERTY AND EQUIPMENT
Property and Equipment, net (in millions) | September 30, | Estimated Life (in years) | ||||||||
2017 | 2016 | |||||||||
Land | $ | 261 | $ | 239 | — | |||||
Buildings | 491 | 432 | up to 40 | |||||||
Capital leases | 201 | 204 | up to 15 | |||||||
Equipment and other | 2,020 | 1,958 | up to 20 | |||||||
Property and equipment | 2,973 | 2,833 | ||||||||
Accumulated depreciation | (1,995 | ) | (1,901 | ) | ||||||
Property and equipment, net | $ | 978 | $ | 932 | ||||||
Depreciation expense, including assets under capital leases, was $194 million in 2017, and $188 million in 2016 and 2015. Depreciation expense related to capital leases was $16 million in 2017, $18 million in 2016 and $20 million in 2015. Accumulated depreciation of capital leases was $160 million and $147 million at September 30, 2017 and 2016, respectively.
Certain Media Networks assets with a carrying value of approximately $35 million are held for sale as of September 30, 2017. We expect the sales of these assets to be completed in fiscal 2018 and plan to use the proceeds for the repayment of outstanding debt.
NOTE 6. INVENTORY
Inventory (in millions) | September 30, | ||||||
2017 | 2016 | ||||||
Film inventory: | |||||||
Released, net of amortization | $ | 534 | $ | 632 | |||
Completed, not yet released | 85 | 128 | |||||
In process and other | 686 | 993 | |||||
1,305 | 1,753 | ||||||
Television productions: | |||||||
Released, net of amortization | 15 | 16 | |||||
In process and other | 237 | 102 | |||||
252 | 118 | ||||||
Original programming: | |||||||
Released, net of amortization | 1,146 | 1,082 | |||||
In process and other | 673 | 706 | |||||
1,819 | 1,788 | ||||||
Acquired program rights, net of amortization | 1,435 | 1,127 | |||||
Home entertainment inventory | 90 | 90 | |||||
Total inventory, net | 4,901 | 4,876 | |||||
Less current portion | 919 | 844 | |||||
Noncurrent portion | $ | 3,982 | $ | 4,032 | |||
We expect to amortize approximately $1.5 billion of film and television costs, including released and completed, not yet released, during the fiscal year ending September 30, 2018 using the individual-film-forecast-computation method. In addition, we expect to amortize 90% of unamortized released film and television costs, excluding acquired film libraries, at September 30, 2017, within the next three years.
70
NOTE 7. GOODWILL AND INTANGIBLES
Goodwill
The following table details the change in goodwill by segment for 2017 and 2016:
Goodwill (in millions) | Media Networks | Filmed Entertainment | Total | ||||||||
Balance at September 30, 2015 | $ | 9,863 | $ | 1,593 | $ | 11,456 | |||||
Foreign currency translation | (52 | ) | — | (52 | ) | ||||||
Other | (4 | ) | — | (4 | ) | ||||||
Balance at September 30, 2016 | 9,807 | 1,593 | 11,400 | ||||||||
Acquisitions | 279 | — | 279 | ||||||||
Foreign currency translation | (14 | ) | — | (14 | ) | ||||||
Balance at September 30, 2017 | $ | 10,072 | $ | 1,593 | $ | 11,665 | |||||
Intangibles
The following table details our intangible asset balances by major asset classes:
Intangibles (in millions) | September 30, | ||||||
2017 | 2016 | ||||||
Finite-lived intangible assets: | |||||||
Trade names | $ | 189 | $ | 182 | |||
Licenses | 159 | 127 | |||||
Subscriber agreements | 55 | 58 | |||||
Other intangible assets | 154 | 152 | |||||
557 | 519 | ||||||
Accumulated amortization on finite-lived intangible assets: | |||||||
Trade names | (78 | ) | (73 | ) | |||
Licenses | (21 | ) | (13 | ) | |||
Subscriber agreements | (49 | ) | (47 | ) | |||
Other intangible assets | (131 | ) | (126 | ) | |||
(279 | ) | (259 | ) | ||||
Finite-lived intangible assets, net | $ | 278 | $ | 260 | |||
Indefinite-lived intangible assets | 35 | 55 | |||||
Total intangibles, net | $ | 313 | $ | 315 | |||
The decline in indefinite-lived intangible assets reflects the sale of broadcast spectrum in connection with the FCC’s broadcast spectrum auction. See Note 4 for additional information.
Amortization expense relating to intangible assets was $29 million for 2017, $33 million for 2016 and $34 million for 2015. We expect our aggregate annual amortization expense for existing intangible assets subject to amortization at September 30, 2017 to be as follows for each of the next five fiscal years:
Amortization of Intangibles (in millions) | 2018 | 2019 | 2020 | 2021 | 2022 | ||||||||||||||
Amortization expense | $ | 25 | $ | 24 | $ | 25 | $ | 23 | $ | 19 | |||||||||
71
NOTE 8. DEBT
Our total debt consists of the following:
Debt (in millions) | September 30, | ||||||
2017 | 2016 | ||||||
Senior Notes and Debentures: | |||||||
Senior notes due December 2016, 2.500% | — | 400 | |||||
Senior notes due April 2017, 3.500% | — | 499 | |||||
Senior notes due October 2017, 6.125% | — | 499 | |||||
Senior notes due September 2018, 2.500% | — | 498 | |||||
Senior notes due April 2019, 2.200% | — | 399 | |||||
Senior notes due September 2019, 5.625% | 550 | 550 | |||||
Senior notes due December 2019, 2.750% | 252 | 399 | |||||
Senior notes due March 2021, 4.500% | 496 | 495 | |||||
Senior notes due December 2021, 3.875% | 595 | 593 | |||||
Senior notes due February 2022, 2.250% | 188 | — | |||||
Senior notes due June 2022, 3.125% | 297 | 296 | |||||
Senior notes due March 2023, 3.250% | 298 | 297 | |||||
Senior notes due September 2023, 4.250% | 1,237 | 1,235 | |||||
Senior notes due April 2024, 3.875% | 545 | 544 | |||||
Senior notes due October 2026, 3.450% | 587 | — | |||||
Senior debentures due December 2034, 4.850% | 585 | 593 | |||||
Senior debentures due April 2036, 6.875% | 1,067 | 1,066 | |||||
Senior debentures due October 2037, 6.750% | 75 | 75 | |||||
Senior debentures due February 2042, 4.500% | 102 | 244 | |||||
Senior debentures due March 2043, 4.375% | 1,096 | 1,091 | |||||
Senior debentures due June 2043, 4.875% | 37 | 247 | |||||
Senior debentures due September 2043, 5.850% | 1,229 | 1,228 | |||||
Senior debentures due April 2044, 5.250% | 545 | 545 | |||||
Junior Debentures: | |||||||
Junior subordinated debentures due February 2057, 5.875% | 642 | — | |||||
Junior subordinated debentures due February 2057, 6.250% | 642 | — | |||||
Capital lease and other obligations | 54 | 120 | |||||
Total debt | 11,119 | 11,913 | |||||
Less current portion | 19 | 17 | |||||
Noncurrent portion | $ | 11,100 | $ | 11,896 | |||
The amounts classified in the current portion of debt consist of the portion of capital leases payable in the next twelve months.
Notes and Debentures
In 2017, we issued $2.6 billion of junior debentures and senior notes and redeemed $3.331 billion of senior notes and debentures.
Our issuances of debt were comprised of:
• | $650 million in aggregate principal amount of fixed-to-floating rate junior subordinated debentures due 2057 at par, callable in 5 years (the “5-year Hybrid debentures”) |
• | $650 million in aggregate principal amount of fixed-to-floating rate junior subordinated debentures due 2057 at par, callable in 10 years (the “10-year Hybrid debentures” and, together with the 5-year Hybrid debentures, the “Hybrid Debentures”) |
72
• | $400 million in aggregate principal amount of 2.250% senior notes due 2022 at a price equal to 99.692% of the principal amount (the “2022 Senior Notes”) |
• | $900 million in aggregate principal amount of 3.450% senior notes due 2026 at a price equal to 99.481% of the principal amount (the “2026 Senior Notes” and, together with the 2022 Senior Notes, the “Senior Notes”) |
The 5-year Hybrid debentures accrue interest at a rate of 5.875% until February 28, 2022, on which date the rate will switch to a floating rate based on three-month LIBOR plus 3.895%, reset quarterly. The 10-year Hybrid debentures accrue interest at a rate of 6.250% until February 28, 2027, on which date the rate will switch to a floating rate based on three-month LIBOR plus 3.899%, reset quarterly. The Hybrid Debentures can be called by us at any time after the expiration of the fixed-rate period. The proceeds, net of issuance fees and expenses, from the issuance of the Hybrid Debentures and the Senior Notes were $2.569 billion.
The interest rate payable on the Senior Notes will be subject to adjustment from time to time if Moody’s Investors Services, Inc. or S&P Global Ratings downgrades (or downgrades and subsequently upgrades) the credit rating assigned to the Senior Notes. The interest rate on the Senior Notes would increase by 0.25% upon each credit agency downgrade up to a maximum of 2.00%, and would similarly be decreased for subsequent upgrades.
In 2017, we redeemed $3.331 billion of senior notes and debentures for a redemption price of $3.333 billion. As a result of the redemptions, we recognized a net pre-tax extinguishment loss of $20 million included within Other items, net in the Consolidated Statement of Earnings, which included $18 million of unamortized debt discount and issuance fees.
Our outstanding notes and debentures provide for certain covenant packages typical for an investment grade company. There is an acceleration trigger for the majority of the notes and debentures in the event of a change in control under specified circumstances coupled with ratings downgrades due to the change in control, as well as certain optional redemption provisions for our junior debentures.
At September 30, 2017 and 2016, the total unamortized discount and issuance fees and expenses related to our outstanding notes and debentures was $457 million and $459 million, respectively.
The fair value of our notes and debentures was approximately $11.6 billion and $12.8 billion as of September 30, 2017 and 2016, respectively. The valuation of our publicly traded debt is based on quoted prices in active markets.
Credit Facility
At September 30, 2017 and 2016, there were no amounts outstanding under our $2.5 billion revolving credit facility due November 2019. The credit facility is used for general corporate purposes and to support commercial paper outstanding, if any. The borrowing rate under the credit facility is LIBOR plus a margin ranging from 1.25% to 2.25% based on our current public debt rating. The credit facility has one principal financial covenant that requires our interest coverage for the most recent four consecutive fiscal quarters to be at least 3.0x, which we met as of September 30, 2017.
Commercial Paper
At September 30, 2017 and 2016, there was no commercial paper outstanding.
NOTE 9. PENSION AND OTHER POSTRETIREMENT BENEFITS
Our defined benefit pension plans principally consist of both funded and unfunded noncontributory plans covering the majority of domestic employees and retirees. The funded plan provides a defined benefit based on a percentage of eligible compensation for periods of service. The funded defined benefit pension plan and unfunded pension plans are currently frozen to future benefit accruals.
73
The following tables summarize changes in the benefit obligation, the plan assets and the funded status of our pension plans utilizing a measurement date as of September 30, 2017 and 2016, respectively:
Change in Benefit Obligation (in millions) | Year Ended September 30, | ||||||
2017 | 2016 | ||||||
Benefit obligation, beginning of period | $ | 1,014 | $ | 937 | |||
Interest cost | 33 | 35 | |||||
Actuarial (gain)/loss | (10 | ) | 86 | ||||
Benefits paid | (38 | ) | (44 | ) | |||
Benefit obligation, end of period | $ | 999 | $ | 1,014 | |||
Change in Plan Assets (in millions) | Year Ended September 30, | ||||||
2017 | 2016 | ||||||
Fair value of plan assets, beginning of period | $ | 510 | $ | 493 | |||
Actual return on plan assets | 59 | 47 | |||||
Employer contributions | 13 | 14 | |||||
Benefits paid | (38 | ) | (44 | ) | |||
Fair value of plan assets, end of period | $ | 544 | $ | 510 | |||
Funded status (in millions) | September 30, | ||||||
2017 | 2016 | ||||||
Funded status | $ | (455 | ) | $ | (504 | ) | |
Substantially all of the unfunded amounts are included within Other liabilities in the Consolidated Balance Sheets as of September 30, 2017 and 2016.
Accumulated Benefit Obligation
The accumulated benefit obligation includes no assumption about future compensation levels since our plans are frozen. Included in the change in benefit obligation tables above are the following funded and unfunded plans with an accumulated benefit obligation equal to or in excess of plan assets at the end of the fiscal year.
Funded Plans | Unfunded Plans | Total Plans | |||||||||||||||||||||
Accumulated Benefit Obligation (in millions) | September 30, | September 30, | September 30, | ||||||||||||||||||||
2017 | 2016 | 2017 | 2016 | 2017 | 2016 | ||||||||||||||||||
Accumulated benefit obligation | $ | 675 | $ | 684 | $ | 324 | $ | 330 | $ | 999 | $ | 1,014 | |||||||||||
Fair value of plan assets | 544 | 510 | — | — | 544 | 510 | |||||||||||||||||
Funded status | $ | (131 | ) | $ | (174 | ) | $ | (324 | ) | $ | (330 | ) | $ | (455 | ) | $ | (504 | ) | |||||
Net Periodic Benefit Costs
Our net periodic benefit cost under Viacom’s pension plans consists of the following:
Net Periodic Benefit Costs (in millions) | Year Ended September 30, | ||||||||||
2017 | 2016 | 2015 | |||||||||
Interest cost | $ | 33 | $ | 35 | $ | 43 | |||||
Expected return on plan assets | (37 | ) | (38 | ) | (46 | ) | |||||
Recognized actuarial loss | 7 | 5 | 8 | ||||||||
Loss on pension settlement | — | — | 24 | ||||||||
Net periodic benefit costs | $ | 3 | $ | 2 | $ | 29 | |||||
74
The items reflected in Accumulated other comprehensive loss in the Consolidated Balance Sheets and not yet recognized as a component of net periodic benefit cost are:
Unrecognized Benefit Cost (in millions) | Year Ended September 30, | ||||||
2017 | 2016 | ||||||
Unrecognized actuarial loss | $ | 324 | $ | 363 | |||
Unrecognized actuarial loss of $7 million is expected to be recognized as a component of net periodic benefit cost during the fiscal year ended September 30, 2018.
The amounts recognized in other comprehensive income during the year are:
Other Comprehensive Income (in millions) | Year Ended September 30, 2017 | |||
Net actuarial gain | $ | (32 | ) | |
Recognized actuarial loss | (7 | ) | ||
Total pre-tax gain | $ | (39 | ) | |
Year Ended September 30, | |||||
Key Assumptions | 2017 | 2016 | |||
Weighted-average assumptions - benefit obligations | |||||
Discount rate | 4.02 | % | 3.92 | % | |
Weighted-average assumptions - net periodic costs | |||||
Discount rate | 3.30 | % | 3.79 | % | |
Expected long-term return on plan assets | 7.50 | % | 7.50 | % | |
Two key assumptions used in accounting for pension liabilities and expenses are the discount rate and expected rate of return on plan assets. The discount rate reflects the estimated rate at which the pension benefit obligations could effectively be settled. We used investment grade corporate bond yields to support our discount rate assumption. Beginning in 2016, interest cost is measured by applying the specific spot rates along the yield curve to the corresponding cash flows. The expected long-term returns on plan assets were based upon the target asset allocation and return estimates for equity and debt securities. The expected rate of return for equities was based upon the risk-free rate plus a premium for equity securities. The expected return on debt securities was based upon an analysis of current and historical yields on portfolios of similar quality and duration. The estimated impact of a 25 basis point change in the discount rate would change the accumulated benefit obligation by approximately $41 million. The impact of a 25 basis point change in the expected rate of return on plan assets would change net periodic benefit cost by approximately $1 million.
Investment Policies and Strategies
The Company’s investment strategy is to manage the assets held in the funded pension plan in a prudent manner with a goal of preserving principal while providing reasonable risk appropriate returns. The investment policy establishes target asset allocations based upon an analysis of the timing and amount of projected benefit payments, the expected returns and risk of the asset classes and the correlation of those returns. Our practice is to review asset allocations regularly with our independent investment advisor and rebalance as necessary to maintain compliance with the plan’s investment policies. The ranges of target asset allocations under our investment policy are 55-75% domestic and non-U.S. equity securities, 25-40% domestic and non-U.S. debt securities and 0-10% in cash and other instruments.
The Company utilizes an investment advisor who monitors the investment policy and provides guidance on recommended investments in mutual funds and other pooled asset portfolios. Investments will be diversified within asset classes with the intent to minimize the risk of large losses to the plan.
75
The percentage of asset allocation of our funded pension plan at September 30, 2017 and 2016, by asset category was as follows:
September 30, | |||||
Asset Allocation of Funded Pension Plan | 2017 | 2016 | |||
Equity securities | 65 | % | 64 | % | |
Debt securities | 31 | 32 | |||
Cash and cash equivalents | 4 | 4 | |||
Total | 100 | % | 100 | % | |
Viacom Class B common stock represents approximately 1% and 2% of the fair value of plan assets at September 30, 2017 and 2016, respectively.
Fair Value Measurement of Plan Assets
The following table sets forth the plan’s assets at fair value as of September 30, 2017 and 2016. For investments held at the end of the reporting period that are measured at fair value on a recurring basis, there were no transfers between levels from 2016 to 2017. The funded pension plan has no investments classified within Level 3 of the valuation hierarchy.
Total | Level 1 | Level 2 | |||||||||||||||||||||
Fair Value of Plan Assets (in millions) | September 30, | September 30, | September 30, | ||||||||||||||||||||
2017 | 2016 | 2017 | 2016 | 2017 | 2016 | ||||||||||||||||||
Cash and Cash Equivalents (1) | $ | 19 | $ | 20 | $ | — | $ | — | $ | 19 | $ | 20 | |||||||||||
Equity Securities | |||||||||||||||||||||||
Common and preferred stock | 7 | 10 | 7 | 10 | — | — | |||||||||||||||||
Debt Securities | |||||||||||||||||||||||
U.S. treasury securities | 16 | 14 | — | — | 16 | 14 | |||||||||||||||||
Municipal & government issued bonds | 2 | 1 | — | — | 2 | 1 | |||||||||||||||||
Corporate bonds (2) | 41 | 40 | — | — | 41 | 40 | |||||||||||||||||
Mortgage-backed & asset-backed securities | 36 | 30 | — | — | 36 | 30 | |||||||||||||||||
Emerging markets (3) | 20 | 19 | 20 | 19 | — | — | |||||||||||||||||
Fair value of plan assets in the fair value hierarchy | 141 | 134 | 27 | 29 | 114 | 105 | |||||||||||||||||
Investments measured at net asset value (4) (5) | |||||||||||||||||||||||
Equity securities - world funds | 308 | 286 | |||||||||||||||||||||
Equity securities - emerging markets | 39 | 32 | |||||||||||||||||||||
Debt securities - multi-strategy | 56 | 58 | |||||||||||||||||||||
Total fair value of plan assets | $ | 544 | $ | 510 | |||||||||||||||||||
(1) Assets categorized as Level 2 reflect investments in money market funds.
(2) Securities of diverse industries, substantially all investment grade.
(3) Assets categorized as Level 1 reflect mutual funds.
(4) Reflects investments in common/collective trust funds and limited partnerships.
(5) As permitted under a practical expedient, the Company elected to exclude from the fair value hierarchy assets that are measured at net asset value per share. These investments have no unfunded commitments, and do not exceed quarterly redemption frequencies nor sixty day redemption notice periods.
Money market funds are carried at amortized cost which approximates fair value due to the short-term maturity of these investments. Common and preferred stocks are reported at fair value based on quoted market prices on national securities exchanges. Investments in registered investment companies (mutual funds) are stated at the respective funds’ net asset value (“NAV”), which is determined based on market values at the closing price on the last business day of the year and is a quoted price in an active market. The fair value of common/collective trust funds are based on their NAV at period-end. The fair value of U.S. Treasury securities and bonds is determined based on quoted market prices on national security exchanges, when available, or using valuation models which include certain other observable inputs including recent trading activity and broker quoted prices. Corporate bonds include securities of diverse industries, substantially all investment grade. Mortgage-backed and asset-backed securities are valued using valuation models which incorporate available dealer quotes and market information. The fair value of limited partnerships is valued at period-end based on its underlying investments.
76
Future Benefit Payments
The estimated future benefit payments for the next ten fiscal years are as follows:
Future Benefit Payments (in millions) | |||||||||||||||||||||||
2018 | 2019 | 2020 | 2021 | 2022 | 2023-2027 | ||||||||||||||||||
Pension benefits | $ | 39 | $ | 40 | $ | 43 | $ | 45 | $ | 48 | $ | 279 | |||||||||||
Postretirement Health Care and Life Insurance Plans
Eligible employees participate in Viacom-sponsored health and welfare plans that provide certain postretirement health care and life insurance benefits to retired employees and their covered dependents. Most of the health and welfare plans are contributory and contain cost-sharing features such as deductibles and coinsurance which are adjusted annually. Claims are paid either through certain trusts funded by Viacom or by our own funds. The amounts related to these plans were not material for all periods presented.
401(k) Plans
Viacom has defined contribution (401(k)) plans for the benefit of substantially all our employees meeting certain eligibility requirements. Our costs recognized for such plans were $53 million in 2017, $47 million in 2016 and $46 million in 2015.
Multiemployer Benefit Plans
We contribute to various multiemployer pension plans under the terms of collective bargaining agreements that cover its union-represented employees. The risks of participating in these multiemployer plans are different from single-employer plans such that (i) contributions made by us to these plans may be used to provide benefits to employees of other participating employers; (ii) if a participating employer stops contributing to the plan, the unfunded obligations of the plan may be borne by the remaining participating employers; and (iii) if we choose to stop participating in some of our multiemployer plans, we may be required to pay those plans an amount based on the underfunded status of the plan, referred to as a withdrawal liability.
While no multiemployer pension plan that we contributed to is considered individually significant to us, we were listed on two Form 5500s as providing more than 5% of total contributions to each plan based on current information available. The most recent filed zone status (which denotes the financial health of a plan) under the Pension Protection Act of 2006 for these two plans is green, indicating that the plans are at least 80% funded. Total contributions that we made to multiemployer pension plans were $49 million in 2017, $48 million in 2016 and $54 million in 2015.
We also contribute to various other multiemployer benefit plans that provide health and welfare benefits to active and retired participants. Total contributions that we made to these non-pension multiemployer benefit plans were $57 million in 2017, $73 million in 2016 and $77 million in 2015.
NOTE 10. REDEEMABLE NONCONTROLLING INTEREST
We are subject to a redeemable put option, payable in a foreign currency, with respect to an international subsidiary. The put option expires in December 2022 and is classified as Redeemable noncontrolling interest in the Consolidated Balance Sheets. The activity reflected within redeemable noncontrolling interest for the fiscal years 2017, 2016 and 2015 is presented below.
Redeemable Noncontrolling Interest (in millions) | Year Ended September 30, | ||||||||||
2017 | 2016 | 2015 | |||||||||
Beginning balance | $ | 211 | $ | 219 | $ | 216 | |||||
Net earnings | 17 | 17 | 15 | ||||||||
Distributions | (16 | ) | (19 | ) | (20 | ) | |||||
Translation adjustment | 7 | (38 | ) | (10 | ) | ||||||
Redemption value adjustment | 29 | 32 | 18 | ||||||||
Ending balance | $ | 248 | $ | 211 | $ | 219 | |||||
77
NOTE 11. COMMITMENTS AND CONTINGENCIES
Commitments
Our commitments under contractual obligations result from our normal course of business and represent obligations that may be payable over several years.
The following table summarizes the Company’s significant commitments and expected payments by fiscal year as of September 30, 2017:
Contractual Obligations (in millions) | Total | 2018 | 2019 | 2020 | 2021 | 2022 | Thereafter | ||||||||||||||
Off-balance Sheet Arrangements | |||||||||||||||||||||
Programming and talent commitments (1) | $ | 2,085 | $ | 659 | $ | 492 | $ | 349 | $ | 256 | $ | 160 | $ | 169 | |||||||
Operating leases (2) | 1,625 | 223 | 112 | 158 | 141 | 130 | 861 | ||||||||||||||
Purchase obligations (3) | 1,165 | 522 | 264 | 168 | 143 | 47 | 21 | ||||||||||||||
On-Balance Sheet Arrangements | |||||||||||||||||||||
Capital lease obligations (4) | $ | 59 | $ | 21 | $ | 22 | $ | 9 | $ | 6 | — | $ | 1 | ||||||||
Debt (5) | 11,522 | — | 550 | 253 | 500 | 1,090 | 9,129 | ||||||||||||||
Interest payments (6) | 10,633 | 561 | 561 | 524 | 512 | 486 | 7,989 | ||||||||||||||
Other long-term obligations (7) | 2,398 | 1,537 | 455 | 242 | 122 | 42 | — | ||||||||||||||
(1) | Programming and talent commitments include $1.731 billion relating to media networks programming and $354 million for talent contracts. |
(2) | Operating leases include long-term non-cancelable operating lease commitments for office space, equipment, transponders, studio facilities and vehicles. |
(3) | Purchase obligations include agreements to purchase goods or services that are enforceable and legally binding and that specify all significant terms, including open purchase orders. |
(4) | Capital lease obligations include capital leases for satellite transponders. |
(5) | Represents face value at maturity. |
(6) | Interest payments on our junior subordinated debentures subsequent to the expiration of their fixed-rate periods have been included based on their current fixed rates. |
(7) | Other long-term obligations principally consist of participations, residuals and programming obligations for content that is available for airing. |
Future minimum operating lease payments have been reduced by future minimum sublease income of $18 million. Future capital lease payments include $5 million of interest. Rent expense amounted to $267 million in 2017, $266 million in 2016 and $268 million in 2015.
Our collaborative arrangements principally relate to contractual arrangements with other studios to jointly finance and distribute theatrical productions (“co-financing arrangements”). A co-financing arrangement typically involves joint ownership of the film asset with each partner responsible for distribution of the film in specific territories. The partners share in the profits and losses of the film in accordance with their respective ownership interest. The amounts recorded in the Consolidated Statements of Earnings related to collaborative arrangements were not material.
Contingencies
Guarantees: In the course of our business, we both provide and receive the benefit of indemnities that are intended to allocate certain risks associated with business transactions.
Leases - We have certain indemnification obligations with respect to leases primarily associated with the previously discontinued operations of Famous Players Inc. (“Famous Players”). In addition, we have certain indemnities provided by the acquirer of Famous Players. These lease commitments amounted to approximately $194 million as of September 30, 2017. The amount of lease commitments varies over time depending on expiration or termination of individual underlying leases, or of the related indemnification obligation, and foreign exchange rates, among other things. We may also have exposure for certain other expenses related to the leases, such as property taxes and common area maintenance. We have recorded a liability of $186 million with respect to such obligations as of September 30, 2017. We believe our accrual is sufficient to meet any future obligations based on our consideration of available financial information, the lessees’ historical performance in meeting their lease obligations and the underlying economic factors impacting the lessees’ business models.
Other - We have indemnification obligations with respect to letters of credit and surety bonds primarily used as security against non-performance in the normal course of business. The outstanding letters of credit and surety bonds at September 30, 2017 were $38 million and are not recorded on our Consolidated Balance Sheet.
Legal Matters: Litigation is inherently uncertain and always difficult to predict. However, based on our understanding and evaluation of the relevant facts and circumstances, we believe that the legal matters described below and other litigation to
78
which we are a party are not likely, in the aggregate, to have a material adverse effect on our results of operations, financial position or operating cash flows.
Purported Derivative Action
On July 20, 2016, a purported derivative action was commenced in the Delaware Chancery Court by a purported Viacom stockholder against Viacom and its directors. The complaint alleged that Viacom’s directors breached their fiduciary duties to Viacom in connection with compensation paid to Mr. Redstone and that these breaches permitted a waste of corporate assets and the unjust enrichment of Mr. Redstone. On October 25, 2017, the Court granted Viacom’s motion to dismiss the action.
NOTE 12. STOCKHOLDERS’ EQUITY
Common Stock
The Viacom Board of Directors has the power to issue shares of authorized but unissued Class A common stock and Class B common stock without further stockholder action, subject to the requirements of applicable law and stock exchanges. Viacom’s certificate of incorporation authorizes 375 million shares of Class A common stock and 5 billion shares of Class B common stock. The number of authorized shares of Class A common stock and Class B common stock could be increased with the approval of the stockholders of a majority of the outstanding shares of Class A common stock and without any action by the holders of shares of Class B common stock.
The following is a description of the material terms of Viacom’s capital stock. The following description is not meant to be complete and is qualified by reference to Viacom’s certificate of incorporation and bylaws and Delaware General Corporation Law.
Voting Rights: Holders of Class A common stock are entitled to one vote per share. Holders of Class B common stock do not have any voting rights, except as required by Delaware law. Generally, all matters to be voted on by Viacom stockholders must be approved by a majority of the aggregate voting power of the shares of Class A common stock present in person or represented by proxy at a meeting of stockholders, except in certain limited circumstances and as required by Delaware law.
Dividends: Stockholders of Class A common stock and Class B common stock will share ratably in any cash dividend declared by the Board of Directors, subject to any preferential rights of any outstanding preferred stock.
Conversion: So long as there are 5,000 shares of Class A common stock outstanding, each share of Class A common stock will be convertible at the option of the holder of such share into one share of Class B common stock.
Liquidation Rights: In the event of liquidation, dissolution or winding-up of Viacom, all stockholders of common stock, regardless of class, will be entitled to share ratably in any assets available for distributions to stockholders of shares of Viacom common stock subject to the preferential rights of any outstanding preferred stock.
Split, Subdivisions or Combination: In the event of a split, subdivision or combination of the outstanding shares of Class A common stock or Class B common stock, the outstanding shares of the other class of common stock will be divided proportionally.
Preemptive Rights: Shares of Class A common stock and Class B common stock do not entitle a stockholder to any preemptive rights enabling a stockholder to subscribe for or receive shares of stock of any class or any other securities convertible into shares of stock of any class of Viacom.
Preferred Stock
Our capital stock includes 25 million authorized shares of preferred stock with a par value of $0.001 per share. At September 30, 2017 and 2016, none of the 25 million authorized shares of the preferred stock were issued and outstanding.
Stock Repurchase Program
During 2017, we did not repurchase any shares of Class B common stock. During 2016 and 2015, we repurchased 2.1 million and 21.1 million shares under the program for an aggregate price of $100 million and $1.5 billion, respectively, leaving $4.9 billion of remaining capacity under our $20.0 billion stock repurchase program.
79
Accumulated Other Comprehensive Loss
The components of Accumulated other comprehensive loss are as follows:
Accumulated Other Comprehensive Loss (in millions) | September 30, | ||||||||||
2017 | 2016 | 2015 | |||||||||
Foreign currency translation adjustments | $ | (405 | ) | $ | (435 | ) | $ | (341 | ) | ||
Defined benefit pension plans | (221 | ) | (258 | ) | (193 | ) | |||||
Cash flow hedges | 8 | 1 | — | ||||||||
Total | $ | (618 | ) | $ | (692 | ) | $ | (534 | ) | ||
NOTE 13. EQUITY-BASED COMPENSATION
Our 2016 Long-Term Management Incentive Plan, (the “LTMIP”), provides for various types of equity awards, including stock options, stock appreciation rights, restricted shares, unrestricted shares of Class B common stock, phantom shares, dividend equivalents, time-vested and performance-based share units, and other awards, or a combination of any of the above. In addition, our equity plans for outside directors provide for an annual grant of time-vested restricted share units (“RSUs”). We have primarily granted stock options and RSUs to employees. Certain senior executives have also received performance-based share units.
Stock options generally vest ratably over a four-year period from the date of grant and expire eight to ten years after the date of grant. Employee RSUs typically vest ratably over a four-year period from the date of the grant. Director RSUs typically vest one year from the date of grant. The target number of performance share units (“PSUs”) granted and currently outstanding to an executive represents the right to receive a corresponding number of shares of Class B common stock, subject to adjustment depending on the total shareholder return (“TSR”) of our Class B common stock measured against the TSR of the common stock of the companies comprising the S&P 500 Index at the start of the measurement period. The measurement period is three years. The number of shares of Class B common stock an executive is entitled to receive at the end of the applicable measurement period ranges from 0% to 200% of the target PSU award. If Viacom’s percentile rank of TSR relative to the TSR for the companies in the S&P 500 Index is less than the 25th percentile, the target grant is forfeited.
No other performance-based share units were outstanding as of September 30, 2017. Previously granted PSUs with a TSR measurement and 3 year performance period as noted above also included a performance range from 0% to 300% and a specified level of earnings per share performance measure if relative TSR was less than the 25th percentile. Additionally, previously granted performance restricted based share units were designed to vest over three or four years and deliver, at the time of vesting, 75% to 125% of the target number of shares of Class B common stock underlying the awards based on the achievement of certain financial targets.
Outstanding share units accrue dividends each time we declare a quarterly cash dividend, which are paid upon vesting on the number of shares delivered and are forfeited if the award does not vest.
Upon the exercise of a stock option award or the vesting of share units, shares of Class B common stock are issued from authorized but unissued shares or from treasury stock. At September 30, 2017, we had 393.8 million shares in treasury. The aggregate number of equity awards authorized and available under the LTMIP for future grants as of September 30, 2017 was approximately 25 million, assuming that outstanding PSU awards are paid at target except for those awards for which the measurement period has been completed.
80
Presented below is a summary of the compensation cost we recognized in the accompanying Consolidated Statements of Earnings:
Equity-Based Compensation Expense (in millions) | Year Ended September 30, | ||||||||||
2017 | 2016 | 2015 | |||||||||
Recognized in earnings: | |||||||||||
Stock options | $ | 15 | $ | 29 | $ | 33 | |||||
Share units | 39 | 66 | 68 | ||||||||
Compensation cost included in SG&A expense | 54 | 95 | 101 | ||||||||
Compensation cost included in restructuring charge* | 14 | 68 | — | ||||||||
Total compensation cost in earnings | $ | 68 | $ | 163 | $ | 101 | |||||
Tax benefit recognized | $ | 23 | $ | 58 | $ | 35 | |||||
Capitalized equity-based compensation expense | $ | 2 | $ | 4 | $ | 5 | |||||
* See Note 14 for additional information regarding the restructuring charge.
Stock Options
The fair value of each option grant is estimated on the date of grant using the Black-Scholes option-pricing model. The determination of volatility is principally based upon implied volatilities from traded options. The expected term, representing the period of time that options granted are expected to be outstanding, is estimated using a lattice-based model incorporating historical post vest exercise and employee termination behavior. The risk-free rate assumed in valuing the options is based on the U.S. Treasury Yield curve in effect applied against the expected term of the option at the time of the grant. The expected dividend yield is estimated by dividing the expected annual dividend by the market price of our common stock at the date of grant. Below are the weighted average fair value of awards granted in the periods presented and the weighted average of the applicable assumptions used to value stock options at grant date.
Year Ended September 30, | |||||||||||
Key Assumptions | 2017 | 2016 | 2015 | ||||||||
Weighted average fair value of grants | $ | 7.48 | $ | 8.65 | $ | 11.34 | |||||
Weighted average assumptions: | |||||||||||
Expected stock price volatility | 28.4 | % | 36.1 | % | 23.8 | % | |||||
Expected term of options (in years) | 4.9 | 5.4 | 4.8 | ||||||||
Risk-free interest rate | 1.9 | % | 1.5 | % | 1.6 | % | |||||
Expected dividend yield | 2.3 | % | 4.1 | % | 2.4 | % | |||||
The following table summarizes information about our stock option transactions:
Year Ended September 30, 2017 | Year Ended September 30, 2016 | Year Ended September 30, 2015 | ||||||||||||||||||
Stock Options (number of options in thousands) | Options | Weighted average exercise price | Options | Weighted average exercise price | Options | Weighted average exercise price | ||||||||||||||
Outstanding at the beginning of the period | 19,596.2 | $ | 51.54 | 17,771.3 | $ | 53.43 | 19,058.5 | $ | 47.67 | |||||||||||
Granted | 2,874.8 | 34.86 | 3,765.7 | 38.86 | 3,303.1 | 66.35 | ||||||||||||||
Exercised | (4,814.7 | ) | 35.72 | (1,242.5 | ) | 35.24 | (4,097.4 | ) | 35.53 | |||||||||||
Forfeited or expired | (2,064.8 | ) | 55.25 | (698.3 | ) | 60.26 | (492.9 | ) | 66.19 | |||||||||||
Outstanding at the end of the period | 15,591.5 | $ | 52.85 | 19,596.2 | $ | 51.54 | 17,771.3 | $ | 53.43 | |||||||||||
Exercisable at the end of the period | 9,331.8 | $ | 57.85 | 12,191.2 | $ | 49.49 | 11,109.1 | $ | 44.83 | |||||||||||
The weighted average remaining contractual life of stock options outstanding and exercisable at September 30, 2017 was 4 years and 2 years, respectively.
81
The following table summarizes information relating to stock option exercises during the periods presented:
Year Ended September 30, | |||||||||||
Stock Option Exercises (in millions) | 2017 | 2016 | 2015 | ||||||||
Proceeds from stock option exercises | $ | 172 | $ | 11 | $ | 146 | |||||
Intrinsic value | $ | 42 | $ | 7 | $ | 153 | |||||
Excess tax benefit/(shortfall) | $ | (3 | ) | $ | (3 | ) | $ | 39 | |||
Total unrecognized compensation cost related to unvested stock option awards at September 30, 2017 was approximately $33 million and is expected to be recognized on a straight-line basis over a weighted-average period of 3 years.
Share Unit Awards
The grant date fair value for the PSUs subject to the market and/or a performance condition indicated earlier in this note is computed using a Monte Carlo model to estimate the total return ranking of Viacom among the S&P 500 Index companies on the date of grant over the measurement periods. Compensation cost for PSUs is being recognized as the requisite service period is fulfilled and assumes all performance goals will be met. The grant date fair value for RSUs and other performance-based share units is based on our stock price on the date of the grant.
The following table summarizes activity relating to our share unit transactions:
Year Ended September 30, 2017 | Year Ended September 30, 2016 | Year Ended September 30, 2015 | ||||||||||||||||||
Share units (number of shares in thousands) | Number of shares | Weighted average grant date fair value | Number of shares | Weighted average grant date fair value | Number of shares | Weighted average grant date fair value | ||||||||||||||
Unvested at the beginning of the period | 2,507.6 | $ | 58.05 | 2,645.1 | $ | 75.68 | 3,138.3 | $ | 67.35 | |||||||||||
Granted* | 1,550.5 | 34.86 | 1,701.1 | 44.75 | 1,430.2 | 71.22 | ||||||||||||||
Vested | (941.2 | ) | 55.84 | (1,144.8 | ) | 63.83 | (1,644.8 | ) | 57.18 | |||||||||||
Forfeited | (563.7 | ) | 76.53 | (693.8 | ) | 83.12 | (278.6 | ) | 68.17 | |||||||||||
Unvested at the end of the period | 2,553.2 | $ | 40.71 | 2,507.6 | $ | 58.05 | 2,645.1 | $ | 75.68 | |||||||||||
* Grant activity includes 0.1 million, 0.4 million and 0.4 million of performance-based share units at target for 2017, 2016 and 2015, respectively.
The total weighted average remaining contractual life and aggregate intrinsic value of unvested share units at September 30, 2017 was 2 years and $71 million, respectively.
The fair value of share units vested was $33 million in 2017, $46 million in 2016 and $110 million in 2015. Total unrecognized compensation cost related to these awards at September 30, 2017 was approximately $86 million and is expected to be recognized over a weighted-average period of 3 years.
NOTE 14. RESTRUCTURING AND PROGRAMMING CHARGES
In fiscal year 2017, following significant changes in our senior leadership and a comprehensive review of our operations and performance, we began to execute against a new business strategy that includes, among other things, the designation of six brands - Nickelodeon, Nick Jr., MTV, BET, Comedy Central and Paramount - as our highest priority, “flagship” brands. We recognized a pre-tax restructuring and programming charge of $381 million in the year ended September 30, 2017, resulting from the execution of our flagship brand strategy and strategic initiatives at Paramount. The charges, as detailed in the table below, include severance charges, a non-cash intangible asset impairment charge resulting from the decision to abandon an international trade name and a programming charge associated with management’s decision to cease use of certain original and acquired programming. The programming charge is included within Operating expenses in the Consolidated Statement of Earnings.
82
The following table presents the restructuring and programming charges incurred in 2017 by reportable segment:
Restructuring and Programming Charges (in millions) | Year Ended September 30, 2017 | ||||||||||||||
Media Networks | Filmed Entertainment | Corporate | Total | ||||||||||||
Severance (1) | $ | 142 | $ | 50 | $ | 20 | $ | 212 | |||||||
Asset impairment | 22 | — | — | 22 | |||||||||||
Lease termination | — | 3 | — | 3 | |||||||||||
Restructuring | 164 | 53 | 20 | 237 | |||||||||||
Programming | 113 | 31 | — | 144 | |||||||||||
Total | $ | 277 | $ | 84 | $ | 20 | $ | 381 | |||||||
(1) Includes equity-based compensation expense of $14 million.
In 2016, we recognized a restructuring charge of $206 million in connection with the separation of certain senior executives. The restructuring charge includes the cost of separation payments of $138 million and the acceleration of equity-based compensation expense of $68 million. We established grantor trusts in our name and initially funded the trusts with approximately $69 million to facilitate the administration of certain payments, $54 million of which has been paid as of September 30, 2017. The assets held in the grantor trusts are Company assets and are therefore included in our Consolidated Balance Sheets within Prepaid and other assets and Other assets - noncurrent as of September 30, 2017 and 2016.
In 2015, we recognized a charge consisting of $578 million of programming charges and a $206 million restructuring charge associated with workforce reductions. The programming charges are included within Operating expenses in the Consolidated Statement of Earnings. These charges were recognized in connection with a company-wide review across our worldwide Media Networks, Filmed Entertainment operations and corporate functions. The company-wide review resulted in the implementation of significant strategic and operational improvements aimed at addressing the ratings challenges experienced by our networks and enhancing the effectiveness and efficiency of our operations, including a programming strategy that shifted focus away from repeated acquired programming and toward fresher, first-run original programming specifically targeted to appeal to our youth and family-oriented demographics. As a result of the review, we reorganized our operating segments and the newly structured operating segment management performed a comprehensive strategic review of existing programming, resulting in the identification of programming not aligned with the Company’s new strategy. Decisions were made to cease airing certain programs, alter future airing patterns of certain other programs and move some programming to secondary networks that would not generate sufficient revenues to support their carrying value.
Our severance liability by reportable segment is as follows:
Severance liability (in millions) | Media Networks | Filmed Entertainment | Corporate | Total | ||||||||||||
September 30, 2016 | $ | 36 | $ | 12 | $ | 94 | $ | 142 | ||||||||
Accruals | 136 | 47 | 15 | 198 | ||||||||||||
Severance payments | (53 | ) | (14 | ) | (65 | ) | (132 | ) | ||||||||
September 30, 2017 | $ | 119 | $ | 45 | $ | 44 | $ | 208 | ||||||||
As of September 30, 2017, of the remaining $208 million liability, $132 million is classified as a current liability in the Consolidated Balance Sheet, with the remaining $76 million classified as a noncurrent liability. Amounts classified as noncurrent are expected to be paid through 2020, in accordance with applicable contractual terms.
83
NOTE 15. INCOME TAXES
Earnings from continuing operations before provision for income taxes consist of the following:
Earnings from Continuing Operations before Provision for Income Taxes (in millions) | Year Ended September 30, | ||||||||||
2017 | 2016 | 2015 | |||||||||
United States | $ | 1,647 | $ | 1,479 | $ | 2,047 | |||||
International | 565 | 511 | 456 | ||||||||
Pre-tax earnings from continuing operations | $ | 2,212 | $ | 1,990 | $ | 2,503 | |||||
The provision for income taxes from continuing operations consists of the following:
Provision for Income Taxes from Continuing Operations (in millions) | Year Ended September 30, | ||||||||||
2017 | 2016 | 2015 | |||||||||
Current provision for income taxes: | |||||||||||
Federal | $ | 312 | $ | 112 | $ | 404 | |||||
State and local | 43 | 31 | 65 | ||||||||
International | 112 | 122 | 114 | ||||||||
Total current provision for income taxes | 467 | 265 | 583 | ||||||||
Deferred provision for income taxes | (174 | ) | 254 | (82 | ) | ||||||
Provision for income taxes | $ | 293 | $ | 519 | $ | 501 | |||||
A reconciliation of the effective income tax rate on continuing operations to the U.S. federal statutory income tax rate is as follows:
Year Ended September 30, | ||||||||
Effective Tax Rate | 2017 | 2016 | 2015 | |||||
U.S. federal statutory income tax rate | 35.0 | % | 35.0 | % | 35.0 | % | ||
State and local taxes, net of federal benefit | 1.4 | 1.7 | 1.8 | |||||
Effect of international operations | (5.5 | ) | (4.4 | ) | (2.9 | ) | ||
Qualified production activities deduction | (3.0 | ) | (1.0 | ) | (3.0 | ) | ||
Change in valuation allowance | (1.4 | ) | (1.1 | ) | (2.7 | ) | ||
Tax accounting method change | — | (2.7 | ) | — | ||||
Foreign tax credits of repatriated non-U.S. earnings | — | (0.4 | ) | (7.4 | ) | |||
Foreign tax credits on distribution of securities | (12.6 | ) | — | — | ||||
All other, net | (0.7 | ) | (1.0 | ) | (0.8 | ) | ||
Effective tax rate, continuing operations | 13.2 | % | 26.1 | % | 20.0 | % | ||
We recognized a net discrete tax benefit of $340 million in 2017, $102 million in 2016 and $258 million in 2015, which served to reduce the provision for income taxes for those periods. The benefit in 2017 is principally related to the recognition of foreign tax credits realized during the fourth fiscal quarter of 2017 on the distribution to Viacom’s U.S. group of certain securities, the reversal of a valuation allowance on capital loss carryforwards in connection with the sale of our investment in EPIX and the release of tax reserves with respect to certain effectively settled tax positions. Total discrete tax benefits also include the impact of the gains on asset sales, restructuring and programming charges, the net loss on debt extinguishment and investment impairment.
The benefit in 2016 was principally related to a tax accounting method change granted by the Internal Revenue Service (“IRS”), the release of tax reserves with respect to certain effectively settled tax positions and the recognition of capital loss carryforwards, partially offset by a reduction in qualified production activity tax benefits as a result of retroactively reenacted legislation.
During 2015, we reorganized certain non-U.S. subsidiaries in order to facilitate a more efficient movement of non-U.S. cash and to support the expansion of key areas for growth internationally. The benefit in 2015 was principally related to excess foreign tax credits attributable to a taxable repatriation of non-U.S. earnings from reorganized entities and the release of tax reserves with respect to certain effectively settled tax positions.
84
The tax effects of the items recorded as deferred tax assets and liabilities are:
Deferred Taxes (in millions) | September 30, | ||||||
2017 | 2016 | ||||||
Deferred tax assets: | |||||||
Accrued liabilities | $ | 205 | $ | 193 | |||
Postretirement and other employee benefits | 348 | 452 | |||||
Tax credit and loss carryforwards | 259 | 223 | |||||
All other | 124 | 184 | |||||
Total deferred tax assets | 936 | 1,052 | |||||
Valuation allowance | (156 | ) | (195 | ) | |||
Total deferred tax assets, net | $ | 780 | $ | 857 | |||
Deferred tax liabilities: | |||||||
Property, equipment and intangible assets | $ | (619 | ) | $ | (525 | ) | |
Unbilled revenue | (117 | ) | (127 | ) | |||
Financing obligations | (113 | ) | (114 | ) | |||
Film & TV production expenditures | (185 | ) | (429 | ) | |||
Total deferred tax liabilities | (1,034 | ) | (1,195 | ) | |||
Deferred taxes, net | $ | (254 | ) | $ | (338 | ) | |
We have recorded valuation allowances for certain deferred tax assets, which are primarily related to net operating losses in foreign jurisdictions, as sufficient uncertainty exists regarding the future realization of these assets.
We have $120 million of U.S. foreign tax credit carryforwards at September 30, 2017. The utilization of these carryforwards as an available offset to future tax is subject to limitations under current U.S. federal income tax laws. These carryforwards begin to expire in fiscal year 2027. In addition, we have $267 million of tax losses in various international jurisdictions that are primarily from countries with unlimited carry forward periods and $431 million of tax losses that expire in the fiscal years 2018 through 2037. The pre-valuation allowance deferred tax asset amount related to these U.S. and international carryforwards is $259 million.
The net deferred tax assets and deferred tax liabilities included in the Consolidated Balance Sheets were as follows:
Deferred Tax Assets / (Liabilities) (in millions) | September 30, | |||||||
2017 | 2016 | |||||||
Deferred tax assets | $ | 40 | $ | 43 | ||||
Deferred tax liabilities | (294 | ) | (381 | ) | ||||
Deferred taxes, net | $ | (254 | ) | $ | (338 | ) | ||
Deferred tax assets are included within Other assets in the Consolidated Balance Sheets.
As of September 30, 2017, we have not made any provision for U.S. income taxes on approximately $827 million of unremitted earnings of our international subsidiaries since these earnings are indefinitely reinvested outside the U.S. If these earnings were to be remitted in the future, the related U.S. income tax liability may be reduced by any foreign income taxes previously paid on these earnings. Under current U.S. tax laws, repatriating unremitted earnings could result in incremental taxes of 15% -20% on the repatriated earnings depending on the territory. To the extent that any tax reform legislation were to lower the U.S. federal statutory income tax rate from its current 35%, there could be a corresponding reduction in the estimate of incremental taxes that would result from repatriating unremitted earnings.
85
A reconciliation of the beginning and ending amounts of unrecognized tax benefits, excluding interest and penalties, is as follows:
Unrecognized Tax Benefits (in millions) | Year Ended September 30, | ||||||||||
2017 | 2016 | 2015 | |||||||||
Balance at beginning of the period | $ | 164 | $ | 179 | $ | 185 | |||||
Gross additions based on tax positions related to the current year | 36 | 21 | 60 | ||||||||
Gross additions for tax positions of prior years | 6 | 13 | 8 | ||||||||
Gross reductions for tax positions of prior years | (14 | ) | (23 | ) | (63 | ) | |||||
Settlements | (8 | ) | (1 | ) | (1 | ) | |||||
Expiration of the statute of limitation | (25 | ) | (25 | ) | (10 | ) | |||||
Balance at end of the period | $ | 159 | $ | 164 | $ | 179 | |||||
The total amount of unrecognized tax benefits at September 30, 2017, if recognized, would favorably affect the effective tax rate.
As discussed in Note 2, we recognize interest and penalties accrued related to unrecognized tax benefits as a component of the Provision for income taxes in the Consolidated Statements of Earnings. We recognized interest and penalties of $9 million in 2017, $11 million in 2016 and $8 million in 2015. We had accruals of $34 million and $37 million related to interest and penalties recorded as a component of Other liabilities – noncurrent in the Consolidated Balance Sheets at September 30, 2017 and 2016, respectively.
We and our subsidiaries file income tax returns with the IRS and various state and international jurisdictions. The IRS began its examination of our 2014 and 2015 U.S. consolidated federal income tax returns in fiscal 2017. Tax authorities are also conducting examinations of Viacom subsidiaries in various international and state and local jurisdictions. Due to potential resolution of unrecognized tax positions involving multiple tax periods and jurisdictions, it is reasonably possible that a reduction of up to $60 million of unrecognized income tax benefits may occur within 12 months, some of which, depending on the nature of the settlement, may affect our income tax provision and therefore benefit the resulting effective tax rate. The majority of these uncertain tax positions, when recognized in the financial statements, would be recorded in the Consolidated Statements of Earnings as part of the Provision for income taxes. The actual amount could vary significantly depending on the ultimate timing and nature of any settlements.
NOTE 16. EARNINGS PER SHARE
The following table sets forth the weighted average number of common shares outstanding used in determining basic and diluted earnings per common share and anti-dilutive shares:
Weighted Average Number of Common Shares Outstanding and Anti-Dilutive Common Shares (in millions) | Year Ended September 30, | |||||||
2017 | 2016 | 2015 | ||||||
Weighted average number of common shares outstanding, basic | 399.9 | 396.5 | 402.2 | |||||
Dilutive effect of equity awards | 0.7 | 1.5 | 3.8 | |||||
Weighted average number of common shares outstanding, diluted | 400.6 | 398.0 | 406.0 | |||||
Anti-dilutive common shares | 15.2 | 14.7 | 6.9 | |||||
NOTE 17. SUPPLEMENTAL CASH FLOW
Our supplemental cash flow information is as follows:
Supplemental Cash Flow Information (in millions) | Year Ended September 30, | ||||||||||
2017 | 2016 | 2015 | |||||||||
Cash paid for interest | $ | 635 | $ | 611 | $ | 636 | |||||
Cash paid for income taxes | $ | 476 | $ | 275 | $ | 566 | |||||
86
NOTE 18. FAIR VALUE MEASUREMENTS
Assets/Liabilities Measured and Recorded at Fair Value on a Recurring Basis
In the second fiscal quarter of 2017, we sold our investments in marketable securities. The fair value of the marketable securities was $114 million at September 30, 2016, as determined utilizing a market approach based on quoted market prices in active markets at period end (Level 1 in the fair value hierarchy). Prior to the sale, these investments were included within Prepaid and other assets in the Consolidated Balance Sheets.
The fair value of our foreign exchange contracts was an asset of $7 million and a liability of $13 million as of September 30, 2017 and 2016, respectively, as determined utilizing a market-based approach (Level 2 in the fair value hierarchy). We use derivative financial instruments to modify our exposure to market risks from changes in foreign exchange rates and interest rates. We conduct business in various countries outside the U.S., resulting in exposure to movements in foreign exchange rates when translating from the foreign local currency to the U.S. Dollar. We use foreign currency forward contracts to economically hedge anticipated cash flows and foreign currency balances in such currencies as the British Pound, the Euro, the Brazilian Real, the Japanese Yen, the Australian Dollar and the Canadian Dollar. We also enter into forward contracts to hedge future production costs and programming obligations. We manage the use of foreign exchange derivatives centrally.
At September 30, 2017 and 2016, the notional value of all foreign exchange contracts was $869 million and $1.149 billion, respectively. At September 30, 2017, $287 million related to our foreign currency balances and $582 million related to future production costs. At September 30, 2016, $874 million related to our foreign currency balances and $275 million related to future production costs.
Assets Measured and Recorded at Fair Value on a Non-Recurring Basis
Certain assets, such as film and television production costs, goodwill, intangible assets, and equity and cost method investments, are recorded at fair value only if an impairment charge is recognized. Impairment charges, if applicable, are determined using discounted cash flows, which is a Level 3 valuation technique.
NOTE 19. REPORTABLE SEGMENTS
The following tables set forth our financial performance by reportable segment. Our reportable segments have been determined in accordance with our internal management structure. We manage our operations through two reportable segments: (i) Media Networks and (ii) Filmed Entertainment. Typical intersegment transactions include the purchase of advertising by the Filmed Entertainment segment on Media Networks’ properties and the licensing of Filmed Entertainment’s feature film and television content by Media Networks. The elimination of such intercompany transactions in the Consolidated Financial Statements is included within eliminations in the tables below.
Our measure of segment performance is adjusted operating income. Adjusted operating income is defined as operating income, before equity-based compensation and certain other items identified as affecting comparability, when applicable.
Revenues by Segment (in millions) | Year Ended September 30, | ||||||||||
2017 | 2016 | 2015 | |||||||||
Media Networks | $ | 10,096 | $ | 9,942 | $ | 10,490 | |||||
Filmed Entertainment | 3,289 | 2,662 | 2,883 | ||||||||
Eliminations | (122 | ) | (116 | ) | (105 | ) | |||||
Total revenues | $ | 13,263 | $ | 12,488 | $ | 13,268 | |||||
87
Adjusted Operating Income/(Loss) (in millions) | Year Ended September 30, | ||||||||||
2017 | 2016 | 2015 | |||||||||
Media Networks | $ | 3,297 | $ | 3,484 | $ | 4,143 | |||||
Filmed Entertainment | (280 | ) | (445 | ) | 111 | ||||||
Corporate expenses | (221 | ) | (213 | ) | (235 | ) | |||||
Eliminations | 1 | 1 | 2 | ||||||||
Equity-based compensation | (54 | ) | (95 | ) | (101 | ) | |||||
Restructuring and programming charges | (381 | ) | (206 | ) | (784 | ) | |||||
Gain on asset sale | 127 | — | — | ||||||||
Loss on pension settlement | — | — | (24 | ) | |||||||
Operating income | 2,489 | 2,526 | 3,112 | ||||||||
Interest expense, net | (618 | ) | (616 | ) | (657 | ) | |||||
Equity in net earnings of investee companies | 81 | 87 | 102 | ||||||||
Gain on sale of EPIX | 285 | — | — | ||||||||
Other items, net | (25 | ) | (7 | ) | (54 | ) | |||||
Earnings from continuing operations before provision for income taxes | $ | 2,212 | $ | 1,990 | $ | 2,503 | |||||
Depreciation and Amortization | Total Assets | ||||||||||||||||||
Depreciation and Amortization and Total Assets (in millions) | Year Ended September 30, | September 30, | |||||||||||||||||
2017 | 2016 | 2015 | 2017 | 2016 | |||||||||||||||
Media Networks | $ | 175 | $ | 166 | $ | 162 | $ | 17,984 | $ | 16,410 | |||||||||
Filmed Entertainment | 44 | 50 | 53 | 6,188 | 6,391 | ||||||||||||||
Corporate/Eliminations | 4 | 5 | 7 | (474 | ) | (293 | ) | ||||||||||||
Total | $ | 223 | $ | 221 | $ | 222 | $ | 23,698 | $ | 22,508 | |||||||||
Capital Expenditures (in millions) | Year Ended September 30, | ||||||||||
2017 | 2016 | 2015 | |||||||||
Media Networks | $ | 164 | $ | 141 | $ | 115 | |||||
Filmed Entertainment | 27 | 28 | 22 | ||||||||
Corporate | 4 | 3 | 5 | ||||||||
Total capital expenditures | $ | 195 | $ | 172 | $ | 142 | |||||
Revenues by Component (in millions) | Year Ended September 30, | ||||||||||
2017 | 2016 | 2015 | |||||||||
Advertising | $ | 4,862 | $ | 4,809 | $ | 5,007 | |||||
Affiliate | 4,638 | 4,556 | 4,908 | ||||||||
Feature film | 2,972 | 2,488 | 2,692 | ||||||||
Ancillary | 913 | 751 | 766 | ||||||||
Eliminations | (122 | ) | (116 | ) | (105 | ) | |||||
Total revenues | $ | 13,263 | $ | 12,488 | $ | 13,268 | |||||
Revenues generated from international markets were approximately 28%, 25% and 25% of total consolidated revenues in 2017, 2016 and 2015, respectively. Our principal international businesses are in Europe. The United Kingdom and Germany together accounted for approximately 51%, 57% and 55% of total revenues in the Europe, Middle East and Africa (“EMEA”) region in 2017, 2016 and 2015, respectively.
88
Revenues* | Long-lived Assets** | ||||||||||||||||||
Geographic Information (in millions) | Year Ended September 30, | September 30, | |||||||||||||||||
2017 | 2016 | 2015 | 2017 | 2016 | |||||||||||||||
United States | $ | 9,497 | $ | 9,308 | $ | 9,928 | $ | 5,049 | $ | 5,180 | |||||||||
EMEA | 2,260 | 2,182 | 2,193 | 317 | 348 | ||||||||||||||
All other | 1,506 | 998 | 1,147 | 157 | 62 | ||||||||||||||
Total | $ | 13,263 | $ | 12,488 | $ | 13,268 | $ | 5,523 | $ | 5,590 | |||||||||
*Revenue classifications are based on customers’ locations. Transactions within Viacom between geographic areas are not significant.
**Excludes deferred tax assets, goodwill, other intangible assets and investments.
NOTE 20. RELATED PARTY TRANSACTIONS
National Amusements, Inc. (“National Amusements”), directly and indirectly, is the controlling stockholder of both Viacom and CBS Corporation (“CBS”). National Amusements owns shares in Viacom representing approximately 79.8% of the voting interest in Viacom and approximately 10% of Viacom’s combined common stock. National Amusements is controlled by Sumner M. Redstone, our Chairman Emeritus, who is the Chairman and Chief Executive Officer of National Amusements, through the Sumner M. Redstone National Amusements Trust (the “SMR Trust”), which owns shares in National Amusements representing 80% of the voting interest of National Amusements. The shares representing the other 20% of the voting interest of National Amusements are held through a trust controlled by Shari E. Redstone, who is Mr. Redstone’s daughter and the non-executive Vice Chair of Viacom’s Board of Directors and the President and a member of the Board of Directors of National Amusements. The shares of National Amusements held by the SMR Trust are voted solely by Mr. Redstone until such time as his incapacity or death. Upon Mr. Redstone’s incapacity or death, (1) Ms. Redstone will also become a trustee of the SMR Trust and (2) the shares of National Amusements held by the SMR Trust will be voted by the trustees of the SMR Trust. The current trustees include Mr. Redstone and David R. Andelman, a member of the boards of directors of National Amusements and CBS. The current Board of Directors of National Amusements includes Mr. Redstone, Ms. Redstone and Mr. Andelman. In addition, Mr. Redstone serves as Chairman Emeritus of CBS and Ms. Redstone serves as non-executive Vice Chair of CBS.
Transactions between Viacom and related parties are overseen by our Governance and Nominating Committee.
Viacom and National Amusements Related Party Transactions
National Amusements licenses films in the ordinary course of business for its motion picture theaters from all major studios, including Paramount. During the years ended September 30, 2017, 2016 and 2015, Paramount earned revenues from National Amusements in connection with these licenses in the aggregate amounts of approximately $7 million, $8 million and $10 million, respectively.
Viacom and CBS Corporation Related Party Transactions
In the ordinary course of business, we are involved in transactions with CBS and its various businesses that result in the recognition of revenues and expenses by us. Transactions with CBS are settled in cash.
Our Filmed Entertainment segment earns revenues and recognizes expenses associated with its distribution of certain television products into the home entertainment market on behalf of CBS. Pursuant to its agreement with CBS, Paramount distributes CBS’s library of television and other content on DVD and Blu-ray disc on a worldwide basis. Under the terms of the agreement, Paramount is entitled to retain a fee based on a percentage of gross receipts and is generally responsible for all out-of-pocket costs, which are recoupable prior to any participation amounts paid. Paramount also earns revenues from CBS through leasing of studio space and licensing of certain film products.
Our Media Networks segment recognizes advertising revenues and purchases television programming from CBS. The cost of the programming purchases is initially recorded as acquired program rights inventory and amortized over the estimated period that revenues will be generated.
Both of our segments recognize advertising expenses related to the placement of advertisements with CBS.
89
The following table summarizes the transactions with CBS as included in our Consolidated Financial Statements:
CBS Related Party Transactions (in millions) | Year Ended September 30, | ||||||||||
2017 | 2016 | 2015 | |||||||||
Consolidated Statements of Earnings | |||||||||||
Revenues | $ | 138 | $ | 133 | $ | 169 | |||||
Operating expenses | $ | 174 | $ | 174 | $ | 284 | |||||
September 30, | |||||||||||
2017 | 2016 | ||||||||||
Consolidated Balance Sheets | |||||||||||
Accounts receivable | $ | 5 | $ | 3 | |||||||
Participants’ share and residuals, current | $ | 69 | $ | 66 | |||||||
Program obligations, current | 54 | 61 | |||||||||
Program obligations, noncurrent | 49 | 32 | |||||||||
Other liabilities | 1 | 2 | |||||||||
Total due to CBS | $ | 173 | $ | 161 | |||||||
Other Related Party Transactions
In the ordinary course of business, we are involved in related party transactions with equity investees. These related party transactions primarily relate to the provision of advertising services, licensing of film and programming content, distribution of films and provision of certain administrative support services, for which the impact on our Consolidated Financial Statements is as follows:
Other Related Party Transactions (in millions) | Year Ended September 30, | ||||||||||
2017 | 2016 | 2015 | |||||||||
Consolidated Statements of Earnings | |||||||||||
Revenues | $ | 131 | $ | 125 | $ | 174 | |||||
Operating expenses | $ | 67 | $ | 72 | $ | 61 | |||||
Selling, general and administrative | $ | (7 | ) | $ | (15 | ) | $ | (15 | ) | ||
September 30, | |||||||||||
2017 | 2016 | ||||||||||
Consolidated Balance Sheets | |||||||||||
Accounts receivable | $ | 49 | $ | 67 | |||||||
Other assets | 5 | 1 | |||||||||
Total due from other related parties | $ | 54 | $ | 68 | |||||||
Accounts payable | $ | 8 | $ | 8 | |||||||
Other liabilities | — | 69 | |||||||||
Total due to other related parties | $ | 8 | $ | 77 | |||||||
All other related party transactions are not material in the periods presented.
90
NOTE 21. QUARTERLY FINANCIAL DATA (unaudited):
2017 (in millions, except per share information) | First | Second | Third | Fourth | Year Ended September 30, 2017 | ||||||||||||||
Revenues | $ | 3,324 | $ | 3,256 | $ | 3,364 | $ | 3,319 | $ | 13,263 | |||||||||
Operating income | $ | 706 | $ | 332 | $ | 746 | $ | 705 | $ | 2,489 | |||||||||
Net earnings from continuing operations (Viacom and noncontrolling interests) | $ | 408 | $ | 128 | $ | 688 | $ | 695 | $ | 1,919 | |||||||||
Net earnings (Viacom and noncontrolling interests) | $ | 408 | $ | 128 | $ | 691 | $ | 695 | $ | 1,922 | |||||||||
Net earnings from continuing operations attributable to Viacom | $ | 396 | $ | 121 | $ | 680 | $ | 674 | $ | 1,871 | |||||||||
Net earnings attributable to Viacom | $ | 396 | $ | 121 | $ | 683 | $ | 674 | $ | 1,874 | |||||||||
Basic earnings per share, continuing operations attributable to Viacom | $ | 1.00 | $ | 0.30 | $ | 1.69 | $ | 1.67 | $ | 4.68 | |||||||||
Basic earnings per share attributable to Viacom | $ | 1.00 | $ | 0.30 | $ | 1.70 | $ | 1.67 | $ | 4.69 | |||||||||
Diluted earnings per share, continuing operations attributable to Viacom | $ | 1.00 | $ | 0.30 | $ | 1.69 | $ | 1.67 | $ | 4.67 | |||||||||
Diluted earnings per share attributable to Viacom | $ | 1.00 | $ | 0.30 | $ | 1.70 | $ | 1.67 | $ | 4.68 | |||||||||
The following are certain items identified as affecting comparability in 2017:
• | Restructuring and programming charges resulting from the execution of our flagship brand strategy and strategic initiatives at Paramount: |
◦ | A pre-tax charge of $42 million ($28 million after tax) for severance in the first quarter. |
◦ | A pre-tax charge of $280 million ($180 million after tax), reflecting $156 million of severance, $18 million of intangible asset impairment and $106 million of programming charges in the second quarter. |
◦ | A pre-tax charge of $59 million ($38 million after tax), reflecting $14 million of severance, $38 million of programming charges and $7 million of other exit activities in the third quarter. |
• | Items resulting from the retirement of debt: |
◦ | A pre-tax debt extinguishment loss of $6 million ($4 million after tax) and $30 million ($20 million after tax) in the first and second quarters, respectively. |
◦ | A pre-tax gain on extinguishment of debt of $16 million ($11 million after tax) in the third quarter. |
• | A pre-tax gain of $285 million ($189 million after tax) resulting from the sale of our investment in EPIX in the third quarter. |
• | A pre-tax charge of $10 million ($6 million after tax) in connection with the write-down of a cost method investment in the third quarter. |
• | A pre-tax gain of $127 million ($96 million after tax and noncontrolling interest’s share of gain) resulting from the sale of broadcast spectrum in the fourth quarter. |
• | A net discrete tax benefit of $15 million, $4 million, $53 million and $268 million in the first through fourth quarters, respectively. |
91
2016 (in millions, except per share information) | First | Second | Third | Fourth | Year Ended September 30, 2016 | ||||||||||||||
Revenues | $ | 3,154 | $ | 3,001 | $ | 3,107 | $ | 3,226 | $ | 12,488 | |||||||||
Operating income | $ | 839 | $ | 586 | $ | 769 | $ | 332 | $ | 2,526 | |||||||||
Net earnings from continuing operations (Viacom and noncontrolling interests) | $ | 461 | $ | 309 | $ | 440 | $ | 261 | $ | 1,471 | |||||||||
Net earnings (Viacom and noncontrolling interests) | $ | 461 | $ | 309 | $ | 440 | $ | 263 | $ | 1,473 | |||||||||
Net earnings from continuing operations attributable to Viacom | $ | 449 | $ | 303 | $ | 432 | $ | 252 | $ | 1,436 | |||||||||
Net earnings attributable to Viacom | $ | 449 | $ | 303 | $ | 432 | $ | 254 | $ | 1,438 | |||||||||
Basic earnings per share, continuing operations attributable to Viacom | $ | 1.13 | $ | 0.76 | $ | 1.09 | $ | 0.63 | $ | 3.62 | |||||||||
Basic earnings per share attributable to Viacom | $ | 1.13 | $ | 0.76 | $ | 1.09 | $ | 0.64 | $ | 3.63 | |||||||||
Diluted earnings per share, continuing operations attributable to Viacom | $ | 1.13 | $ | 0.76 | $ | 1.09 | $ | 0.63 | $ | 3.61 | |||||||||
Diluted earnings per share attributable to Viacom | $ | 1.13 | $ | 0.76 | $ | 1.09 | $ | 0.64 | $ | 3.61 | |||||||||
The following are certain items identified as affecting comparability in 2016:
• | A pre-tax restructuring charge of $206 million ($131 million after tax) in the fourth quarter in connection with the separation of certain senior executives. |
• | A net discrete tax expense of $21 million in the first quarter and a net discrete tax benefit of $13 million in the third quarter and $110 million in the fourth quarter. |
92
Item 9. Changes in and Disagreements with Accountants on Accounting and Financial Disclosure.
None.
Item 9A. Controls and Procedures.
Evaluation of Disclosure Controls and Procedures
We maintain “disclosure controls and procedures,” as such term is defined in Rules 13a-15(e) and 15d-15(e) under the Securities Exchange Act of 1934 (the “Exchange Act”), that are designed to ensure that information required to be disclosed by us in reports that we file or submit under the Exchange Act is recorded, processed, summarized, and reported within the time periods specified in SEC rules and forms, and that such information is accumulated and communicated to our management, including our Chief Executive Officer and Chief Financial Officer, as appropriate, to allow timely decisions regarding required disclosure. In designing and evaluating our disclosure controls and procedures, management recognized that disclosure controls and procedures, no matter how well conceived and operated, can provide only reasonable, not absolute, assurance that the objectives of the disclosure controls and procedures are met. Additionally, in designing disclosure controls and procedures, our management necessarily was required to apply its judgment in evaluating the cost-benefit relationship of possible disclosure controls and procedures. The design of any disclosure controls and procedures also is based in part upon certain assumptions about the likelihood of future events, and there can be no assurance that any design will succeed in achieving its stated goals under all potential future conditions.
Our management, with the participation of our Chief Executive Officer and Chief Financial Officer, has evaluated the effectiveness of the design and operation of our disclosure controls and procedures as of September 30, 2017. Based on that evaluation, management has concluded that, as of such date, our disclosure controls and procedures were effective.
Management’s Report on Internal Control over Financial Reporting
Management’s Report on Internal Control over Financial Reporting is set forth on page 56.
Audit Opinion on Internal Control over Financial Reporting
The effectiveness of the Company’s internal control over financial reporting has been audited by PricewaterhouseCoopers, LLP an independent registered public accounting firm, as stated in their report, which is included herein on page 57.
Changes in Internal Control Over Financial Reporting
There were no changes in our internal control over financial reporting during the quarter ended September 30, 2017 that have materially affected, or are reasonably likely to materially affect, our internal control over financial reporting.
Item 9B. Other Information.
None.
PART III
Item 10. Directors, Executive Officers and Corporate Governance.
The information required by this item with respect to our directors and certain corporate governance practices will be contained in our Proxy Statement for our 2018 Annual Meeting of Stockholders (the “Proxy Statement”) under the headings “Corporate Governance,” “Our Board of Directors,” “Item 1 – Election of Directors” and “Section 16(a) Beneficial Ownership Reporting Compliance,” which information is incorporated herein by reference. The information required by this item with respect to our executive officers (i) will be contained in the Proxy Statement under the headings “Corporate Governance” and “Section 16(a) Beneficial Ownership Reporting Compliance” and (ii) is included in Part I of this Form 10-K under the caption “Our Executive Officers,” which information is incorporated herein by reference.
Item 11. Executive Compensation.
The information required by this item will be contained in the Proxy Statement under the headings “Executive Compensation,” “Compensation Committee Interlocks and Insider Participation” and “Compensation Committee Report,” which information is incorporated herein by reference.
93
Item 12. Security Ownership of Certain Beneficial Owners and Management and Related Stockholder Matters.
The information required by this item will be contained in the Proxy Statement under the headings “Equity Compensation Plan Information” and “Security Ownership of Certain Beneficial Owners and Management,” which information is incorporated herein by reference.
Item 13. Certain Relationships and Related Transactions, and Director Independence.
The information required by this item will be contained in the Proxy Statement under the headings “Related Person Transactions” and “Our Board of Directors,” which information is incorporated herein by reference.
Item 14. Principal Accounting Fees and Services.
The information required by this item will be contained in the Proxy Statement under the heading “Services Provided by the Independent Auditor and Fees Paid,” which information is incorporated herein by reference.
94
PART IV
Item 15. Exhibits, Financial Statement Schedules.
(a) 1. | Financial Statements. |
Management’s Report on Internal Control over Financial Reporting
Report of Independent Registered Public Accounting Firm
Consolidated Statements of Earnings for the years ended September 30, 2017, 2016 and 2015
Consolidated Statements of Comprehensive Income for the years ended September 30, 2017, 2016 and 2015
Consolidated Balance Sheets as of September 30, 2017 and 2016
Consolidated Statements of Cash Flows for the years ended September 30, 2017, 2016 and 2015
Consolidated Statements of Stockholders’ Equity for the years ended September 30, 2017, 2016 and 2015
Notes to Consolidated Financial Statements
2. | Financial Statement Schedules. |
Schedule II. Valuation and Qualifying Accounts
All other Schedules are omitted since the required information is not present or is not present in amounts sufficient to require submission of the schedule.
3. | Exhibits. |
The exhibits listed in Item 15(b) of this Part IV are filed or incorporated by reference as part of this Form 10-K. The Index to Exhibits is on page 97.
(b) | Exhibits. |
The exhibits listed in Item 15(b) of this Part IV are filed or incorporated by reference as part of this Form 10-K. The Index to Exhibits is on page 97.
95
Item 15(a).
VIACOM INC.
SCHEDULE II—VALUATION AND QUALIFYING ACCOUNTS
(in millions) | Beginning of period | Additions - expense and other | Deductions | End of period | |||||||||||
Year Ended September 30, 2017: | |||||||||||||||
Allowance for doubtful accounts | $ | 44 | $ | 26 | $ | (21 | ) | $ | 49 | ||||||
Sales returns and allowances | $ | 93 | $ | 186 | $ | (200 | ) | $ | 79 | ||||||
Deferred tax valuation allowance | $ | 195 | $ | 19 | $ | (58 | ) | $ | 156 | ||||||
Year Ended September 30, 2016: | |||||||||||||||
Allowance for doubtful accounts | $ | 37 | $ | 13 | $ | (6 | ) | $ | 44 | ||||||
Sales returns and allowances | $ | 126 | $ | 218 | $ | (251 | ) | $ | 93 | ||||||
Deferred tax valuation allowance | $ | 202 | $ | 25 | $ | (32 | ) | $ | 195 | ||||||
Year Ended September 30, 2015: | |||||||||||||||
Allowance for doubtful accounts | $ | 30 | $ | 10 | $ | (3 | ) | $ | 37 | ||||||
Sales returns and allowances | $ | 199 | $ | 344 | $ | (417 | ) | $ | 126 | ||||||
Deferred tax valuation allowance | $ | 308 | $ | 14 | $ | (120 | ) | $ | 202 | ||||||
96
Item 15(b).
INDEX TO EXHIBITS
Exhibit No. | Description of Exhibit | |
3.1 | Amended and Restated Certificate of Incorporation of Viacom Inc. effective December 31, 2015, as amended effective October 6, 2016 (incorporated by reference to Exhibit 3.1 to the Annual Report on Form 10-K of Viacom Inc. filed November 9, 2016) (File No. 001-32686). | |
3.2 | Amended and Restated Bylaws of Viacom Inc. effective August 18, 2016, as amended February 6, 2017 (incorporated by reference to Exhibit 3.2 to the Current Report on Form 8-K of Viacom Inc. filed February 10, 2017) (File No. 001-32686). | |
4.1 | Indenture, dated as of April 12, 2006, between Viacom Inc. and The Bank of New York (incorporated by reference to Exhibit 4.1 to the Current Report on Form 8-K of Viacom Inc. filed April 17, 2006) (File No. 001-32686). | |
4.2 | Fourth Supplemental Indenture, dated as of October 5, 2007, between Viacom Inc. and The Bank of New York, including Form of 6.125% Senior Note due 2017 and Form of 6.75% Senior Debenture due 2037 (incorporated by reference to Exhibit 4.1 to the Current Report on Form 8-K of Viacom Inc. filed October 9, 2007) (File No. 001-32686). | |
4.3 | Fifth Supplemental Indenture, dated as of August 26, 2009, between Viacom Inc. and The Bank of New York Mellon, including Form of 5.625% Senior Note due 2019 (incorporated by reference to Exhibit 4.1 to the Current Report on Form 8-K of Viacom Inc. filed August 26, 2009) (File No. 001-32686). | |
4.4 | Sixth Supplemental Indenture, dated as of September 29, 2009, between Viacom Inc. and The Bank of New York Mellon, including Form of 5.625% Senior Note due 2019 (incorporated by reference to Exhibit 4.1 to the Current Report on Form 8-K of Viacom Inc. filed September 30, 2009) (File No. 001-32686). | |
4.5 | Seventh Supplemental Indenture, dated as of February 22, 2011, between Viacom Inc. and The Bank of New York Mellon, including Form of 4.500% Senior Note due 2021 (incorporated by reference to Exhibit 4.1 to the Current Report on Form 8-K of Viacom Inc. filed February 23, 2011) (File No. 001-32686). | |
4.6 | Ninth Supplemental Indenture, dated as of December 12, 2011, between Viacom Inc. and The Bank of New York Mellon, including Form of 2.500% Senior Note due 2016 and 3.875% Senior Note due 2021 (incorporated by reference to Exhibit 4.1 to the Current Report on Form 8-K of Viacom Inc. filed December 12, 2011) (File No. 001-32686). | |
4.7 | Tenth Supplemental Indenture, dated as of February 28, 2012, between Viacom Inc. and The Bank of New York Mellon, including Form of 4.500% Senior Debenture due 2042 (incorporated by reference to Exhibit 4.1 to the Current Report on Form 8-K of Viacom Inc. filed February 28, 2012) (File No. 001-32686). | |
4.8 | Eleventh Supplemental Indenture, dated as of June 14, 2012, between Viacom Inc. and The Bank of New York Mellon, including Form of 3.125% Senior Note due 2022 (incorporated by reference to Exhibit 4.1 to the Current Report on Form 8-K of Viacom Inc. filed June 14, 2012) (File No. 001-32686). | |
4.9 | Twelfth Supplemental Indenture, dated as of November 26, 2012, between Viacom Inc. and The Bank of New York Mellon, including Form of 4.375% Senior Debentures due 2043 (incorporated by reference to Exhibit 4.1 to the Current Report on Form 8-K of Viacom Inc. filed November 30, 2012) (File No. 001- 32686). | |
97
Exhibit No. | Description of Exhibit | |
4.10 | Thirteenth Supplemental Indenture, dated as of December 4, 2012, between Viacom Inc. and The Bank of New York Mellon, including Form of 4.375% Senior Debentures due 2043 (incorporated by reference to Exhibit 4.1 to the Current Report on Form 8-K of Viacom Inc. filed December 21, 2012) (File No. 001- 32686). | |
4.11 | Fourteenth Supplemental Indenture, dated as of December 17, 2012, between Viacom Inc. and The Bank of New York Mellon, including Form of 4.375% Senior Debentures due 2043 (incorporated by reference to Exhibit 4.2 to the Current Report on Form 8-K of Viacom Inc. filed December 21, 2012) (File No. 001- 32686). | |
4.12 | Fifteenth Supplemental Indenture, dated as of March 14, 2013, between Viacom Inc. and The Bank of New York Mellon, including Form of 3.250% Senior Notes due 2023 and 4.875% Senior Debentures due 2043 (incorporated by reference to Exhibit 4.1 to the Current Report on Form 8-K of Viacom Inc. filed March 14, 2013) (File No. 001-32686). | |
4.13 | Sixteenth Supplemental Indenture, dated as of August 19, 2013, between Viacom Inc. and The Bank of New York Mellon, including Form of 2.500% Senior Notes due 2018, 4.250% Senior Notes due 2023 and 5.850% Senior Debentures due 2043 (incorporated by reference to Exhibit 4.1 to the Current Report on Form 8-K of Viacom Inc. filed August 19, 2013) (File No. 001-32686). | |
4.14 | Seventeenth Supplemental Indenture, dated as of March 11, 2014, between Viacom Inc. and The Bank of New York Mellon, including Form of 2.200% Senior Notes due 2019, 3.875% Senior Notes due 2024 and 5.250% Senior Debentures due 2044 (incorporated by reference to Exhibit 4.1 to the Current Report on Form 8-K of Viacom Inc. filed March 11, 2014) (File No. 001-32686). | |
4.15 | Eighteenth Supplemental Indenture, dated as of December 10, 2014, between Viacom Inc. and The Bank of New York Mellon, including Form of 2.750% Senior Notes due 2019 and 4.850% Senior Debentures due 2034 (incorporated by reference to Exhibit 4.1 to the Current Report on Form 8-K of Viacom Inc. filed December 10, 2014) (File No. 001-32686). | |
4.16 | Nineteenth Supplemental Indenture, dated as of October 4, 2016, between Viacom Inc. and The Bank of New York Mellon, including Form of 2.250% Senior Notes due 2022 and Form of 3.450% Senior Notes due 2026 (incorporated by reference to Exhibit 4.1 to the Current Report on Form 8-K of Viacom Inc. filed October 4, 2016) (File No. 001-32686). | |
4.17 | Twentieth Supplemental Indenture, dated as of February 28, 2017, between Viacom Inc. and The Bank of New York Mellon, including Form of 5.875% Junior Subordinated Debentures due 2057 and 6.250% Junior Subordinated Debentures due 2057 (incorporated by reference to Exhibit 4.1 to the Current Report on Form 8-K of Viacom filed February 28, 2017) (File No. 001-32686). | |
10.1 | $2.0 Billion Three-Year Credit Agreement, dated as of October 8, 2010, among Viacom Inc., the subsidiaries of Viacom Inc. designated as borrowers from time to time thereunder, the Lenders named therein, JPMorgan Chase Bank, N.A., as Administrative Agent, Citibank, N.A. and Bank of America, N.A., as Syndication Agents, and Deutsche Bank Securities Inc., Morgan Stanley MUFG Loan Partners, LLC, The Royal Bank of Scotland PLC and Wells Fargo Bank, N.A., as Documentation Agents (incorporated by reference to Exhibit 10.1 to the Transition Report on Form 10-K of Viacom Inc. filed November 12, 2010) (File No. 001-32686). | |
10.2 | First Amendment, dated as of December 2, 2011, to the $2.0 Billion Three-Year Credit Agreement dated as of October 8, 2010, among Viacom Inc., the subsidiaries of Viacom Inc. designated as borrowers from time to time thereunder, the Lenders named therein, JPMorgan Chase Bank, N.A., as Administrative Agent, Citibank, N.A. and Bank of America, N.A., as Syndication Agents, and Deutsche Bank Securities Inc., Morgan Stanley MUFG Loan Partners, LLC, The Royal Bank of Scotland PLC and Wells Fargo Bank, N.A., as Documentation Agents (incorporated by reference to Exhibit 10.1 to the Quarterly Report on Form 10-Q of Viacom Inc. filed February 2, 2012) (File No. 001-32686). | |
98
Exhibit No. | Description of Exhibit | |
10.3 | Second Amendment, dated as of November 9, 2012, to the $2.0 Billion Three-Year Credit Agreement dated as of October 8, 2010, among Viacom Inc., the subsidiaries of Viacom Inc. designated as borrowers from time to time thereunder, the Lenders named therein, JPMorgan Chase Bank, N.A., as Administrative Agent, Citibank, N.A. and Bank of America, N.A., as Syndication Agents, and Deutsche Bank Securities Inc., Morgan Stanley MUFG Loan Partners, LLC, The Royal Bank of Scotland PLC and Wells Fargo Bank, N.A., as Documentation Agents (incorporated by reference to Exhibit 10.1 to the Quarterly Report on Form 10-Q of Viacom Inc. filed January 31, 2013) (File No. 001-32686). | |
10.4 | Third Amendment, dated as of November 18, 2014, to the $2.0 Billion Three-Year Credit Agreement dated as of October 8, 2010, among Viacom Inc., the subsidiaries of Viacom Inc. designated as borrowers from time to time thereunder, the Lenders named therein, JPMorgan Chase Bank, N.A., as Administrative Agent, Citibank, N.A. and Bank of America, N.A., as Syndication Agents, and Deutsche Bank Securities Inc., Morgan Stanley MUFG Loan Partners, LLC, The Royal Bank of Scotland PLC and Wells Fargo Bank, N.A., as Documentation Agents (incorporated by reference to Exhibit 10.1 to the Quarterly Report on Form 10-Q of Viacom Inc. filed January 29, 2015) (File No. 001-32686). | |
10.5 | Summary of Viacom Inc. Compensation for Outside Directors (incorporated by reference to Exhibit 10.1 to the Quarterly Report on Form 10-Q of Viacom Inc. filed February 9, 2017) (File No. 001-32686).** | |
10.6 | Viacom Inc. 2011 Stock Option Plan for Outside Directors (incorporated by reference to Exhibit B to the Definitive Proxy Statement of Viacom Inc. filed April 16, 2010), as amended by Amendment No. 1 to Viacom Inc. 2011 Stock Option Plan for Outside Directors (incorporated by reference to Exhibit 10.2 to the Quarterly Report on Form 10-Q of Viacom Inc. filed January 31, 2013) (File No. 001- 32686).** | |
10.7 | Viacom Inc. 2011 RSU Plan for Outside Directors, as amended and restated as of November 13, 2013 (incorporated by reference to Exhibit 10.3 to the Quarterly Report on Form 10-Q of Viacom Inc. filed January 30, 2014) (File No. 001-32686).** | |
10.8 | Amendment No. 1, dated January 16, 2014, to the Viacom Inc. 2011 RSU Plan for Outside Directors, as amended and restated as of November 13, 2013 (incorporated by reference to Exhibit 10.4 to the Quarterly Report on Form 10-Q of Viacom Inc. filed January 30, 2014) (File No. 001-32686).** | |
10.9 | Viacom Inc. 2011 RSU Plan for Outside Directors, as amended and restated as of January 1, 2016 (incorporated by reference to Exhibit B to the Definitive Proxy Statement of Viacom Inc. filed January 23, 2015) (File No. 001-32686).** | |
10.10 | Viacom Inc. 2011 RSU Plan for Outside Directors, as amended and restated as of January 1, 2016, and as further amended and restated as of May 18, 2016 (incorporated by reference to Exhibit 10.2 to the Quarterly Report of Viacom Inc. filed August 4, 2016) (File No. 001-32686).** | |
10.11 | Viacom Inc. Deferred Compensation Plan for Outside Directors, as amended and restated as of November 13, 2013 (incorporated by reference to Exhibit 10.2 to the Quarterly Report on Form 10-Q of Viacom Inc. filed January 30, 2014) (File No. 001-32686).** | |
10.12 | Viacom Inc. Senior Executive Short-Term Incentive Plan, as amended and restated effective January 18, 2012 (incorporated by reference to Exhibit A to the Definitive Proxy Statement of Viacom Inc. filed January 27, 2012) (File No. 001-32686).** | |
10.13 | Viacom Inc. 2006 Long-Term Management Incentive Plan, as amended and restated effective January 1, 2011 (incorporated by reference to Exhibit A to the Definitive Proxy Statement of Viacom Inc. filed April 16, 2010) (File No. 001-32686).** | |
99
Exhibit No. | Description of Exhibit | |
10.14 | Viacom Inc. 2016 Long-Term Management Incentive Plan (incorporated by reference to Exhibit A to the Definitive Proxy Statement of Viacom Inc. filed January 23, 2015) (File No. 001-32686).** | |
10.14.1 | Viacom Inc. 2016 LTMIP: Form of Terms and Conditions to the Stock Option Certificate (incorporated by reference to Exhibit 10.3 to the Quarterly Report on Form 10-Q of Viacom Inc. filed August 4, 2016) (File No. 001-32686).** | |
10.14.2 | Viacom Inc. 2016 LTMIP: Form of Terms and Conditions to the Restricted Share Units Certificate (incorporated by reference to Exhibit 10.4 to the Quarterly Report on Form 10-Q of Viacom Inc. filed August 4, 2016) (File No. 001-32686).** | |
10.14.3 | Viacom Inc. 2016 LTMIP: Form of Terms and Conditions to the Performance Share Units (incorporated by reference to Exhibit 10.5 to the Quarterly Report on Form 10-Q of Viacom Inc. filed August 4, 2016) (File No. 001-32686).** | |
10.15 | Viacom Excess Pension Plan, as amended and restated January 1, 2009 (incorporated by reference to Exhibit 10.13 to the Annual Report on Form 10-K of Viacom Inc. filed February 12, 2009) (File No. 001-32686).** | |
10.16 | Amendment, effective as of March 31, 2009, to Viacom Excess Pension Plan, as amended and restated January 1, 2009 (incorporated by reference to Exhibit 10.13 to the Transition Report on Form 10-K of Viacom Inc. filed November 12, 2010) (File No. 001-32686).** | |
10.17 | Viacom Excess 401(k) Plan for Designated Senior Executives, as amended and restated January 1, 2009 (incorporated by reference to Exhibit 10.14 to the Annual Report on Form 10-K of Viacom Inc. filed February 12, 2009) (File No. 001-32686).** | |
10.18 | Amendments, effective as of April 1, 2009 and December 31, 2009, to Viacom Excess 401(k) Plan for Designated Senior Executives, as amended and restated January 1, 2009 (incorporated by reference to Exhibit 10.15 to the Transition Report on Form 10-K of Viacom Inc. filed November 12, 2010) (File No. 001-32686).** | |
10.19 | Viacom Bonus Deferral Plan for Designated Senior Executives, as amended and restated January 1, 2009 (incorporated by reference to Exhibit 10.15 to the Annual Report on Form 10-K of Viacom Inc. filed February 12, 2009) (File No. 001-32686).** | |
10.20 | Amendment, effective as of December 31, 2009, to Viacom Bonus Deferral Plan for Designated Senior Executives, as amended and restated January 1, 2009 (incorporated by reference to Exhibit 10.17 to the Transition Report on Form 10-K of Viacom Inc. filed November 12, 2010) (File No. 001-32686).** | |
10.21 | Employment Agreement between Viacom Inc. and Robert Bakish, dated as of December 12, 2016, as supplemented by Letter Agreement between Viacom Inc. and Robert Bakish, dated as of December 12, 2016 (incorporated by reference to Exhibit 10.4 and Exhibit 10.5, respectively, to the Quarterly Report on Form 10-Q of Viacom Inc. filed February 9, 2017), which superseded the Employment Agreement between Viacom Inc. and Robert Bakish, dated as of October 31, 2016, and the Letter Agreement between Viacom Inc. and Robert Bakish, dated as of October 31, 2016 (incorporated by reference to Exhibit 10.7 and Exhibit 10.8, respectively, to the Quarterly Report on Form 10-Q of Viacom Inc. filed February 9, 2017) (File No. 001-32686).** | |
10.22 | Employment Agreement between Viacom Inc. and Wade Davis, effective as of November 27, 2014 (incorporated by reference to Exhibit 10.3 to the Quarterly Report on Form 10-Q of Viacom Inc. filed January 29, 2015) (File No. 001-32686).** | |
10.23 | Employment Agreement between Viacom Inc. and DeDe Lea, effective as of November 14, 2016 (incorporated by reference to Exhibit 10.10 to the Quarterly Report on Form 10-Q of Viacom Inc. filed February 9, 2017) (File No. 001-32686).** | |
100
Exhibit No. | Description of Exhibit | |
10.24 | Employment Agreement between Viacom Inc. and Scott Mills, dated as of October 1, 2014 (incorporated by reference to Exhibit 10.1 to the Quarterly Report on Form 10-Q of Viacom Inc. filed February 9, 2016) (File No. 001-32686).** | |
10.25 | Employment Agreement between Viacom Inc. and Philippe P. Dauman, effective as of January 15, 2015 (incorporated by reference to Exhibit 10.2 to the Quarterly Report on Form 10-Q of Viacom Inc. filed January 29, 2015) (File No. 001-32686).** | |
10.26 | Employment Agreement between Viacom Inc. and Thomas E. Dooley, as amended and restated as of May 27, 2010 (incorporated by reference to Exhibit 10.1 to the Quarterly Report on Form 10-Q of Viacom Inc. filed August 5, 2010), as amended by Letter Agreement dated March 17, 2016 (incorporated by reference to Exhibit 10.1 to the Quarterly Report on Form 10-Q of Viacom Inc. filed April 28, 2016), and as further amended by Letter Agreement dated September 21, 2016 (incorporated by reference to Exhibit 10 to the Current Report on Form 8-K of Viacom Inc. filed September 21, 2016) (File No. 001-32686).** | |
10.27 | Employment Agreement between Viacom Inc. and Michael D. Fricklas, dated as of October 2, 2009 (incorporated by reference to Exhibit 10.17 to the Annual Report on Form 10-K of Viacom Inc. filed February 11, 2010), as amended by Letter Agreement dated August 6, 2012 (incorporated by reference to Exhibit 10.21 to the Annual Report on Form 10-K of Viacom Inc. filed November 15, 2012), as further amended by Amendment dated May 20, 2015 (incorporated by reference to Exhibit 10.1 to the Quarterly Report on Form 10-Q of Viacom Inc. filed August 6, 2015), and as further amended by the Confidential Settlement and Release Agreement, effective as of August 18, 2016 (incorporated by reference to Exhibit 10 to the Current Report on Form 8-K of Viacom Inc. filed August 23, 2016) (File No. 001-32686).** | |
10.28 | Confidential Settlement and Release Agreement, effective as of August 18, 2016 (incorporated by reference to Exhibit 10 to the Current Report on Form 8-K of Viacom Inc. filed August 23, 2016) (File No. 001- 32686). | |
10.29 | Separation Agreement dated as of December 19, 2005 by and between Former Viacom and New Viacom Corp. (incorporated by reference to Exhibit 10.1 to the Current Report on Form 8-K of New Viacom Corp. filed December 21, 2005) (File No. 001-32686). | |
10.30 | Tax Matters Agreement dated as of December 30, 2005 by and between Former Viacom and New Viacom Corp. (incorporated by reference to Exhibit 10.1 to the Current Report on Form 8-K of Viacom Inc. filed January 5, 2006) (File No. 001-32686). | |
21.1* | ||
23.1* | ||
24.1* | ||
31.1* | ||
31.2* | ||
32.1* | ||
32.2* | ||
101.INS* | XBRL Instance Document. | |
101.SCH* | XBRL Taxonomy Extension Schema. | |
101
Exhibit No. | Description of Exhibit | |
101.CAL* | XBRL Taxonomy Extension Calculation Linkbase. | |
101.DEF* | XBRL Taxonomy Extension Definition Linkbase. | |
101.LAB* | XBRL Taxonomy Extension Label Linkbase. | |
101.PRE* | XBRL Taxonomy Extension Presentation Linkbase. | |
* | Filed herewith. |
** | Represents a management contract or compensatory plan or arrangement required to be filed as an exhibit. |
102
SIGNATURES
Pursuant to the requirements of Section 13 or 15(d) of the Securities Exchange Act of 1934, the registrant has duly caused this report to be signed on its behalf by the undersigned, thereunto duly authorized.
VIACOM INC. | ||
By: | /s/ Robert M. Bakish | |
Robert M. Bakish | ||
President and Chief Executive Officer | ||
Date: November 16, 2017
Pursuant to the requirements of the Securities Exchange Act of 1934, this report has been signed by the following persons on behalf of Viacom Inc. and in the capacities and on the dates indicated:
Signature | Title | Date | ||
/s/ Robert M. Bakish | President and Chief Executive Officer; | November 16, 2017 | ||
Robert M. Bakish | Director | |||
/s/ Wade Davis | Executive Vice President, | November 16, 2017 | ||
Wade Davis | Chief Financial Officer | |||
/s/ Katherine Gill-Charest | Senior Vice President, Controller | November 16, 2017 | ||
Katherine Gill-Charest | (Chief Accounting Officer) | |||
* | Chairman of the Board | November 16, 2017 | ||
Thomas J. May | ||||
* | Vice Chair of the Board | November 16, 2017 | ||
Shari Redstone | ||||
* | Director | November 16, 2017 | ||
Cristiana Falcone Sorrell | ||||
* | Director | November 16, 2017 | ||
Kenneth B. Lerer | ||||
103
Signature | Title | Date | ||
* | Director | November 16, 2017 | ||
Judith A. McHale | ||||
* | Director | November 16, 2017 | ||
Ronald L. Nelson | ||||
* | Director | November 16, 2017 | ||
Deborah Norville | ||||
* | Director | November 16, 2017 | ||
Charles E. Phillips, Jr. | ||||
* | Director | November 16, 2017 | ||
Nicole Seligman | ||||
*By: | /s/ Christa A. D’Alimonte | November 16, 2017 | ||||
Christa A. D’Alimonte Attorney-in-Fact for the Directors | ||||||
104