Attached files
| file | filename |
|---|---|
| 8-K - 8-K (INVESTOR PRESENTATION) - PCSB Financial Corp | pcsb-8k_20171116.htm |

NOVEMBER 16, 2017 INVESTOR PRESENTATION EXHIBIT 99.1
Forward Looking Statements This Investor Presentation contains a number of forward-looking statements within the meaning of Section 27A of the Securities Act of 1933, as amended, and Section 21E of the Securities Exchange Act of 1934, as amended. These statements may be identified by use of words such as "anticipate," "believe," "could," "estimate," "expect," "intend," "may," "outlook," "plan," "potential," "predict," "project," "should," "will," "would" and similar terms and phrases, including references to assumptions. Forward-looking statements are based upon various assumptions and analyses made by the Company in light of management's experience and its perception of historical trends, current conditions and expected future developments, as well as other factors it believes are appropriate under the circumstances. These statements are not guarantees of future performance and are subject to risks, uncertainties and other factors (many of which are beyond the Company's control) that could cause actual results to differ materially from future results expressed or implied by such forward-looking statements. These factors include, without limitation, the following: the timing and occurrence or non-occurrence of events may be subject to circumstances beyond the Company's control; there may be increases in competitive pressure among financial institutions or from non-financial institutions; changes in the interest rate environment may reduce interest margins; changes in deposit flows, loan demand or real estate values may adversely affect the Company's business; changes in accounting principles, policies or guidelines may cause the Company's financial condition to be perceived differently; changes in corporate and/or individual income tax laws may adversely affect the Company's financial condition or results of operations; general economic conditions, either nationally or locally in some or all areas in which the Company conducts business, or conditions in the securities markets or the banking industry may be less favorable than the Company currently anticipates; legislation or regulatory changes may adversely affect the Company's business; technological changes may be more difficult or expensive than the Company anticipates; success or consummation of new business initiatives may be more difficult or expensive than the Company anticipates; or litigation or other matters before regulatory agencies, whether currently existing or commencing in the future, may delay the occurrence or non-occurrence of events longer than the Company anticipates. The Company assumes no obligation to update any forward-looking statements except as may be required by applicable law or regulation.
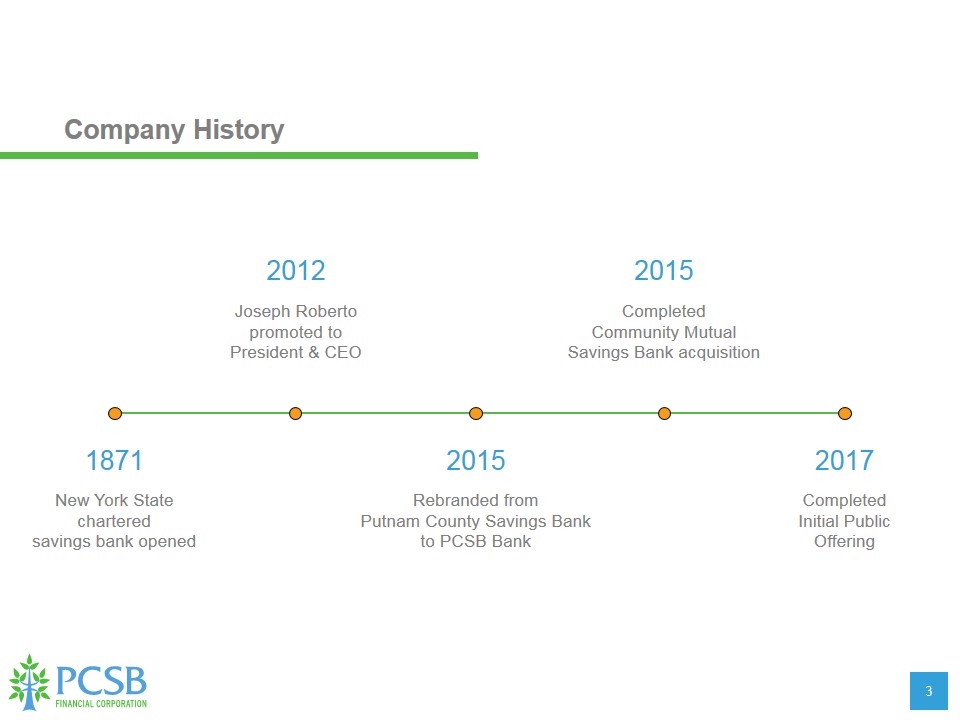
New York State chartered savings bank opened 1871 Joseph Roberto promoted to President & CEO 2012 Rebranded from Putnam County Savings Bank to PCSB Bank 2015 Completed Community Mutual Savings Bank acquisition 2015 Completed Initial Public Offering 2017 Company History
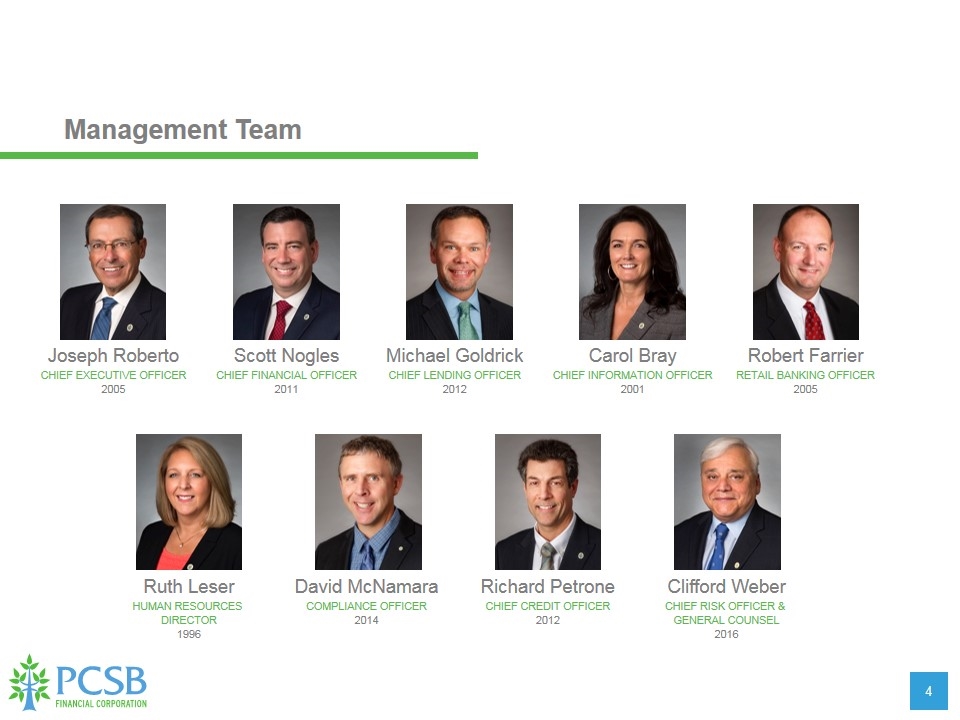
Joseph Roberto CHIEF EXECUTIVE OFFICER 2005 Scott Nogles CHIEF FINANCIAL OFFICER 2011 Michael Goldrick CHIEF LENDING OFFICER 2012 Carol Bray CHIEF INFORMATION OFFICER 2001 Ruth Leser HUMAN RESOURCES DIRECTOR 1996 Robert Farrier RETAIL BANKING OFFICER 2005 David McNamara COMPLIANCE OFFICER 2014 Richard Petrone CHIEF CREDIT OFFICER 2012 Clifford Weber CHIEF RISK OFFICER & GENERAL COUNSEL 2016 Management Team
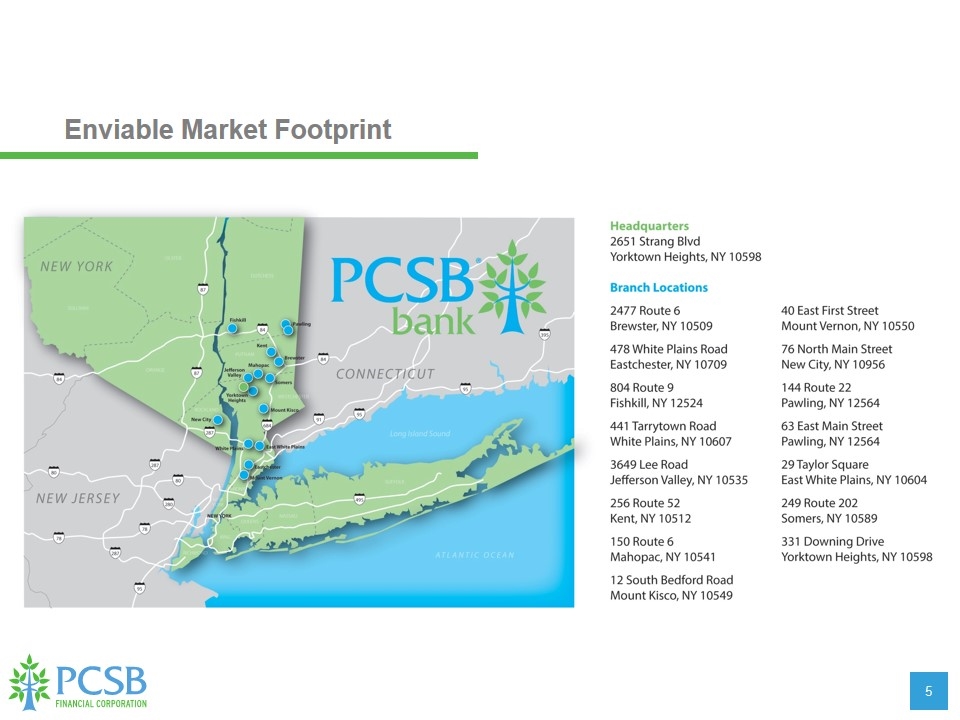
Enviable Market Footprint
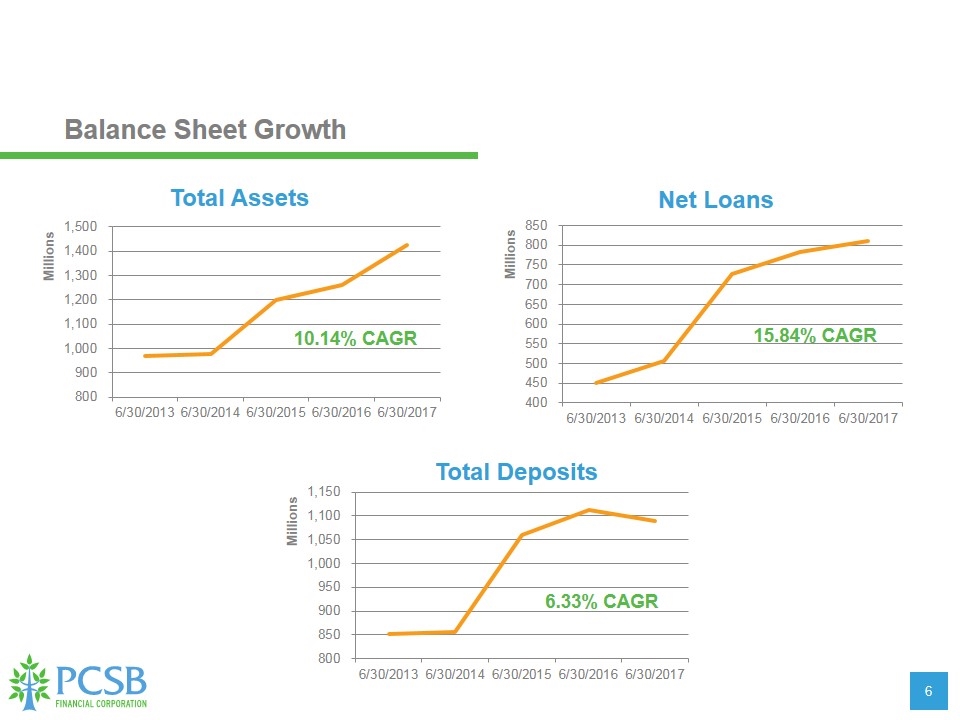
Balance Sheet Growth 10.14% CAGR 15.84% CAGR 6.33% CAGR
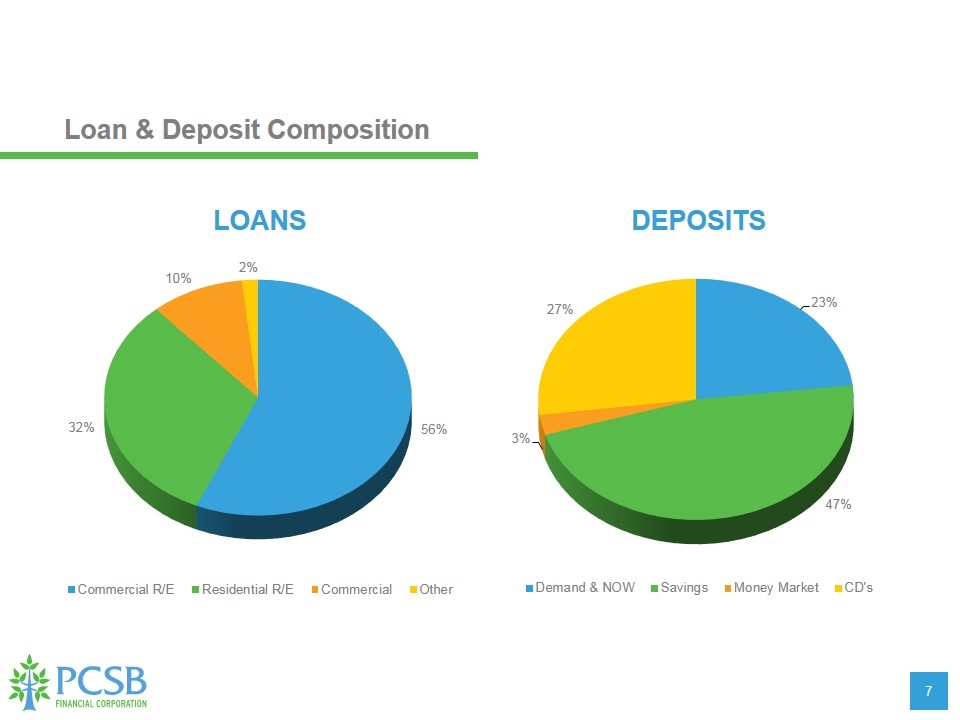
Loan & Deposit Composition LOANS DEPOSITS
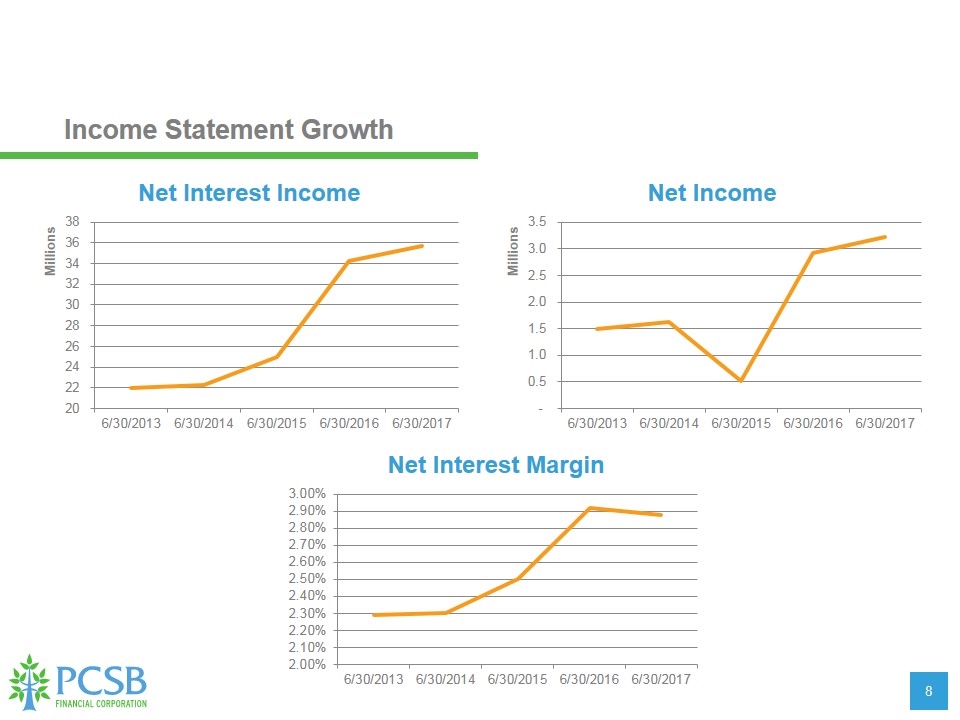
Income Statement Growth
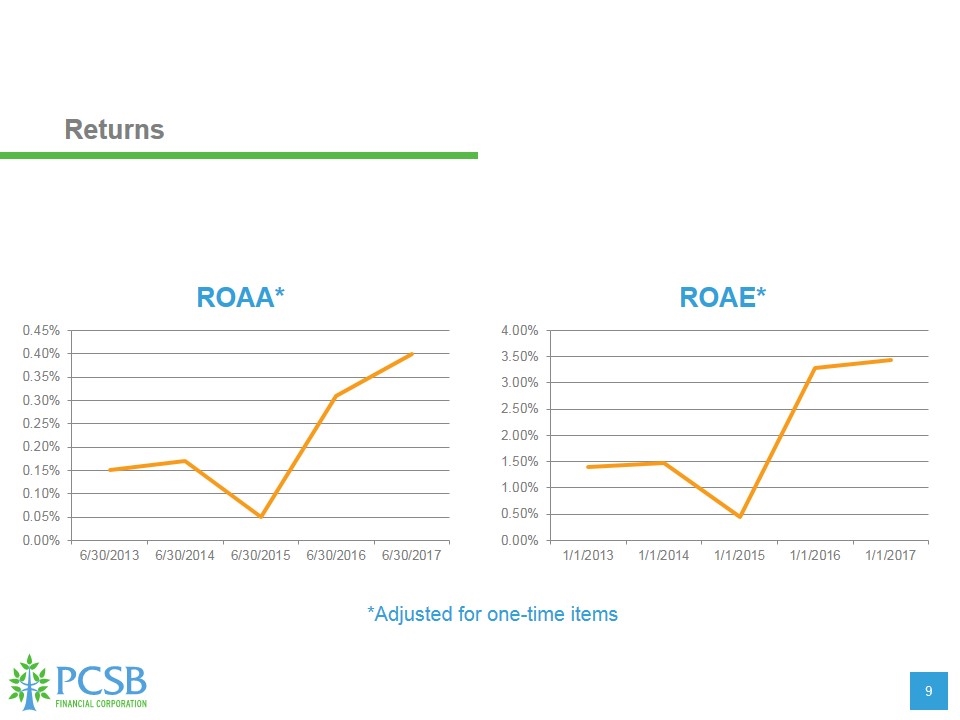
Returns ROAA* ROAE* *Adjusted for one-time items
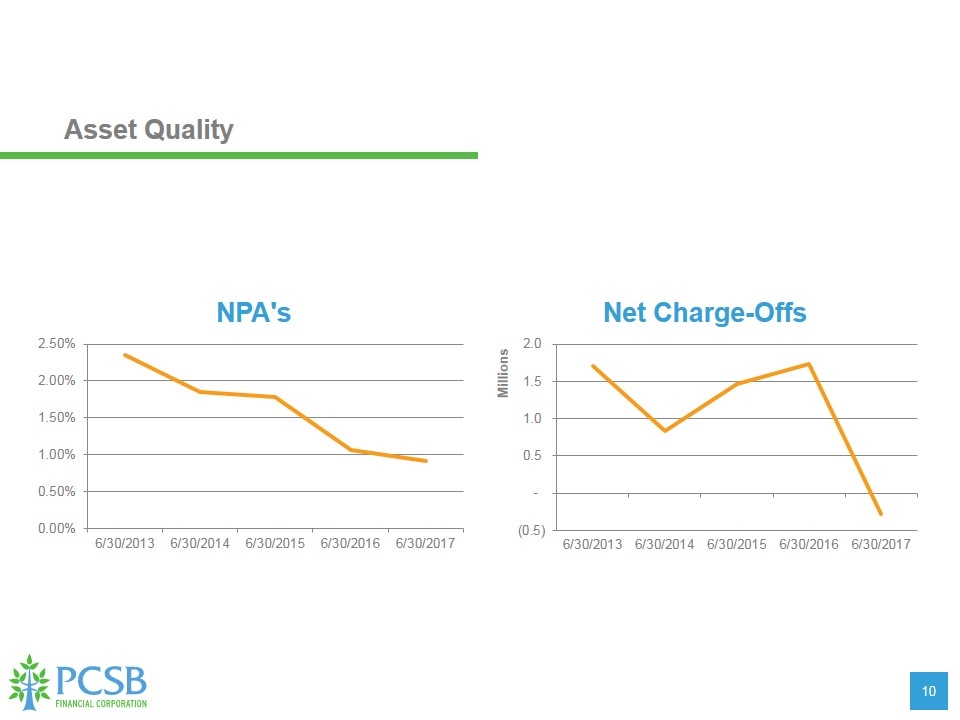
Asset Quality
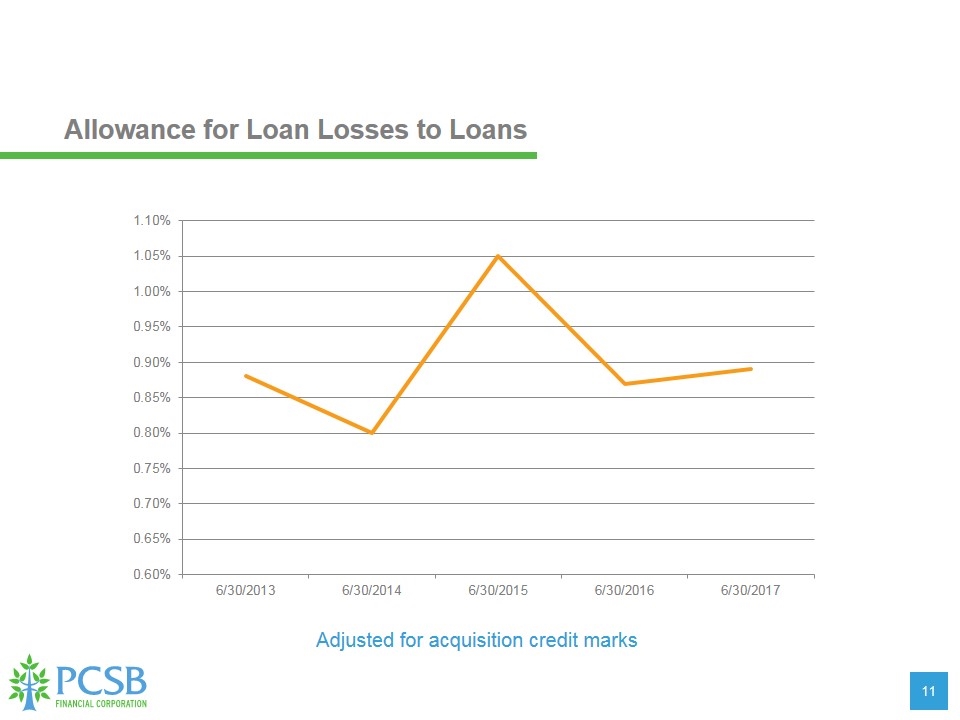
Allowance for Loan Losses to Loans Adjusted for acquisition credit marks
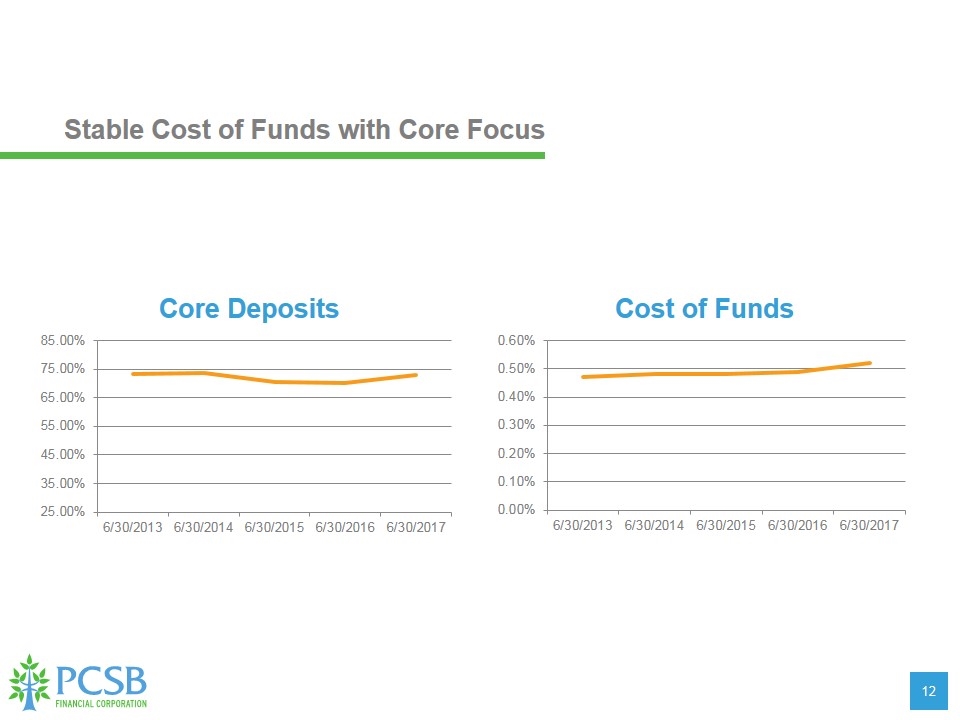
Stable Cost of Funds with Core Focus
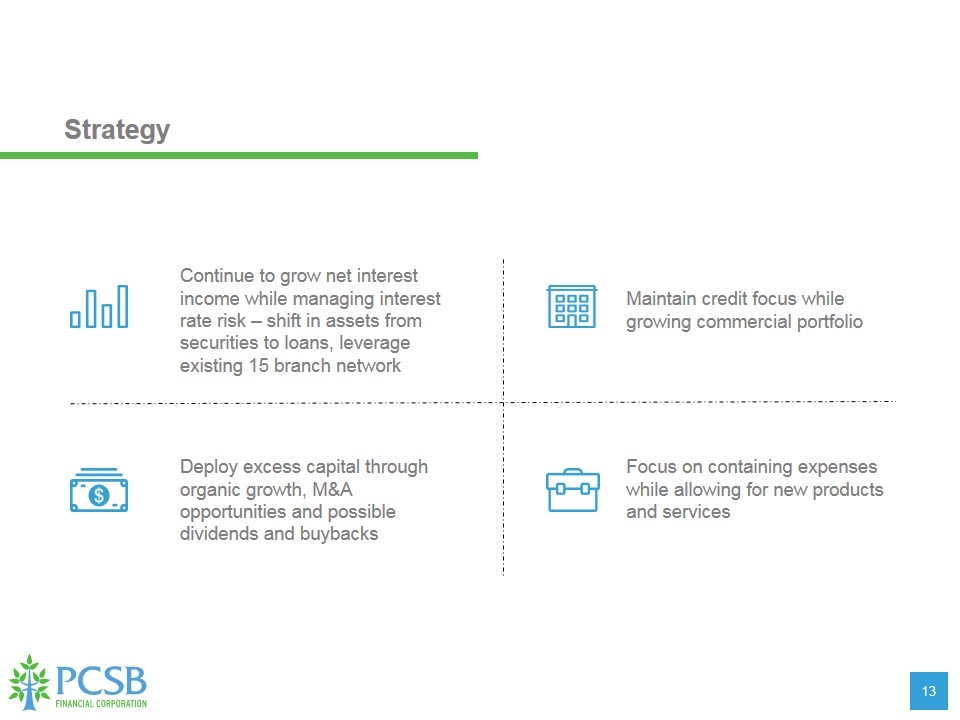
Continue to grow net interest income while managing interest rate risk – shift in assets from securities to loans, leverage existing 15 branch network Strategy Maintain credit focus while growing commercial portfolio Deploy excess capital through organic growth, M&A opportunities and possible dividends and buybacks Focus on containing expenses while allowing for new products and services
Fiscal 2018 First-Quarter Results Compared to Previous Quarters
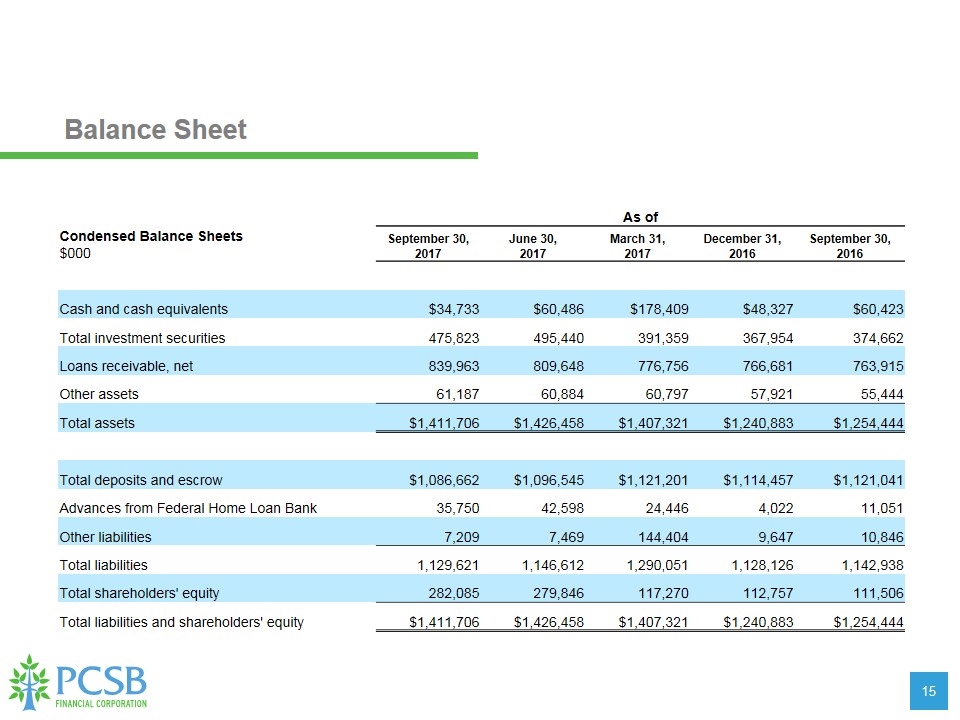
Balance Sheet As of Condensed Balance Sheets $000 September 30, 2017 June 30, 2017 March 31, 2017 December 31, 2016 September 30, 2016 Cash and cash equivalents $34,733 $60,486 $178,409 $48,327 $60,423 Total investment securities 475,823 495,440 391,359 367,954 374,662 Loans receivable, net 839,963 809,648 776,756 766,681 763,915 Other assets 61,187 60,884 60,797 57,921 55,444 Total assets $1,411,706 $1,426,458 $1,407,321 $1,240,883 $1,254,444 Total deposits and escrow $1,086,662 $1,096,545 $1,121,201 $1,114,457 $1,121,041 Advances from Federal Home Loan Bank 35,750 42,598 24,446 4,022 11,051 Other liabilities 7,209 7,469 144,404 9,647 10,846 Total liabilities 1,129,621 1,146,612 1,290,051 1,128,126 1,142,938 Total shareholders' equity 282,085 279,846 117,270 112,757 111,506 Total liabilities and shareholders' equity $1,411,706 $1,426,458 $1,407,321 $1,240,883 $1,254,444
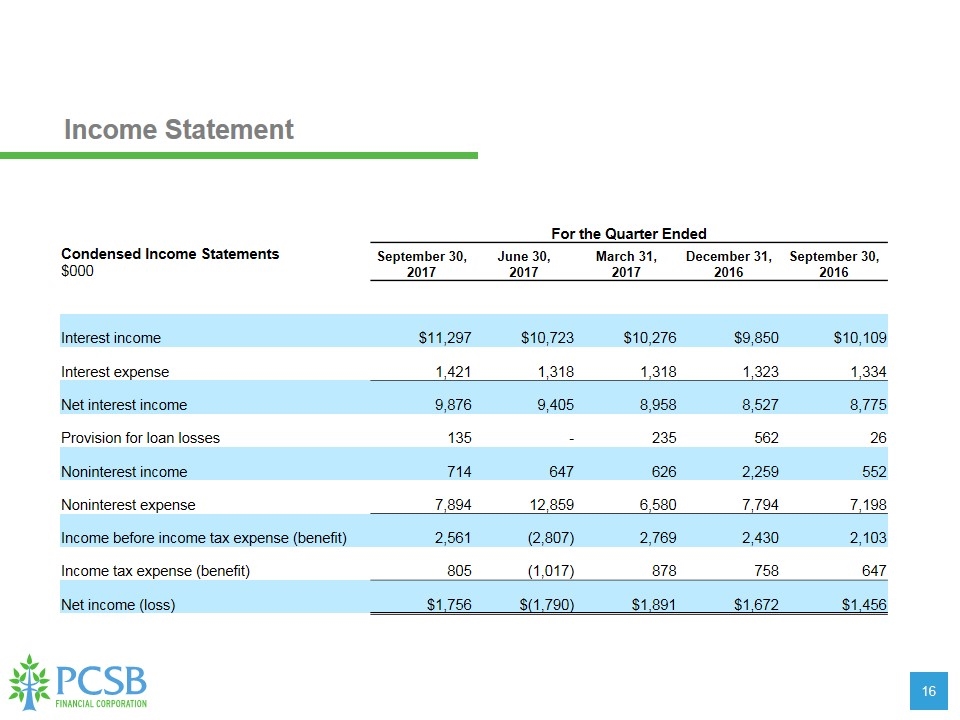
Income Statement For the Quarter Ended Condensed Income Statements $000 September 30, 2017 June 30, 2017 March 31, 2017 December 31, 2016 September 30, 2016 Interest income $11,297 $10,723 $10,276 $9,850 $10,109 Interest expense 1,421 1,318 1,318 1,323 1,334 Net interest income 9,876 9,405 8,958 8,527 8,775 Provision for loan losses 135 - 235 562 26 Noninterest income 714 647 626 2,259 552 Noninterest expense 7,894 12,859 6,580 7,794 7,198 Income before income tax expense (benefit) 2,561 (2,807) 2,769 2,430 2,103 Income tax expense (benefit) 805 (1,017) 878 758 647 Net income (loss) $1,756 $(1,790) $1,891 $1,672 $1,456
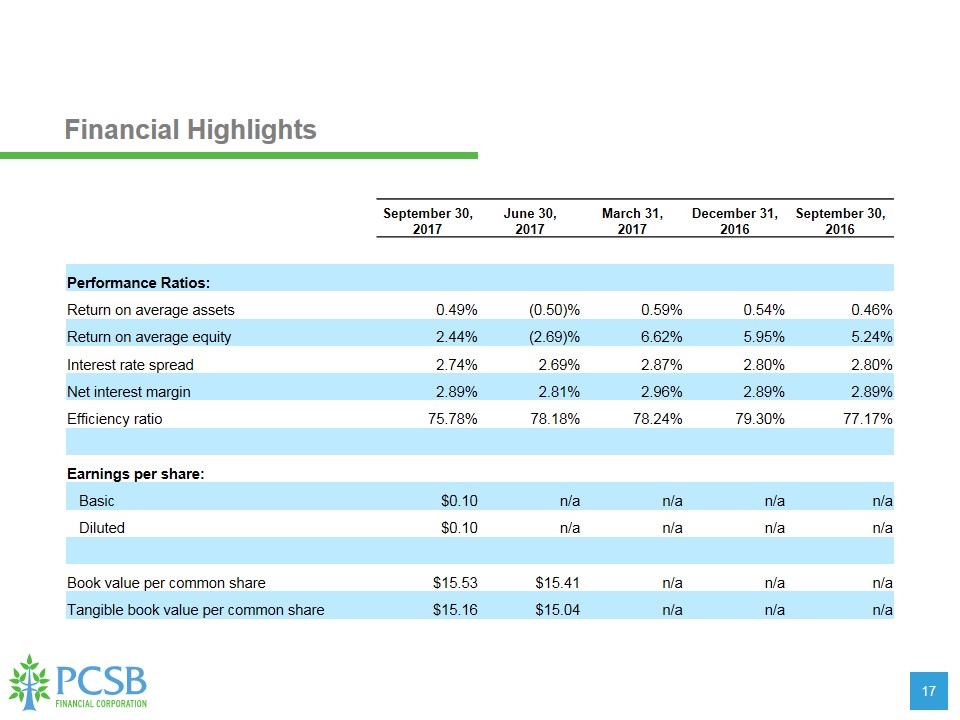
Financial Highlights September 30, 2017 June 30, 2017 March 31, 2017 December 31, 2016 September 30, 2016 Performance Ratios: Return on average assets 0.49% (0.50)% 0.59% 0.54% 0.46% Return on average equity 2.44% (2.69)% 6.62% 5.95% 5.24% Interest rate spread 2.74% 2.69% 2.87% 2.80% 2.80% Net interest margin 2.89% 2.81% 2.96% 2.89% 2.89% Efficiency ratio 75.78% 78.18% 78.24% 79.30% 77.17% Earnings per share: Basic $0.10 n/a n/a n/a n/a Diluted $0.10 n/a n/a n/a n/a Book value per common share $15.53 $15.41 n/a n/a n/a Tangible book value per common share $15.16 $15.04 n/a n/a n/a
