Attached files
| file | filename |
|---|---|
| 8-K - FORM 8-K - Hilton Grand Vacations Inc. | d474170d8k.htm |
Exhibit 99.1
HILTON GRAND VACATIONS © 2017 Hilton Grand Vacations Inc. Proprietary Investor Presentation Q3 2017
DISCLAIMER © 2017 Hilton Grand Vacations Inc. Proprietary This presentation contains forward-looking statements within the meaning of Section 27A of the Securities Act of 1933, as amended, and Section 21E of the Securities Exchange Act of 1934, as amended, that are based on our management’s beliefs and assumptions and on information currently available to our management. These statements include, but are not limited to, statements related to our expectations regarding the performance of our business, our financial results, our liquidity and capital resources and other non-historical statements. Forward-looking statements include all statements that are not historical facts, and in some cases, you can identify these forward-looking statements by the use of words such as “outlook,” “believes,” “expects,” “potential,” “continues,” “may,” “will,” “should,” “could,” “seeks,” “approximately,” “projects,” “predicts,” “intends,” “plans,” “estimates,” “anticipates” or the negative version of these words or other comparable words. Such forward-looking statements are subject to various risks, uncertaintiesand assumptions, includingthose described under the section entitled “Risk Factors” in our Annual Report on Form 10-Kfor the year ended December 31, 2016, as supplemented by our Quarterly Reports on Form 10-Q for the quarters ended during 2017. These factors should not be construed as exhaustive and should be read in conjunction with the other cautionary statements that are included in this presentation and in our filings with the Securities and Exchange Commission. These and other factors could cause actual outcomes or results to differ materially from those indicated in these forward-looking statements. We undertake no obligation to publicly update or review any forward-looking statement, whether as a result of new information, future developments or otherwise, except as required by law. This presentation is not an offer to sell or the solicitation of an offer to buy any securities of the company, nor will there be any sales of securities of the company in any jurisdiction in which the offer, solicitation or sale would be unlawful prior to registration or qualification under the securities laws of any such jurisdiction. This presentation includes certain terms that are not recognized terms under U.S. Generally Accepted Accounting Principles (“GAAP”), and certain financial measures that are not calculated in accordance with U.S. GAAP, including earnings before interest expense (excluding interest expense relating to our non-recourse debt), income tax expense, depreciation and amortization (“EBITDA”), Adj. EBITDA, Adj. EBITDA Margin, Net Debt and Net Debt / Adj. EBITDA, Contract Sales, Free Cash Flow and Return on Invested Capital (“ROIC”). Non-GAAP financial measures Adj. EBITDA, Adj. EBITDA Margin, Net Debt and Net Debt / Adj. EBITDA should be considered only as supplemental to, and not as superior to, financial measures prepared in accordance with U.S.GAAP. Please refer to the Appendix and footnotes of this presentation for a reconciliation of the historical and forward-lookingnon-GAAP financial measures included in this presentation to the most directly comparable financial measures prepared in accordance with U.S. GAAP. 2
© 2017 Hilton Grand Vacations Inc. Proprietary OVERVIEW COMPANY
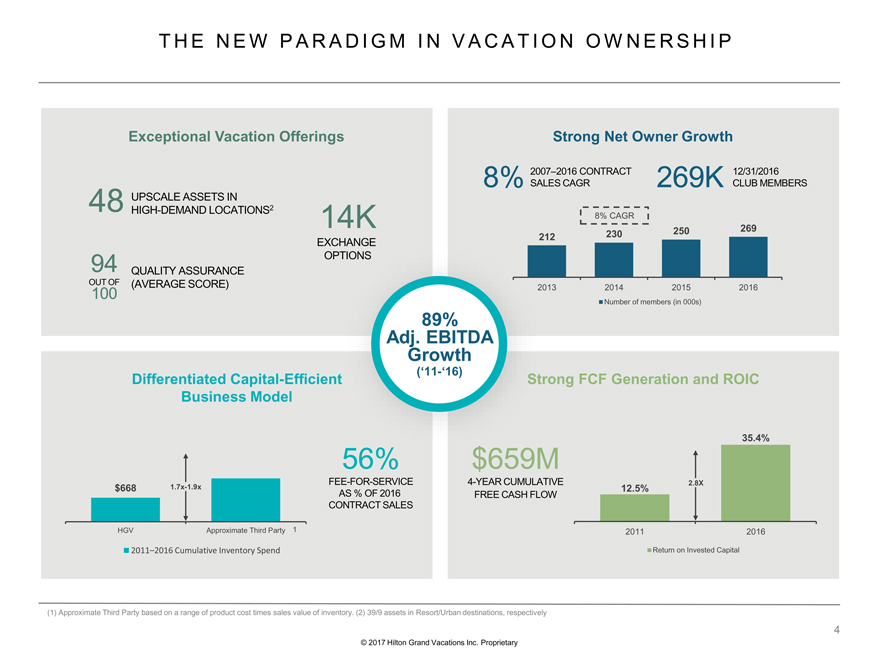
THE NEW PARADIGM IN VACATION OWNERSHIP © 2017 Hilton Grand Vacations Inc. Proprietary v 89% Adj. EBITDA Growth (‘11-‘16) (1) Approximate Third Party based on a range of product cost times sales value of inventory. (2) 39/9 assets in Resort/Urban destinations, respectively 212 230 250 269 2013 2014 2015 2016 Number of members (in 000s) Exceptional Vacation Offerings Strong Net Owner Growth Strong FCF Generation and ROIC Differentiated Capital-Efficient Business Model UPSCALE ASSETS IN HIGH-DEMAND LOCATIONS2 48 QUALITY ASSURANCE (AVERAGE SCORE) 94 OUT OF 100 14K EXCHANGE OPTIONS 2007–2016 CONTRACT SALES CAGR 8% 12/31/2016 CLUB MEMBERS 269K $659M 4-YEAR CUMULATIVE FREE CASH FLOW 56% FEE-FOR-SERVICE AS % OF 2016 CONTRACT SALES 8% CAGR $668 HGV Approximate Third Party 2011–2016 Cumulative Inventory Spend 1 1.7x-1.9x 12.5% 35.4% 2011 2016 Return on Invested Capital 2.8X4
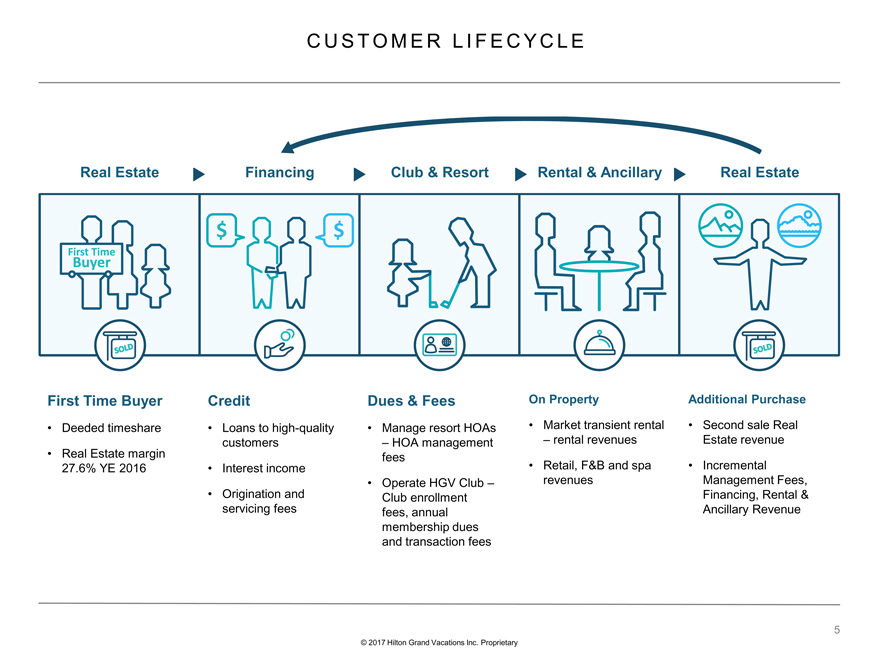
CUSTOMER L I FECYCLE © 2017 Hilton Grand Vacations Inc. Proprietary First Time Buyer • Deeded timeshare • Real Estate margin 27.6% YE 2016 Credit • Loans to high-quality customers • Interest income • Origination and servicing fees Dues & Fees • Manage resort HOAs – HOA management fees • Operate HGV Club – Club enrollment fees, annual membership dues and transaction fees On Property • Market transient rental – rental revenues • Retail, F&B and spa revenues Additional Purchase • Second sale Real Estate revenue • Incremental Management Fees, Financing, Rental & Ancillary Revenue Real Estate Financing Club & Resort Rental & Ancillary Real Estate 5
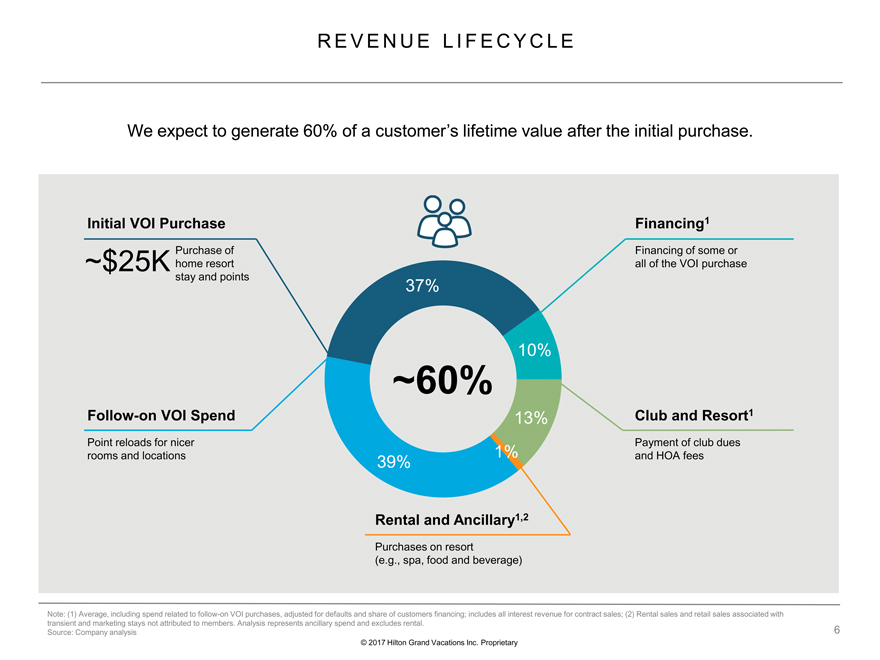
REVENUELIFECYCLE 37% 10% 13% 1% 39% ~60% © 2017 Hilton Grand Vacations Inc. Proprietary We expect to generate 60% of a customer’s lifetime value after the initial purchase. Note: (1) Average, including spend related to follow-on VOI purchases, adjusted for defaults and share of customers financing; includes all interest revenue for contract sales; (2) Rental sales and retail sales associated with transient and marketing stays not attributed to members.Analysis represents ancillary spend and excludes rental. Source: Company analysis Financing1 Financing of some or all of the VOI purchase Club and Resort1 Payment of club dues and HOA fees Follow-on VOI Spend Point reloads for nicer rooms and locations Initial VOI Purchase Purchase of home resort stay and points ~$25K Rental and Ancillary1,2 Purchases on resort (e.g., spa, food and beverage)6
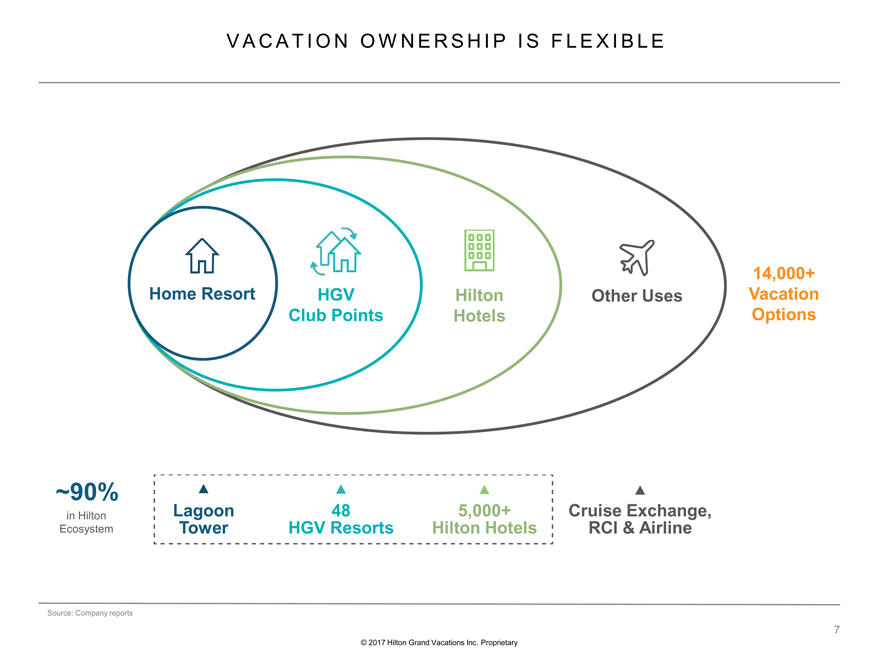
VACAT ION OWNERSHI P I S F LEX I BLE © 2017 Hilton Grand Vacations Inc. Proprietary Source: Company reports ~90% 14,000+ Vacation Options in Hilton Ecosystem Cruise Exchange, RCI & Airline Other Uses Hilton Hotels 5,000+ Hilton Hotels HGV Club Points 48 HGV Resorts Home Resort Lagoon Tower7
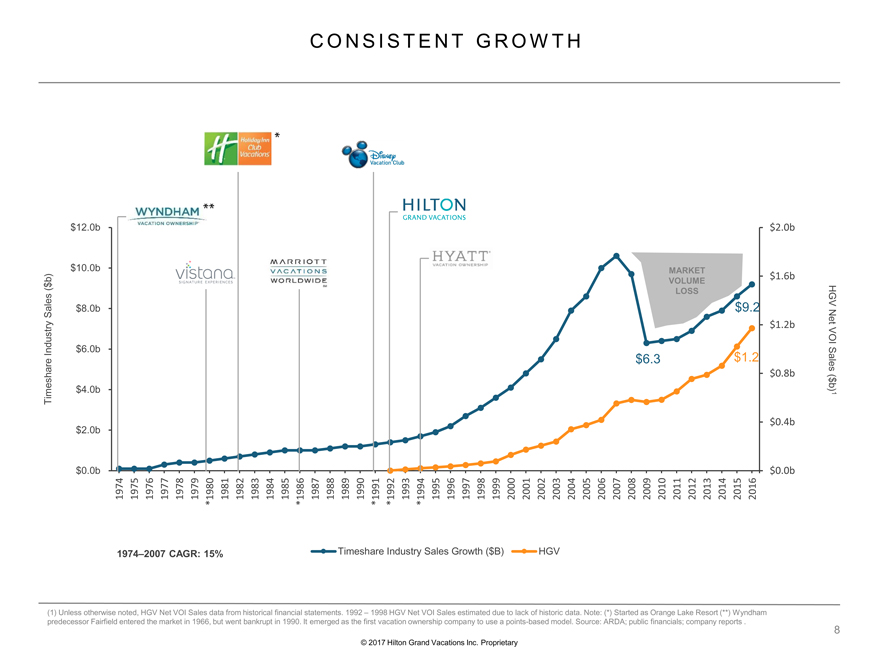
$0.0b $0.4b $0.8b $1.2b $1.6b $2.0b $0.0b $2.0b $4.0b $6.0b $8.0b $10.0b $12.0b 1974 1975 1976 1977 1978 1979 *1980 1981 1982 1983 1984 1985 *1986 1987 1988 1989 1990 *1991 *1992 1993 *1994 1995 1996 1997 1998 1999 2000 2001 2002 2003 2004 2005 2006 2007 2008 2009 2010 2011 2012 2013 2014 2015 2016 Timeshare Industry Sales Growth ($B) HGV CONSISTENT GROWTH © 2017 Hilton Grand Vacations Inc. Proprietary (1) Unless otherwise noted, HGV Net VOI Sales data from historical financial statements. 1992 – 1998 HGV Net VOI Sales estimated due to lack of historic data. Note: (*) Started as Orange Lake Resort (**) Wyndham predecessor Fairfield entered the market in 1966, but went bankrupt in 1990. It emerged as the first vacation ownership company to use a points-based model. Source: ARDA; public financials; company reports . MARKET VOLUME LOSS $9.2 $1.2 Timeshare Industry Sales ($b) HGV Net VOI Sales ($b)1 1974–2007 CAGR: 15% $6.38â
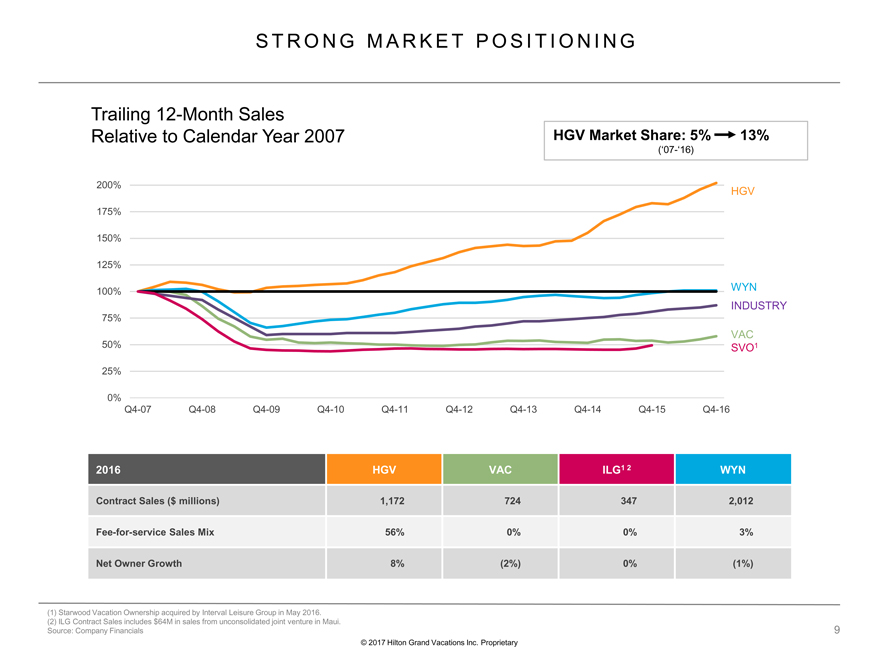
STRONG MARKET POSITIONING © 2017 Hilton Grand Vacations Inc. Proprietary (1) Starwood Vacation Ownership acquired by Interval Leisure Group in May 2016. (2) ILG Contract Sales includes $64M in sales from unconsolidated joint venture in Maui. Source: Company Financials Trailing 12-MonthSales Relative to Calendar Year 2007 0% 25% 50% 75% 100% 125% 150% 175% 200% Q4-07 Q4-08 Q4-09 Q4-10 Q4-11 Q4-12 Q4-13 Q4-14 Q4-15 Q4-16 HGV WYN INDUSTRY VAC SVO12016 HGV VACILG1 2WYN Contract Sales ($ millions) 1,172 7243472,012 Fee-for-service Sales Mix 56% 0%0%3% Net Owner Growth 8% (2%)0%(1%)
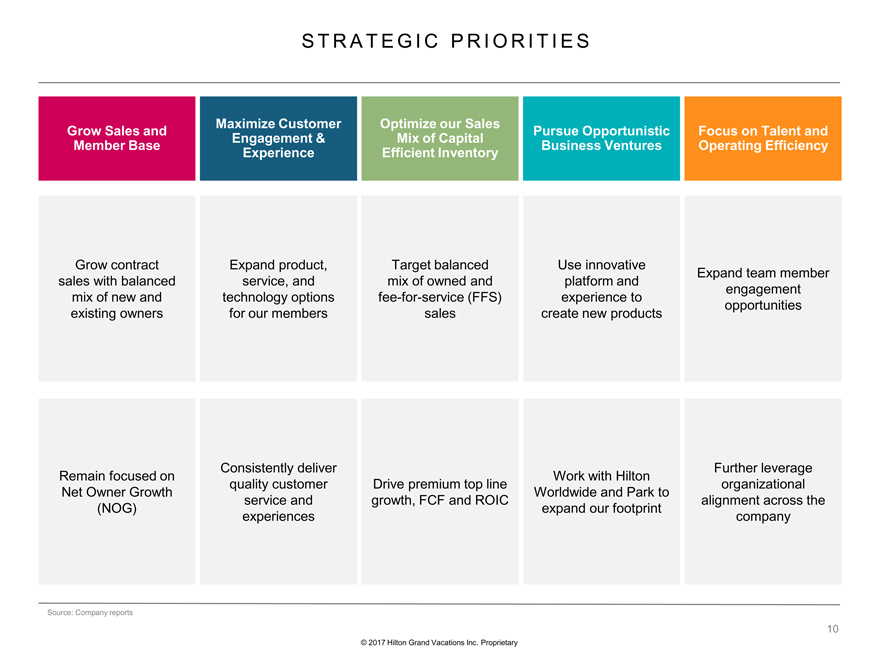
STRATEGIC PRIORITIES © 2017 Hilton Grand Vacations Inc. Proprietary Source: Company reports Grow contract sales with balanced mix of new and existing owners Grow Sales and Member Base Remain focused on Net Owner Growth (NOG) Maximize Customer Engagement & Experience Expand product, service, and technology options for our members Consistently deliver quality customer service and experiences Optimize our Sales Mix of Capital Efficient Inventory Target balanced mix of owned and fee-for-service (FFS) sales Drive premium top line growth, FCF and ROIC Pursue Opportunistic Business Ventures Use innovative platform and experience to create new products Work with Hilton Worldwide and Park to expand our footprint Focus on Talent and Operating Efficiency Expand team member engagement opportunities Further leverage organizational alignment across the company10
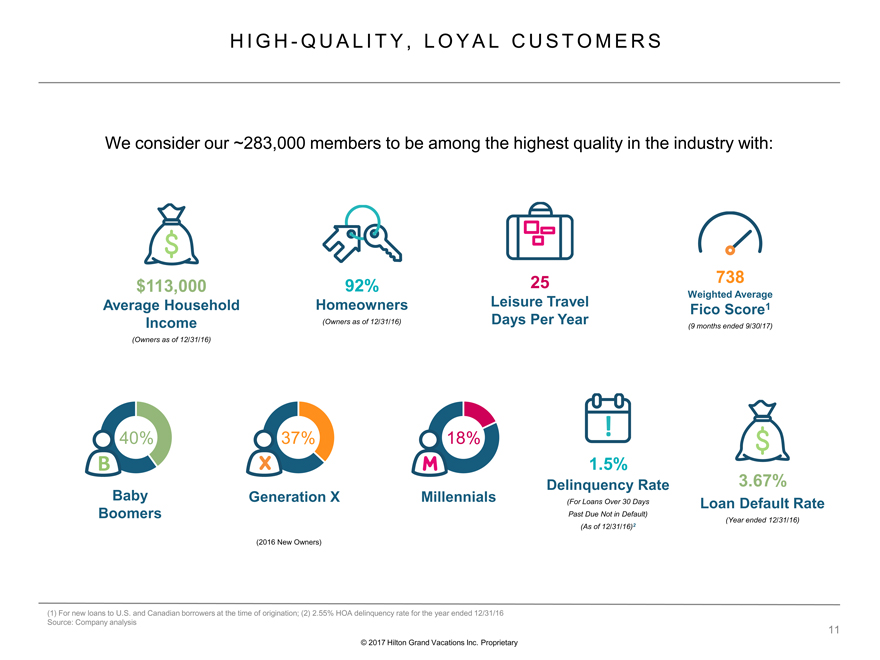
HIGH-QUAL I T Y, LOYAL CUSTOMERS © 2017 Hilton Grand Vacations Inc. Proprietary We consider our ~283,000 members to be among the highest quality in the industry with: 92% Homeowners (Owners as of 12/31/16) $113,000 Average Household Income (Owners as of 12/31/16) 25 Leisure Travel Days Per Year Baby Boomers Millennials Generation X (2016 New Owners) 738 Weighted Average Fico Score1 (9 months ended 9/30/17) 1.5% Delinquency Rate (For Loans Over 30 Days Past Due Not in Default) (As of 12/31/16)2 3.67% Loan Default Rate (Year ended 12/31/16) (1) For new loans to U.S. and Canadian borrowers at the time of origination; (2) 2.55% HOA delinquency rate for the year ended 12/31/16 Source: Company analysis 40% 37% 18%11
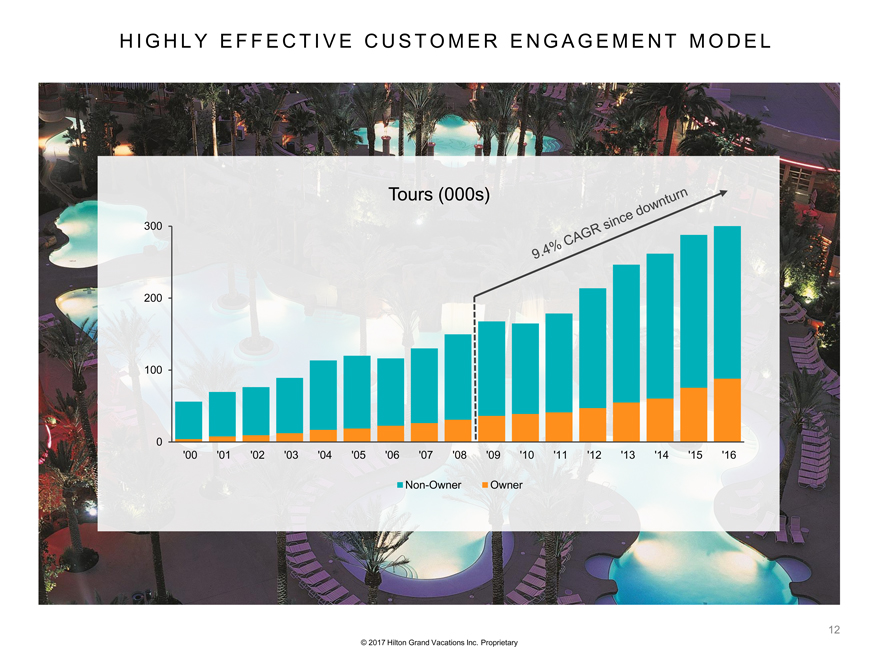
HIGHLY EFFECTIVE CUSTOMER ENGAGEMENT MODEL © 2017 Hilton Grand Vacations Inc. Proprietary Tours (000s) 0 100 200 300 ‘00 ‘01 ‘02 ‘03 ‘04 ‘05 ‘06 ‘07 ‘08 ‘09 ‘10 ‘11 ‘12 ‘13 ‘14 ‘15 ‘16 Non-Owner Owner12
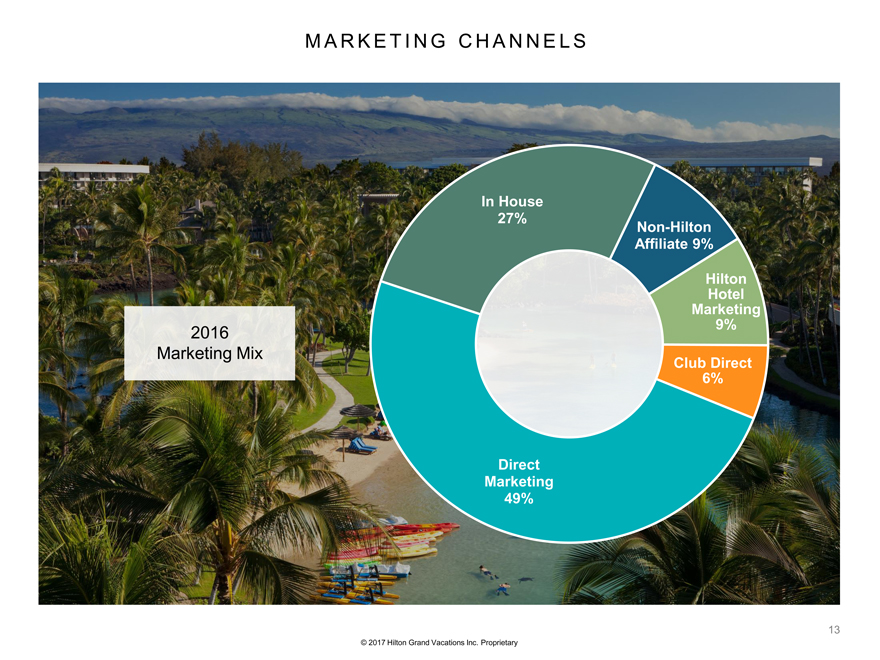
MARKETINGCHANNELS © 2017 Hilton Grand Vacations Inc. Proprietary 2016 Marketing Mix Direct Marketing49% In House27% Non-Hilton Affiliate9% Hilton Hotel Marketing9% Club Direct6%13
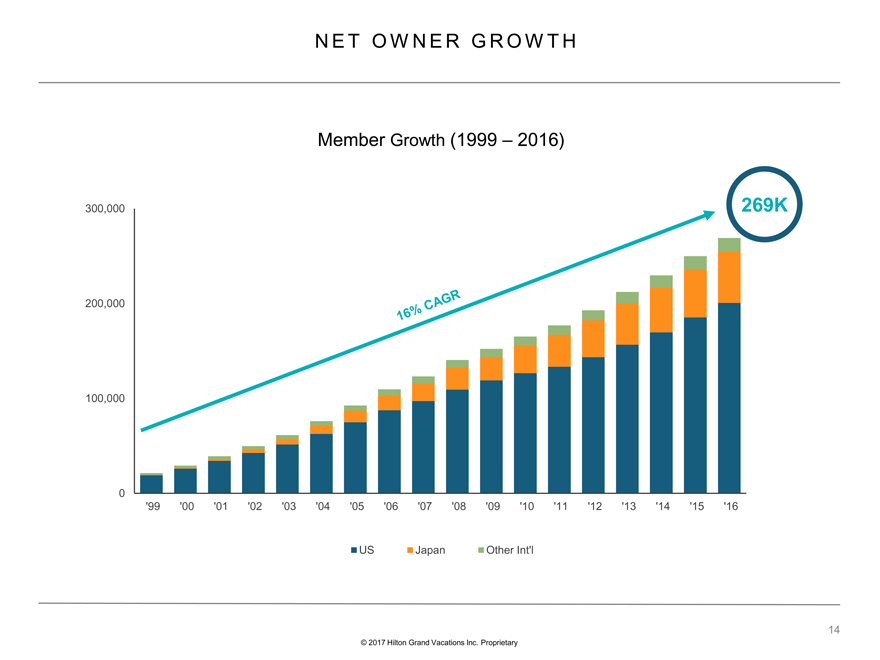
NET OWNER GROWTH © 2017 Hilton Grand Vacations Inc. Proprietary Member Growth(1999 –2016) 0 100,000 200,000 300,000 ‘99 ‘00 ‘01 ‘02 ‘03 ‘04 ‘05 ‘06 ‘07 ‘08 ‘09 ‘10 ‘11 ‘12 ‘13 ‘14 ‘15 ‘16 US Japan Other Int’l 269K14
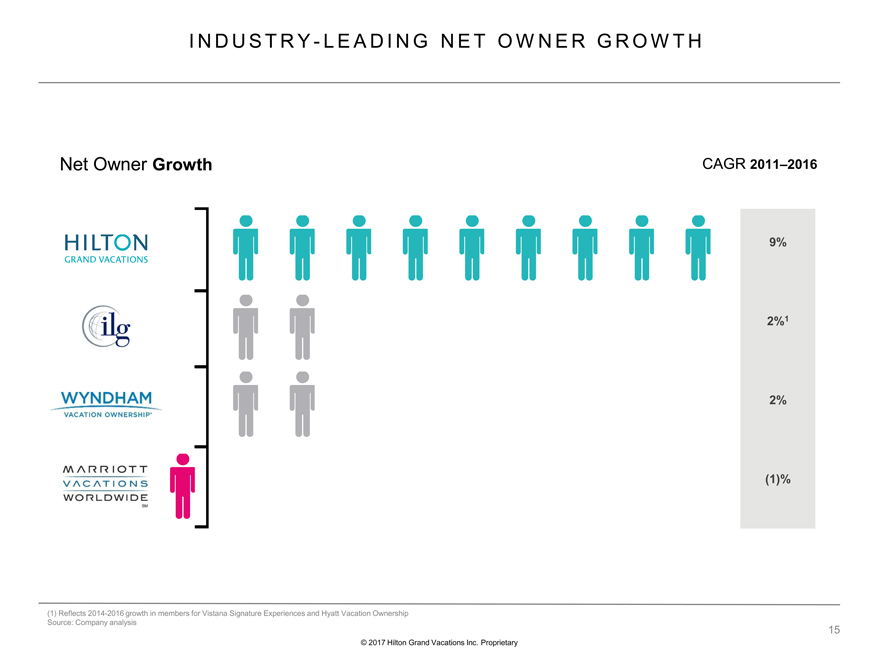
INDUSTRY- LE ADING NET OWNER GROWTH © 2017 Hilton Grand Vacations Inc. Proprietary (1) Reflects 2014-2016 growth in members for Vistana Signature Experiences and Hyatt Vacation Ownership Source: Company analysis 2%1 2% (1)% 9% CAGR 2011–2016 Net Owner Growth 15 HILTON GRAND VACATIONS WYNDHAM VACATION OWNERSHIP
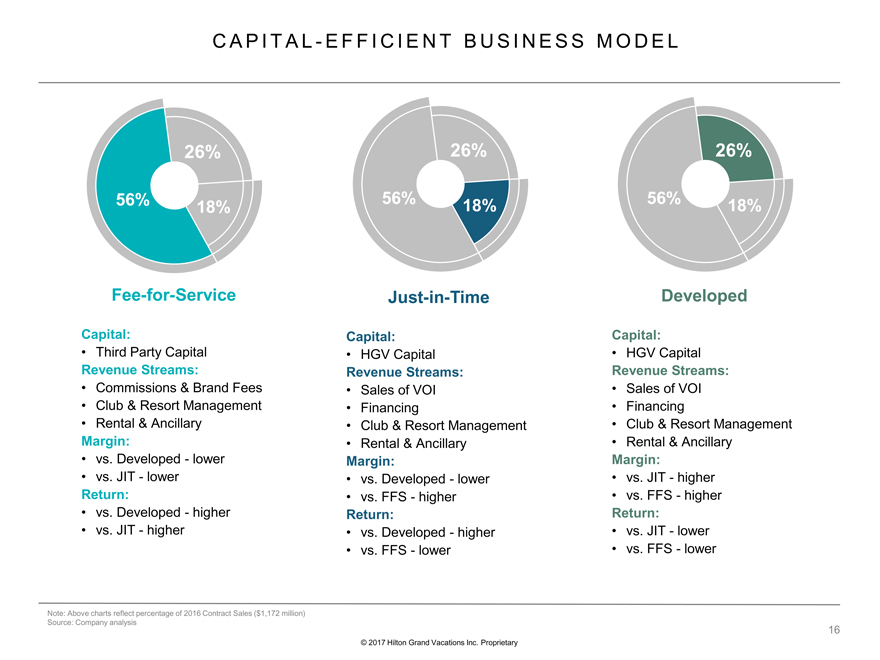
CAPITAL-EFFICIENT BUSINESS MODEL © 2017 Hilton Grand Vacations Inc. Proprietary Developed Capital: •HGV Capital Revenue Streams: •Sales of VOI •Financing •Club & Resort Management •Rental & Ancillary Margin: •vs. JIT -higher •vs. FFS -higher Return: •vs. JIT -lower •vs. FFS -lower Just-in-Time Capital: •HGV Capital Revenue Streams: •Sales of VOI •Financing •Club & Resort Management •Rental & Ancillary Margin: •vs. Developed -lower •vs. FFS -higher Return: •vs. Developed -higher •vs. FFS -lower Fee-for-Service Capital: •Third Party Capital Revenue Streams: •Commissions & Brand Fees •Club & Resort Management •Rental & Ancillary Margin: •vs. Developed -lower •vs. JIT -lower Return: •vs. Developed -higher •vs. JIT -higher 56% 26% 18% 56% 26% 18% 56% 26% 18% Note: Above charts reflect percentage of 2016 Contract Sales ($1,172 million) Source: Company analysis16
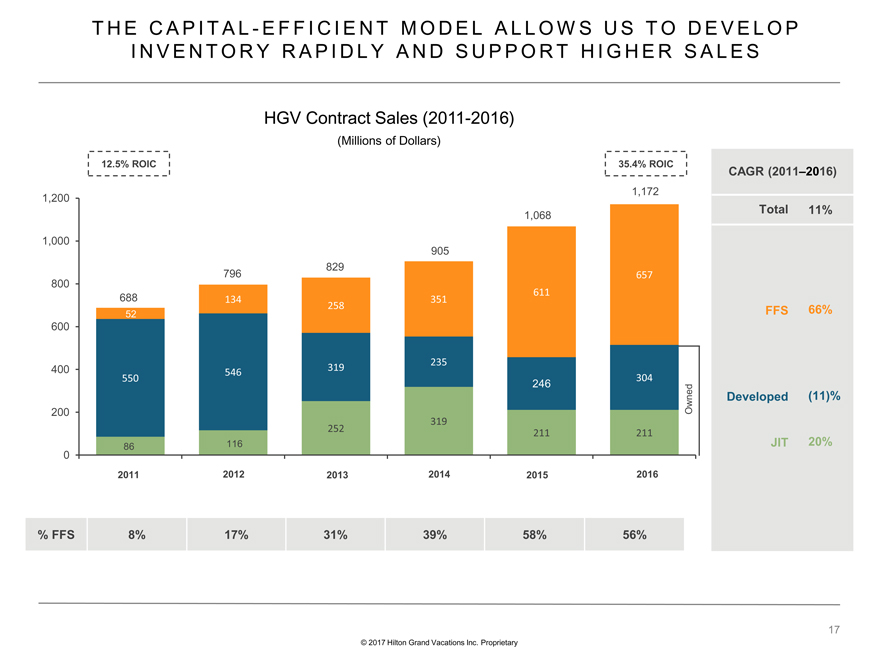
THE CAPITAL-EFFICIENT MODEL ALLOWS US TO DEVELOP INVENTORY RAPIDLY AND SUPPORT HIGHER SALES © 2017 Hilton Grand Vacations Inc. Proprietary HGV Contract Sales (2011-2016) (Millions of Dollars) CAGR (2011–2016) 66% (11)% 20% Developed FFS JIT Total 11% 252 319 211 211 550 546 319 235 246 304 134 258 351 611 657 0 200 400 600 800 1,000 1,200 2011 52 688 86 116 2015 829 2014 2012 796 905 2013 1,068 12.5% ROIC 35.4% ROIC Owned% FFS 8% 17%31%39%58%56%
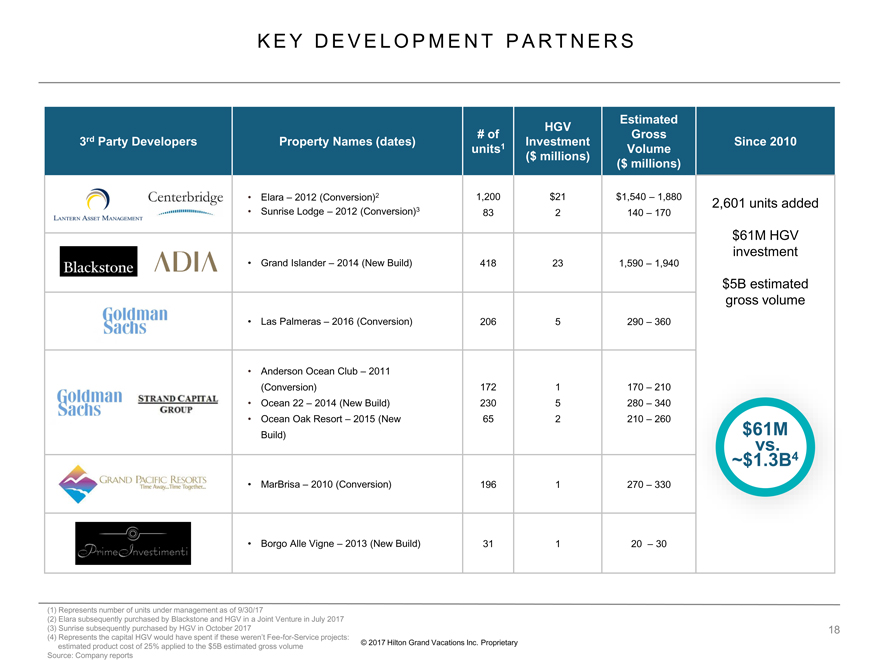
3rdParty Developers Property Names (dates) # ofunits1HGV Investment($ millions)Estimated Gross Volume ($ millions)Since 2010 •Elara –2012 (Conversion)2 •Sunrise Lodge –2012 (Conversion)3 1,20083$212$1,540 –1,880140 –1702,601 units added $61M HGV investment $5B estimated gross volume •Grand Islander –2014 (New Build) 418231,590 –1,940 •Las Palmeras–2016 (Conversion) 2065290 –360 •Anderson Ocean Club –2011(Conversion) •Ocean 22 –2014 (New Build) •Ocean Oak Resort –2015 (New Build) 17223065152170 –210 280 –340 210 –260 •MarBrisa–2010 (Conversion) 1961270 –330 •Borgo AlleVigne–2013 (New Build) 31120 –30

FINANCIAL STRENGTHS © 2017 Hilton Grand Vacations Inc. Proprietary
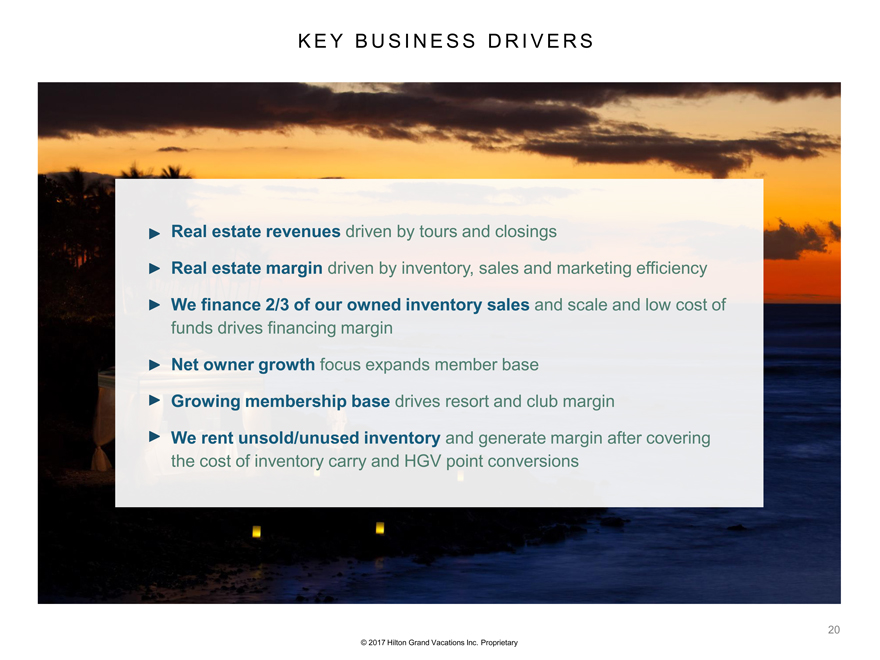
KEY BUSINESS DRIVERS © 2017 Hilton Grand Vacations Inc. Proprietary Real estate revenues driven by tours and closings Real estate margin driven by inventory, sales and marketing efficiency We finance 2/3 of our owned inventory sales and scale and low cost of funds drives financing margin Net owner growth focus expands member base Growing membership base drives resort and club margin We rent unsold/unused inventory and generate margin after covering the cost of inventory carry and HGV point conversions20
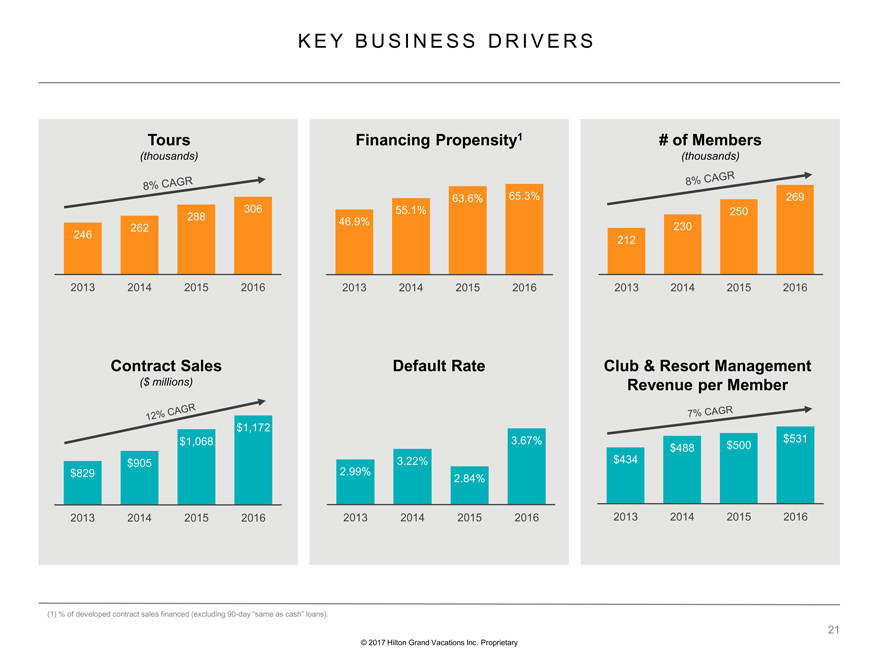
KEY BUSINESS DRIVERS © 2017 Hilton Grand Vacations Inc. Proprietary (1) % of developed contract sales financed (excluding 90-day “same as cash” loans). 2.99% 3.22% 2.84% 3.67% 2013 2014 2015 2016 Tours (thousands) Financing Propensity1 # of Members (thousands) Contract Sales ($ millions) Default Rate Club & Resort Management Revenue per Member 212 230 250 269 2013 2014 2015 2016 $829 $905 $1,068 $1,172 2013 2014 2015 2016 $434 $488 $500 $531 2013 2014 2015 2016 46.9% 55.1% 63.6% 65.3% 2013 2014 2015 2016 246 262 288 306 2013 2014 2015 201621
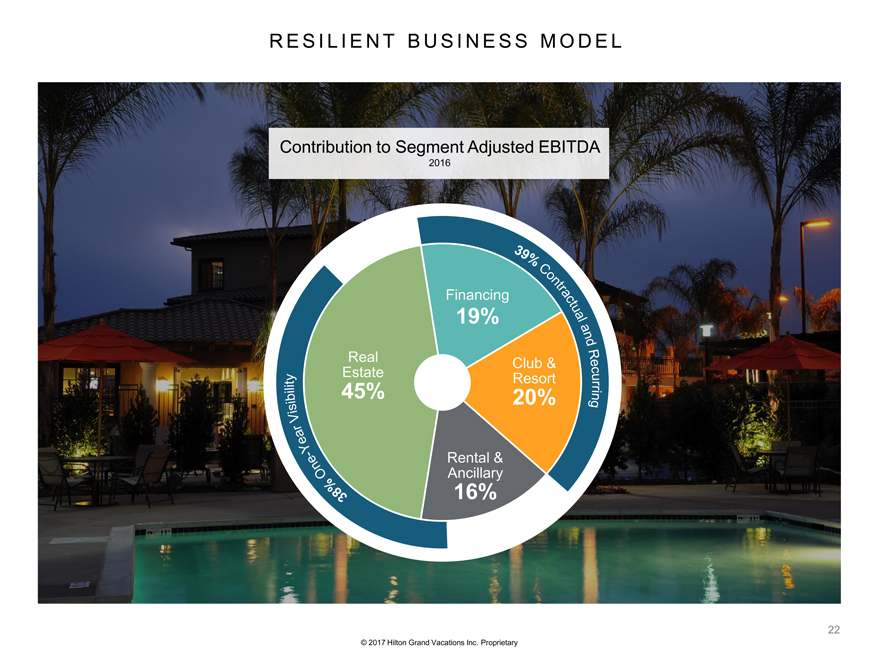
Real Estate45% Financing19% Club & Resort20% Rental & Ancillary16% RESILIENTBUSINESS MODEL © 2017 Hilton Grand Vacations Inc. Proprietary Contribution to Segment Adjusted EBITDA 201622
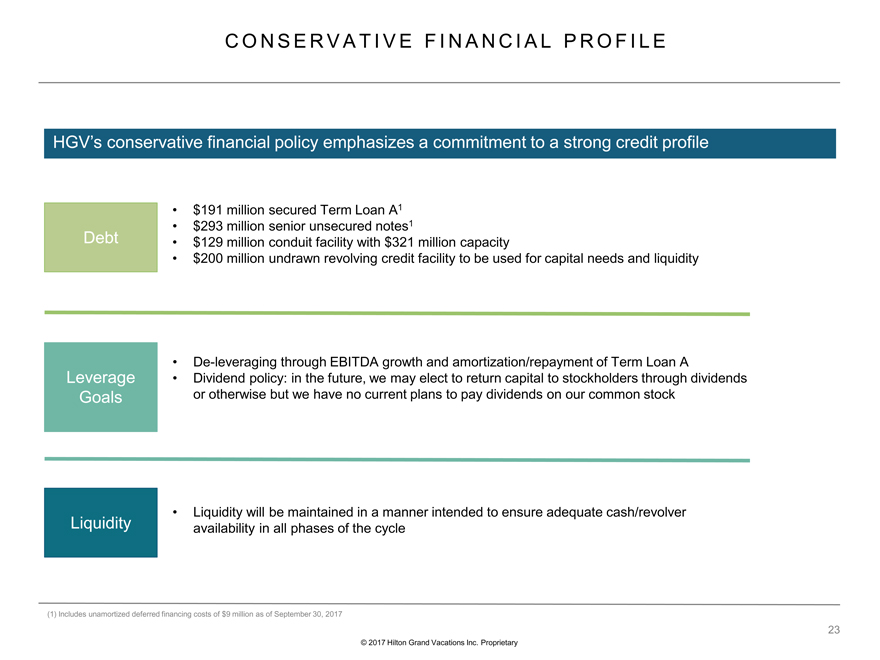
CONSERVATIVE FINANCIAL PROFILE HGV’s conservative financial policy emphasizes a commitment to a strong credit profile Leverage Goals Liquidity Debt •Liquidity will be maintained in a manner intended to ensure adequate cash/revolver availability in all phases of the cycle •De-leveraging through EBITDA growth and amortization/repayment of Term Loan A •Dividend policy: in the future, we may elect to return capital to stockholders through dividends or otherwise but we have no current plans to pay dividends on our common stock •$191 million secured Term Loan A1 •$293 million senior unsecured notes1 •$129 million conduit facility with $321 million capacity •$200 million undrawn revolving credit facility to be used for capital needs and liquidity (1) Includes unamortized deferred financing costs of $9 million as of September 30, 2017 © 2017 Hilton Grand Vacations Inc. Proprietary23
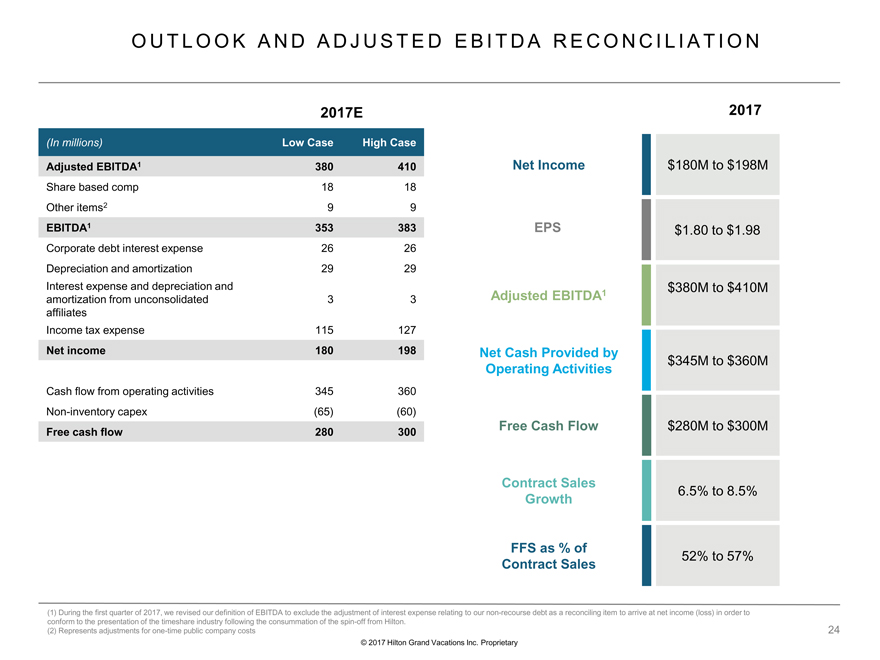
Net Income $180M to $198M Adjusted EBITDA1 $380M to $410M Net Cash Provided by Operating Activities $345M to $360M Free Cash Flow $280M to $300M Contract Sales Growth 6.5% to 8.5% FFS as % of Contract Sales 52% to 57% 2017 EPS $1.80 to $1.98 OUTLOOK AND ADJUSTED EBITDARECONCILIATION © 2017 Hilton Grand Vacations Inc. Proprietary (1)During the first quarter of 2017, we revised our definition of EBITDA to exclude the adjustment of interest expense relating toour non-recourse debt as a reconciling item to arrive at net income (loss) in order to conform to the presentation of the timeshare industry following the consummation of the spin-off from Hilton. (2)Represents adjustments for one-time public company costs 2017E (In millions) LowCase High Case Adjusted EBITDA1380410 Share based comp1818 Other items299 EBITDA1353383 Corporate debt interest expense2626 Depreciation and amortization2929 Interestexpense and depreciation and amortization from unconsolidated affiliates33 Income taxexpense115127 Net income180198 Cash flowfrom operating activities345360 Non-inventorycapex(65)(60) Free cash flow280300
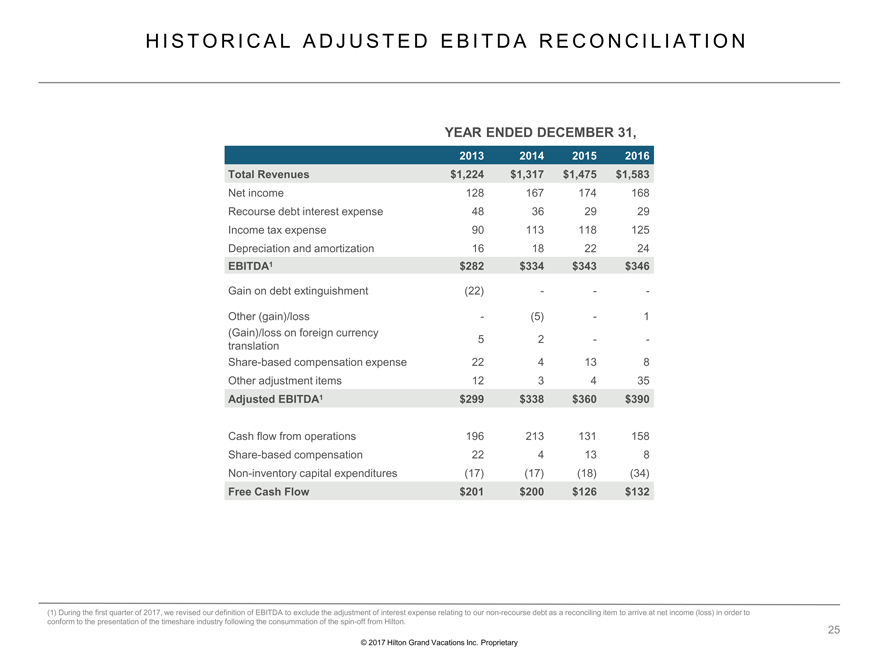
HISTORICAL ADJUSTED EBITDARECONCILIATION © 2017 Hilton Grand Vacations Inc. Proprietary YEAR ENDED DECEMBER 31, 2013 2014 20152016 Total Revenues$1,224 $1,317 $1,475 $1,583 Net income128 167 174 168 Recourse debt interest expense48 36 29 29 Income tax expense90 113 118 125 Depreciation and amortization16 18 22 24 EBITDA1$282 $334 $343 $346 Gain on debt extinguishment(22)--- Other (gain)/loss-(5)-1 (Gain)/loss on foreign currency translation5 2 -- Share-based compensation expense22 4 13 8 Other adjustment items12 3 4 35 Adjusted EBITDA1$299 $338 $360 $390 Cash flow from operations196 213 131 158 Share-based compensation22 4 13 8 Non-inventory capital expenditures(17)(17)(18)(34) Free Cash Flow$201 $200 $126 $132
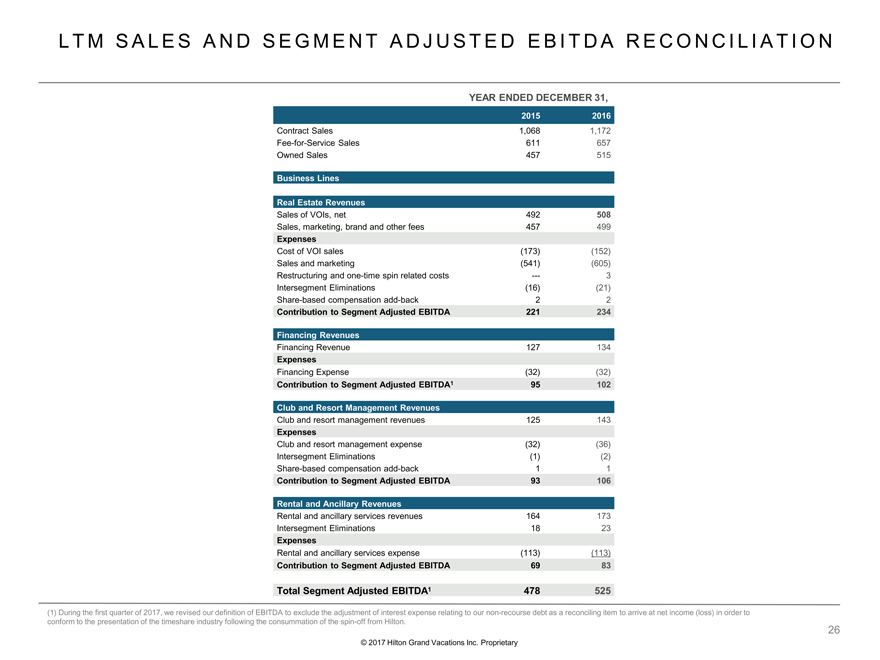
LTM SALES AND SEGMENT ADJUSTED EBITDARECONCILIATION © 2017 Hilton Grand Vacations Inc. Proprietary YEAR ENDED DECEMBER 31, 2015 2016 Contract Sales 1,068 1,172 Fee-for-Service Sales611 657 Owned Sales457 515 Business Lines Real Estate Revenues Sales of VOIs, net492 508 Sales, marketing, brand and other fees457 499 Expenses Cost of VOI sales(173)(152) Sales and marketing(541)(605) Restructuringand one-time spin related costs—-3 Intersegment Eliminations(16)(21) Share-based compensation add-back2 2 Contribution to Segment Adjusted EBITDA221 234 Financing Revenues Financing Revenue127 134 Expenses Financing Expense(32) (32) Contribution to Segment Adjusted EBITDA195102 Club and Resort Management Revenues Club and resort management revenues125 143 Expenses Club and resort management expense(32)(36) Intersegment Eliminations(1)(2) Share-based compensation add-back1 1 Contribution to Segment Adjusted EBITDA93 106 Rental and Ancillary Revenues Rental and ancillary services revenues164 173 Intersegment Eliminations18 23 Expenses Rental and ancillary services expense(113)(113) Contribution to Segment Adjusted EBITDA69 83 Total Segment Adjusted EBITDA1478525
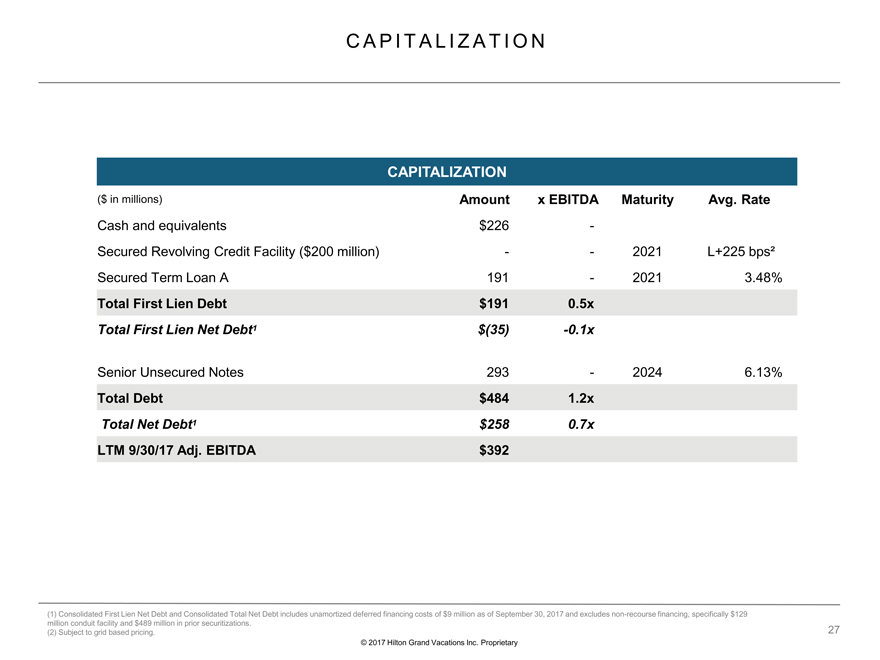
CAPITALIZATION (1) Consolidated First Lien Net Debt and Consolidated Total Net Debt includes unamortized deferred financing costs of $9 millionas of September 30, 2017 and excludes non-recourse financing, specifically $129 million conduit facility and $489 million in prior securitizations. (2) Subject to grid based pricing. © 2017 Hilton Grand Vacations Inc. ProprietaryCAPITALIZATION ($ in millions) Amount x EBITDAMaturityAvg. Rate Cash and equivalents$226 - Secured Revolving Credit Facility ($200 million)--2021L+225 bps² Secured Term Loan A191 -20213.48% Total First Lien Debt$191 0.5x Total First Lien Net Debt1$(35)-0.1x Senior Unsecured Notes293 -20246.13% Total Debt$484 1.2x Total Net Debt1$258 0.7x LTM 9/30/17 Adj. EBITDA$392
© 2017 Hilton Grand Vacations Inc. Proprietary HILTON GRAND VACATIONS