Attached files
| file | filename |
|---|---|
| 8-K - 8-K - BlueLinx Holdings Inc. | november2017investorpresen.htm |

BlueLinx
Investor Presentation
November 16, 2017

This presentation includes “forward-looking statements” within the meaning of the Private Securities Litigation Reform
Act of 1995. All of these forward-looking statements are based on estimates and assumptions made by our management
that, although believed by us to be reasonable, are inherently uncertain. Forward-looking statements involve risks and
uncertainties, including, but not limited to, economic, competitive, governmental and technological factors outside of our
control, that may cause our business, strategy or actual results to differ materially from the forward-looking statements.
These risks and uncertainties may include, among other things: changes in the prices, supply and/or demand for
products that it distributes; inventory management and commodities pricing; new housing starts and inventory levels of
existing homes for sale; general economic and business conditions in the United States; acceptance by our customers of
our privately branded products; financial condition and creditworthiness of our customers; supply from our key vendors;
reliability of the technologies we utilize; the activities of competitors, including consolidation of our competitors; changes
in significant operating expenses; fuel costs; risk of losses associated with accidents; exposure to product liability claims;
changes in the availability of capital and interest rates; adverse weather patterns or conditions; acts of cyber intrusion;
variations in the performance of the financial markets, including the credit markets; and other factors described in the
“Risk Factors” section in the Form S-3 filed with the Securities and Exchange Commission (“SEC”) on August 28, 2017
and the related prospectus supplement filed with the SEC on October 19, 2017, and in the Company’s Annual Report on
Form 10-K for the year ended December 31, 2016, its quarterly Reports on Form 10-Q, and in its periodic reports filed
with the SEC from time to time. Given these risks and uncertainties, you are cautioned not to place undue reliance on
forward-looking statements. Unless otherwise indicated, all forward-looking statements are as of the date they are made,
and we undertake no obligation to update these forward-looking statements, whether as a result of new information, the
occurrence of future events, or otherwise.
Some of the forward-looking statements discuss the company’s plans, strategies, expectations and intentions. They use
words such as “expects”, “may”, “will”, “believes”, “should”, “approximately”, “anticipates”, “estimates”, “outlook”,
and “plans”, and other variations of these and similar words, and one or more of which may be used in a positive or
negative context.
Immaterial Rounding Differences - Immaterial rounding adjustments and differences may exist between slides, press
releases, and previously issued presentations.
Forward-Looking Statements
2

BlueLinx reports its financial results in accordance with accounting principles generally accepted in the United States (“GAAP”). The Company
also believes that presentation of certain non-GAAP measures may be useful to investors. Any non-GAAP measures used herein are reconciled to
the financial tables set forth in the appendices hereto. The Company cautions that non-GAAP measures should be considered in addition to, but
not as a substitute for, the Company’s reported GAAP results.
We define Adjusted EBITDA as an amount equal to net income plus interest expense and all interest expense related items, income taxes,
depreciation and amortization, and further adjusted to exclude certain non-cash items and other adjustments to Consolidated Net Income.
Further, we also exclude, as an additional measure, the effects of the operational efficiency initiatives, to determine same-center (comparable)
Adjusted EBITDA, which is useful for period over period comparability.
We present Adjusted EBITDA (and the exclusion of the effects of the operational efficiency initiatives) because it is a primary measure used by
management to evaluate operating performance and, we believe, helps to enhance investors’ overall understanding of the financial performance
and cash flows of our business. However, Adjusted EBITDA is not a presentation made in accordance with GAAP, and is not intended to present
a superior measure of the financial condition from those determined under GAAP. Adjusted EBITDA, as used herein, is not necessarily
comparable to other similarly titled captions of other companies due to differences in methods of calculation. We believe Adjusted EBITDA is
helpful in highlighting operating trends. We also believe that Adjusted EBITDA is frequently used by securities analysts, investors and other
interested parties in their evaluation of companies, many of which present an Adjusted EBITDA measure when reporting their results. We
compensate for the limitations of using non-GAAP financial measures by using them to supplement GAAP results to provide a more complete
understanding of the factors and trends affecting the business than using GAAP results alone.
We define the non-GAAP metrics of adjusted same-center (comparable) net sales and adjusted same-center (comparable) gross profit as net sales
and gross profit excluding the effects of both closed facilities and the inventory rationalization initiative. These measures are not a presentation
made in accordance with GAAP, and are not intended to present a superior measure of the financial condition from those determined under
GAAP. Adjusted same-center net sales and adjusted same-center gross profit, as used herein, are not necessarily comparable to other similarly
titled captions of other companies due to differences in methods of calculation.
We believe adjusted same-center net sales and adjusted same-center gross profit are helpful in presenting comparability across periods without
the full-year effect of our operational efficiency initiatives. We also believe that these non-GAAP metrics are used by securities analysts, investors,
and other interested parties in their evaluation of our company, to illustrate the effects of these initiatives. We compensate for the limitations of
using non-GAAP financial measures by using them to supplement GAAP results to provide a more complete understanding of the factors and
trends affecting the business than using GAAP results alone.
We believe supplementary GAAP-based information such as operating working capital and debt principal are helpful to investors in explaining
the impacts of our operating efficiencies. Operating working capital is defined as current assets less current liabilities plus the current portion of
long-term debt. Operating working capital is an important measure we use to determine the efficiencies of our operations and our ability to
readily convert assets into cash. Debt principal is defined as the principal amount of debt payable at the stated period-end date and is used by
management to monitor our progress in meeting our goals to reduce the debt on our balance sheet.
Non-GAAP Financial Measures
3
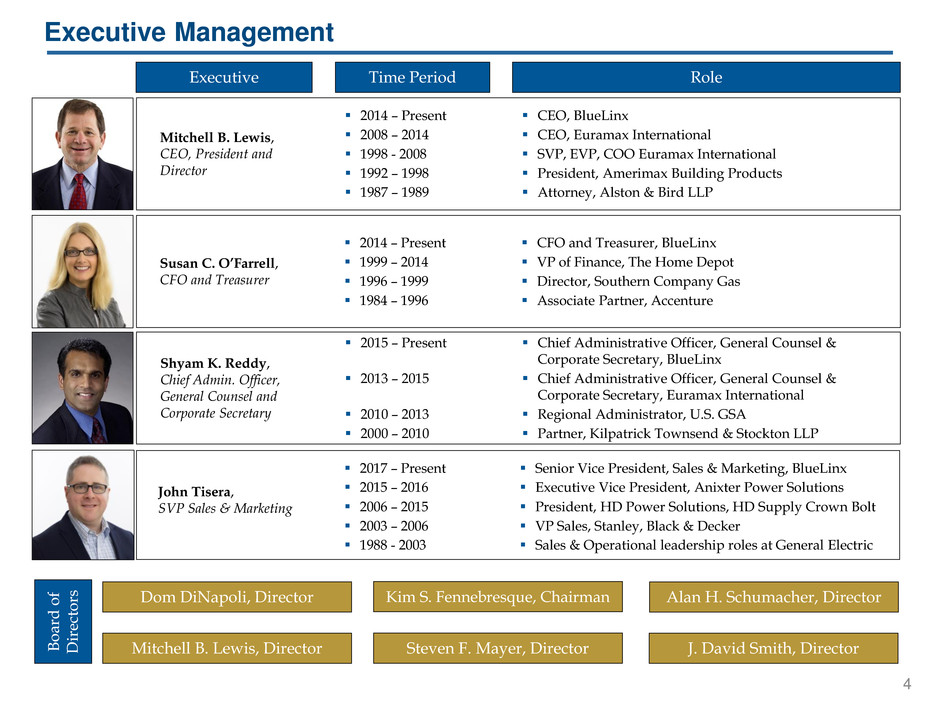
Executive Management
4
Executive Time Period Role
Mitchell B. Lewis,
CEO, President and
Director
2014 – Present
2008 – 2014
1998 - 2008
1992 – 1998
1987 – 1989
CEO, BlueLinx
CEO, Euramax International
SVP, EVP, COO Euramax International
President, Amerimax Building Products
Attorney, Alston & Bird LLP
Susan C. O’Farrell,
CFO and Treasurer
2014 – Present
1999 – 2014
1996 – 1999
1984 – 1996
CFO and Treasurer, BlueLinx
VP of Finance, The Home Depot
Director, Southern Company Gas
Associate Partner, Accenture
Shyam K. Reddy,
Chief Admin. Officer,
General Counsel and
Corporate Secretary
2015 – Present
2013 – 2015
2010 – 2013
2000 – 2010
Chief Administrative Officer, General Counsel &
Corporate Secretary, BlueLinx
Chief Administrative Officer, General Counsel &
Corporate Secretary, Euramax International
Regional Administrator, U.S. GSA
Partner, Kilpatrick Townsend & Stockton LLP
Boa
rd of
D
ir
ect
o
rs
Dom DiNapoli, Director Kim S. Fennebresque, Chairman
Mitchell B. Lewis, Director
Alan H. Schumacher, Director
J. David Smith, Director Steven F. Mayer, Director
John Tisera,
SVP Sales & Marketing
2017 – Present
2015 – 2016
2006 – 2015
2003 – 2006
1988 - 2003
Senior Vice President, Sales & Marketing, BlueLinx
Executive Vice President, Anixter Power Solutions
President, HD Power Solutions, HD Supply Crown Bolt
VP Sales, Stanley, Black & Decker
Sales & Operational leadership roles at General Electric

BlueLinx Overview
BlueLinx operates 39 warehouses across the central and
eastern United States with approximately 1,600 employees
Revenue generated from the sale of structural and
specialty products
Structural and specialty products are utilized in home
construction
The company offers over 10,000 branded and private-
label products
BlueLinx also provides a wide-range of value-added
services, including:
Milling & fabrication services
“Less-than-truckload” delivery services
Inventory stocking & automated order processing
Backhaul services
Several end markets including new residential and light
commercial construction, industrial OEM, and residential
repair & remodel
Bluelinx’s product suite provides a “one-stop” shopping
experience for its customers
Denotes corporate headquarters in Atlanta, Georgia
NATIONAL FOOTPRINT
STRUCTURAL PRODUCTS
Representative
Products
Lumber
Plywood
Rebar
Remesh
Oriented Strand Board
SPECIALTY PRODUCTS
Representative
Products
Outdoor Living
Particle Board
Insulation
Moulding
Roofing & Siding
Engineered Lumber
5

Diversified Customer Base
Industrial
Manufacturers
Makers of furniture,
sheds, crates and other
wood-based products
Regional
Dealers
Contractors, builders,
renovators and other
end-users
National
Dealers
Contractors, builders,
renovators and other
end-users
Home Improvement
Centers
Retailers with national
scale
Manufactured
Housing
Makers of mobile
homes, prefab homes
and RVs
BlueLinx has an extensive roster of high-quality national and regional customers
6
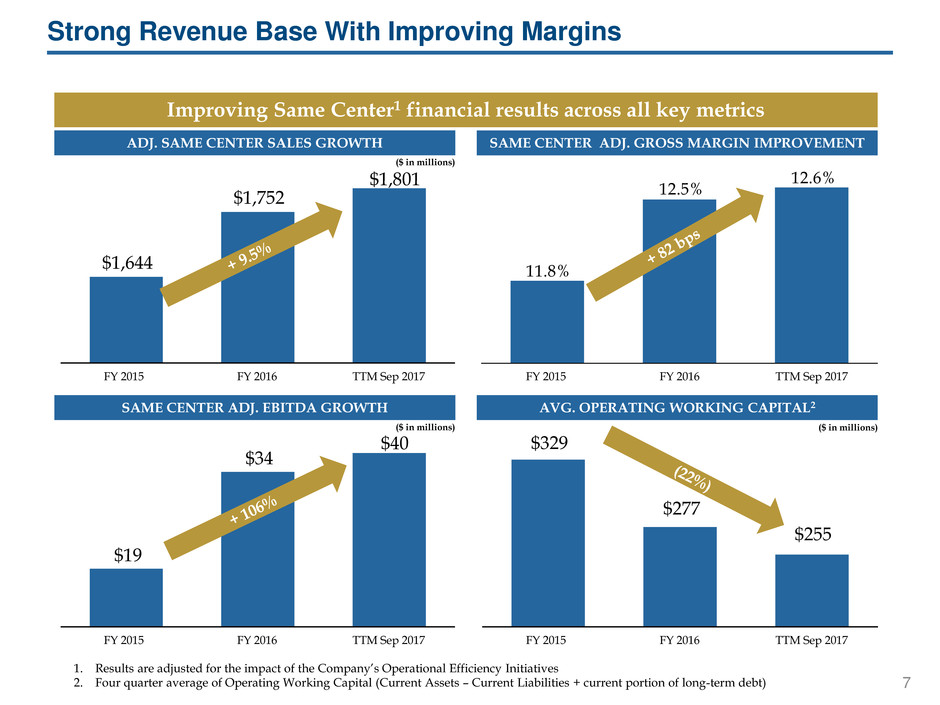
Strong Revenue Base With Improving Margins
1. Results are adjusted for the impact of the Company’s Operational Efficiency Initiatives
2. Four quarter average of Operating Working Capital (Current Assets – Current Liabilities + current portion of long-term debt)
Improving Same Center1 financial results across all key metrics
$1,644
$1,752
$1,801
FY 2016 TTM Sep 2017 FY 2015
ADJ. SAME CENTER SALES GROWTH
12.6%
12.5%
11.8%
FY 2016 TTM Sep 2017 FY 2015
SAME CENTER ADJ. GROSS MARGIN IMPROVEMENT
$19
$34
$40
TTM Sep 2017 FY 2015 FY 2016
SAME CENTER ADJ. EBITDA GROWTH
$329
$277
$255
FY 2016 TTM Sep 2017 FY 2015
AVG. OPERATING WORKING CAPITAL2
($ in millions)
($ in millions) ($ in millions)
7
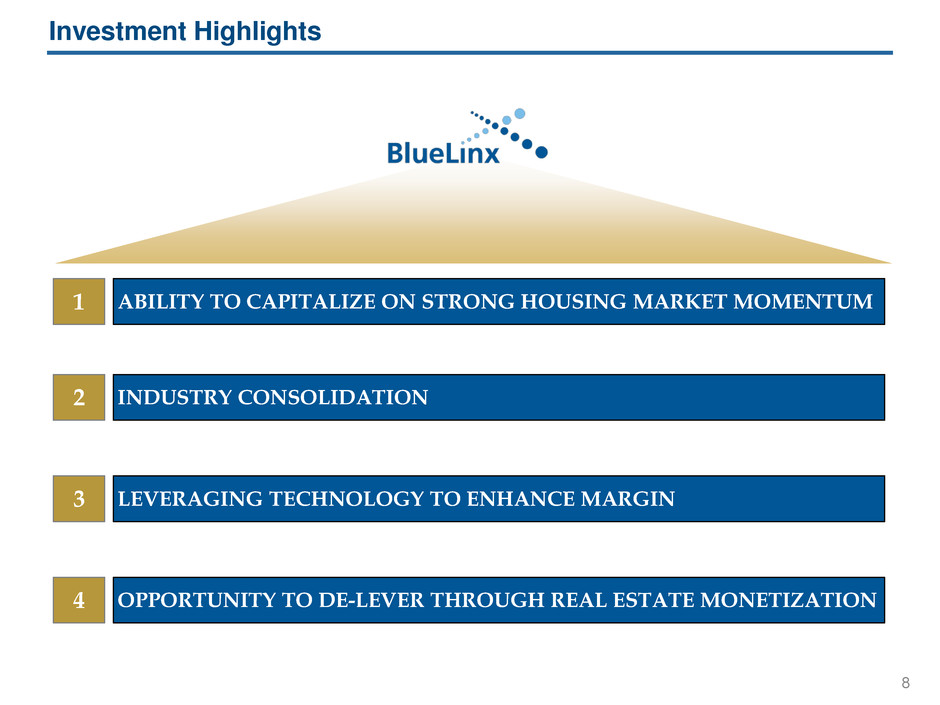
Investment Highlights
OPPORTUNITY TO DE-LEVER THROUGH REAL ESTATE MONETIZATION 4
INDUSTRY CONSOLIDATION 2
LEVERAGING TECHNOLOGY TO ENHANCE MARGIN 3
ABILITY TO CAPITALIZE ON STRONG HOUSING MARKET MOMENTUM 1
8
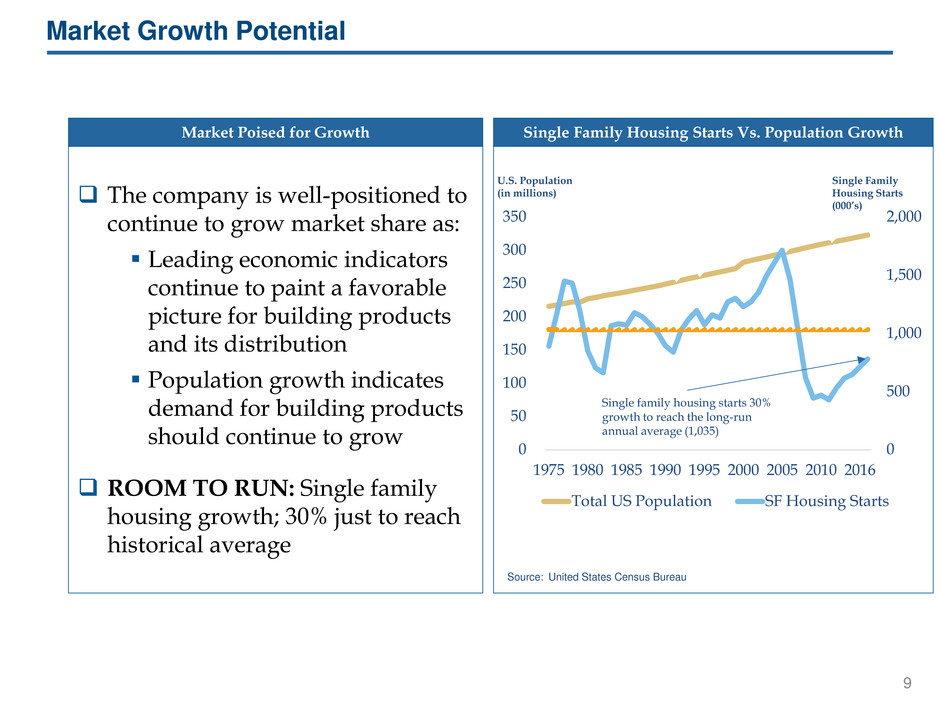
Market Growth Potential
Source: United States Census Bureau
Single Family Housing Starts Vs. Population Growth
0
500
1,000
1,500
2,000
0
50
100
150
200
250
300
350
1975 1980 1985 1990 1995 2000 2005 2010 2016
Total US Population SF Housing Starts
U.S. Population
(in millions)
Single Family
Housing Starts
(000’s)
Single family housing starts 30%
growth to reach the long-run
annual average (1,035)
The company is well-positioned to
continue to grow market share as:
Leading economic indicators
continue to paint a favorable
picture for building products
and its distribution
Population growth indicates
demand for building products
should continue to grow
ROOM TO RUN: Single family
housing growth; 30% just to reach
historical average
Market Poised for Growth
9

Ma
n
u
factu
re
s
Weyerhaeuser / Plum Creek
Boise Cascade / Wood
Products LLC
Boise Cascade / Georgia
Pacific EWP
West Fraser / Gilman
Canfor / Anthony Forest
Products
Norbord / Ainsworth
Benefits of Consolidation
BXC benefits from wholesale distribution consolidation in a number of ways
Enables BXC to capture market share through market disruption
Greater institutional involvement in the space
Relevance to manufacturers is enhanced
Tw
o
-S
te
p
D
ist
ri
b
u
to
rs
US Lumber / Madison
Dearborn Partners
NILCO / Platinum Equity
US Lumber / NILCO
Lumbe
ry
a
rds
/
R
et
a
il
er
s
BMC / Stock Building
Supply
Builders FirstSource /
ProBuild
US LBM / Ridout Lumber
Recent Consolidation
Industry Consolidation
10
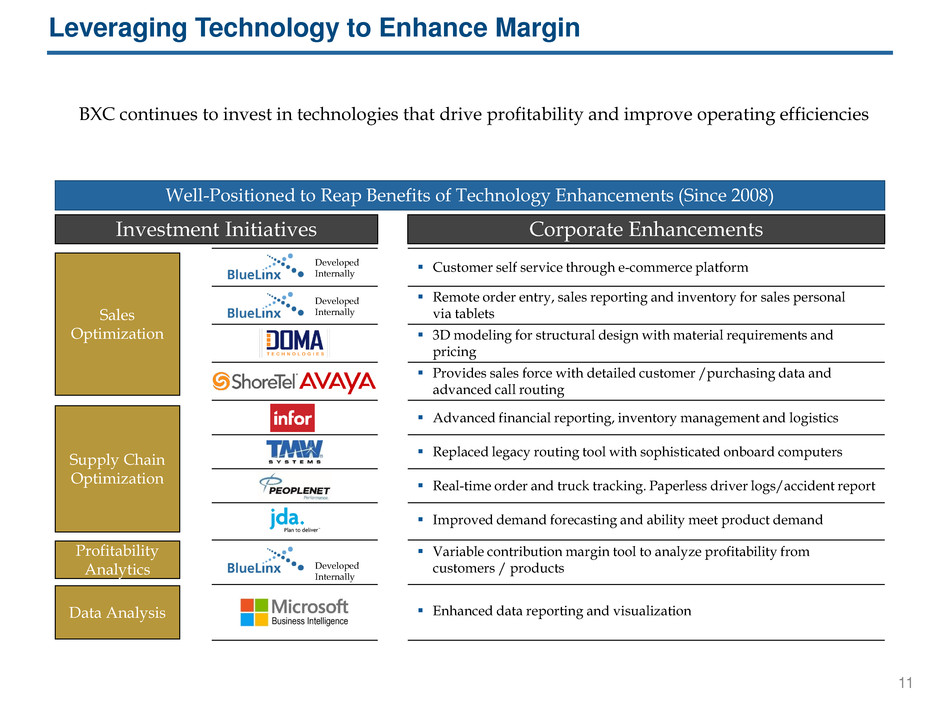
Developed
Internally
Well-Positioned to Reap Benefits of Technology Enhancements (Since 2008)
Investment Initiatives Corporate Enhancements
Data Analysis
Sales
Optimization
Profitability
Analytics
Replaced legacy routing tool with sophisticated onboard computers
3D modeling for structural design with material requirements and
pricing
Variable contribution margin tool to analyze profitability from
customers / products
Remote order entry, sales reporting and inventory for sales personal
via tablets
Customer self service through e-commerce platform
Enhanced data reporting and visualization
Supply Chain
Optimization
Improved demand forecasting and ability meet product demand
Real-time order and truck tracking. Paperless driver logs/accident report
Advanced financial reporting, inventory management and logistics
Provides sales force with detailed customer /purchasing data and
advanced call routing
BXC continues to invest in technologies that drive profitability and improve operating efficiencies
Developed
Internally
Developed
Internally
Leveraging Technology to Enhance Margin
11

BlueLinx Leverage with Sale Leasebacks
7.9x
6.1x
2.3x
1 Assumes a 9% cap rate on sale leasebacks and 50% rent expense/50% mortgage interest
Leverage Sensitivity Analysis
Illustrative Sale Leaseback Sensitivity
With $98M SLB With $250M SLB
Credit Facility 218$ 218$ 66$
CMBS Mortgage Loan Balance 98 0 0
Total Bank Debt 316$ 218$ 66$
Net Proceeds from Sale Leasebacks 0 98 250
TTM dj. EBITDA 40 40 40
Rent Expense for Sale-Leasebacks 1 0 (4) (11)
TTM Adj. EBITDA less Rent Expense 40$ 36$ 29$
Total Bank Debt / Adjusted EBITDA 7.9x 6.1x 2.3x
Q3 2017 Actual
Pro Forma
The value of our underlying real estate is important when assessing BlueLinx leverage
Today $98M SLB $250M SLB
In millions
12
Opportunity to Delever

Key Initiatives
The Company’s initiatives seek to solidify its place as a market leader
Emphasize Sales
Growth
Emphasize local
customer interaction to
grow market share
Develop and deploy
best practices in selling
processes
Prioritize
underpenetrated
markets and products
1
Closely Manage Real
Estate Value and
Working Capital
Management
Assessing sale of
certain real estate
assets
Continue working
capital emphasis
3
Enhance Margins
Emphasis on products
and markets with high
margin profiles
Differentiate offering
based on customer
characteristics
Maintain price
discipline with
systematic pricing
processes
2
America’s Building Products Distributor
13

Strong Collateral Base
BlueLinx’s real estate and working capital are substantially greater than its bank debt
The Company has high-quality ABL
collateral, significantly exceeding the
total net ABL debt
o Inventory with quick turnover and low
obsolescence
o Relatively low bad debt expense over
the last three years
Real estate value well above the
associated mortgage debt
Excellent recovery of working capital
assets from 2016 strategic initiatives
o Inventory: ~94%
o Accounts Receivable: ~99%
1. Based on extrapolation of net proceeds from 13 property sales in 2016/2017 relative to their net book value
2. Revolving Credit Facility, net of balance sheet cash of $4.8M
Capitalization ($ millions) 9/30/2017
Working Capital
Accounts Receivable 174
Inventory 207
Total Working Capital Assets 381
Total Net ABL Debt1 (212)
Working Capital Asset Value Above ABL 168
BlueLinx Estimated Real Estate1 269
Total Mortgage Debt (98)
Real Estate Value Above Mortgage Debt 171
Revolving Credit Facility2 212
Existing CMBS Loan 98
Total Net Debt 310
Total Working Capital & RE Value Above Debt 340
Leverage & Asset Ratios
(A/R + Inventory) / (Total Net ABL Debt) 1.8x
Total Assets / Total Net Debt 2.1x
14

$335
$291
$255
6.7%
12.0%
15.6%
1.0%
3.0%
5.0%
7.0%
9.0%
11.0%
13.0%
15.0%
17.0%
$0
$50
$100
$150
$200
$250
$300
$350
$400
Q3 '15 Q3 '16 Q3 '17
Operating Working Capital ROWC
Q3 Return on Working Capital Trend
Return on Working Capital: TTM Adjusted EBITDA / TTM Average Operating Working Capital
Operating Working Capital: Current Assets less Current Liabilities plus the current portion of long-term debt
Q3 '15 Q3 '16 Q3 '17
TTM Adj. EBITDA $22.5M $34.9M $39.8M
Avg. Operating Working Capital $335M $291M $255M
Adjusted ROWC 6.7% 12.0% 15.6%
Successful Reduction of Working Capital
Accelerating operating
performance with
Adjusted EBITDA
growth and working
capital reductions
($ in millions)
15
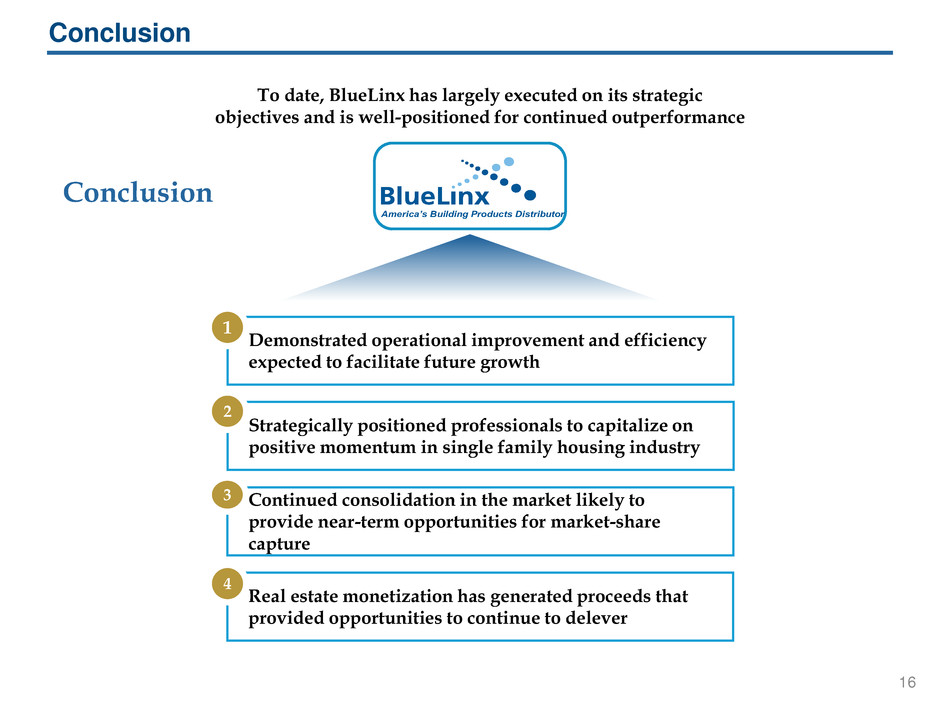
Real estate monetization has generated proceeds that
provided opportunities to continue to delever
4
Continued consolidation in the market likely to
provide near-term opportunities for market-share
capture
3
Strategically positioned professionals to capitalize on
positive momentum in single family housing industry
To date, BlueLinx has largely executed on its strategic
objectives and is well-positioned for continued outperformance
America’s Building Products Distributor
Demonstrated operational improvement and efficiency
expected to facilitate future growth
1
Conclusion
2
16
Conclusion
16

Appendix

Statements of Income
In thousands, except per share data
(unaudited)
2017 2016 2017 2016
Q3 Q3 Q3 YTD Q3 YTD
Net sales $ 479,318 $ 476,049 $ 1,381,927 $ 1,459,386
Cost of sales 418,773 415,999 1,206,402 1,284,354
Gross profit 60,545 60,050 175,525 175,032
Operating expenses (income):
Selling, general, and administrative 46,817 49,152 148,742 157,006
Gains from sales of property — (13,940 ) (6,700 ) (14,701 )
Depreciation and amortization 2,249 2,220 6,865 7,091
Total operating expenses 49,066 37,432 148,907 149,396
Operating income 11,479 22,618 26,618 25,636
Non-operating expenses (income):
Interest expense 5,670 6,105 16,280 19,562
Other income, net — (17 ) (2 ) (255 )
Income before provision for income taxes 5,809 16,530 10,340 6,329
Provision for income taxes 123 1,522 832 609
Net income $ 5,686 $ 15,008 $ 9,508 $ 5,720
Basic earnings per share $ 0.63 $ 1.69 $ 1.05 $ 0.64
Diluted earnings per share $ 0.62 $ 1.68 $ 1.04 $ 0.64
18
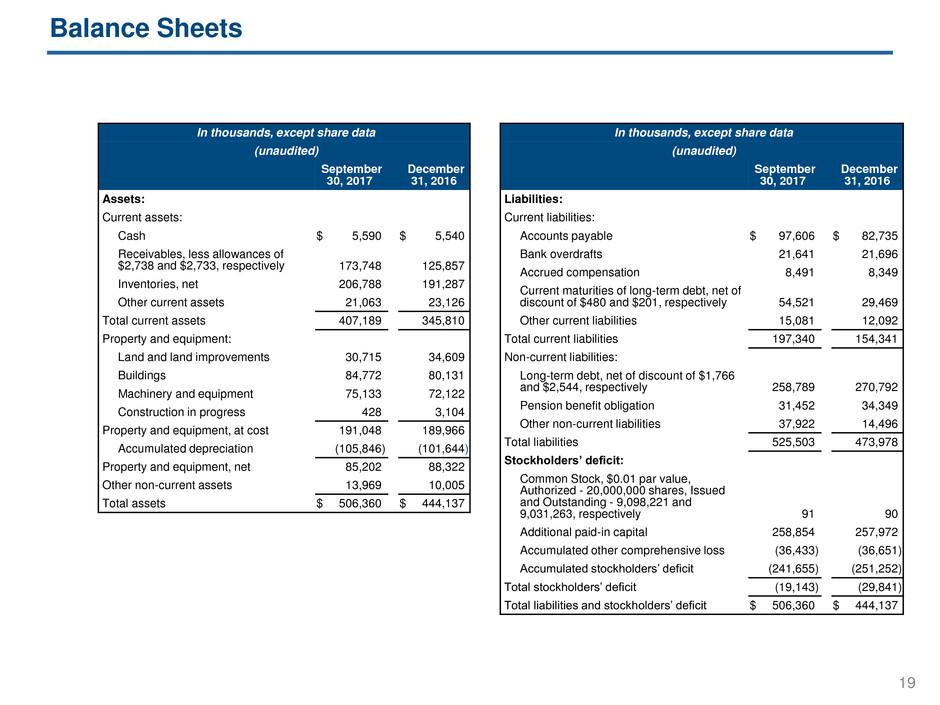
Balance Sheets
In thousands, except share data
(unaudited)
September
30, 2017
December
31, 2016
Assets:
Current assets:
Cash $ 5,590 $ 5,540
Receivables, less allowances of
$2,738 and $2,733, respectively 173,748 125,857
Inventories, net 206,788 191,287
Other current assets 21,063 23,126
Total current assets 407,189 345,810
Property and equipment:
Land and land improvements 30,715 34,609
Buildings 84,772 80,131
Machinery and equipment 75,133 72,122
Construction in progress 428 3,104
Property and equipment, at cost 191,048 189,966
Accumulated depreciation (105,846 ) (101,644 )
Property and equipment, net 85,202 88,322
Other non-current assets 13,969 10,005
Total assets $ 506,360 $ 444,137
In thousands, except share data
(unaudited)
September
30, 2017
December
31, 2016
Liabilities:
Current liabilities:
Accounts payable $ 97,606 $ 82,735
Bank overdrafts 21,641 21,696
Accrued compensation 8,491 8,349
Current maturities of long-term debt, net of
discount of $480 and $201, respectively 54,521 29,469
Other current liabilities 15,081 12,092
Total current liabilities 197,340 154,341
Non-current liabilities:
Long-term debt, net of discount of $1,766
and $2,544, respectively 258,789 270,792
Pension benefit obligation 31,452 34,349
Other non-current liabilities 37,922 14,496
Total liabilities 525,503 473,978
Stockholders’ deficit:
Common Stock, $0.01 par value,
Authorized - 20,000,000 shares, Issued
and Outstanding - 9,098,221 and
9,031,263, respectively 91 90
Additional paid-in capital 258,854 257,972
Accumulated other comprehensive loss (36,433 ) (36,651 )
Accumulated stockholders’ deficit (241,655 ) (251,252 )
Total stockholders’ deficit (19,143 ) (29,841 )
Total liabilities and stockholders’ deficit $ 506,360 $ 444,137
19
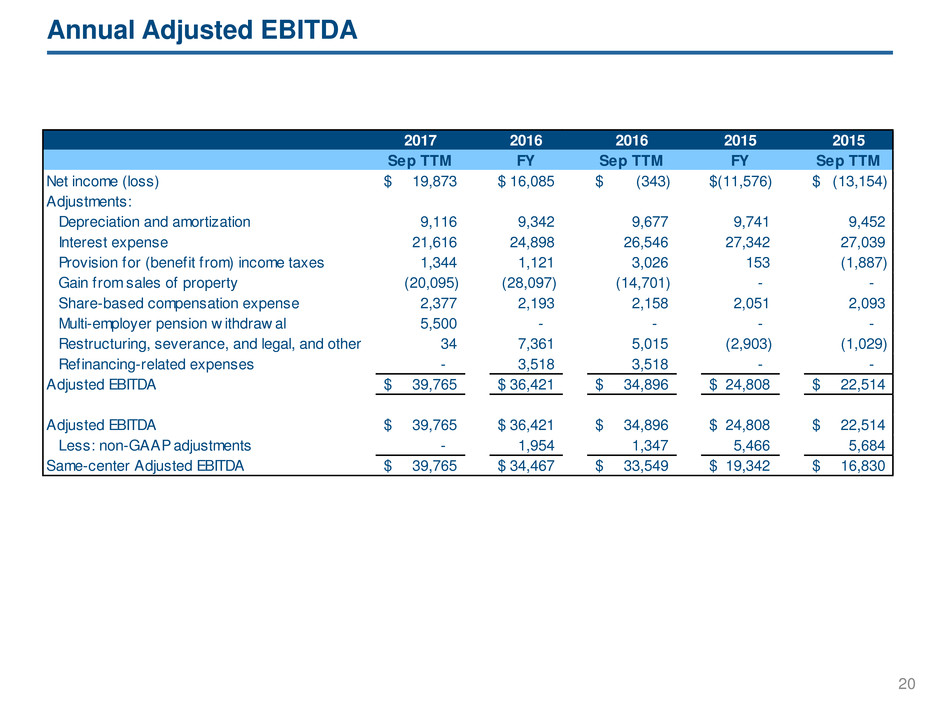
Annual Adjusted EBITDA
20
2017 2016 2016 2015 2015
Sep TTM FY Sep TTM FY Sep TTM
Net income (loss) $ 19,873 $ 16,085 $ (343) $(11,576) $ (13,154)
Adjustments:
Depreciation and amortization 9,116 9,342 9,677 9,741 9,452
Interest expense 21,616 24,898 26,546 27,342 27,039
Provision for (benefit from) income taxes 1,344 1,121 3,026 153 (1,887)
Gain from sales of property (20,095) (28,097) (14,701) - -
Share-based compensation expense 2,377 2,193 2,158 2,051 2,093
Multi-employer pension w ithdraw al 5,500 - - - -
Restructuring, severance, and legal, and other 34 7,361 5,015 (2,903) (1,029)
Refinancing-related expenses - 3,518 3,518 - -
Adjusted EBITDA $ 39,765 $ 36,421 $ 34,896 $ 24,808 $ 22,514
Adjusted EBITDA $ 39,765 $ 36,421 $ 34,896 $ 24,808 $ 22,514
Less: non-GAAP adjustments - 1,954 1,347 5,466 5,684
Same-center Adjusted EBITDA $ 39,765 $ 34,467 $ 33,549 $ 19,342 $ 16,830
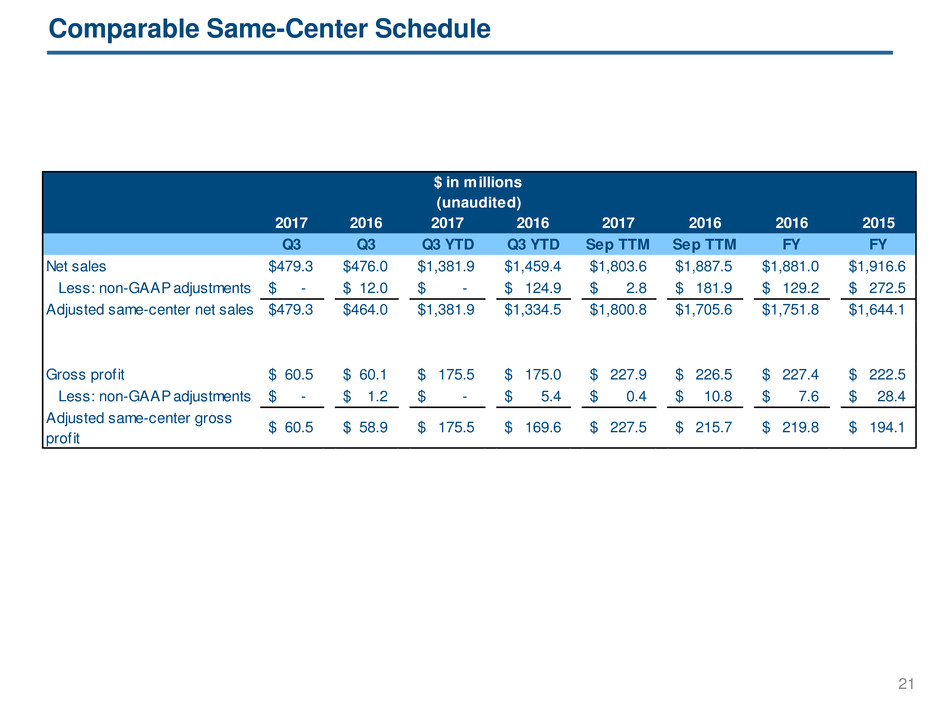
Comparable Same-Center Schedule
21
2017 2016 2017 2016 2017 2016 2016 2015
Q3 Q3 Q3 YTD Q3 YTD Sep TTM Sep TTM FY FY
Net sales $479.3 $476.0 $1,381.9 $1,459.4 $1,803.6 $1,887.5 $1,881.0 $1,916.6
Less: non-GAAP adjustments $ - $ 12.0 $ - $ 124.9 $ 2.8 $ 181.9 $ 129.2 $ 272.5
Adjusted same-center net sales $479.3 $464.0 $1,381.9 $1,334.5 $1,800.8 $1,705.6 $1,751.8 $1,644.1
Gross profit $ 60.5 $ 60.1 $ 175.5 $ 175.0 $ 227.9 $ 226.5 $ 227.4 $ 222.5
Less: non-GAAP adjustments $ - $ 1.2 $ - $ 5.4 $ 0.4 $ 10.8 $ 7.6 $ 28.4
Adjusted same-center gross
profit
$ 60.5 $ 58.9 $ 175.5 $ 169.6 $ 227.5 $ 215.7 $ 219.8 $ 194.1
$ in millions
(unaudited)
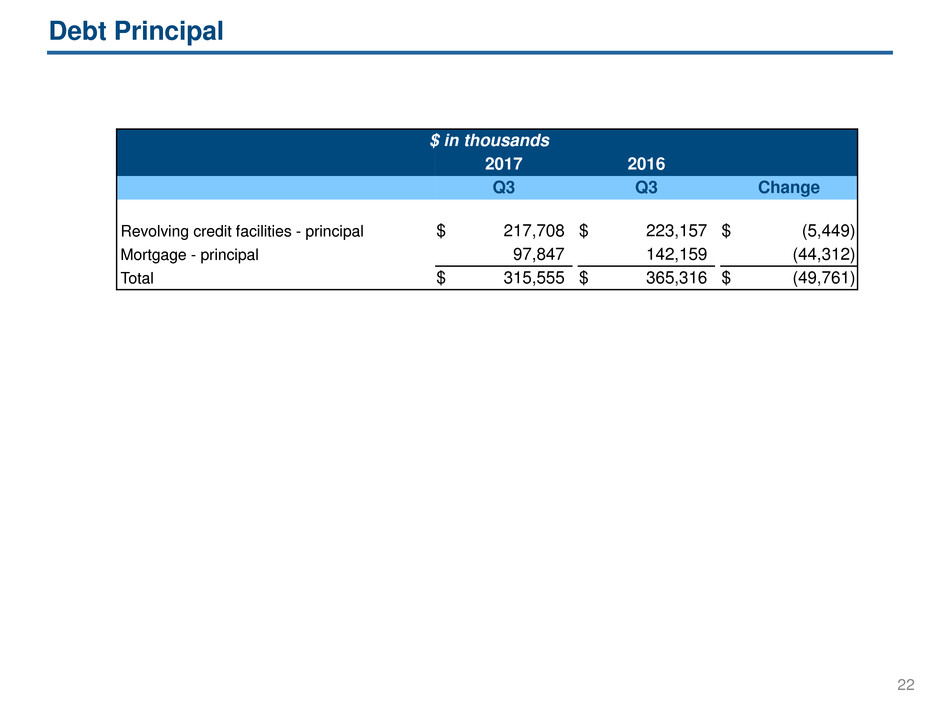
Debt Principal
$ in thousands
2017 2016
Q3 Q3 Change
Revolving credit facilities - principal $ 217,708 $ 223,157 $ (5,449 )
Mortgage - principal 97,847 142,159 (44,312 )
Total $ 315,555 $ 365,316 $ (49,761 )
22

Operating Working Capital
$ in thousands
2017 2016
Q3 Q3 Change
Current assets:
Cash $ 5,590 $ 4,704 $ 886
Receivables, less allowance for doubtful
accounts 173,748 163,388 10,360
Inventories, net 206,788 207,909 (1,121 )
Other current assets 21,063 25,176 (4,113 )
Total current assets $ 407,189 $ 401,177 $ 6,012
Current liabilities:
Accounts Payable (1) $ 119,247 $ 109,331 $ 9,916
Accrued compensation 8,491 7,581 910
Current maturities of long-term debt, net of
discount 54,521 44,909 9,612
Other current liabilities 15,081 12,728 2,353
Total current liabilities $ 197,340 $ 174,549 $ 22,791
Operating working capital $ 264,370 $ 271,537 $ (7,167 )
(1) Accounts payable includes bank overdrafts
23

Please reference our
Earnings Release and 10-Q
available on our website
www.BlueLinxCo.com
