Attached files
| file | filename |
|---|---|
| 8-K - FORM 8-K - FIRST BUSINESS FINANCIAL SERVICES, INC. | fbiz3q17ceoletter8-k.htm |
Exhibit 99.1
DEAR SHAREHOLDERS AND FRIENDS OF FIRST BUSINESS:
Our third quarter 2017 results reflect continued progress at First Business as we position for growth in 2018. Over the past year, we executed on opportunities to improve long-term performance, taking decisive measures to
advance isolated problem credit workouts, to rebuild our Small Business Administration (SBA) lending platform and to better align operating expenses with expected revenue trends. While these measures, in some cases, come with short-term costs reflected in recent earnings, all are designed to strengthen and maximize the long-term growth potential of First Business’s
unique franchise.
Despite recent earnings volatility, we believe good things are happening at First Business. Non-performing assets have declined from historically elevated levels and we continue to win new client relationships and strengthen existing ones, while also meaningfully investing in top-tier talent. In 2017, we have hired several producers and experienced operational managers across the First Business franchise, filling key open positions with high performers who are eager to serve our clients as a member of First Business’s entrepreneurial team.
CAUTIOUS OPTIMISM ON POSITIVE TRENDS
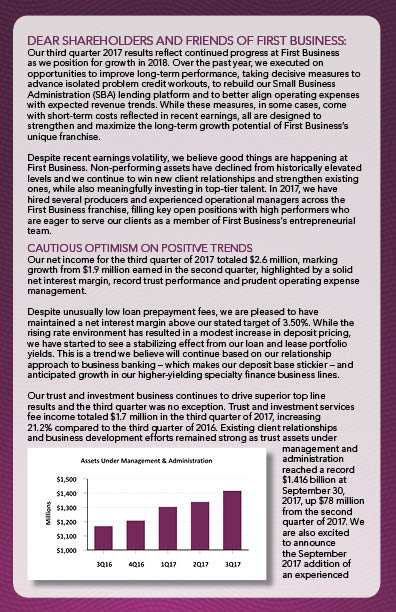
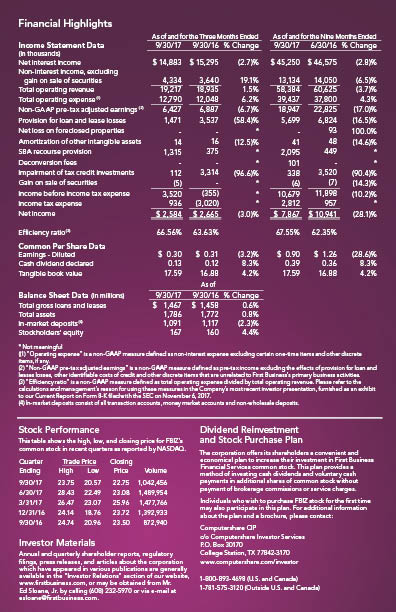
Our net income for the third quarter of 2017 totaled $2.6 million, marking growth from $1.9 million earned in the second quarter, highlighted by a solid net interest margin, record trust performance and prudent operating expense management.
Despite unusually low loan prepayment fees, we are pleased to have maintained a net interest margin above our stated target of 3.50%. While the rising rate environment has resulted in a modest increase in deposit pricing, we have started to see a stabilizing effect from our loan and lease portfolio yields. This is a trend we believe will continue based on our relationship
approach to business banking – which makes our deposit base stickier – and anticipated growth in our higher-yielding specialty finance business lines. Our trust and investment business continues to drive superior top line results and the third quarter was no exception. Trust and investment services fee income totaled $1.7 million in the third quarter of 2017, increasing 21.2% compared to the third quarter of 2016. Existing client relationships and business development efforts remained strong as trust assets under management and administration reached a record $1.416 billion at September 30, 2017, up $78 million from the second quarter of 2017. We are also excited to announce the September 2017 addition of an experienced private wealth management producer in Kansas City as we begin to build our wealth management presence in our newest market. Overall credit costs and asset quality improved as we continued working toward resolving certain problem credits. These efforts are reflected in the reduction of our provision for loan and lease losses to $1.5 million in the third quarter of 2017, down by $2.2 million compared to the second quarter. Likewise, non-performing loans declined by 10.6% compared to June 30, 2017. As a percent of total gross loans and leases receivable, nonperforming loans measured 2.26% at September 30, 2017, and while this is still well above our expectations, it has improved meaningfully from 2.55% at the end of the second quarter. In addition, we received all principal and interest in October 2017 for a previously disclosed construction loan originated in our Kansas City
market, which will reduce non-performing loans by another $2.5 million in the fourth quarter of 2017.
SUCCESSFUL RECRUITMENT EFFORTS IN 2017 BODE WELL FOR FUTURE LOAN GROWTH
Our personal attention from experienced Business Development Officers (“BDOs”) and industry experts who listen and advise clients to aid in their business’s success lies at the heart of how we grow First Business. These relationships often begin with a specific need addressed by one of our diverse product offerings, and our team provides a unique level of service and business
expertise which leads to a more multi-faceted partnership with First Business. We believe this approach is key to improving the quality and size of both our loan and deposit portfolios. During the quarter, gross loan balances expanded by about $9 million,
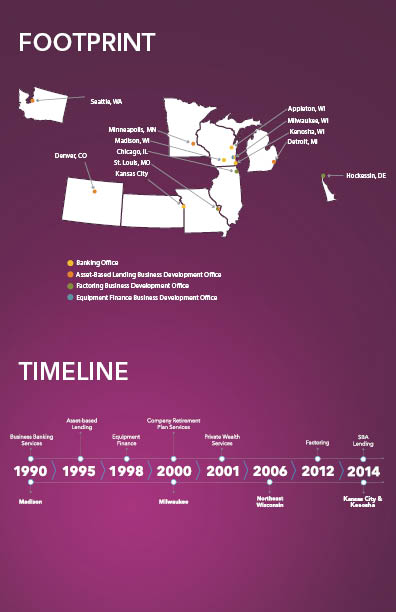
compared to both the second quarter of 2017 and third quarter of 2016. However, important signs of growth in our Wisconsin markets were not fully apparent in our consolidated loan balances. Conventional lending across our established Wisconsin markets produced more than $80 million in organic loan growth compared to the third quarter of 2016. We anticipate replicating this relationship driven success in our Kansas City market and nationwide SBA platform – which we entered through acquisition in 2014 – following the aggressive reorganization, hiring and asset quality improvement process we have undertaken and broadly discussed in recent quarters. We continue to see solid pipelines in our Wisconsin markets and we anticipate high-quality overall loan growth will build as recently hired talent and anticipated hires increase production and outpace portfolio runoff. Since the beginning of 2017, we have hired 13 producers across our markets and business
lines, filling 11 critical open positions and adding two new positions. We believe these vacancies were directly correlated to our recent lower than historical loan growth rates. Our ability to successfully attract talent in the second half of 2017 is something we have focused on to position the Company for continued growth in the quarters ahead. Unfortunately, finding people who fit well in our culture and share our entrepreneurial spirit takes time, and it also takes time for these new BDOs to become fully productive. However, with these additional producers now in place — specifically in our Kansas City, Northeast Wisconsin and Milwaukee regions — we are bullish on our growth prospects moving forward. That being said, we continue to experience significant competition from local community and regional banks, and we will not deviate from our underwriting standards for the sole purpose of growing our loan and lease portfolio.
BUILDING A QUALITY BALANCE SHEET WITH STRONG RELATIONSHIPS AND PRUDENT FUNDING STRATEGIES
Our success in building strong client relationships has meaningfully improved the quality of our deposit funding profile. Today, in-market deposits – consisting of all transaction accounts, money market accounts and non wholesale deposits – make up 70% of our total bank funding. Ten years ago, the same measure totaled only 43%. We have sought and retained key client deposits through the strength of our relationship approach and the price flexibility inherent in our unique limited-branch model. During the third quarter, in-market deposits declined by 2.6% compared to the second quarter of 2017. Due to sufficient funding from our relationship based clients, we have allowed higher priced non-relationship money market account balances to run off, reflecting pricing discipline and a focus on longer-term relationship opportunities across our markets. At the sametime, we continued to replace maturing wholesale deposits with fixed rate Federal Home Loan Bank advances, consistent with our longstanding funding strategy to use the most cost effective source of wholesale funds to match fund our balance sheet and mitigate interest rate risk.
As expected, the rising rate environment resulted in modest increases indeposit pricing in order to meet client expectations. Our average total deposit costs for the third quarter of 2017 increased to 0.74%, compared to 0.72% and 0.71% in the second quarter of 2017 and third quarter of 2016, respectively. Interestingly, in the third quarter of 2015, just prior to the Federal Open Market Committee’s initial December 2015 decision to raise the targeted federal funds rate, First Business’s average deposit costs were also 0.74%, which demonstrates our success in managing our deposit mix and pricing over time. Over the same time period, our peer banks saw average deposit costs increase 11 basis points, on average1. Similarly, First Business’s cost of total interest-bearing liabilities remained steady at 1.09% for both the second and third quarters of 2017, and was up only nominally from 1.04% in the prior year’s third quarter. We believe a modest increase in average total deposit costs may continue as we look to manage deposit relationships amid intense competition and continued expectations of a rising rate environment.
EFFICIENCY AND PROFITABILITY IN FOCUS
We continue progress towards enhancing our long-term efficiency ratio, building on the strategic changes we have made to date and laying the foundation to generate sustainable and high-quality revenue growth. After significant investment in 2016 and 2017, we believe we now have a high quality SBA infrastructure, with the operational people and processes in place to resume production in the years ahead as we begin to enhance our SBA sales presence. At the same time, we expect our recently completed charter consolidation and pending core system conversion to create capacity within our existing workforce to accommodate future growth in a highly efficient manner. We believe these strategic initiatives will act as a catalyst for earnings growth in 2018 and beyond, and will serve to drive our efficiency ratio to our targeted range of 58%-62%. The significant steps we’ve taken over the past year position us well to begin delivering improved asset quality and financial performance metrics, and we look forward to reporting progress in the coming quarters. Overall, we believe we are well positioned to execute on growth prospects in a sustainable manner, with the expectation of lowering credit costs over time, improving shareholder returns and ultimately attaining our long-term 1% return on assets and 12% return on equity targets.
As always, thank you for your commitment to First Business.
Sincerely,
1. The First Business peer group includes: CoBiz Financial Inc. (COBZ), Community Financial Corporation (TCFC), Guaranty Bancorp (GBNK), Mercantile Bank Corporation (MBWM), Old Line Bancshares, Inc. (OLBK), QCR Holdings, Inc. (QCRH), Southern National Bancorp of Virginia, Inc. (SONA), Southwest Bancorp, Inc. (OKSB - acquired in October 2017), Stock Yards Bancorp, Inc. (SYBT), West Bancorporation, Inc. (WTBA), Atlantic Capital Bancshares Inc. (ACBI), CapStar Financial Holdings Inc. (CSTR), Paragon Commercial Corporation (PBNC), People’s Utah Bancorp (PUB), First Community Corporation (FCCO), Civista Bancshares Inc. (CIVB), Park Sterling Corporation (PSTB), Macatawa Bank Corporation (MCBC), Mid Penn Bancorp Inc. (MPB), National Commerce Corporation (NCOM),
Franklin Financial Network (FSB) and First Financial Northwest Inc. (FFNW).
This letter includes “forward-looking statements” related to First Business Financial Services, Inc. (the “Company”) that can generally be identified as describing the Company’s future plans, objectives, goals or expectations. Such forward-looking statements are subject to risks and uncertainties that could cause actual results or outcomes to differ materially from those currently anticipated. These forwardlooking statements are made pursuant to the safe harbor provisions of the Private Securities Litigation Reform Act of 1995. For further information about the factors that could affect the Company’s future results, please see the Company’s most recent annual report on Form 10-K, quarterly reports on Form 10-Q and other filings with the Securities and Exchange Commission.