Attached files
| file | filename |
|---|---|
| EX-23.2 - EX-23.2 - Presidio, Inc. | d458703dex232.htm |
| EX-5.1 - EX-5.1 - Presidio, Inc. | d458703dex51.htm |
| EX-1.1 - EX-1.1 - Presidio, Inc. | d458703dex11.htm |
| S-1 - S-1 - Presidio, Inc. | d458703ds1.htm |
Exhibit 23.3

QUOTE INDEMNIFICATION AGREEMENT
***Note: The Required Disclaimer on Exhibit A and the Terms and Conditions of Gartner’s
consent to quote on Exhibit B are not negotiable and may not be changed. ***
THIS QUOTE INDEMNIFICATION AGREEMENT (the “Agreement”) is made as of the 14th day of November, 2017 by and between Presidio, Inc., a Delaware corporation with offices at One Penn Plaza, New York, New York 10119 (the “Issuer”) and Gartner, Inc., a Delaware corporation with offices at 56 Top Gallant Road, Stamford, Connecticut 06902-7700 (“Gartner”).
Gartner hereby consents to the quotation by Issuer in its Registration Statement on Form S-1 to be filed with the Securities and Exchange Commission on or around November 14, 2017 (the “Filing”), of the Gartner material set forth on the attached Exhibit A (the “Gartner Material”).
In consideration of Gartner’s consent, and other good and valuable consideration, the receipt and sufficiency of which is hereby acknowledged, the Issuer hereby acknowledges and agrees to the terms and conditions set forth on the attached Exhibit B.
In witness whereof, the Issuer and Gartner have executed this Agreement as of the date set forth above.
| Presidio, Inc. | Gartner, Inc. | |||||||
| By: | /s/ Elliot Brecher | By: | /s/ Jason Pfeifer | |||||
| Name: | Elliot Brecher | Name: | Jason Pfeifer | |||||
| Its duly authorized: | SVP & General Counsel | Its duly authorized: | Yes | |||||
| Date: | 11/14/17 | Date: | 11/14/17 | |||||
| Gartner – Generic Indemnification Agreement – US Public Offering | ||||||||
Exhibit A
Gartner Material
See attached for quoted material.
Required Disclaimer (to appear on the same page as the reference to the Gartner Reports):
The Gartner Report(s) described herein, (the “Gartner Report(s)”) represent(s) research opinion or viewpoints published, as part of a syndicated subscription service, by Gartner, Inc. (“Gartner”), and are not representations of fact. Each Gartner Report speaks as of its original publication date (and not as of the date of this Prospectus) and the opinions expressed in the Gartner Report(s) are subject to change without notice.
Gartner – Generic Indemnification Agreement – US Public Offering
Exhibit B
Terms and Conditions of Gartner’s consent to quote:
| a. | The Gartner Material shall be presented in the Filing as representing research opinion or viewpoints published by Gartner, and not as a representation of fact. |
| b. | The disclaimer set forth on Exhibit A shall be included in the Filing on the same page as the Gartner Material, or in the vicinity thereof, and in the same font size. |
| c. | Gartner disclaims all warranties, express or implied, statutory or otherwise, including, without limitation, any implied warranties of merchantability of fitness for a particular purpose, and warranties as to accuracy, completeness or adequacy of the Gartner Material. |
| d. | The Gartner Material speaks as of its original publication date (and not as of the date of the Filing) and that the opinions expressed in the Gartner Material are subject to change without notice. |
| e. | Gartner shall have no liability for errors, omissions or inadequacies in the Gartner Material or for any interpretations of the Gartner Material. |
| f. | Issuer agrees to indemnify and hold harmless Gartner, its subsidiaries and their respective directors, officers, directors, shareholders, employees and agents, from and against any and all claims, liabilities, demands, causes of action, damages, losses and expenses (including reasonable attorney’s fees and costs) arising, directly or indirectly, and without limitation, out of or in connection with the Filing. |
| g. | Issuer agrees that this Agreement shall be governed by and construed in accordance with the laws of the State of Connecticut, without reference to conflict of law principles. |
Gartner – Generic Indemnification Agreement – US Public Offering
Exhibit A
BASIS OF PRESENTATION
* * * * * *
“North American IT market,” when referenced in connection with data cited to Gartner, Inc. (“Gartner”), means the geographic market of the United States and Canada. See “Market, Industry and Other Data.” According to Gartner, Canada accounts for approximately 6.6% of the North American IT market, and Canada’s IT market growth rate is comparable (within 1%) to that of the IT market in the United States. Canada’s IT market, according to Gartner, resembles that of the United States in terms of technology trends and buying behavior, permitting the IT markets from both countries to be analyzed together, whereas the market of Mexico differs to such an extent that Gartner does not include that market in its North American IT market analysis.
We calculate total addressable market (“TAM”) amounts using a methodology combining calculations of Gartner and the Company’s management. The data underlying the TAM amounts were calculated by Gartner, and the Company’s management used the TAM amounts to calculate the compound annual growth rate (“CAGR”) between certain periods. In calculating TAM amounts with respect to the Digital Infrastructure, Cloud and Security components, Gartner excluded certain sub-components from the Security TAM that are not part of Presidio’s solution set: Consumer Security Software, Data Loss Prevention, Endpoint Protection Platform (Enterprise), Identity Governance and Administration, IPS Equipment, Other Identity Access Management, Other Security Software, Secure E-Mail Gateway, Secure Web Gateway, Security Information and Event Management (SIEM), Security Testing, VPN/Firewall Equipment, and Web Access Management (WAM). Our management then calculated CAGR using the revised TAM amounts, resulting in the amounts reported in this prospectus for TAM CAGR in this prospectus. See “Prospectus Summary—Market Overview” and “Business—Market Overview.”
* * * * * *
MARKET, INDUSTRY AND OTHER DATA
This prospectus contains industry and market data, forecasts and projections that are based on internal data and estimates, independent industry publications, reports by market research firms and other independent sources, such as Gartner. Although we believe them to be accurate, there can be no assurance as to the accuracy or completeness of such information. Although we are responsible for all of the disclosures contained in this prospectus, we have not independently verified any of the data from third-party sources, nor have we ascertained the underlying economic assumptions relied upon therein. In addition, while we believe that the industry information included herein is generally reliable, such information is inherently imprecise. While we are not aware of any misstatements regarding the industry data presented herein, our estimates involve risks and uncertainties and are subject to change based on various factors, including those discussed under the caption “Risk Factors” in this prospectus.
* * * * * *
The Gartner Reports described herein (the “Gartner Reports”), which were prepared for us in connection with this prospectus, represent research opinions or viewpoints published, as part of a syndicated subscription service, by Gartner and are not representations of fact. The Gartner Reports speak as of their original publication date (and not as of the date of this prospectus) and the opinions expressed in the Gartner Reports are subject to change without notice.
In certain instances where the Gartner Reports are identified as the sources of market and industry data contained in this prospectus, the applicable report is identified by superscript notations. The sources of these data are provided below:
| (1) | Gartner Market Databook, 3Q17 Update, dated as of September 28, 2017. |
| (2) | Forecast: Small-and-Midsize-Business IT Spending, Worldwide, 2015-2021, 2Q17 Update, dated as of July 27, 2017 |
| (3) | The 2018 CIO Agenda: Mastering the New Job of the CIO, dated as of September 29, 2017 |
| (4) | Forecast: IT Services, Worldwide, 2015-2021, 3Q17 Update, dated as of September 21, 2017 |
| (5) | Forecast: Information Security, Worldwide, 2015-2021, 2Q17 Update, dated as of August 8, 2017 |
| (6) | Forecast: Internet of Things — Endpoints and Associated Services, Worldwide, 2016, dated as of December 29, 2016 |
| (7) | Market Share: IT Services 2016, dated as of April 19, 2017 |
In the Gartner Reports, the market and industry data presented is based on end-user spending and represents calendar year data.
Unless otherwise indicated, in this prospectus, companies in the North American IT market are divided into four categories. These categories are those used by Gartner, and are based on the size of the company. SOHO (Small Office/Home Office) companies are characterized by one-nine employees. Small businesses are characterized by 10-99 employees and less than $50 million in revenue. Midsize, or middle market, companies are characterized by 100-1,000 employees and $50 million to $1 billion in revenue. Large, or enterprise, companies are characterized by over 1,000 employees and more than $1 billion in revenue.
Unless otherwise indicated, in this prospectus, spend in the North American IT market is divided into five categories:
| • | The “Data Center Systems / Network” category includes servers, external controller-based storage, enterprise network equipment and unified communications; |
| • | The “Devices” category includes PCs, tablets, phones and printers; |
| • | The “Software” category includes enterprise application software (enterprise resource planning (“ERP”), human resources (“HR”), collaborative, client relationship management (“CRM”) and engineering software) and infrastructure software (application development, information management, enterprise system management, security system software and operating systems); |
| • | The “IT Services” category includes business IT services (consulting, implementation, IT outsourcing and “business process outsourcing”) and IT product support (software support and hardware support); and |
| • | The “Communications Services” category includes enterprise fixed and mobile services (wide area network (“WAN”), core network, voice services, mobile data services, etc.) and consumer fixed and mobile services (fixed-line voice services, broadband, mobile access and traffic fees, etc.). |
* * * * * *
PROSPECTUS SUMMARY
Company Overview
* * * * * *
Our strategic focus on the middle-market and high-growth solutions areas has enabled us to achieve 10% annualized growth in our revenue from our fiscal year ended June 30, 2012 to our fiscal year ended June 30, 2017. Over the same period, we have significantly outpaced the overall IT market growth rate, according to Gartner. We believe that we are well positioned for continued success as IT becomes more transformative and complex, driving demand for our solutions.
* * * * * *
2
Market Overview
We operate in the large and growing North American IT market. According to Gartner, the overall North American IT market is expected to grow to $1.39 trillion by 2021, representing a 3.5% CAGR from 2016, and the IT Services sub-market is expected to grow by 5.0% over the same period, to $514 billion. Our primary focus is on the attractive middle market of the overall North American IT market, which, according to Gartner, is projected to grow from $238 billion in 2016 to $310 billion in 2021, representing a 5.5% CAGR. The middle market is one of the fastest growing segments of the overall North American IT market in part because its companies often employ smaller internal IT teams that do not have the broad expertise required to keep pace with increasingly complex IT environments and constant technology changes. Industry dynamics continue to favor services-led solutions providers, as businesses increasingly rely on us to advise them on complex IT projects, enabling them to better focus on their core capabilities and enhance productivity.
|
North America IT Spend by Category1
|
North America IT Spend by Company Size2
| |
|
|
|
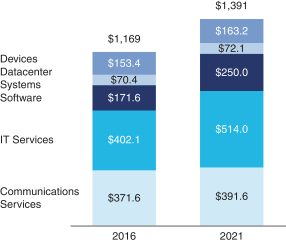
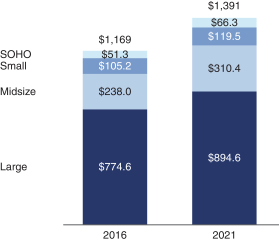
While we primarily focus our operations on the U.S. middle market, we have generated sales in and have operations in Canada, the only other country included in Gartner’s North American IT market. Our sales in Canada were less than 1% of our revenue in the fiscal year ended June 30, 2017. Our total sales outside the United States represented approximately 2% of our total revenue for each of the fiscal years ended June 30, 2017, June 30, 2016, and June 30, 2015, and the growth rates of the overall North American IT market and the IT Services sub-market generally indicate a growing market for our business.
We believe that growth in IT spending will continue to be driven by the adoption of new technologies and market-related trends in cloud, security and IoT and the desire to integrate people, process and technology into digital business models. These trends reflect expanding IT complexity that organizations must manage to remain competitive; however, many middle-market companies lack the resources to design, integrate and manage full life cycle solutions across multiple technology silos to capitalize on these new technologies. A recent survey by Gartner3 predicted that the four biggest drivers of increased IT budget spend would be in the areas of analytics, infrastructure and datacenter, security and cloud, all of which are areas addressed by our core solutions.
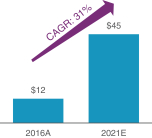
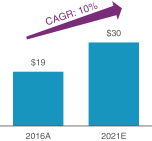
Because of our strategic focus on high-growth solutions areas, our North American TAM is expected to grow at a 7.4% CAGR from $166 billion in 2016 to $237 billion in 2021, according to Gartner and management estimates.4
|
Digital Infrastructure TAM5
|
Cloud TAM6
|
Security TAM7
| ||
|
|
|
| ||
Specific components of our TAM are as follows:
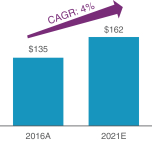
| • | Digital Infrastructure solutions: Gartner estimates that our addressable enterprise-class infrastructure market was $135 billion in 2016 and is projected to grow at a 3.7% CAGR through 2021. Gartner defines infrastructure solutions as infrastructure services, network services, data center hardware and software, data center outsourcing, enterprise network outsourcing, data center systems support and network systems support, as well as IoT implementation, operations and consulting. Gartner defines |
| 1 | See Gartner note (1) in the section titled “Market, Industry and Other Data.” |
| 2 | See Gartner note (2) in the section titled “Market, Industry and Other Data.” |
| 3 | See Gartner note (3) in the section titled “Market, Industry and Other Data.” |
| 4 | See Gartner notes (1,4,5) in the section titled “Market, Industry and Other Data.” |
| 5 | See Gartner note (1) in the section titled “Market, Industry and Other Data.” |
| 6 | See Gartner note (4) in the section titled “Market, Industry and Other Data.” |
| 7 | See Gartner note (5) in the section titled “Market, Industry and Other Data.” |
3
| enterprise-class as “the ability of a given tool or product to handle complex processes or services.” We believe key emerging trends driving this growth include increased infrastructure requirements for cloud (public, private and multi) usage including integration of Software-as-a-Service (“SaaS”) applications into environments, low-latency requirements, software-defined networks (“SDN”), IoT-connected devices and data management strategies supporting data analytics. We enable businesses to capitalize on these emerging trends by designing and deploying new solutions and by refreshing and replacing their inflexible or under-provisioned existing networks and infrastructure. |
| • | Cloud solutions: Over the past several years, the SaaS, Platform-as-a-Service (“PaaS”) and Infrastructure-as-a-Service (“IaaS”) markets have provided a viable complement to traditional on premise, enterprise-class infrastructure solutions. Clients are deploying multi-cloud solutions that drive increased demand for private clouds, networking, storage and virtualization, as well as public-cloud integration. Gartner estimates that the North American cloud infrastructure opportunity was approximately $12 billion in 2016 and is projected to grow at a CAGR of approximately 31% through 2021. Gartner defines cloud solutions as cloud computing services. |
| • | Security solutions: The information security market has been driven by an increase in threats and targeted attacks over the last several years. This is due to the substantial increase in sophistication of attacks (including organized crime and state-sponsored entities) and client adoption of new technologies such as cloud computing and IoT that have created new security exposures for businesses. Security attacks have affected nearly every organization, making security a top priority for senior management teams and boards of directors. Despite years of effort and an estimated tens of billions of dollars spent annually,8 we believe that most organizations are still not sufficiently protected against cyberattacks. Additionally, heightened sensitivity around data security has introduced new regulation and contractual requirements in a number of the industries we serve. According to Gartner and management estimates, the North American security market was $19 billion in 2016, with a projected CAGR of approximately 10% through 2021.9 Gartner defines security solutions as consulting, hardware support, implementation and IT outsourcing. |
We believe that we are well positioned within the fragmented North American IT Services market—where no individual company has over 5% market share, according to Gartner.10 We have become a trusted advisor to our middle-market clients by providing enterprise-class, vendor-agnostic and end-to-end solutions through our national team of engineers and strong local relationships. We believe that our value proposition will allow us to take market share because local and regional service providers lack our scale, technology expertise and end-to-end solution capabilities and the larger national and global firms do not have the focus, local relationships and organizational structure to provide solutions to the middle market.
Our Solutions
We consider ourselves to be a leading provider of end-to-end and innovative IT solutions across our three solution areas: (i) Digital Infrastructure, (ii) Cloud and (iii) Security. Due to the accelerated growth and adoption of cloud and security solutions, as seen in Gartner’s projected growth in our total addressable markets, we expect Cloud and Security to continue to drive a mix shift in our revenue base over time.
* * * * * *
Cloud solutions: …A recent survey by Gartner11 indicated that cloud solutions were the second highest area of planned growth in 2018 IT investment with no respondents indicating a reduction in spend.
* * * * * *
| 8 | See Gartner note (5) in the section titled “Market, Industry and Other Data.” |
| 9 | See Gartner note (5) in the section titled “Market, Industry and Other Data.” |
| 10 | See Gartner notes (1,4,5) in the section titled “Market, Industry and Other Data.” |
| 11 | See Gartner note (3) in the section titled “Market, Industry and Other Data.” |
4
Our History
Since our founding in 2004, the hallmarks of our culture have centered around client service and collaboration. Our business model has been defined by delivering engineering- and services-led solutions using a cost-effective, localized model that leverages a powerful OEM vendor ecosystem. This formula has driven our internal organic growth while at the same time setting the criteria for identifying acquisition opportunities. From our 2012 fiscal year to our 2017 fiscal year, we have grown our revenue from $1.76 billion to $2.82 billion, representing a 10% CAGR, which is significantly faster than U.S. IT spending and U.S. real GDP, which have grown at 1.1% and 1.9%, respectively, over the same periods, according to Gartner12 and the Bureau of Economic Analysis, respectively.13
BUSINESS
Company Overview
* * * * * *
Our strategic focus on the middle-market and high-growth solutions areas has enabled us to achieve 10% annualized growth in our revenue from our fiscal year ended June 30, 2012 to our fiscal year ended June 30, 2017. Over the same period, we have significantly outpaced the overall IT market growth rate, according to Gartner. We believe that we are well positioned for continued success as IT becomes more transformative and complex, driving demand for our solutions.
* * * * * *
Market overview
We operate in the large and growing North American IT market. According to Gartner, the overall North American IT market is expected to grow to $1.39 trillion by 2021, representing a 3.5% CAGR from 2016, and the IT Services sub-market is expected to grow by 5.0% over the same period, to $514 billion. Our primary focus is on the attractive middle market of the overall North American IT market, which, according to Gartner, is projected to grow from $238 billion in 2016 to $310 billion in 2021, representing a 5.5% CAGR. The middle market is one of the fastest growing segments of the overall North American IT market in part because its companies often employ smaller internal IT teams that do not have the broad expertise required to keep pace with increasingly complex IT environments and constant technology changes. Industry dynamics continue to favor services-led solutions providers, as businesses increasingly rely on us to advise them on complex IT projects, enabling them to better focus on their core capabilities and enhance productivity.
|
North America IT Spend by Category14
|
North America IT Spend by Company Size15
| |
|
|
|
While we primarily focus our operations on the U.S. middle market, we have generated sales in and have operations in Canada, the only other country included in Gartner’s North American IT market. Our sales in Canada were less than 1% of our revenue in the fiscal year ended June 30, 2017. Our total sales outside the United States represented approximately 2% of our total revenue for each of the fiscal years ended June 30, 2017, June 30, 2016, and June 30, 2015, and the growth rates of the overall North American IT market and the IT Services sub-market generally indicate a growing market for our business.
| 12 | See Gartner note (7) in the section titled “Market, Industry and Other Data.” |
| 13 | Source: Bureau of Economic Analysis—U.S. Department of Commerce, “NIPA Tables.” |
| 14 | See Gartner note (1) in the section titled “Market, Industry and Other Data.” |
| 15 | See Gartner note (2) in the section titled “Market, Industry and Other Data.” |
5
We believe that growth in IT spending will continue to be driven by the adoption of new technologies and market-related trends in cloud, security and IoT and the desire to integrate people, process and technology into digital business models. These trends reflect expanding IT complexity that organizations must manage to remain competitive; however, many middle-market companies lack the resources to design, integrate and manage full life cycle solutions across multiple technology silos to capitalize on these new technologies. A recent survey by Gartner16 predicted that the four biggest drivers of increased IT budget spend would be in the areas of analytics, infrastructure and datacenter, security and cloud, all of which are areas addressed by our core solutions.
Because of our strategic focus on high-growth solutions areas, our North American TAM is expected to grow at a 7.4% CAGR from $166 billion in 2016 to $237 billion in 2021, according to Gartner and management estimates.17
| Digital Infrastructure TAM18
|
Cloud TAM19
|
Security TAM20 | ||
|
|
| ||
Specific components of our TAM are as follows:
| • | Digital Infrastructure solutions: Gartner estimates that our addressable enterprise-class infrastructure market was $135 billion in 2016 and is projected to grow at a 3.7% CAGR through 2021. Gartner defines infrastructure solutions as infrastructure services, network services, data center hardware and software, data center outsourcing, enterprise network outsourcing, data center systems support and network systems support, as well as IoT implementation, operations and consulting. Gartner defines enterprise-class as “the ability of a given tool or product to handle complex processes or services.” We believe key emerging trends driving this growth include increased infrastructure requirements for cloud (public, private and multi) usage including integration of Software-as-a-Service (“SaaS”) applications into environments, low-latency requirements, software-defined networks (“SDN”), IoT-connected devices and data management strategies supporting data analytics. We enable businesses to capitalize on these emerging trends by designing and deploying new solutions and by refreshing and replacing their inflexible or under-provisioned existing networks and infrastructure. |
| • | Cloud solutions: Over the past several years, the SaaS, Platform-as-a-Service (“PaaS”) and Infrastructure-as-a-Service (“IaaS”) markets have provided a viable complement to traditional on premise, enterprise-class infrastructure solutions. Clients are deploying multi-cloud solutions that drive increased demand for private clouds, networking, storage and virtualization, as well as public-cloud integration. Gartner estimates that the North American cloud infrastructure opportunity was approximately $12 billion in 2016 and is projected to grow at a CAGR of approximately 31% through 2021. Gartner defines cloud solutions as cloud computing services. |
| • | Security solutions: The information security market has been driven by an increase in threats and targeted attacks over the last several years. This is due to the substantial increase in sophistication of attacks (including organized crime and state-sponsored entities) and client adoption of new technologies such as cloud computing and IoT that have created new security exposures for businesses. Security attacks have affected nearly every organization, making security a top priority for senior management teams and boards of directors. Despite years of effort and an estimated tens of billions of dollars spent annually,21 we believe that most organizations are still not sufficiently protected against cyberattacks. Additionally, heightened sensitivity around data security has introduced new regulation and contractual requirements in a number of the industries we serve. According to Gartner and |
| 16 | See Gartner note (3) in the section titled “Market, Industry and Other Data.” |
| 17 | See Gartner notes (1,4,5) in the section titled “Market, Industry and Other Data.” |
| 18 | See Gartner note (1) in the section titled “Market, Industry and Other Data.” |
| 19 | See Gartner note (4) in the section titled “Market, Industry and Other Data.” |
| 20 | See Gartner note (5) in the section titled “Market, Industry and Other Data.” |
| 21 | See Gartner note (5) in the section titled “Market, Industry and Other Data.” |
6
| management estimates, the North American security market was $19 billion in 2016, with a projected CAGR of approximately 10% through 2021.22 Gartner defines security solutions as consulting, hardware support, implementation and IT outsourcing. |
We believe that we are well positioned within the fragmented North American IT Services market—where no individual company has over 5% market share, according to Gartner.23 We have become a trusted advisor to our middle-market clients by providing enterprise-class, vendor-agnostic and end-to-end solutions through our national team of engineers and strong local relationships. We believe that our value proposition will allow us to take market share because local and regional service providers lack our scale, technology expertise and end-to-end solution capabilities and the larger national and global firms do not have the focus, local relationships and organizational structure to provide solutions to the middle market.
Our Solutions
We consider ourselves to be a leading provider of end-to-end and innovative IT solutions across our three solution areas: (i) Digital Infrastructure, (ii) Cloud and (iii) Security. Due to the accelerated growth and adoption of cloud and security solutions, as seen in Gartner’s projected growth in our total addressable markets, we expect Cloud and Security to continue to drive a mix shift in our revenue base over time.
* * * * * *
Cloud solutions: …A recent survey by Gartner24 indicated that cloud solutions were the second highest area of planned growth in 2018 IT investment with no respondents indicating a reduction in spend.
* * * * * *
Our History
Since our founding in 2004, the hallmarks of our culture have centered around client service and collaboration. Our business model has been defined by delivering engineering- and services-led solutions using a cost-effective, localized model that leverages a powerful OEM vendor ecosystem. This formula has driven our internal organic growth while at the same time setting the criteria for identifying acquisition opportunities. From our 2012 fiscal year to our 2017 fiscal year, we have grown our revenue from $1.76 billion to $2.82 billion, representing a 10% CAGR, which is significantly faster than U.S. IT spending and U.S. real GDP, which have grown at 1.1% and 1.9%, respectively, over the same periods, according to Gartner25 and the Bureau of Economic Analysis, respectively.26
EXPERTS
* * * * * *
Certain statistical and market data contained herein have been derived from and included herein in reliance upon, the market research report prepared by Gartner, Inc., an independent provider of research and analysis on the global IT industry, commissioned by the Company and issued on November 7, 2017 and upon the authority of said firm as experts with respect to the matters covered by its report.
Index to Exhibits
* * * * * *
| 23.3 | Consent of Gartner, Inc. |
| 22 | See Gartner note (5) in the section titled “Market, Industry and Other Data.” |
| 23 | See Gartner notes (1,4,5) in the section titled “Market, Industry and Other Data.” |
| 24 | See Gartner note (3) in the section titled “Market, Industry and Other Data.” |
| 25 | See Gartner note (7) in the section titled “Market, Industry and Other Data.” |
| 26 | Source: Bureau of Economic Analysis—U.S. Department of Commerce, “NIPA Tables.” |
7