Attached files
| file | filename |
|---|---|
| 8-K - 8-K - Invitation Homes Inc. | a8-k111417.htm |

Together with you, we make a house a home.
NAREIT
Presentation
November 2017

2
Disclaimer
This presentation may include forward looking statements within the meaning of the Private Securities Litigation Reform Act of 1995. These forward looking
statements, which are based on current expectations, estimates and projections about the industry and markets in which Invitation Homes Inc. (“INVH”) and
Starwood Waypoint Homes (“SFR”) operate and beliefs of and assumptions made by INVH management and SFR management, involve significant risks and
uncertainties, which are difficult to predict and are not guarantees of future performances, that could significantly affect the financial results of INVH or SFR or the
combined company. Words such as “projects,” “will,” “could,” “continue,” “expects,” “anticipates,” “intends,” “plans,” “believes,” “seeks,” “estimates,” “forecast,”
“guidance,” “outlook,” “may,” and “might” and variations of such words and similar expressions are intended to identify such forward looking statements, which
generally are not historical in nature. Such forward-looking statements may include, but are not limited to, statements about the anticipated benefits of the
proposed merger between SFR and INVH, including future financial and operating results, the attractiveness of the value to be received by SFR shareholders, the
attractiveness of the value to be received by INVH, the combined company's plans, objectives, expectations and intentions, the timing of future events,
anticipated administrative and operating synergies, the anticipated impact of the merger on net debt ratios, cost of capital, future dividend payment rates,
forecasts of accretion in Core Funds from Operations (“FFO”), Adjusted Funds from Operations (“AFFO”) or other earnings or performance measures, projected
capital improvements, expected sources of financing, and descriptions relating to these expectations. All statements that address operating performance, events
or developments that we expect or anticipate will occur in the future — including statements relating to expected synergies, improved liquidity and balance sheet
strength — are forward looking statements. Pro forma, projected and estimated numbers are used for illustrative purposes only, are not forecasts and may not
reflect actual results. These statements are not guarantees of future performance and involve certain risks, uncertainties and assumptions that are difficult to
predict. Our ability to predict results or the actual effect of future events, actions, plans or strategies is inherently uncertain. Although we believe the expectations
reflected in any forward-looking statements are based on reasonable assumptions, we can give no assurance that our expectations will be attained and therefore,
actual outcomes and results may differ materially from what is expressed or forecasted in such forward looking statements. Some of the factors that may
materially and adversely affect our business, financial condition, liquidity, results of operations and prospects, as well as our ability to make distributions to our
shareholders, include, but are not limited to: (i) national, regional and local economic climates; (ii) changes in the real estate and single family rental industry,
financial markets and interest rates, or to the business or financial condition of either company or business; (iii) increased or unanticipated competition for the
companies' properties; (iv) competition in the leasing market for quality residents; (v) increasing property taxes, homeowners’ association fees and insurance
costs, (vi) each company’s dependence on third parties for key services; (vii) risks related to evaluation of properties, poor resident selection and defaults and non-
renewals by either company’s residents; (viii) risks associated with acquisitions, including the integration of the combined companies' businesses; (ix) the potential
liability for the failure to meet regulatory requirements, including the maintenance of real estate investment trust (“REIT”) status; (x) availability of financing and
capital; (xi) risks associated with achieving expected revenue synergies or cost savings; (xii) risks associated with the companies' ability to consummate the merger
and the timing of the closing of the merger; (xiii) the outcome of claims and litigation involving or affecting either company; (xiv) applicable regulatory changes;
and (xv) those additional risks and factors discussed in reports filed with the Securities and Exchange Commission (“SEC”) by INVH and SFR from time to time,
including those discussed under the heading “Risk Factors” in their respective most recently filed reports on Forms 10-K and 10-Q and under the caption “Risk
Factors” in INVH’s definitive joint proxy statement/information statement and prospectus filed with the SEC under Rule 424(b)(3). Neither INVH nor SFR, except as
required by law, undertakes any duty to update any forward looking statements appearing in this presentation, whether as a result of new information, future
events or otherwise. Readers are cautioned not to place undue reliance on these forward-looking statements, which speak only as of the date hereof.
This presentation includes certain non-GAAP financial measures. These non-GAAP financial measures should be considered only as supplemental to, and not as
alternative or superior to, financial measures prepared in accordance with GAAP. Please refer to the Appendix of this presentation for a reconciliation of the non-
GAAP financial measures included in this presentation to the most directly comparable financial measures prepared in accordance with GAAP.

3
I. EXECUTIVE SUMMARY
Home Pictured: Seattle, WA Confidential

4
Investment Highlights
Highly Synergistic Combination of Two Premier Portfolios and Operating Platforms
________________________________________________
Note: For additional detail, please see notes in the Appendix section.
• Bringing together the best processes, people, and technology from two industry-leading innovators
• Enhancing operating efficiency by combining cutting-edge technology with a premier service platform
• Experienced management team with a demonstrated track record of success
Preeminent Operating
& Asset
Management Platform
• $45 – 50 million of identified(4) annual run-rate cost synergies
• Transaction expected to be accretive to Core FFO and AFFO on a run-rate basis
• Additional upside from combining best practices to optimize revenue management and operating efficiency
Substantial Cost
Synergies(4)
• Complementary portfolios of recently renovated homes in desirable locations, with 83% overlap(1)
• Focused on strategically selected high-growth regions (~70% of revenue from Western U.S. and Florida)(2)
• Over 82,000 homes, with over 4,800 homes per market on average(1)
Premier Portfolio
with Unmatched
Scale & Locations
• Top 20 REIT by Enterprise Value; enhanced liquidity in equity markets with public float increasing to ~$7 billion(5)
• Flexible balance sheet with enhanced path towards investment grade rating through continued deleveraging
• Scale, liquidity and synergies to drive lower long-term cost of capital
Enhanced Capital
Markets Positioning
• Low housing supply growth, with completions 44% below long-term average in Combined Company markets(3)
• JBREC expects 12.5M net households to form over the next 10 years, 58% of which will be renters
• Single Family Rental product and service are aligned with the lifestyle needs of the growing renter base
Compelling Industry
Fundamentals

5
Premier Single-Family Portfolio
Unmatched scale focused in strategically-selected high-growth locations
Overlapping Markets
Seattle
5%
Minne-
apolis
2%
Denver
3%
Dallas
3%
Houston
3%
Phoenix
6%
Atlanta
13%
Chicago
5%
Tampa
10%
Southern
California
13%
Las
Vegas
3%
South
Florida
14%
Non-Overlapping Markets
Northern
California
6%
Charlotte
5%
Nashville
1%
Jacksonville
2%
Orlando
6%
Combining Two Leading Portfolios with 83% locational overlap (1)~70%
of Revenue Generated
in Western U.S. and
Florida Regions (2)
>4,800
Homes per Market
on Average
>95%
of Revenue from
Markets with >2,000
Homes (2)
7.6%
Increase in
3Q 2017 NOI (3)
________________________________________________
Note: For additional detail, please see notes in the Appendix section.

6
Preeminent Operating & Asset Management Platform
Highly complementary and innovative platforms with substantial operating synergies
(1)
• Industry leading approach to customer
service
• ProCare service and maintenance
• Local market expertise
• Industry leading investment team and
process
• Industry leading technology
• ATLAS leasing, property and revenue
management system
• Smart Home enabled
• Experienced consolidator / integrator
Bringing Together the Best Practices, People, Systems and Technology from Two Industry Leaders

Bringing Together the Best of Two Accomplished Leadership Teams
Premier Leadership Team
7
Legacy Invitation Homes Legacy Starwood Waypoint Homes
Experience
• Current Executive
Chairman, Invitation
Homes
• AvalonBay
Communities (NYSE:
AVB)
• Trammell Crow
Residential
• Current Board
Positions: PulteGroup
and Regency Centers
Bryce Blair
Chairman, Board of
Directors
Experience
• Current CIO, Invitation
Homes
• Invitation Homes
Founder
• Treehouse Group
Dallas B. Tanner
Chief Investment
Officer
Experience
• Current CEO, Starwood
Waypoint Homes
• Colony American
Homes
• Equity Residential
(NYSE: EQR)
• Residential Asset
Management Group
• National Rental Home
Council
• National Multi-Housing
Council
• California Housing
Council
• USC Lusk Center for
Real Estate
Frederick C. Tuomi
Chief Executive Officer
Experience
• Current COO, Starwood
Waypoint Homes
• Waypoint Manager
• Mesa Development
• Goldman Sachs & Co.
• The Kaleidoscope
Group
• Stanford Real Estate
Council
Charles D. Young
Chief Operating
Officer
Ernest M. Freedman
Chief Financial
Officer
Experience
• Current CFO, Invitation
Homes
• AIMCO (NYSE: AIV)
• HEI Hotels & Resorts
• GE Real Estate
• Ernst & Young

II. COMPELLING INDUSTRY FUNDAMENTALS
8

Supply-demand remains supportive of growth
9
Favorable Macro Fundamentals
________________________________________________
Source: Company public filings, Moody’s, John Burns, and BLS.
Note: For additional detail, please see notes in the Appendix section.
Total Single Family Completions
(% of households)
1.8%
1.0%
1985 - 2016 U.S. Average 2017E Combined Company Markets
(1)
Projected Near-term Job Growth
(2017E)
1.5%
2.1%
U.S. Average Combined Company Markets
(1)

JBREC expects 12.5M net households to form over the next 10 years
10
Demographics Create a Long Runway for Household Formations
________________________________________________
Source: John Burns Real Estate Consulting (JBREC) – Demographic Trends and the Outlook for Single Family Rentals, April 2017.
Note: For additional detail, please see notes in the Appendix section.
Younger generations have shown a higher tendency to rent than own their homes
58% of the 12.5M net new households to be formed by 2025 are expected to be renters (1)

21.1
22.7
22.5
21.7
20.4
20.2
20.9
18.0
19.0
20.0
21.0
22.0
23.0
15-19 20-24 25-29 30-34 35-39 40-44 45-49
Age and lifestyle needs of renter base positions Single-Family Rentals to capture household growth
11
Single-Family Rental Positioned to Take Incremental Market Share
Avg. IH
Resident
Age: 40
Current Population by Age Cohort
(millions of people)
Future
Demand
Single-Family Renters Multifamily Renters
38% Married 21% Married
17%11%
31% 37%
Age Group
Marital Status
58% 46%
Under 35
65+
5%15%
48% 70%
Number of Kids
37% 25%
No Kids
3+ Kids
1-2 Kids
35-64
________________________________________________
Sources: U.S. Census Bureau and John Burns Real Estate Consulting, June 2017
Comparing the United States’ 16 Million Single-Family
Renters to its 28 Million Multifamily Renters
(as estimated by John Burns Real Estate Consulting)
Home Pictured: Orlando, FL 12
III. MERGER BENEFICIAL TO ALL SHAREHOLDERS
Confidential

Combining two industry pioneers, creating a world-class residential REIT
13
Uniquely Strategic and Beneficial Combination
► The premier portfolio in the single-family rental sector
► Unparalleled scale and focus on high-growth locations
► Substantial cost synergies to come from portfolio overlap and platform optimization
► Enhanced leasing and customer experience for residents
► Led by industry innovators with highly complementary capabilities
► Poised to capitalize on strong industry fundamentals
► Positioned to drive superior long-term growth and shareholder value

Portfolios are Nearly Identical on Major Metrics
14
True Merger of Equals – Compelling Strategic Logic
Average Rent PSF
Blended Same Store
Rent Growth (2)
Same Store Occupancy(3)
% of Revenue Generated
in Western U.S. and Florida
Locations(1)
Average Monthly Rent(1)
$0.90
+4.6%
95.1%
63%
$1,654
$0.92
+4.7%
95.4%
72%
$1,705
________________________________________________
Note: For additional detail, please see notes in the Appendix section.

Scale Within Markets Is Critical to Operating Efficiency
15
Unmatched Scale in High-Growth Markets
________________________________________________
Note: For additional detail, please see notes in the Appendix section.
Total Home Count as of September 30, 2017 Combined Top 10 Markets (Sorted by Revenue)
47,867
34,620 82,487
Combined Company
Over 4,800 Homes Per Market on Average(1)
Over 83% of Revenue from the Top 10 Markets(2)
~70% of Revenues from Western U.S. and Florida
(1)(1)
1
2
3
4
5
6
7
8
9
10
Markets Total Home Count(1) % of Revenue(2)
South Florida 9,369 14%
Southern California 8,416 13%
Atlanta 12,412 13%
Tampa 8,840 10%
Phoenix 7,442 6%
Orlando 5,682 6%
Northern California 4,640 6%
Chicago 4,057 5%
Charlotte 4,764 5%
Seattle 3,246 5%
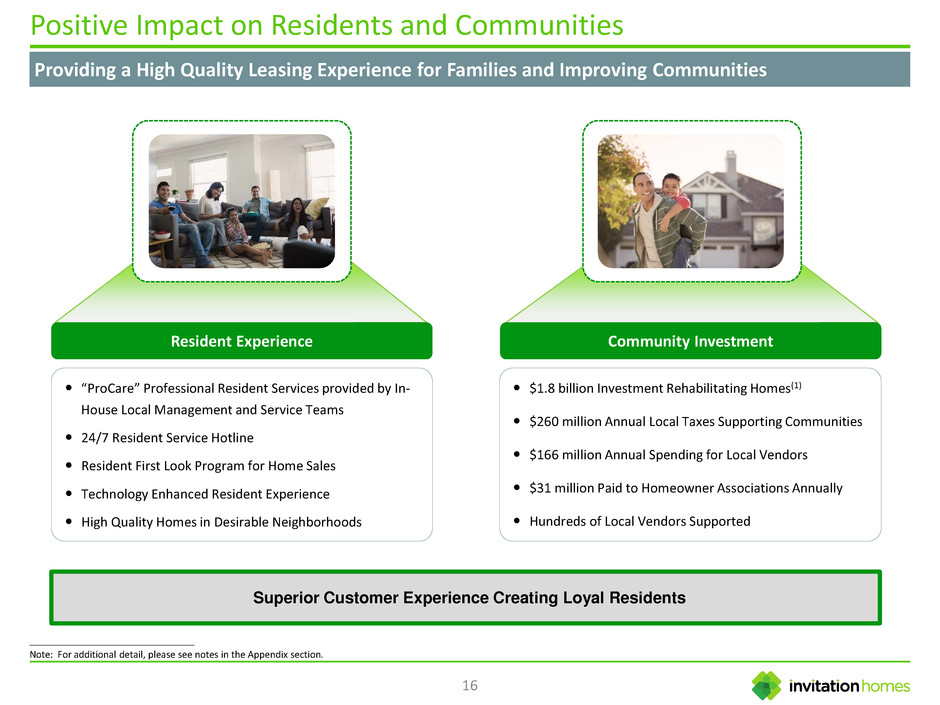
Providing a High Quality Leasing Experience for Families and Improving Communities
16
Positive Impact on Residents and Communities
________________________________________________
Note: For additional detail, please see notes in the Appendix section.
$1.8 billion Investment Rehabilitating Homes(1)
$260 million Annual Local Taxes Supporting Communities
$166 million Annual Spending for Local Vendors
$31 million Paid to Homeowner Associations Annually
Hundreds of Local Vendors Supported
“ProCare” Professional Resident Services provided by In-
House Local Management and Service Teams
24/7 Resident Service Hotline
Resident First Look Program for Home Sales
Technology Enhanced Resident Experience
High Quality Homes in Desirable Neighborhoods
Community InvestmentResident Experience
Superior Customer Experience Creating Loyal Residents

Accretive Efficiencies and Cost Synergies (1)
17
Substantial Identified Cost Synergies (1)
________________________________________________
Note: For additional detail, please see notes in the Appendix section.
Category Est. Annual Run-Rate Savings Description
Property-Related Expenses $15.0 – 17.5 million
Field operations optimization, insurance savings, and
other vendor and subscription services savings
Corporate-Related Expenses $30.0 – 32.5 million
Corporate overhead consolidation, public company
cost savings, and other vendor and subscription
services savings
Total Expected Synergies $45 – 50 million
• 75% of synergies are expected to be realized on a run-rate basis within 12 months of closing
• 100% of synergies are expected to be achieved on a run-rate basis within 18 months of closing

Flexible capital structure with diversity of capital sources and increased liquidity
18
Low-Cost, Flexible Capital Structure
________________________________________________
Source: Company public filings.
Note: For additional detail, please see notes in the Appendix section.
Predominantly Fixed Rate (or Hedged) Debt(4)
As of September 30, 2017, pro forma IH 2017-2 securitization and associated
repayments in November 2017
Key Features of Capital Structure
As of September 30, 2017, pro forma IH 2017-2 securitization and associated
repayments in November 2017
► ~$7 billion Combined Company Public Float
► 41% Net Debt to Enterprise Value(1)
► 3.34% Weighted Average Cost of Debt(2)
► No debt maturities until 2019
► Flexible capital stack that is mostly prepayable at no cost
► Significant liquidity with $1.5 billion available through
revolving lines of credit and unrestricted cash(3)
► Focused on delevering and working toward investment
grade corporate rating
Fixed or
Hedged
82%
Floating
18%
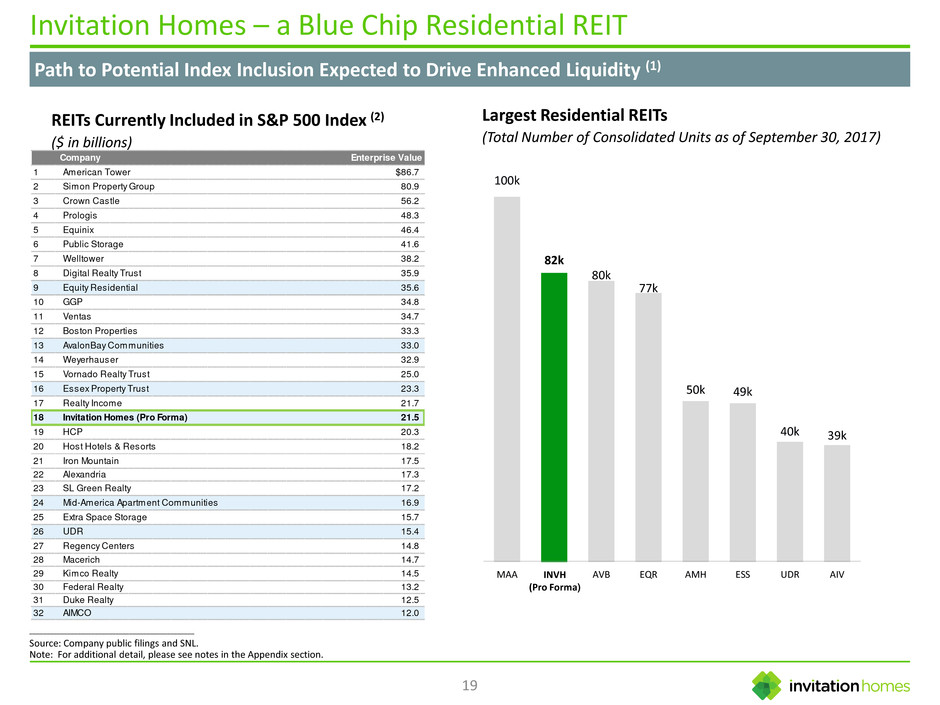
Path to Potential Index Inclusion Expected to Drive Enhanced Liquidity (1)
19
Invitation Homes – a Blue Chip Residential REIT
REITs Currently Included in S&P 500 Index (2)
($ in billions)
Largest Residential REITs
(Total Number of Consolidated Units as of September 30, 2017)
100k
82k
80k
77k
50k 49k
40k 39k
MAA AVB EQR AMH ESS UDR AIVINVH
(Pro Forma)
________________________________________________
Source: Company public filings and SNL.
Note: For additional detail, please see notes in the Appendix section.
Company Enterprise Value
1 American Tower $86.7
2 Simon Property Group 80.9
3 Crown Castle 56.2
4 Prologis 48.3
5 Equinix 46.4
6 Public Storage 41.6
7 Welltower 38.2
8 Digital Realty Trust 35.9
9 Equity Residential 35.6
10 GGP 34.8
11 Ventas 34.7
12 Boston Properties 33.3
13 AvalonBay Communities 33.0
14 Weyerhauser 32.9
15 Vornado Realty Trust 25.0
16 Essex Property Trust 23.3
17 Realty Income 21.7
18 Invitation Homes (Pro Forma) 21.5
19 HCP 20.3
20 Host Hotels & Resorts 18.2
21 Iron Mountain 17.5
22 Alexandria 17.3
23 SL Green Realty 17.2
24 Mid-America Apartment Communities 16.9
25 Extra Space Storage 15.7
26 UDR 15.4
27 Regency Centers 14.8
28 Macerich 14.7
29 Kimco Realty 14.5
30 Federal Realty 13.2
31 Duke Realty 12.5
32 AIMCO 12.0

IV. STRONG GROWTH AND PERFORMANCE
20
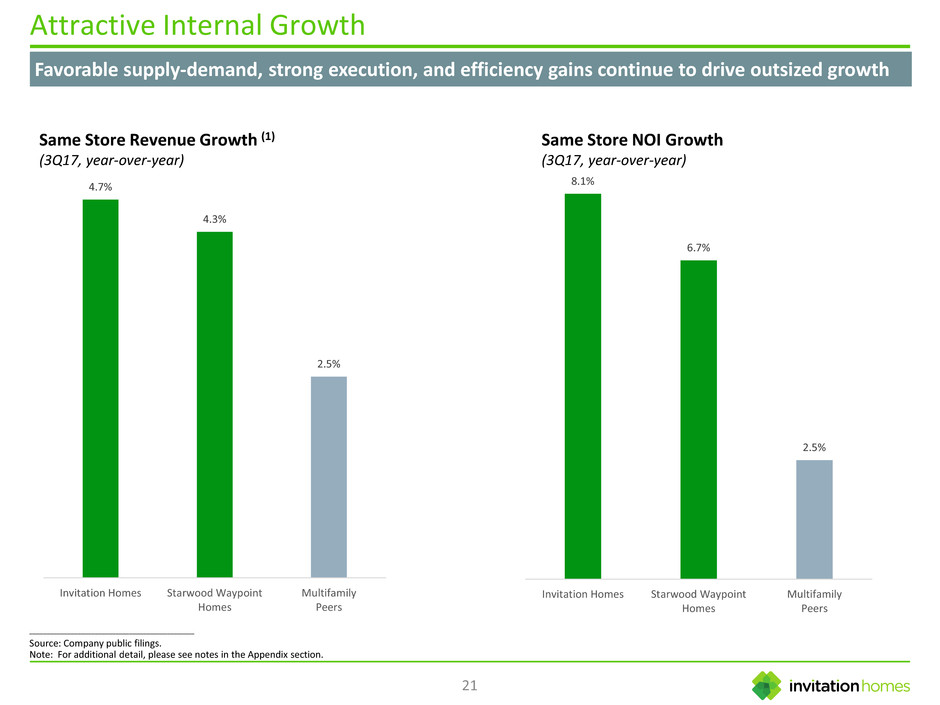
8.1%
6.7%
2.5%
Invitation Homes Starwood Waypoint
Homes
Multifamily
Peers
4.7%
4.3%
2.5%
Invitation Homes Starwood Waypoint
Homes
Multifamily
Peers
21
Attractive Internal Growth
Favorable supply-demand, strong execution, and efficiency gains continue to drive outsized growth
Same Store Revenue Growth (1)
(3Q17, year-over-year)
Same Store NOI Growth
(3Q17, year-over-year)
________________________________________________
Source: Company public filings.
Note: For additional detail, please see notes in the Appendix section.

35%
36%
51%
Invitation Homes Starwood Waypoint
Homes
Multifamily
Peers
4.3%
4.4%
2.4%
Invitation Homes Starwood Waypoint
Homes
Multifamily
Peers
22
Strong Rent Growth with Low Turnover
Quality of portfolio and resident service enable strong rent growth and low turnover
Same Store Blended Net Effective Rent Growth
(3Q17, lease-over-lease)
Same Store Turnover
(Trailing twelve months as of 3Q17-end)
________________________________________________
Source: Company public filings.
Note: For additional detail, please see notes in the Appendix section.

23Home Pictured: Southern CA
IV. APPENDIX
24
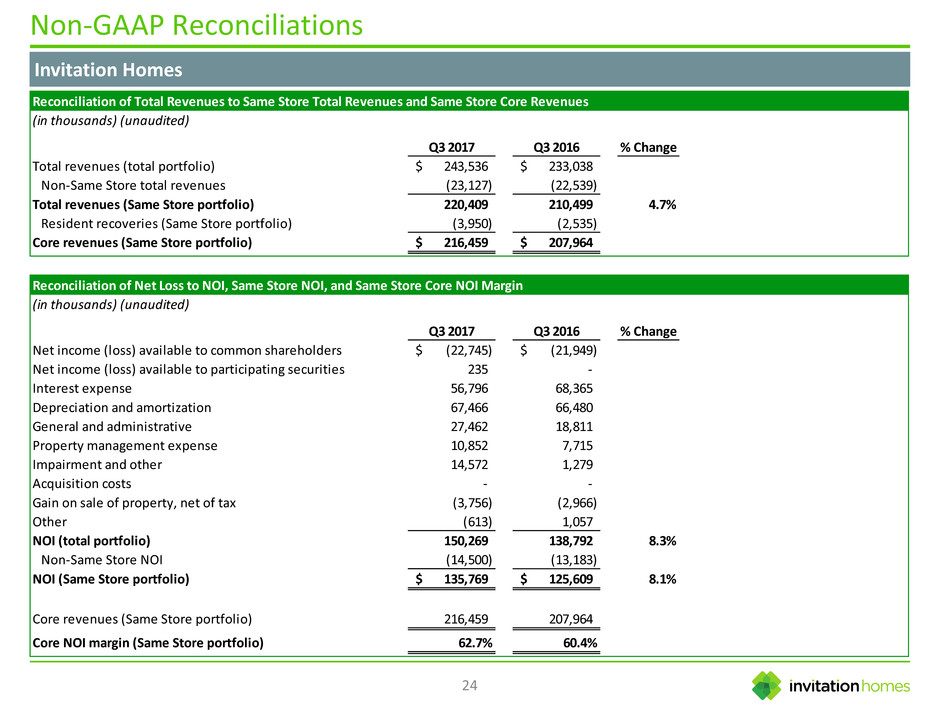
Non-GAAP Reconciliations
Invitation Homes
Reconciliation of Total Revenues to Same Store Total Revenues and Same Store Core Revenues
(in thousands) (unaudited)
Q3 2017 Q3 2016 % Change
Total revenues (total portfolio) 243,536$ 233,038$
Non-Same Store total revenues (23,127) (22,539)
Total revenues (Same Store portfolio) 220,409 210,499 4.7%
Resident recoveries (Same Store portfolio) (3,950) (2,535)
Core revenues (Same Store portfolio) 216,459$ 207,964$
Reconciliation of Net Loss to NOI, Same Store NOI, and Same Store Core NOI Margin
(in thousands) (unaudited)
Q3 2017 Q3 2016 % Change
Net income (loss) available to common shareholders (22,745)$ (21,949)$
Net income (loss) available to participating securities 235 -
Interest expense 56,796 68,365
Depreciation and amortization 67,466 66,480
General and administrative 27,462 18,811
Property management expense 10,852 7,715
Impairment and other 14,572 1,279
Acquisition costs - -
Gain on sale of property, net of tax (3,756) (2,966)
Other (613) 1,057
NOI (total portfolio) 150,269 138,792 8.3%
Non-Same Store NOI (14,500) (13,183)
NOI (Same Store portfolio) 135,769$ 125,609$ 8.1%
Core revenues (Same Store portfolio) 216,459 207,964
Core NOI margin (Same Store portfolio) 62.7% 60.4%

25
Non-GAAP Reconciliations
Starwood Waypoint Homes
Reconciliation of Total Revenues to Same Store Total Revenues and Same Store Core Revenues
(in thousands) (unaudited)
Q3 2017 Q3 2016 % Change
Total revenues (total portfolio) 169,687$ 146,099$
Non-Same Store total revenues (34,172) (17,069)
Total revenues (Same Store portfolio) 135,515 129,030 5.0%
Resident recoveries (Same Store portfolio) (7,928) (6,670)
Core revenues (Same Store portfolio) 127,587$ 122,360$
Reconciliation of Net Loss to NOI, Same Store NOI, and Same Store Core NOI Margin
(in thousands) (unaudited)
Q3 2017 Q3 2016 % Change
Net income (loss) available to common shareholders (23,159)$ (10,900)$
Net income (loss) available to participating securities
Gain (Loss) from discontinued operations (NPL/REO) 1,984 (449)
General and administrative 10,932 11,333
Share-based compensation 2,387 824
Interest expense 38,877 39,296
Depreciation and amortization 53,994 47,344
Transaction-related 7,791 1,503
Impairment of real estate 13,077 356
Realized (gain) loss on sales of investments in real estate, net (3,735) (1,453)
Equity in income from unconsolidated joint ventures (214) (185)
Other (expense) income, net 372 (1,867)
Income tax expense 359 161
Net income attributable to non-controlling interests (1,062) (691)
NOI (total portfolio) 101,603 85,272 19.2%
Property operating revenues on Non-Same Store portfolio (1) (34,172) (17,069)
Property operating Expenses on Non-Same Store portfolio (1) 14,287 8,359
NOI (Non-Same Store portfolio) (19,885) (8,710)
NOI (Same Store portfolio) 81,718 76,562 6.7%
Rental income 125,483 120,878
Fee income 3,953 3,541
Less bad debt expense (1,849) (2,059)
Core revenues (Same Store portfolio) 127,587$ 122,360$ 4.3%
Core NOI margin (Same Store portfolio) 64.0% 62.6%

26
Notes
Page 4
Note: Unless otherwise noted, all information is as of September 30, 2017.
Source: Company public filings, Moody’s Analytics, John Burns Real Estate Consulting.
1) Based on Total Homes in Invitation Homes and Starwood Waypoint Homes markets, excluding 798 Starwood Waypoint Homes homes in a managed joint venture; overlap based on % of Total Homes in
shared Invitation Homes and Starwood Waypoint Homes markets.
2) Based on Average Monthly Rent of Invitation Homes for 3Q 2017 and Average Monthly Rent per Occupied Home of Starwood Waypoint Homes as of September 30, 2017 for the total portfolio; includes
properties in the GI Portfolio intended to be held for the long-term, excludes 815 properties that we do not intend to hold for the long term and 96 properties removed due to hurricane damage.
3) Source: Moody’s Analytics. Represents 2017 forecast completions as a percentage of total households, relative to average completions as a percentage of total households from 1985 – 2016.
4) Synergies are estimates based on the current expectations of Invitation Homes and Starwood Waypoint Homes. No assurance can be given that the combined company will achieve the expected
synergies, and Invitation Homes’ and Starwood Waypoint Homes’ expectations may change.
5) Sized based on enterprise value using total diluted shares outstanding on September 30, 2017 and stock price as of November 10, 2017.
Page 5
Note: Unless otherwise noted, all information is as of September 30, 2017; Figures on the map reflect % of total homes by market for the Combined Company.
Source: Company public filings.
1) Represents % of Total Homes in shared Invitation Homes and Starwood Waypoint Homes markets, excluding 798 Starwood Waypoint Homes homes in a managed joint venture.
2) Based on Average Monthly Rent of Invitation Homes for 3Q 2017 and Average Monthly Rent per Occupied Home of Starwood Waypoint Homes as of September 30, 2017 for the total portfolio; includes
properties in the GI Portfolio intended to be held for the long-term, excludes 815 properties that we do not intend to hold for the long term and 96 properties removed due to hurricane damage.
3) Same Store basis for Combined Company, year-over-year; see GAAP reconciliations to Net Operating Income on pages 24 and 25.
Page 9
1) Weighted by Total Homes, excluding 798 Starwood Waypoint Homes homes in a managed joint venture.
Page 10
1) Estimated by John Burns Real Estate Consulting (JBREC) – Demographic Trends and the Outlook for Single Family Rentals, April 2017.
Page 14
Note: Unless otherwise noted, all information is as of September 30, 2017.
Source: Company public filings.
1) Based on Average Monthly Rent of Invitation Homes for 3Q 2017 and Average Monthly Rent per Occupied Home of Starwood Waypoint Homes as of September 30, 2017 for the total portfolio; includes
properties in the GI Portfolio intended to be held for the long-term, excludes 815 properties that we do not intend to hold for the long term and 96 properties removed due to hurricane damage.
2) Reflects average new and renewal rent growth for YTD 3Q 2017.
3) Reflects Same Store average occupancy in 3Q 2017 for Invitation Homes and Same Store occupancy as of September 30, 2017 for Starwood Waypoint Homes.
Page 15
Note: Unless otherwise noted, all information is as of September 30, 2017.
Source: Company public filings.
1) Based on Total Homes in Invitation Homes and Starwood Waypoint Homes markets, excluding 798 Starwood Waypoint Homes homes in a managed joint venture.
2) Based on Average Monthly Rent of Invitation Homes for 3Q 2017 and Average Monthly Rent per Occupied Home of Starwood Waypoint Homes as of September 30, 2017 for the total portfolio; includes
properties in the GI Portfolio intended to be held for the long-term, excludes 815 properties that we do not intend to hold for the long term and 96 properties removed due to hurricane damage.
Page 16
1) Reflects total capital spent on renovation by Invitation Homes and Starwood Waypoint Homes since acquisition (excludes FNMA JV and GI portfolio).
Page 17
1) Synergies are estimates based on the current expectations of Invitation Homes and Starwood Waypoint Homes. No assurance can be given that the combined company will achieve the expected
synergies, and Invitation Homes’ and Starwood Waypoint Homes’ expectations may change.

27
Notes
Page 18
Note: Unless otherwise noted, all information is as of September 30, 2017.
Source: Company public filings.
1) Net Debt is net of retained and repurchased certificates, cash, and restricted cash (excluding security deposits). EV is calculated based on total diluted shares outstanding on September 30, 2017 and stock
price as of November 10, 2017
2) Based on the reported cost of debt for INVH and SFR excluding retained and repurchased certificates, weighted by each company’s total debt amount as of September 30, 2017 with pro forma impact of IH
2017-2 securitization and associated repayments in November 2017; 1 Month LIBOR as of September 30, 2017.
3) Does not include liquidity from the SFR revolving credit facility.
4) Net of retained and repurchased certificates.
Page 19
1) Inclusion in the S&P 500 index is based on a variety of factors that are revised from time to time and any additions to the index are made in the sole judgment and discretion of the S&P Dow Jones Indices.
No assurance can be given that, following the merger or any time thereafter, the combined company will meet the standards required for inclusion in the index or that S&P Dow Jones Indices will decide
to add the combined company to the index.
2) SNL Total Enterprise Value metric. Market data as of November 10, 2017.
Page 21
Note: Multifamily Peers reflects the average of AIV, AVB, CPT, EQR, ESS, MAA, and UDR.
1) Represents core revenue growth for SFR to normalize for the impact of change in utility billing policy, and standard revenue growth for INVH.
Page 22
Note: Multifamily Peers reflects the average of AIV, AVB, CPT, EQR, ESS, MAA, and UDR.
