Attached files
| file | filename |
|---|---|
| 8-K - 8-K - Infor, Inc. | d489531d8k.htm |
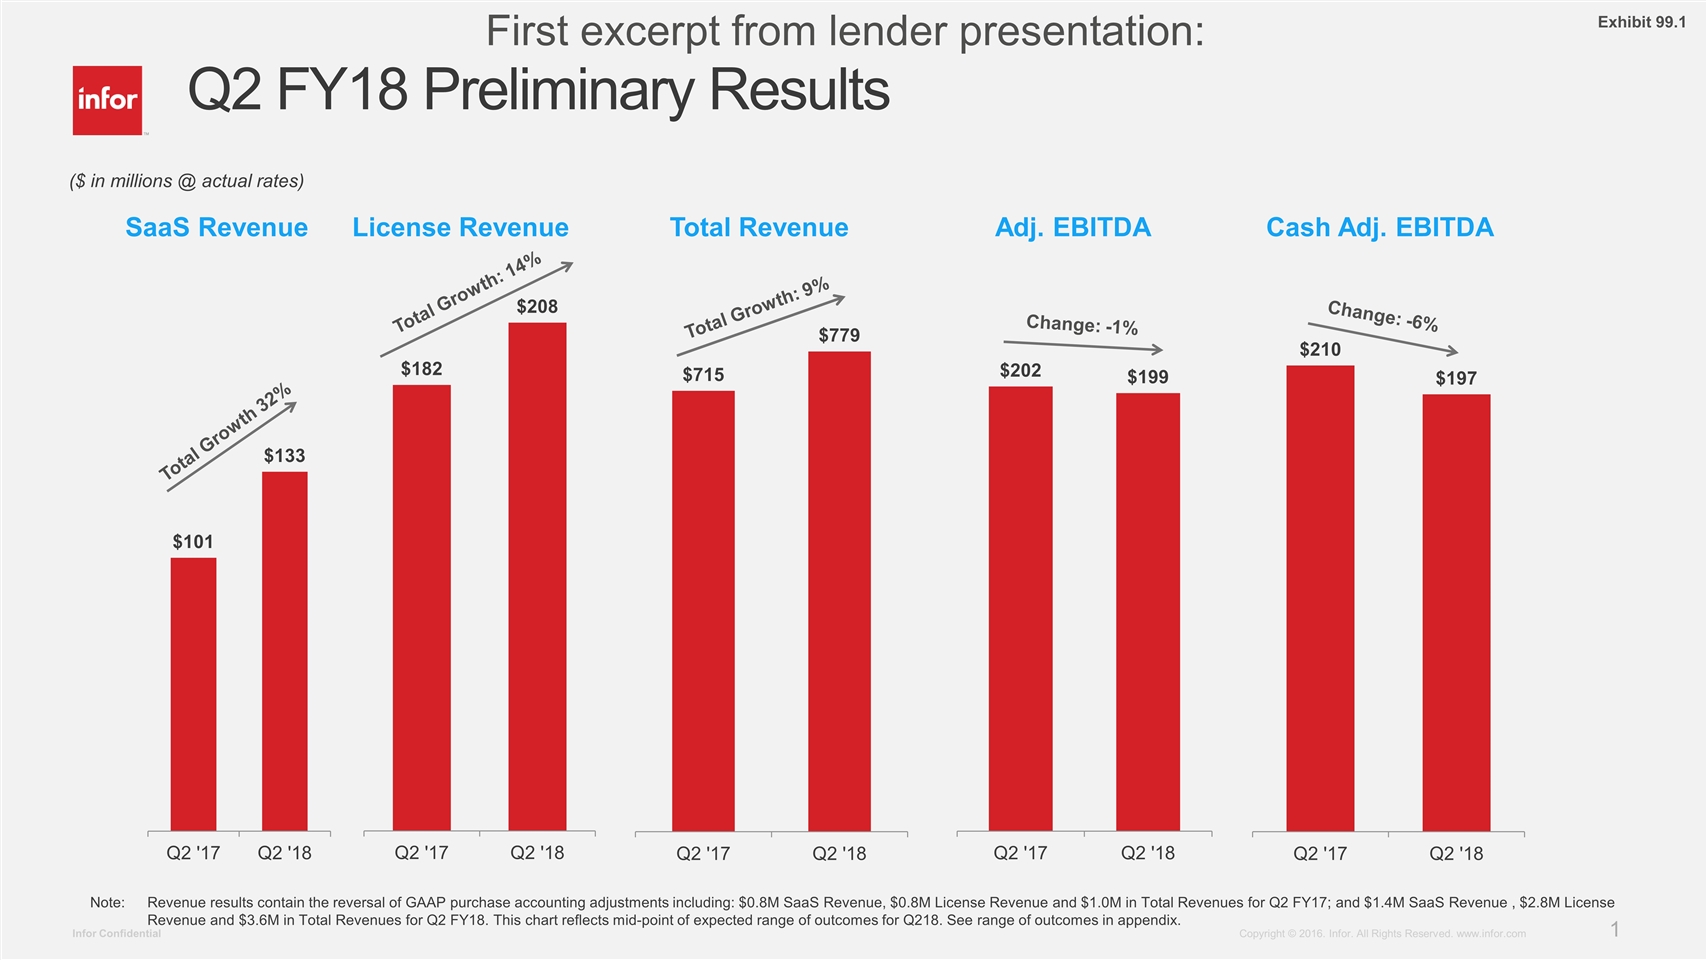
SaaS Revenue Total Growth 32% License Revenue Total Growth: 14% Total Revenue Total Growth: 9% ($ in millions @ actual rates) Note: Revenue results contain the reversal of GAAP purchase accounting adjustments. Cash Adj. EBITDA Change: -6% Adj. EBITDA Change: -1% Q2 FY18 Preliminary Results Note:Revenue results contain the reversal of GAAP purchase accounting adjustments including: $0.8M SaaS Revenue, $0.8M License Revenue and $1.0M in Total Revenues for Q2 FY17; and $1.4M SaaS Revenue , $2.8M License Revenue and $3.6M in Total Revenues for Q2 FY18. This chart reflects mid-point of expected range of outcomes for Q218. See range of outcomes in appendix. Exhibit 99.1 First excerpt from lender presentation:
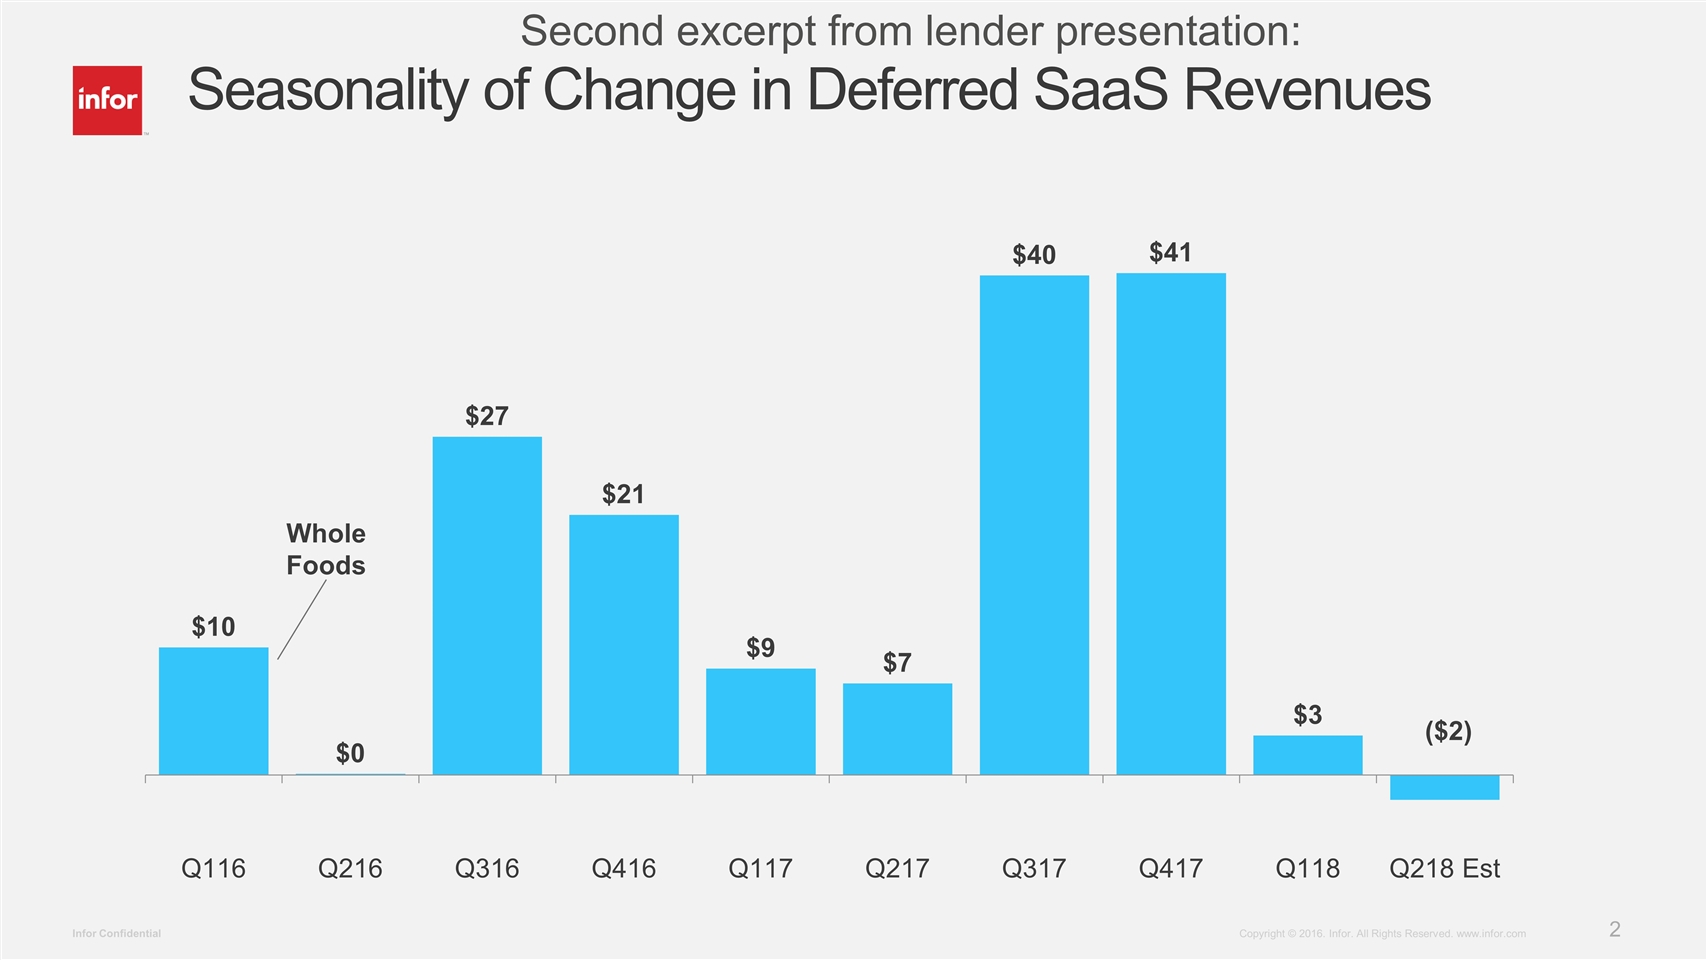
Whole Foods Seasonality of Change in Deferred SaaS Revenues Second excerpt from lender presentation:
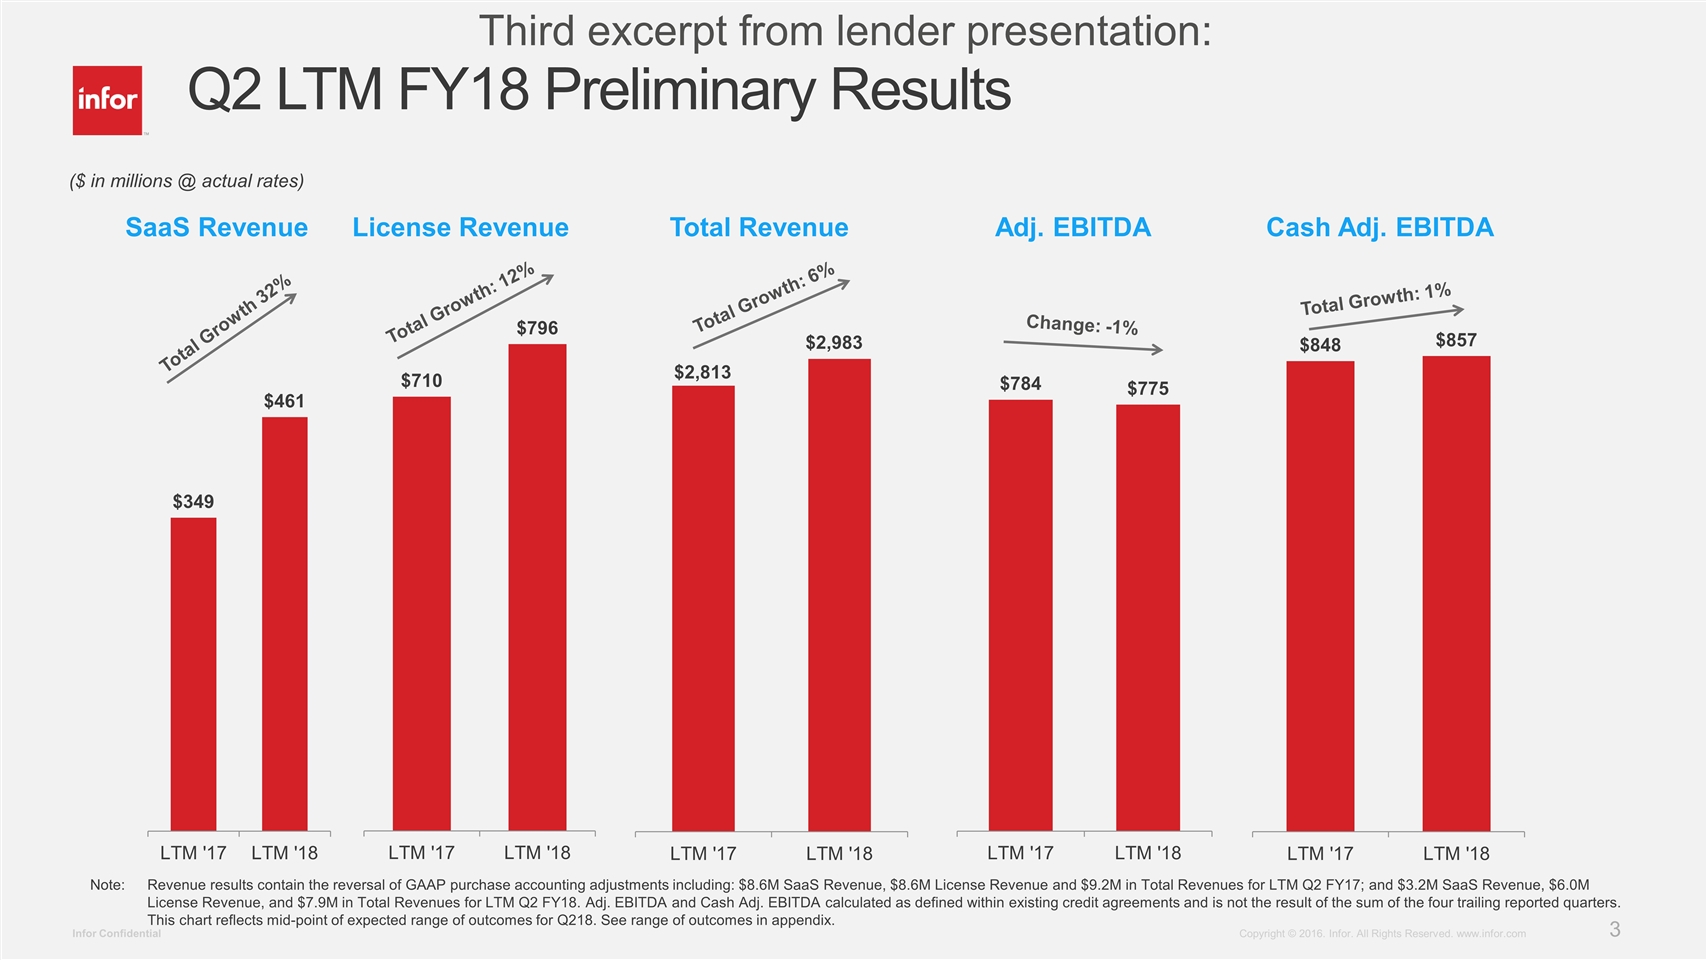
Note: Revenue results contain the reversal of GAAP purchase accounting adjustments. Q2 LTM FY18 Preliminary Results Note:Revenue results contain the reversal of GAAP purchase accounting adjustments including: $8.6M SaaS Revenue, $8.6M License Revenue and $9.2M in Total Revenues for LTM Q2 FY17; and $3.2M SaaS Revenue, $6.0M License Revenue, and $7.9M in Total Revenues for LTM Q2 FY18. Adj. EBITDA and Cash Adj. EBITDA calculated as defined within existing credit agreements and is not the result of the sum of the four trailing reported quarters. This chart reflects mid-point of expected range of outcomes for Q218. See range of outcomes in appendix. SaaS Revenue Total Growth 32% License Revenue Total Growth: 12% Total Revenue Total Growth: 6% Cash Adj. EBITDA Total Growth: 1% Change: -1% Adj. EBITDA ($ in millions @ actual rates) Third excerpt from lender presentation:
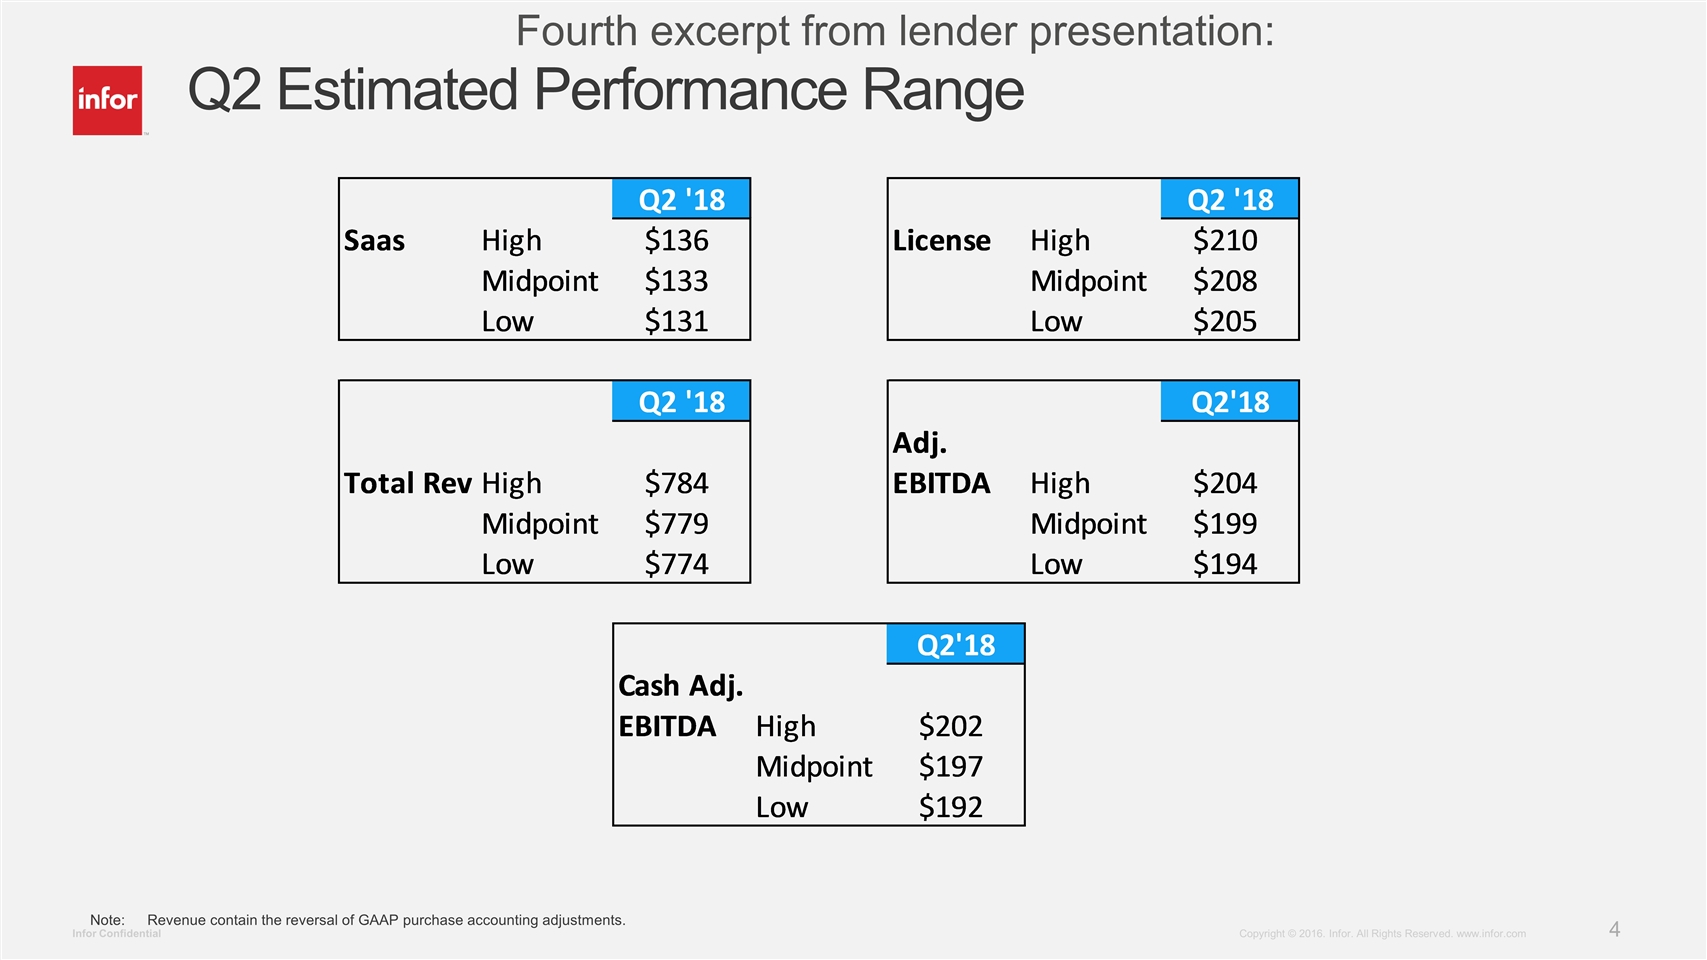
Q2 Estimated Performance Range Note:Revenue contain the reversal of GAAP purchase accounting adjustments. Fourth excerpt from lender presentation:
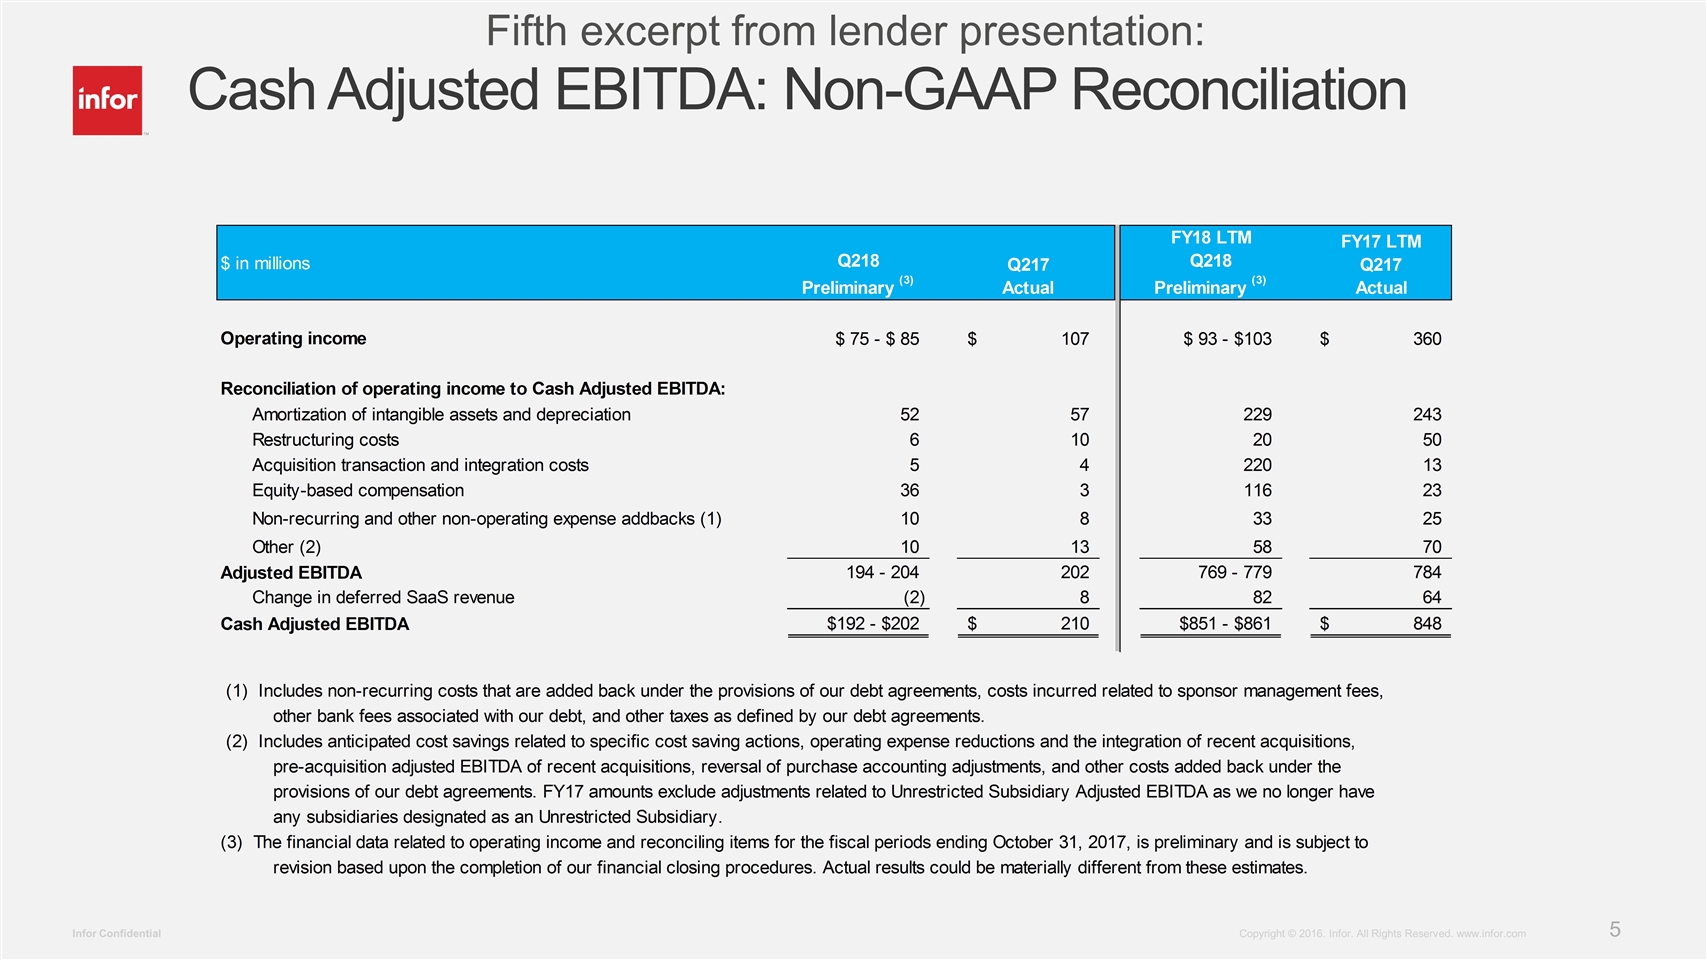
Cash Adjusted EBITDA: Non-GAAP Reconciliation Fifth excerpt from lender presentation:
