Attached files
| file | filename |
|---|---|
| 8-K - 8-K - GREEN DOT CORP | a2017-11x13form8xkinvestor.htm |

Q317 Investor Presentation
November 2017

Green Dot Corporation - Confidential 1
Disclosures
About Non-GAAP Financial Measures
During this presentation, references to financial measures of Green Dot Corporation will include references to non-GAAP financial measures.
For an explanation to the most directly comparable GAAP financial measures, see the Appendix to these materials or the Supplemental Non-
GAAP Financial Information available at Green Dot Corporation’s investor relations website at http://ir.greendot.com/ under “Financial
Information.”
Forward-Looking Statements
This presentation contains forward-looking statements, which are subject to the safe harbor provisions of the Private Securities Litigation
Reform Act of 1995. These statements include, among other things, statements contained in the slide titled “Revised Outlook for 2017” and
statements regarding future events that involve risks and uncertainties. Actual results may differ materially from those contained in the forward-
looking statements contained in this presentation, and reported results should not be considered as an indication of future performance. The
potential risks and uncertainties that could cause actual results to differ from those projected include, among other things, the timing and impact
of revenue growth activities, the Company's dependence on revenues derived from Walmart, impact of competition, the Company's reliance on
retail distributors for the promotion of its products and services, demand for the Company's new and existing products and services, continued
and improving returns from the Company's investments in new growth initiatives, potential difficulties in integrating operations of acquired
entities and acquired technologies, the Company's ability to operate in a highly regulated environment, changes to existing laws or regulations
affecting the Company's operating methods or economics, the Company's reliance on third-party vendors, changes in credit card association or
other network rules or standards, changes in card association and debit network fees or products or interchange rates, instances of fraud
developments in the prepaid financial services industry that impact prepaid debit card usage generally, business interruption or systems failure,
and the Company's involvement litigation or investigations. These and other risks are discussed in greater detail in the Company's Securities
and Exchange Commission filings, including its most recent annual report on Form 10-K and quarterly report on Form 10-Q, which are available
on the Company's investor relations website at ir.greendot.com and on the SEC website at sec.gov. All information provided in this release and
in the attachments is as of November 13, 2017, and the Company assumes no obligation to update this information as a result of future events
or developments.

2
What is Green Dot?
• Green Dot is a technology-centric United States Bank Holding Company
• Its mission is to reinvent personal banking for the masses
• The company deploys a “Products and Platform” business strategy
– As a “Product Company,” Green Dot uses its own bank, Green Dot Bank, and its own high-
scale and robust Banking as a Service or “BaaS” platform to create, design, develop and
distribute its own branded financial products and services through a massive omni-channel
consumer distribution network.
– As a “Platform Company,” Green Dot enables others to utilize its “Banking as a
Service” platform to enable those “platform partners” to create, design, develop and distribute
their own innovative and bespoke banking and financial products to satisfy their own business
strategies.
In all cases, Green Dot is directly accountable for all aspects of a program’s operational and regulatory integrity, inclusive
of ensuring the program’s compliance with all applicable banking regulations, applicable state and federal laws and Green
Dot’s various internal governance policies and procedures related to risk and compliance management.

Green Dot Corporation - Confidential 3
How Do We Make Money?
Revenue Categories:
Transaction Fees: Tax refund processing, swipe reloads, ATM usage, SimplyPaid disbursements,
MoneyPak retail purchase fee, new card retail purchase fee, etc.
Recurring Fees: Monthly account fees, primarily
Interchange: Issuer’s portion of total interchange generated when a card is used to make a
purchase at a merchant
Interest Income: Primarily interest income generated on investable account balances held at
Green Dot Bank and Green Dot Corp; and from outstanding loan balances
primarily from our growing Secured Credit Card portfolio
Most Common Revenue Models by Channel:
Retail Distribution: Retailer earns a share of the new product and reload “Transaction Fee”
FSC Distribution: FSC chain earns a share of multiple revenue categories
Direct Distribution: Green Dot keeps 100% of all revenue categories
BaaS Programs: Green Dot and the Platform Partner share in certain revenue categories; or the
Platform Partner pays Green Dot fees for services provided

Green Dot Corporation - Confidential 4
PRODUCTS That DO THINGS To SOLVE REAL CUSTOMER PAIN POINTS
We are a Product Company

5
Green Dot’s “Banking as a Service” (BaaS) Platform
We are a Platform Company
An integrated BANK and TECHNOLOGY PLATFORM
that POWERS the AMBITIONS OF OTHERS
Powered by…
Green Dot Corporation - Confidential 6
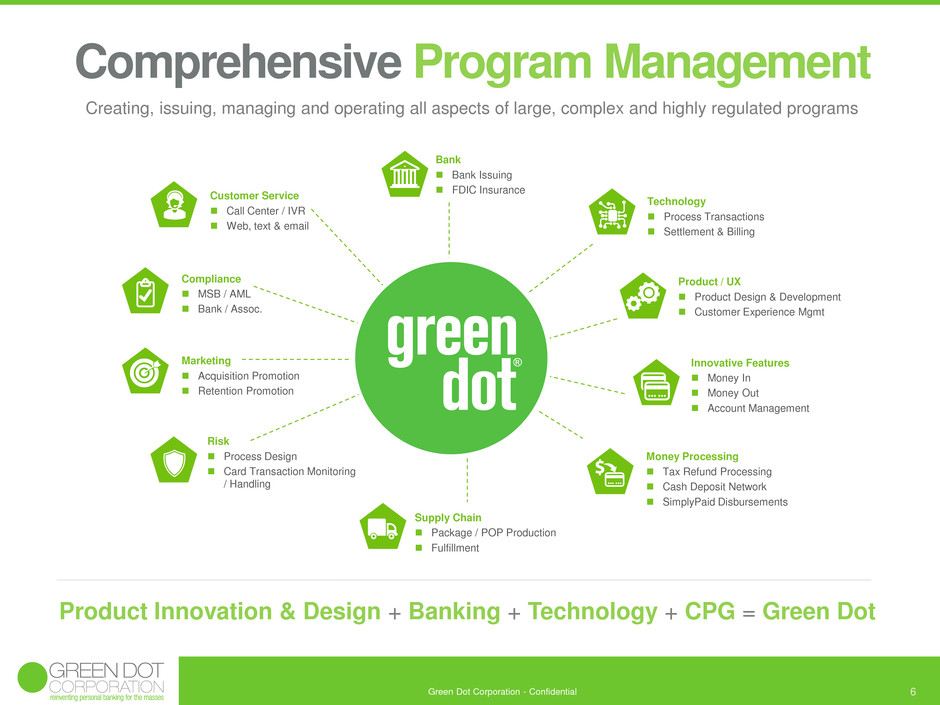
Comprehensive Program Management
Creating, issuing, managing and operating all aspects of large, complex and highly regulated programs
Bank
Bank Issuing
FDIC Insurance
Technology
Process Transactions
Settlement & Billing
Product / UX
Product Design & Development
Customer Experience Mgmt
Innovative Features
Money In
Money Out
Account Management
Money Processing
Tax Refund Processing
Cash Deposit Network
SimplyPaid Disbursements
Supply Chain
Package / POP Production
Fulfillment
Customer Service
Call Center / IVR
Web, text & email
Compliance
MSB / AML
Bank / Assoc.
Marketing
Acquisition Promotion
Retention Promotion
Risk
Process Design
Card Transaction Monitoring
/ Handling
Product Innovation & Design + Banking + Technology + CPG = Green Dot

Green Dot Corporation - Confidential 7
In-House Ad Agency and Brand Building
World-class capabilities and best practices in marketing and visual merchandising
• National Media
• In-store Marketing
• Direct (online) Sales
• Social Media
• Data driven CRM Engine
• Lifecycle communications
• Retention campaigns
National Awareness Retail / Digital Retention

8
Mass Drug Dollar Grocery Online
Convenience
App Store
Green Dot is Practically EVERYWHERE!
~100,000 Nationwide Brick & Mortar Account
Acquisition and Deposit Locations
+ Six Branded Online Account Acquisition
Sites
+ Plus the App Stores
+ BaaS Platform Partners’
Own Distribution
Key Distribution Channels
BaaS Platform
Possibly the most widely distributed financial services and banking franchise in America

Green Dot Corporation - Confidential 9
2017 Six-Step Plan Summary
Grow Revenue • Reduce Expenses • Smart Capital Allocation
Improve MoneyPak distribution and
launch new use case
DISTRIBUTION COMPLETED
AHEAD OF SCHEDULE.
New use case in progress
Return capital to shareholders
COMPLETED.
$150 million three-year share repurchase
authorization executed in two years
Drive incremental platform savings
COMPLETED AND ONGOING
Drive organic active card growth
COMPLETED AHEAD OF SCHEDULE
Make strategic acquisitions
COMPLETED.
UniRush in late Q1; Primor brand
Secured Credit Card portfolio in Q3
Make strategic investments in new
initiatives
COMPLETED WITH SOLID RESULTS.
Secured Credit, Intuit, Simply Paid, Apple,
Uber Debit, Rewards Debit and more
1 2 3
4 5 6
Green Dot Corporation - Confidential 10
Today’s Diversified Green Dot
Two Reporting Segments
Six Revenue Divisions

Green Dot Corporation - Confidential 11
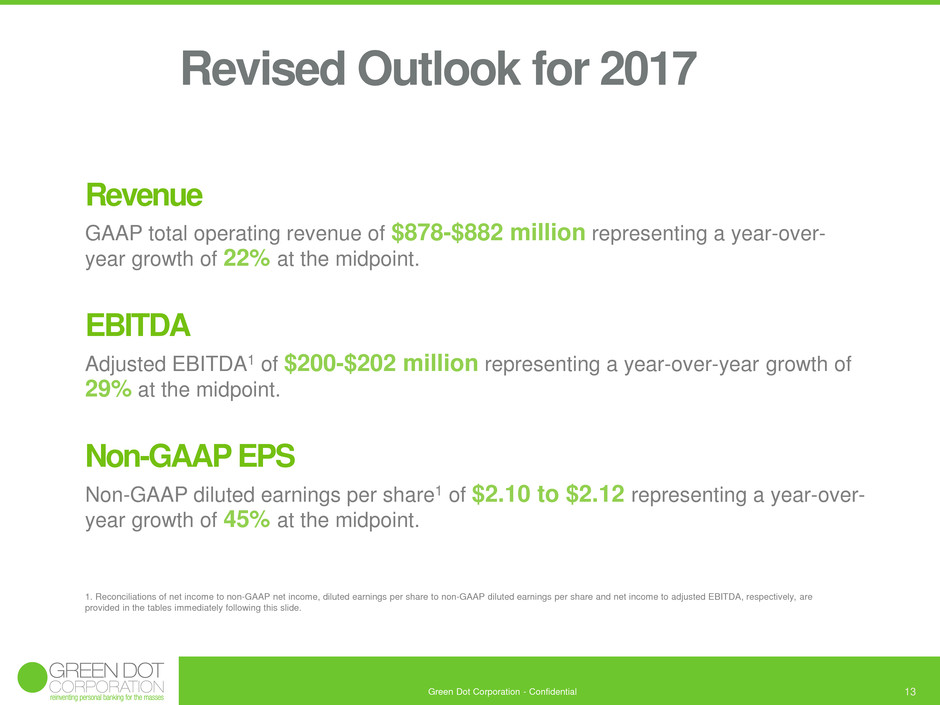
Segment Revenue Performance
$145
$135
$128
$168
$175
$170
Q1 Q2 Q3
Account Services
($ in millions)
2016 2017

Green Dot Corporation - Confidential 12
Segment Revenue Performance
$91
$45
$33
$94
$55
$39
Q1 Q2 Q3
Processing and Settlement Services
($ in millions)
2016 2017
Green Dot Corporation - Confidential 13
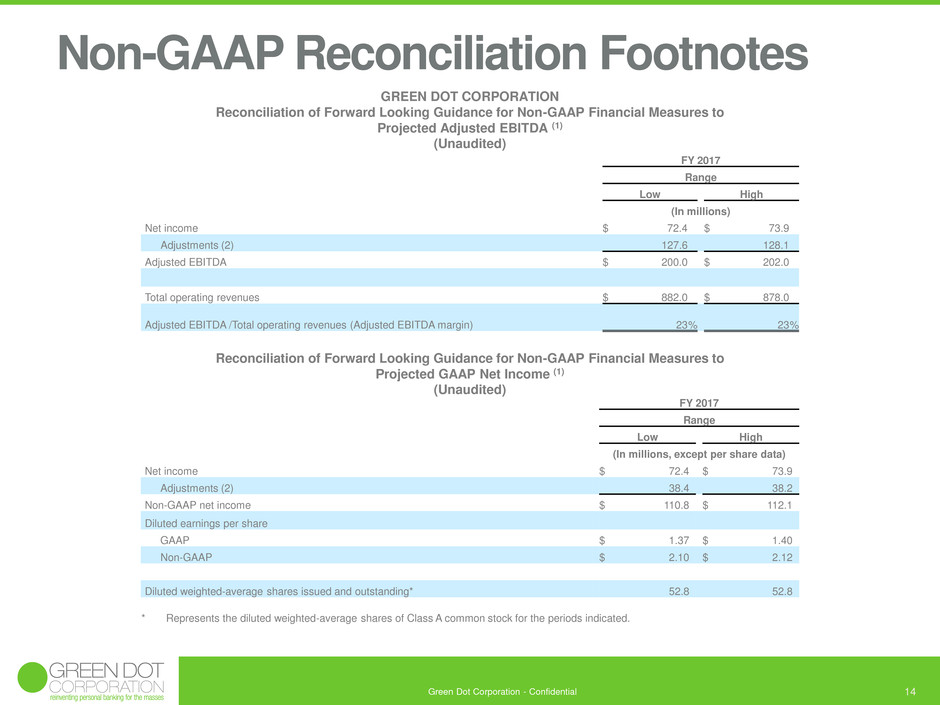
Revenue
GAAP total operating revenue of $878-$882 million representing a year-over-
year growth of 22% at the midpoint.
EBITDA
Adjusted EBITDA1 of $200-$202 million representing a year-over-year growth of
29% at the midpoint.
Non-GAAP EPS
Non-GAAP diluted earnings per share1 of $2.10 to $2.12 representing a year-over-
year growth of 45% at the midpoint.
Revised Outlook for 2017
1. Reconciliations of net income to non-GAAP net income, diluted earnings per share to non-GAAP diluted earnings per share and net income to adjusted EBITDA, respectively, are
provided in the tables immediately following this slide.
Green Dot Corporation - Confidential 14
Non-GAAP Reconciliation Footnotes
FY 2017
Range
Low High
(In millions)
Net income $ 72.4 $ 73.9
Adjustments (2) 127.6 128.1
Adjusted EBITDA $ 200.0 $ 202.0
Total operating revenues $ 882.0 $ 878.0
Adjusted EBITDA /Total operating revenues (Adjusted EBITDA margin) 23 % 23 %
GREEN DOT CORPORATION
Reconciliation of Forward Looking Guidance for Non-GAAP Financial Measures to
Projected Adjusted EBITDA (1)
(Unaudited)
FY 2017
Range
Low High
(In millions, except per share data)
Net income $ 72.4 $ 73.9
Adjustments (2) 38.4 38.2
Non-GAAP net income $ 110.8 $ 112.1
Diluted earnings per share
GAAP $ 1.37 $ 1.40
Non-GAAP $ 2.10 $ 2.12
Diluted weighted-average shares issued and outstanding* 52.8 52.8
* Represents the diluted weighted-average shares of Class A common stock for the periods indicated.
Reconciliation of Forward Looking Guidance for Non-GAAP Financial Measures to
Projected GAAP Net Income (1)
(Unaudited)
Green Dot Corporation - Confidential 15
Non-GAAP Reconciliation Footnotes
1) To supplement the Company’s consolidated financial statements presented in accordance with GAAP, the Company uses measures of operating results that are adjusted to exclude various, primarily non-cash, expenses and
charges. These financial measures are not calculated or presented in accordance with GAAP and should not be considered as alternatives to or substitutes for operating revenues, operating income, net income or any other
measure of financial performance calculated and presented in accordance with GAAP. These financial measures may not be comparable to similarly-titled measures of other organizations because other organizations may not
calculate their measures in the same manner as we do. These financial measures are adjusted to eliminate the impact of items that the Company does not consider indicative of its core operating performance. You are encouraged
to evaluate these adjustments and the reasons we consider them appropriate.
The Company believes that the non-GAAP financial measures it presents are useful to investors in evaluating the Company’s operating performance for the following reasons:
• the Company records employee stock-based compensation from period to period, and recorded employee stock-based compensation expenses of approximately $11.0 million and $7.9 million for the three months
ended September 30, 2017 and 2016, respectively. By comparing the Company’s adjusted EBITDA, non-GAAP net income and non-GAAP diluted earnings per share in different historical periods, investors can
evaluate the Company’s operating results without the additional variations caused by employee stock-based compensation expense, which may not be comparable from period to period due to changes in the fair
market value of the Company’s Class A common stock (which is influenced by external factors like the volatility of public markets and the financial performance of the Company’s peers) and is not a key measure of
the Company’s operations;
• adjusted EBITDA is widely used by investors to measure a company’s operating performance without regard to items, such as net interest income and expense, income tax benefit and expense, depreciation and
amortization, employee stock-based compensation expense, incremental expenses related to the delay in migration of the Company’s remaining customer accounts from its former processor to its new processor,
changes in the fair value of contingent consideration, transaction costs, impairment charges, severance costs related to extraordinary personnel reductions, legal settlement expenses, and other charges and income
that can vary substantially from company to company depending upon their respective financing structures and accounting policies, the book values of their assets, their capital structures and the methods by which
their assets were acquired; and
• securities analysts use adjusted EBITDA as a supplemental measure to evaluate the overall operating performance of companies.
The Company’s management uses the non-GAAP financial measures:
• as measures of operating performance, because they exclude the impact of items not directly resulting from the Company’s core operations;
• for planning purposes, including the preparation of the Company’s annual operating budget;
• to allocate resources to enhance the financial performance of the Company’s business;
• to evaluate the effectiveness of the Company’s business strategies;
• to establish metrics for variable compensation; and
• in communications with the Company’s board of directors concerning the Company’s financial performance.
The Company understands that, although adjusted EBITDA and other non-GAAP financial measures are frequently used by investors and securities analysts in their evaluations of companies, these measures have limitations as an
analytical tool, and you should not consider them in isolation or as substitutes for analysis of the Company’s results of operations as reported under GAAP. Some of these limitations are:
• that these measures do not reflect the Company’s capital expenditures or future requirements for capital expenditures or other contractual commitments;
• that these measures do not reflect changes in, or cash requirements for, the Company’s working capital needs;
• that these measures do not reflect interest expense or interest income;
• that these measures do not reflect cash requirements for income taxes;
• that, although depreciation and amortization are non-cash charges, the assets being depreciated or amortized will often have to be replaced in the future, and these measures do not reflect any cash requirements
for these replacements; and
• that other companies in the Company’s industry may calculate these measures differently than the Company does, limiting their usefulness as comparative measures.
2) These amounts represent estimated adjustments for net interest expense, income taxes, depreciation and amortization, employee stock-based compensation expense, incremental expenses associated with the Company's need to
continue to support customer accounts on its legacy transaction processor that it had intended to migrate to its new processing platform in 2016, contingent consideration, transaction costs, impairment charges, severance costs
related to extraordinary personnel reductions, legal settlement expenses, and other income and expenses. Employee stock-based compensation expense includes assumptions about the future fair value of the Company’s Class A
common stock (which is influenced by external factors like the volatility of public markets and the financial performance of the Company’s peers).
