Attached files
| file | filename |
|---|---|
| 8-K - CURRENT REPORT - ENTERPRISE FINANCIAL SERVICES CORP | a2017-118kinvestorpresenta.htm |
ENTERPRISE FINANCIAL SERVICES CORP
THIRD QUARTER 2017 INVESTOR PRESENTATION

2
Forward-Looking Statement
Some of the information in this report contains “forward‐looking statements” within the meaning of and intended to be covered by
the safe harbor provisions of the Private Securities Litigation Reform Act of 1995. Forward‐looking statements typically are
identified with use of terms such as “may,” “might,” “will, “should,” “expect,” “plan,” “anticipate,” “believe,” “estimate,” “predict,”
“potential,” “could,” “continue” and the negative of these terms and similar words, although some forward‐looking statements may
be expressed differently. Forward‐looking statements also include, but are not limited to, statements regarding plans, objectives,
expectations or consequences of announced transactions and statements about the future performance, operations products and
services of the Company and its subsidiaries. Our ability to predict results or the actual effect of future plans or strategies is
inherently uncertain. You should be aware that our actual results could differ materially from those anticipated by the forward‐
looking statements or historical performance due to a number of factors, including, but not limited to: our ability to efficiently
integrate acquisitions into our operations, retain the customers of these businesses and grow the acquired operations; reputational
risks; credit risk; changes in the appraised valuation of real estate securing impaired loans; outcomes of litigation and other
contingencies; exposure to general and local economic conditions; risks associated with rapid increases or decreases in prevailing
interest rates; consolidation within the banking industry; competition from banks and other financial institutions; our ability to
attract and retain relationship officers and other key personnel; burdens imposed by federal and state regulation; changes in
regulatory requirements; changes in accounting regulation or standards applicable to banks; and other risks discussed under the
caption “Risk Factors” of our most recently filed Form 10‐K and in Part II, 1A of our most recently filed Form 10‐Q, all of which
could cause the Company’s actual results to differ from those set forth in the forward‐looking statements.
Readers are cautioned not to place undue reliance on our forward‐looking statements, which reflect management’s analysis and
expectations only as of the date of such statements. Forward‐looking statements speak only as of the date they are made, and the
Company does not intend, and undertakes no obligation, to publicly revise or update forward‐looking statements after the date of
this report, whether as a result of new information, future events or otherwise, except as required by federal securities law. You
should understand that it is not possible to predict or identify all risk factors. Readers should carefully review all disclosures we file
from time to time with the Securities and Exchange Commission (the “SEC”) which are available on our website at
www.enterprisebank.com under "Investor Relations."

3
Company Snapshot - EFSC
SNL Data
TOTAL ASSETS
$5.2 Billion
MARKET CAP
Concentrated on Private Businesses and
Owner Families
Relationship Driven
Attract Top Talent in Markets
Product Breadth
• Banking
• Trust & Wealth Management
• Treasury Management
Proven Ability to Grow Commercial &
Industrial “C&I” Loans
Strong Balance Sheet with Attractive Risk
Profile
FOCUSED BUSINESS MODEL:
Operates in
MSAs
St. Louis
Kansas City
Phoenix
$1.0 Billion

4
Executive Leadership Team
James B. Lally, 49, President & Chief Executive Officer, EFSC 14
Keene S. Turner, 38, Executive Vice President & Chief Financial Officer, EFSC 4
Scott R. Goodman, 53, President, Enterprise Bank & Trust 14
Douglas N. Bauche, 47, Chief Credit Officer, Enterprise Bank & Trust 17
Mark G. Ponder, 47, SVP, Controller and CFO, Enterprise Bank & Trust 5
Name, Age, Title Years at Enterprise

5
Differentiated Business Model: Built for Quality Earnings
Growth
Enterprise Bank
Financial & Estate Planning
Tax Credit Brokerage
Business & Succession Planning
Trust Administration
Enterprise Trust
Investment Management
Enterprise University
Treasury Management
Personal & Private Banking
Commercial & Business Banking
PRIVATE
BUSINESSES
& OWNER
FAMILIES
Mortgage Banking
• Focused and Well‐Defined Strategy Aimed at
Business Owners, Executives and Professionals
• Targeted Array of Banking and Wealth
Management Services to Meet our Clients’ Needs
• Experienced Bankers and Advisors
6
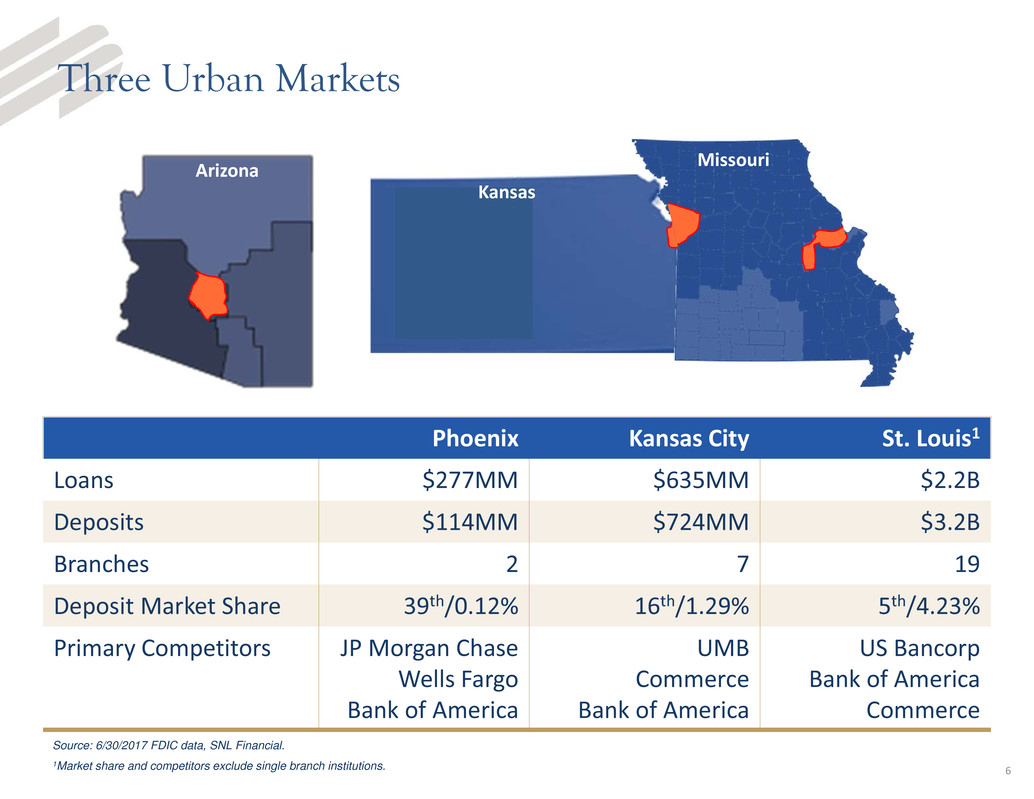
Three Urban Markets
Phoenix Kansas City St. Louis1
Loans $277MM $635MM $2.2B
Deposits $114MM $724MM $3.2B
Branches 2 7 19
Deposit Market Share 39th/0.12% 16th/1.29% 5th/4.23%
Primary Competitors JP Morgan Chase
Wells Fargo
Bank of America
UMB
Commerce
Bank of America
US Bancorp
Bank of America
Commerce
Arizona
Source: 6/30/2017 FDIC data, SNL Financial.
1Market share and competitors exclude single branch institutions.
Missouri
Kansas
7
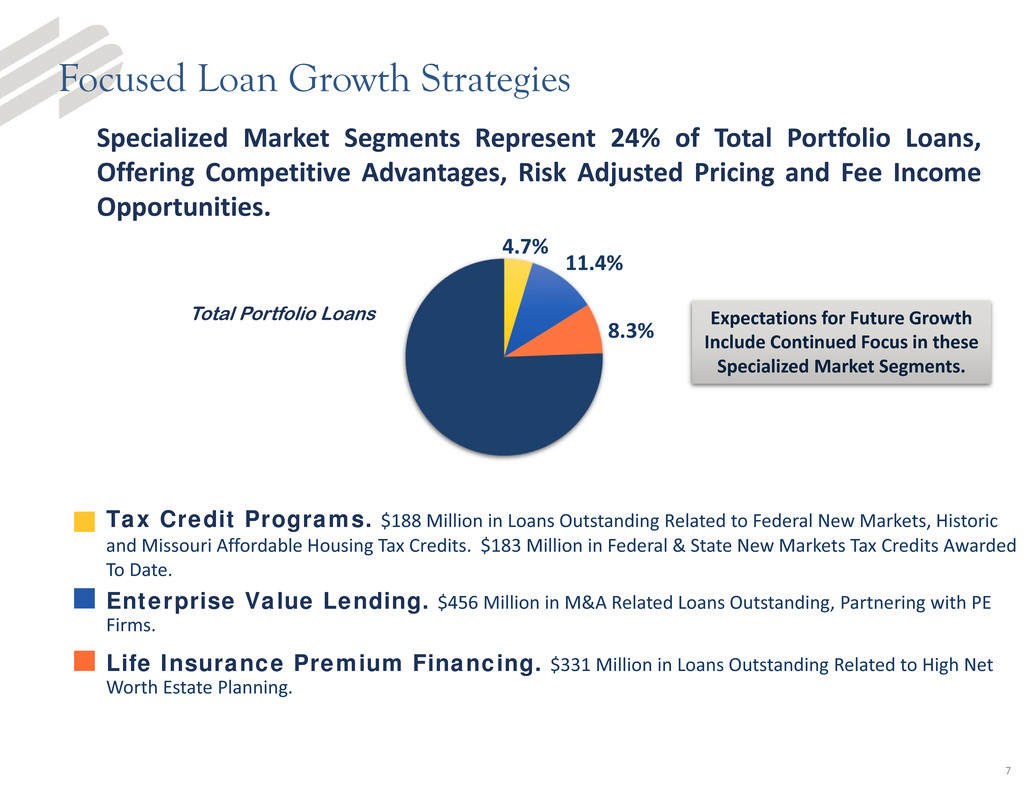
Focused Loan Growth Strategies
Tax Credit Programs. $188 Million in Loans Outstanding Related to Federal New Markets, Historic
and Missouri Affordable Housing Tax Credits. $183 Million in Federal & State New Markets Tax Credits Awarded
To Date.
Enterprise Value Lending. $456 Million in M&A Related Loans Outstanding, Partnering with PE
Firms.
Life Insurance Premium Financing. $331 Million in Loans Outstanding Related to High Net
Worth Estate Planning.
4.7%
11.4%
8.3%
Total Portfolio Loans
Specialized Market Segments Represent 24% of Total Portfolio Loans,
Offering Competitive Advantages, Risk Adjusted Pricing and Fee Income
Opportunities.
Expectations for Future Growth
Include Continued Focus in these
Specialized Market Segments.

8
History of Strong C&I Growth
$880
$1,007
$1,172
$1,371
$1,599
$1,862
Q3 '12 Q3 '13 Q3 '14 Q3 '15 Q3 '16 Q3 '17
In Millions

Awareness
Interest
Consideration
Intent
Evaluation
Purchase
9
Marketing & Sales Funnel
NOW… …FUTURE
Marketing
Sales
Marketing
Sales
10
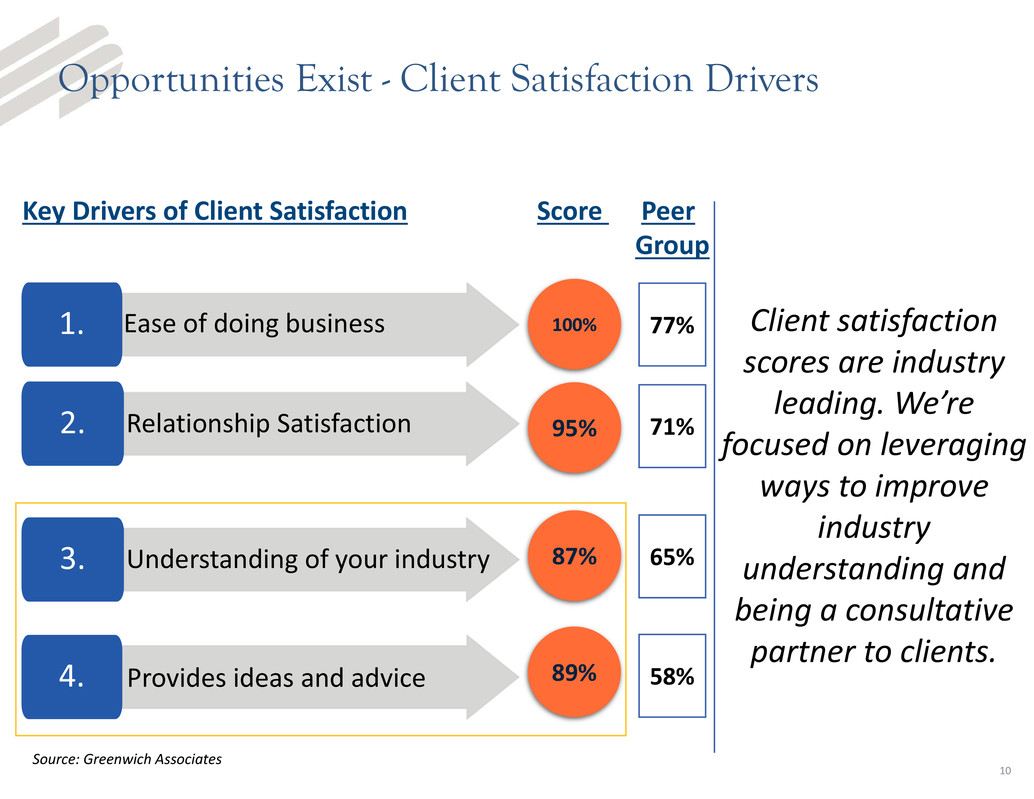
Opportunities Exist - Client Satisfaction Drivers
Client satisfaction
scores are industry
leading. We’re
focused on leveraging
ways to improve
industry
understanding and
being a consultative
partner to clients.
1. Ease of doing business
2. Relationship Satisfaction
3. Understanding of your industry
4. Provides ideas and advice
Key Drivers of Client Satisfaction Score Peer
Group
100%
95%
87%
89%
77%
71%
65%
58%
Source: Greenwich Associates

11
Acquisition of Jefferson County Bancshares, Inc. (JCB)
Closed February 10, 2017
Consistent with M&A Expansion Strategy
Enhanced EFSC’s footprint in the St. Louis MSA,
while building total balance sheet size to
$5 billion in assets
Top five deposit market share in the St. Louis
MSA
• Successfully completed core systems conversion on May 22, 2017
• Expanded branch presence
• ~$4 billion of deposits
• Strengthens & diversifies core deposit gathering capabilities
• Approximately $60 million in deposits per branch
St. Louis
MSA
EFSC (16 BRANCHES TOTAL,
6 BRANCHES IN ST. LOUIS MSA)
JEFFERSON (18 BRANCHES TOTAL,
17 BRANCHES IN ST. LOUIS MSA)

12
Portfolio Loan Trends
$3,038
$3,118
$3,853 $3,859
$3,997
Q3 '16 Q4 '16 Q1 '17 Q2 '17 Q3 '17
In Millions
*Note: 9% excluding acquisition of JCB
JCB
$678
13
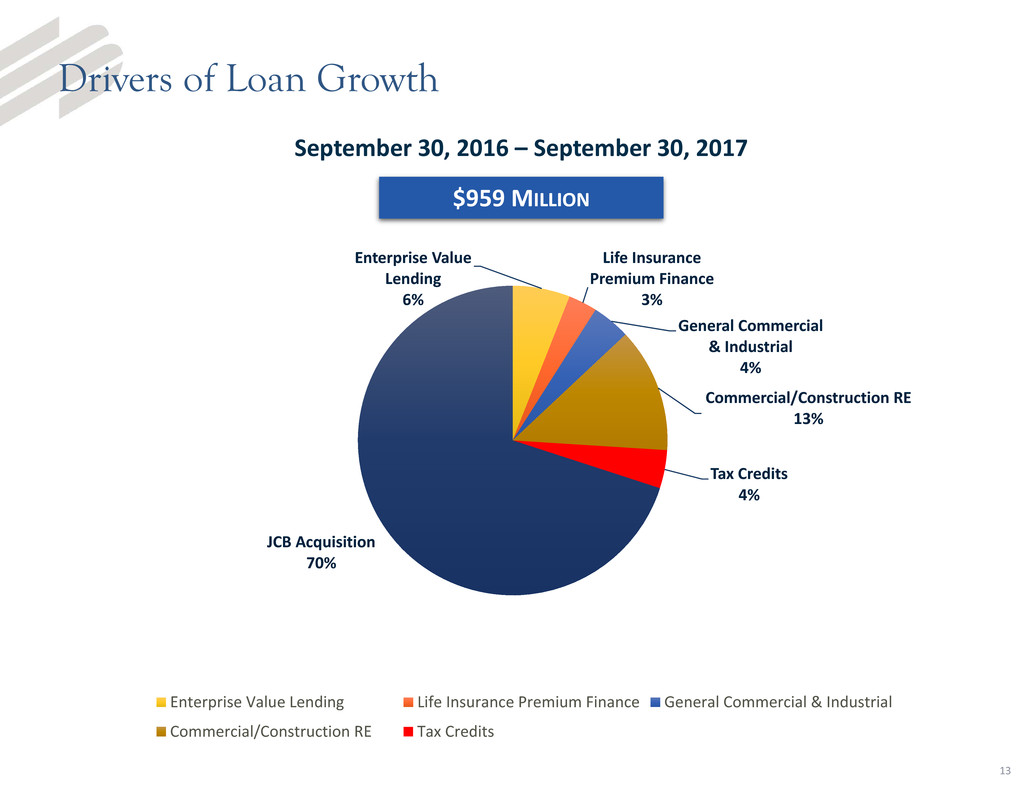
Drivers of Loan Growth
Enterprise Value
Lending
6%
Life Insurance
Premium Finance
3%
General Commercial
& Industrial
4%
Commercial/Construction RE
13%
Tax Credits
4%
JCB Acquisition
70%
Enterprise Value Lending Life Insurance Premium Finance General Commercial & Industrial
Commercial/Construction RE Tax Credits
$959 MILLION
September 30, 2016 – September 30, 2017

26%
39%15%
20%
14
Attractive Deposit Mix
CD
Interest Bearing
Transaction Accts
DDA
MMA &
Savings
SEPTEMBER 30, 2017
$4.1B
• Significant DDA Composition
• Stable Cost of Deposits
• Improving Core Funding
Cost of Deposits 0.46%
31% Core Deposit Growth
Q3 2016 – Q3 2017
In
Millions
$3,125
$3,233
$4,032 $3,921 $4,059
24.4% 26.8% 25.7% 26.0% 25.8%
Q3 '16 Q4 '16 Q1 '17 Q2 '17 Q3 '17
Deposits JCB DDA %
JCB
$774
15
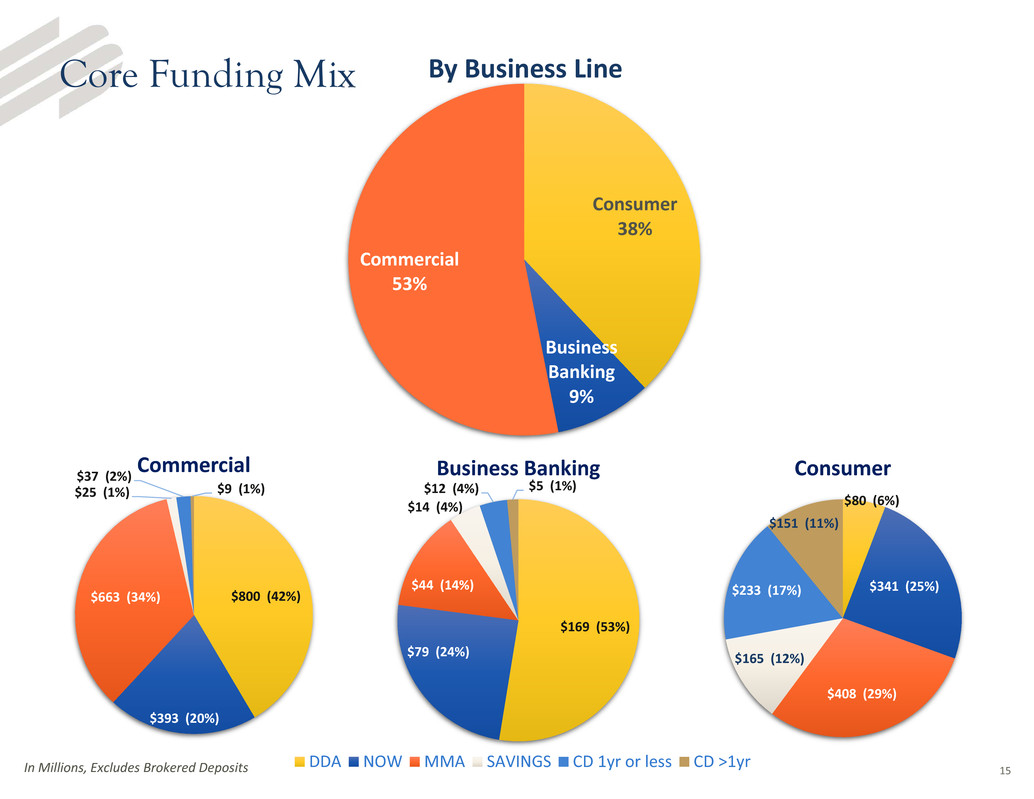
Core Funding Mix
$80 (6%)
$341 (25%)
$408 (29%)
$165 (12%)
$233 (17%)
$151 (11%)
Consumer
$169 (53%)
$79 (24%)
$44 (14%)
$14 (4%)
$12 (4%) $5 (1%)
Business Banking
DDA NOW MMA SAVINGS CD 1yr or less CD >1yr
$800 (42%)
$393 (20%)
$663 (34%)
$25 (1%)
$37 (2%)
$9 (1%)
Commercial
In Millions, Excludes Brokered Deposits
By Business Line
Consumer
38%
Business
Banking
9%
Commercial
53%

16
Financial Scorecard
Q3 2017 Compared to Q3 2016
40%
Drive Net Interest
Income Growth in
Dollars with Favorable
Loan Growth Trends
21 bps
Defend Net
Interest Margin
43 bps
NPLs/Loans
Maintain High Quality
Credit Profile
1%
Achieve Further
Improvement in
Operating Leverage
Continued Growth in Core EPS35%
Enhance Deposit Levels to Support Growth30%
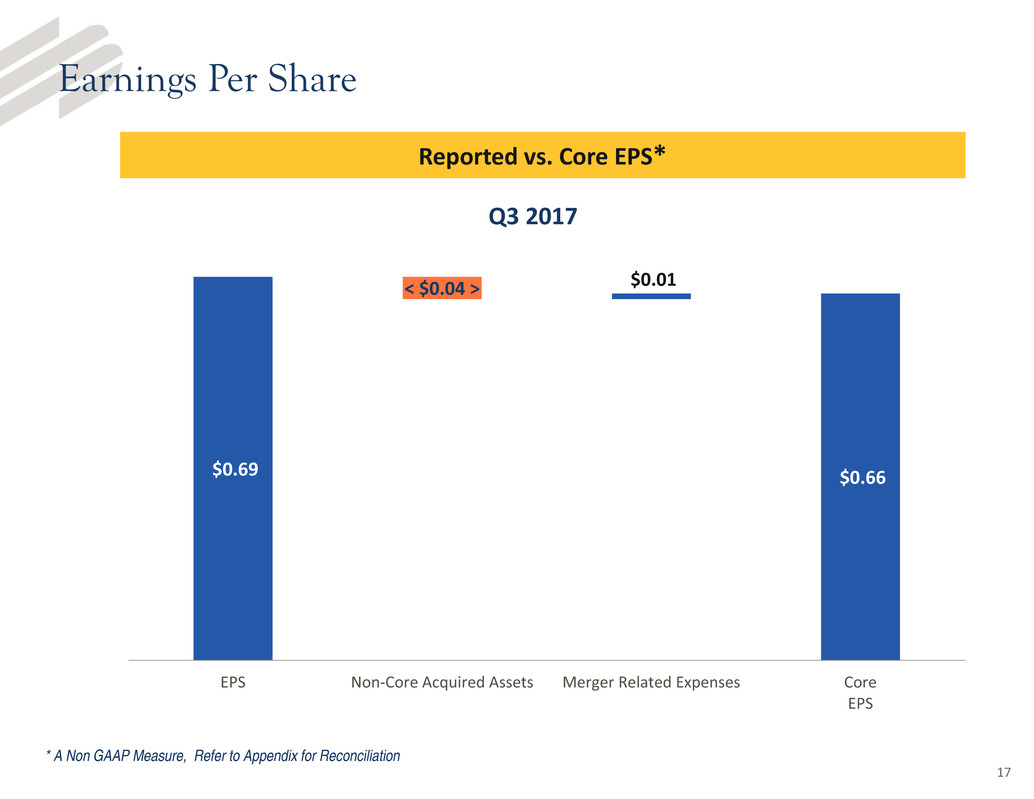
Earnings Per Share
$0.69
< $0.04 > $0.01
$0.66
EPS Non‐Core Acquired Assets Merger Related Expenses Core
EPS
* A Non GAAP Measure, Refer to Appendix for Reconciliation
Reported vs. Core EPS*
Q3 2017
17

Earnings Per Share Trend
$0.56
$0.04
$0.03 $0.01
$0.02 $0.66
Q2 '17 Net Interest
Income
Portfolio Loan Loss
Provision
Non Interest
Income
Non Interest
Expense
Q3 '17
Changes in Core EPS*
Note: * A Non GAAP Measure, Refer to Appendix for Reconciliation
18
19
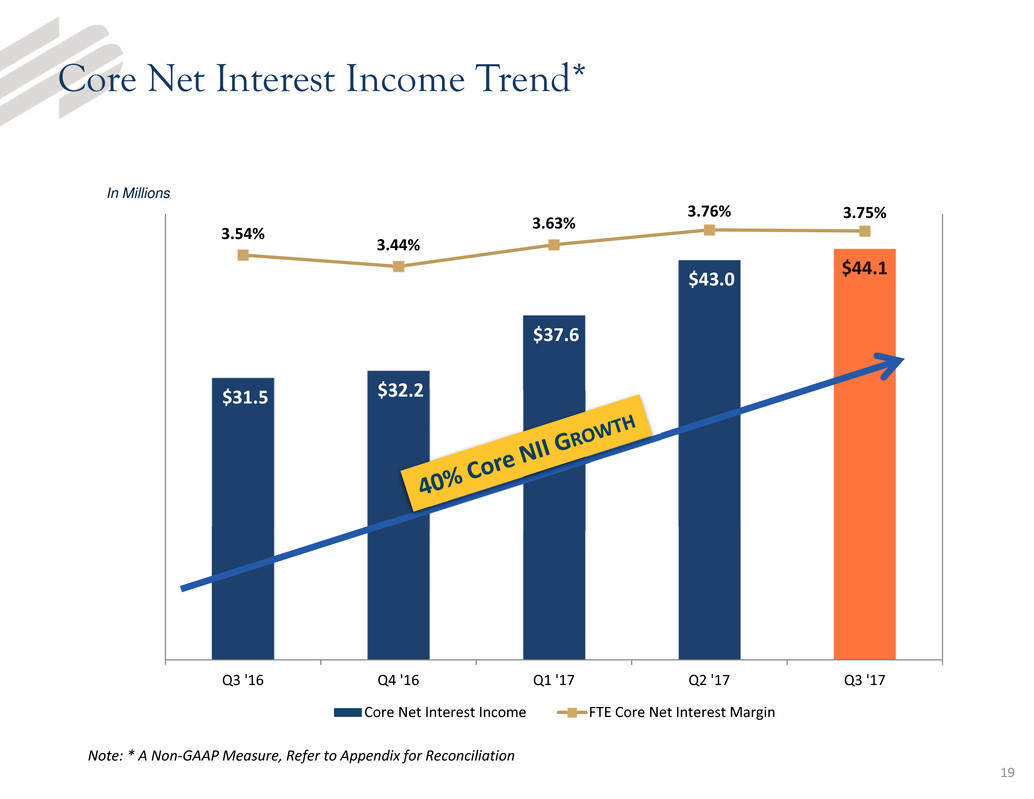
Core Net Interest Income Trend*
In Millions
Note: * A Non‐GAAP Measure, Refer to Appendix for Reconciliation
$31.5 $32.2
$37.6
$43.0
$44.1
3.54%
3.44%
3.63%
3.76% 3.75%
0.00%
0.50%
1.00%
1.50%
2.00%
2.50%
3.00%
3.50%
$4.0
$5.0
$6.0
$7.0
$8.0
$9.0
$10.0
$11.0
$12.0
$13.0
$14.0
$15.0
$16.0
$17.0
$18.0
$19.0
$20.0
$21.0
$22.0
$23.0
$24.0
$25.0
$26.0
$27.0
$28.0
$29.0
$30.0
$31.0
$32.0
$33.0
$34.0
$35.0
$36.0
$37.0
$38.0
$39.0
$40.0
$41.0
$42.0
$43.0
$44.0
$45.0
$46.0
$47.0
Q3 '16 Q4 '16 Q1 '17 Q2 '17 Q3 '17
Core Net Interest Income FTE Core Net Interest Margin

20
Credit Trends for Portfolio Loans
14 bps
12 bps
‐1 bps
64 bps
8 bps
Q3 '16 Q4 '16 Q1 '17 Q2 '17 Q3 '17
2017 YTD NCO = 24 bps
Q3 2017 EFSC PEER(3)
NPA’S/ASSETS = 0.18% 0.71%
NPL’S/LOANS = 0.23% 0.85%
ALLL/NPL’S = 426.2% 112.3%
ALLL/LOANS = 0.97% 1.03%
(1) Portfolio loans only, excludes non‐core acquired loans; (2) Excludes JCB;
(3) Peer median data as of 6/30/2017 (source: SNL Financial)
In Millions
$154
$80
$56
$7
$138
Q3 '16 Q4 '16 Q1 '17 Q2 '17 Q3 '17
Portfolio Loan Growth
In MillionsNet Charge‐offs (1)
$3.0
$1.0
$1.5
$3.6
$2.4
Q3 '16 Q4 '16 Q1 '17 Q2 '17 Q3 '17
Provision for Portfolio Loans
(2)

Core Fee Income*
Note: * A Non‐GAAP Measure, Refer to Appendix for Reconciliation
Other Core Fee Income DetailCore Fee Income
$1.7 $1.7 $1.8 $2.0 $2.1
$2.2 $2.2 $2.5
$2.8 $2.8
$1.9 $1.3
$1.5
$1.7 $1.9$0.2
$1.7 $0.2
$0.1
$0.8
$0.9
$1.0
$1.4
$1.5
Q3 '16 Q4 '16 Q1 '17 Q2 '17 Q3 '17
Wealth Management Deposit Services Charges
Other State Tax Credits
Card Services
$1.0 $1.0
$0.8
$1.0
$1.5
$0.2
$0.2
$0.4
$0.1
$0.3
$0.2
$0.4
$0.2
$0.2$0.4
$0.1
$0.1
$0.1
$0.1
Q3 '16 Q4 '16 Q1 '17 Q2 '17 Q3 '17
Miscellaneous Swap Fees CDE Mortgage
In Millions
21
$6.8
$7.8 $7.9
$8.4
$7.0
$1.9
$1.5
$1.9
$1.3
$1.7
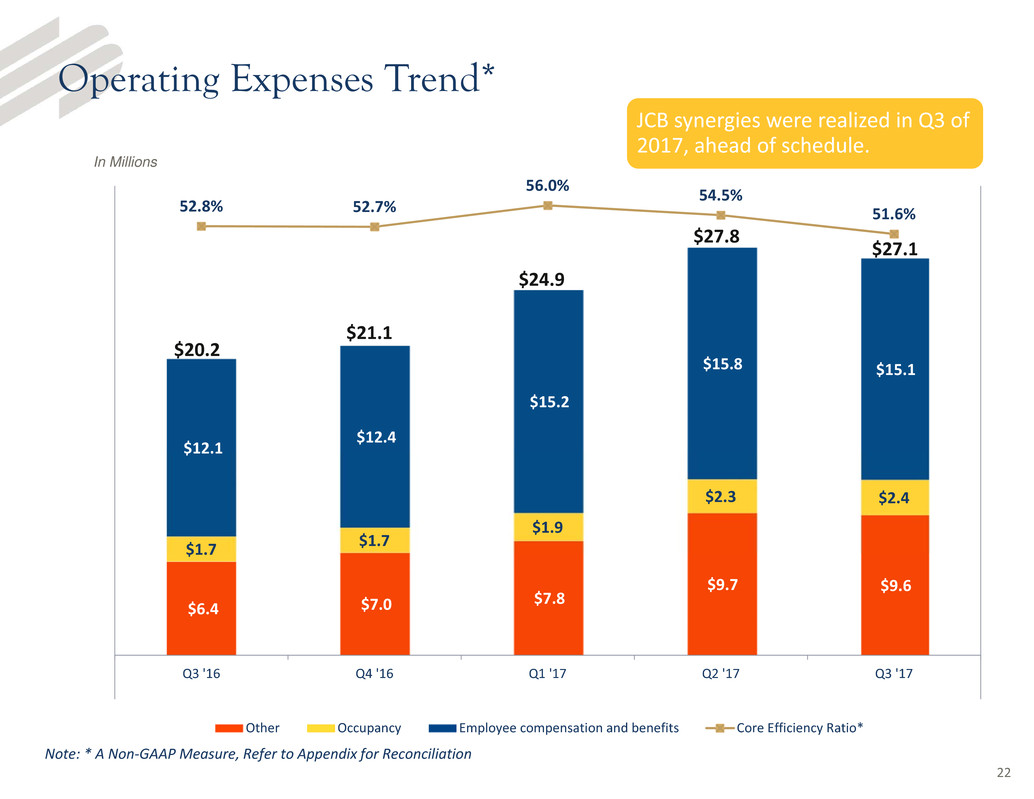
Operating Expenses Trend*
In Millions
Note: * A Non‐GAAP Measure, Refer to Appendix for Reconciliation
$6.4 $7.0
$7.8
$9.7 $9.6
$1.7 $1.7
$1.9
$2.3 $2.4
$12.1
$12.4
$15.2
$15.8 $15.1
52.8% 52.7%
56.0%
54.5%
51.6%
‐3
2
7
12
17
22
27
32
Q3 '16 Q4 '16 Q1 '17 Q2 '17 Q3 '17
Other Occupancy Employee compensation and benefits Core Efficiency Ratio*
$27.1
$24.9
$21.1
$20.2
$27.8
22
JCB synergies were realized in Q3 of
2017, ahead of schedule.

23
Positive Momentum in Core* Earnings Per Share
$0.37
$0.33
$0.35
$0.38
$0.44
$0.49
$0.47
$0.49 $0.49
$0.59 $0.59
$0.56
$0.66
Q3 '14 Q4 '14 Q1 '15 Q2 '15 Q3 '15 Q4 '15 Q1 '16 Q2 '16 Q3 '16 Q4 '16 Q1 '17 Q2 '17 Q3 '17
Note: * A Non‐GAAP Measure, Refer to Appendix for Reconciliation
78% Core EPS Growth from Q3 2014 to Q3 2017

24
Three-Year Financial Highlights
Note: Core is a Non GAAP Measure, Refer to Appendix for Reconciliation
Total Core Non‐Interest Income
Core Net Income
Core Earnings Per Share (diluted)
Core Return on Average Equity
Core Return on Average Assets
Total Assets
Core Net Interest Income
$26,787
$41,237
$2.03
11.10%
1.09%
$4,081,328
$123,515
$25,575
$33,791
$1.66
10.08%
1.00%
$3,608,483
$107,618
$24,548
$26,043
$1.29
8.63%
0.82%
$3,277,003
$98,438
$23,260
$41,917
$1.81
10.69%
1.14%
$5,231,488
$124,685

25
Capital Levels Prudently Managed to Facilitate Growth and
Returns
• 2,000,000 Share Common Stock
Repurchase Plan
• ~ 10% of EFSC Outstanding Shares
• No Specified End Date
• Disciplined, Patient Approach Based
on Market Conditions
• Repurchased 429,955 shares at an
average price of $38.69 in the third
quarter
• Sufficient Capital to Support
Growth Plans
• $0.11 per share quarterly dividend
6.02%
7.78%
8.69% 8.88% 8.76%
8.18%
TANGIBLE COMMON EQUITY/TANGIBLE ASSETS

26
Enterprise Financial
• Highly Focused, Proven Business Model
• Strong Track Record of Commercial Loan Growth
• Differentiated Competitive Lending Expertise
• Enhanced Core Funding Capabilities
• Increased Returns and Enhanced Shareholder Value
162%
91%
EFSC Index
3‐Year Total Shareholder Return
Note: Index = SNL U.S. Bank $1B ‐ $5B, as of 6/30/2017

Appendix
3Q 2017 EFSC INVESTOR PRESENTATION

28
Balance Sheet Positioned for Growth
Modest Asset
Sensitivity
(200 BPS Rate
Shock Increases
NII By 3.2%)
57% Floating
Rate Loans,
with Three‐Year
Average
Duration
High‐quality,
Cash‐flowing
Securities
Portfolio with
Four‐Year
Average
Duration
26%
Non‐Interest
Bearing DDA to
Total Deposits
8.18%
Tangible
Common
Equity/Tangible
Assets
29
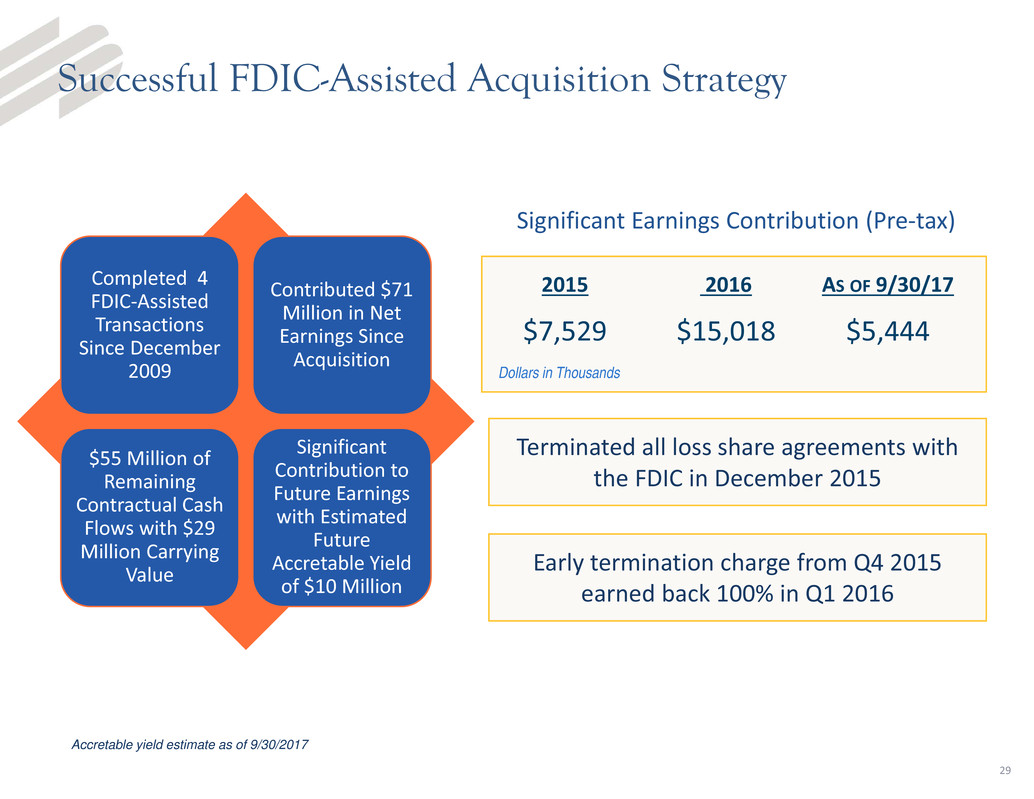
Successful FDIC-Assisted Acquisition Strategy
Significant Earnings Contribution (Pre‐tax)
Terminated all loss share agreements with
the FDIC in December 2015
Early termination charge from Q4 2015
earned back 100% in Q1 2016
2015 2016 AS OF 9/30/17
$7,529 $15,018 $5,444
Dollars in Thousands
Accretable yield estimate as of 9/30/2017
Completed 4
FDIC‐Assisted
Transactions
Since December
2009
Contributed $71
Million in Net
Earnings Since
Acquisition
$55 Million of
Remaining
Contractual Cash
Flows with $29
Million Carrying
Value
Significant
Contribution to
Future Earnings
with Estimated
Future
Accretable Yield
of $10 Million

30
Use of Non-GAAP Financial Measures
The Company's accounting and reporting policies conform to generally accepted accounting principles in the United States
(“GAAP”) and the prevailing practices in the banking industry. However, the Company provides other financial measures, such as
Core net interest margin and other Core performance measures, in this presentation that are considered “non-GAAP financial
measures.” Generally, a non-GAAP financial measure is a numerical measure of a company's financial performance, financial
position or cash flows that exclude (or include) amounts that are included in (or excluded from) the most directly comparable
measure calculated and presented in accordance with GAAP.
The Company considers its Core performance measures presented in this presentation as important measures of financial
performance, even though they are non-GAAP measures, as they provide supplemental information by which to evaluate the
impact of non-core acquired loans and related income and expenses, the impact of nonrecurring items, and the Company's
operating performance on an ongoing basis. Core performance measures include contractual interest on non-core acquired
loans but exclude incremental accretion on these loans. Core performance measures also exclude Gain or loss of other real
estate from non-core acquired loans and expenses directly related to the non-core acquired loans and other assets formerly
covered under FDIC loss share agreements. Core performance measures also exclude certain other income and expense items,
such as executive separation costs, merger related expenses, facilities charges, and gain/loss on sale of investment securities,
the Company believes to be not indicative of or useful to measure the Company's operating performance on an ongoing basis.
The attached tables contain a reconciliation of these Core performance measures to the GAAP measures.
The Company believes these non-GAAP measures and ratios, when taken together with the corresponding GAAP measures and
ratios, provide meaningful supplemental information regarding the Company's performance and capital strength. The Company's
management uses, and believes that investors benefit from referring to, these non-GAAP measures and ratios in assessing the
Company's operating results and related trends and when forecasting future periods. However, these non-GAAP measures and
ratios should be considered in addition to, and not as a substitute for or preferable to, ratios prepared in accordance with GAAP.
In the tables below, the Company has provided a reconciliation of, where applicable, the most comparable GAAP financial
measures and ratios to the non-GAAP financial measures and ratios, or a reconciliation of the non-GAAP calculation of the
financial measure for the periods indicated.
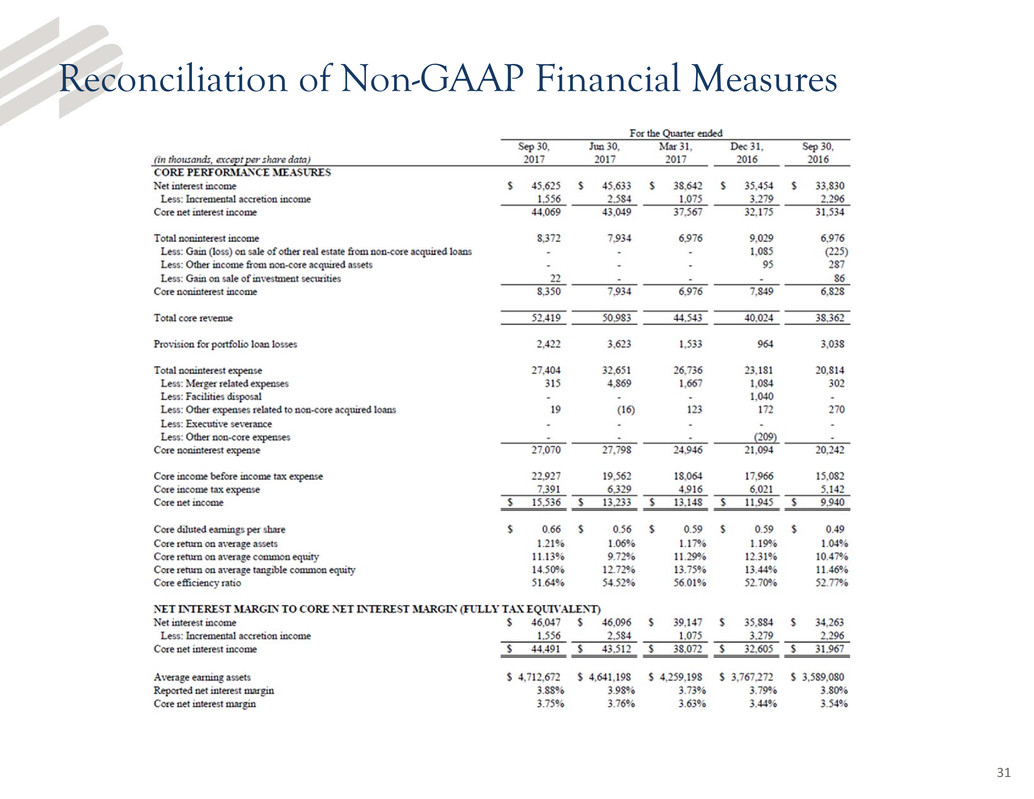
Reconciliation of Non-GAAP Financial Measures
31

Q&A
3Q 2017 EFSC INVESTOR PRESENTATION

