Attached files
| file | filename |
|---|---|
| 8-K - 8-K - CHEESECAKE FACTORY INC | a17-26387_18k.htm |
Safe Harbor Statement This presentation contains forward-looking statements about our financial condition, results of operations, performance, plans, goals and other matters. These statements are based on our current expectations and involve known and unknown risks and uncertainties that may cause our actual results or performance to differ materially from those expressed or implied by such statements. These forward-looking statements include statements related to our ability to: provide a differentiated experience to guests; recapture positive comparable sales; outperform the casual dining industry; deliver consistent financial performance; profitably expand our Company-owned restaurants domestically and in Canada, and work with our licensees to expand our concept internationally; maintain our broad consumer appeal and remain relevant to guests; attract and retain qualified management and other staff; maintain our unit economics; manage costs to support profitability; maintain core Cheesecake Factory restaurant-level margins; provide mid-teens total return to shareholders; leverage technology to drive sales and manage costs; produce sufficient finished bakery product to supply our restaurants and our licensees; leverage our brand in the CPG channel; support the growth of North Italia and Flower Child restaurants; develop a fast casual concept; utilize capital effectively; and continue to repurchase our shares and pay and grow the dividend. Forward-looking statements are not guarantees of future performance, and undue reliance should not be placed on such statements. Forward-looking statements speak only as of today’s date, and we undertake no obligation to publicly update or revise any forward-looking statements to take into account or otherwise reflect subsequent events, corrections in underlying assumptions, or changes in circumstances arising after the date that the forward-looking statement was made, unless required to do so by law. Please see the full discussion of risks and uncertainties contained in our filings with the Securities and Exchange Commission, including our latest Annual Report on Form 10-K, Quarterly Reports on Form 10-Q and Current Reports on Form 8-K, which are available at www.sec.gov. The Private Securities Litigation Reform Act of 1995 provides certain “safe harbor” provisions for forward-looking statements. All forward-looking statements made in this presentation are made pursuant to the Act. 2
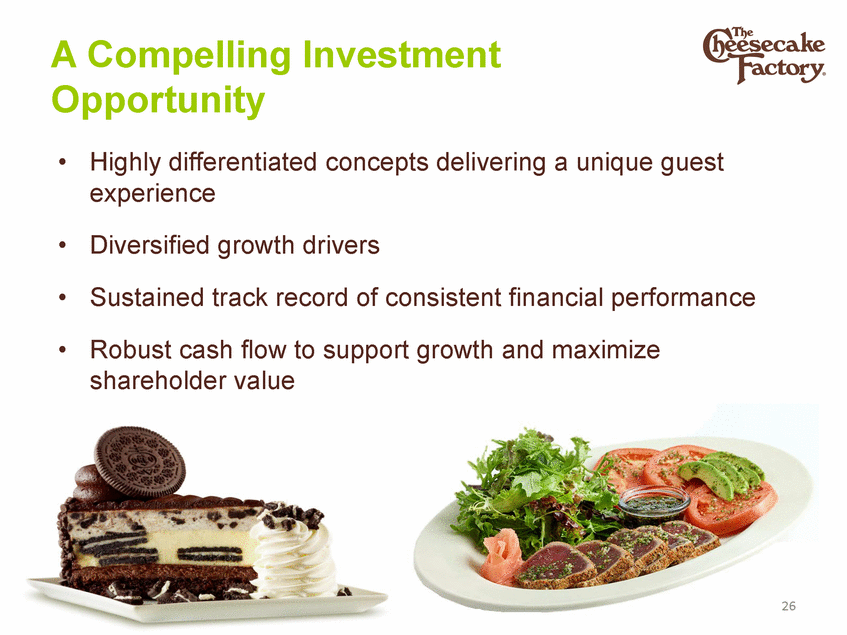
A Compelling Investment Opportunity • Highly differentiated concepts delivering experience a unique guest • • Diversified growth drivers Sustained track record of consistent financial performance • Robust cash flow to support growth and maximize shareholder value 3
Company Overview and Key Competitive Advantages 4
Our Global Footprint High quality, high profile locations worldwide Kuwait Bahra in (2) UAE Saudi China (2) (3) 5 Company-Owned 196 13 1 International - Licensed Middle East13 Mexico3 China25 Mexico Guadalajara Mexico City (2) Shanghai ng Kong Lebanon (1) (3) Qatar (1) Arabia(5) (1) Ho U.S.A. (Company-Owned: 210)
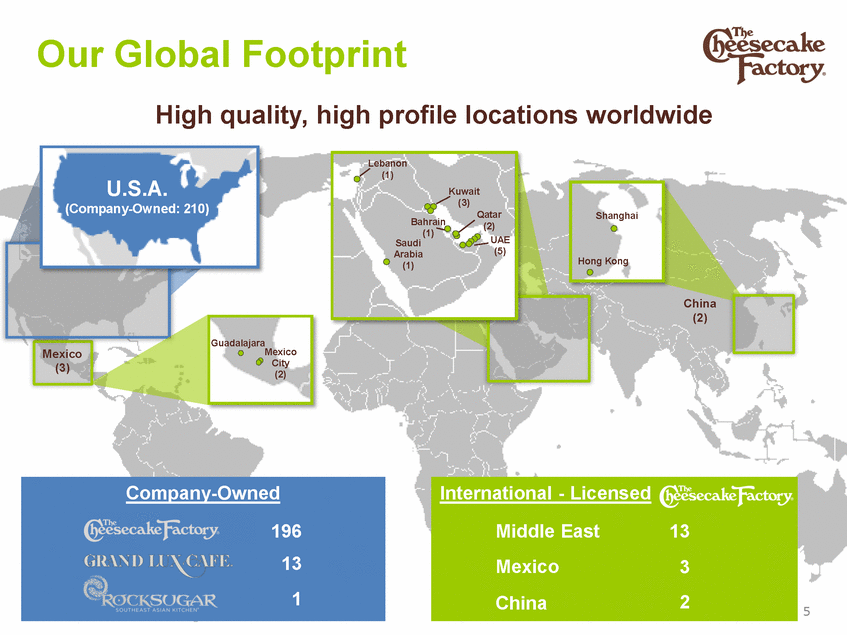
The Cheesecake Factory - A Highly Differentiated Concept Bakery 6 Integrated Ambiance, Service and Hospitality Best-in-Class Operational Execution Leader in Menu Innovation
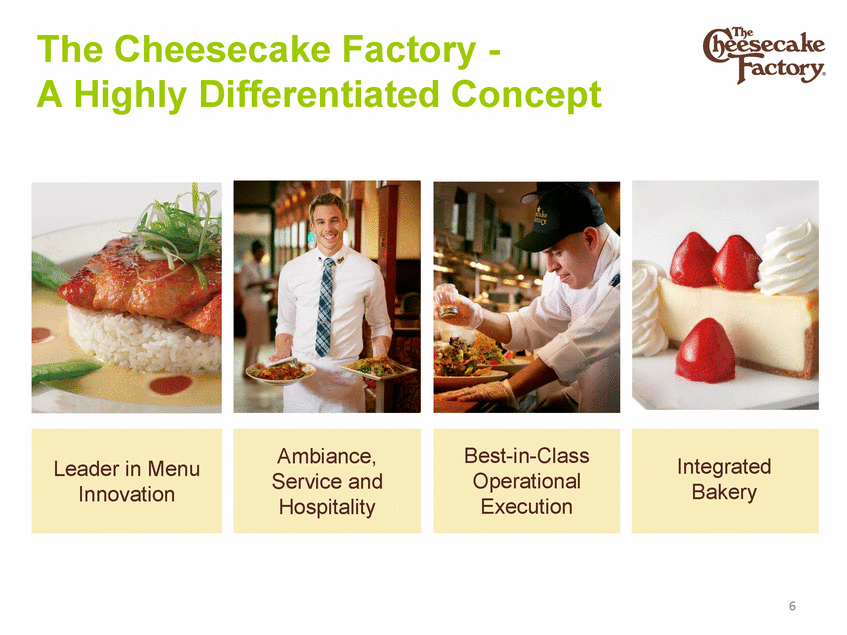
Industry Leader in Menu Innovation Breadth of menu is a key competitive advantage Quality • 250 menu items made fresh from scratch in-house Relevance • No veto vote – something for everyone across price points Menu updated twice a year • Performance • • Drives sales Continued market share gains Profit • Increases sales at full margin 7
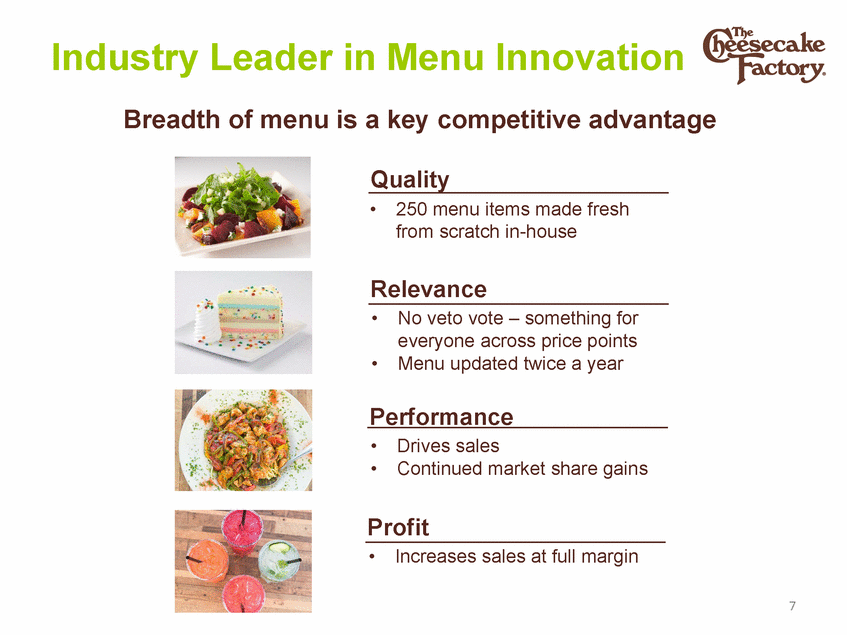
Dining With Us Is an Experience Ambiance, Service and Hospitality Drive Sales 8

Leveraging Technology to Drive Sales 9 Online ordering expected to be in pilot by the end of fiscal 2017. Online Ordering New Guest Satisfaction Platform Delivery
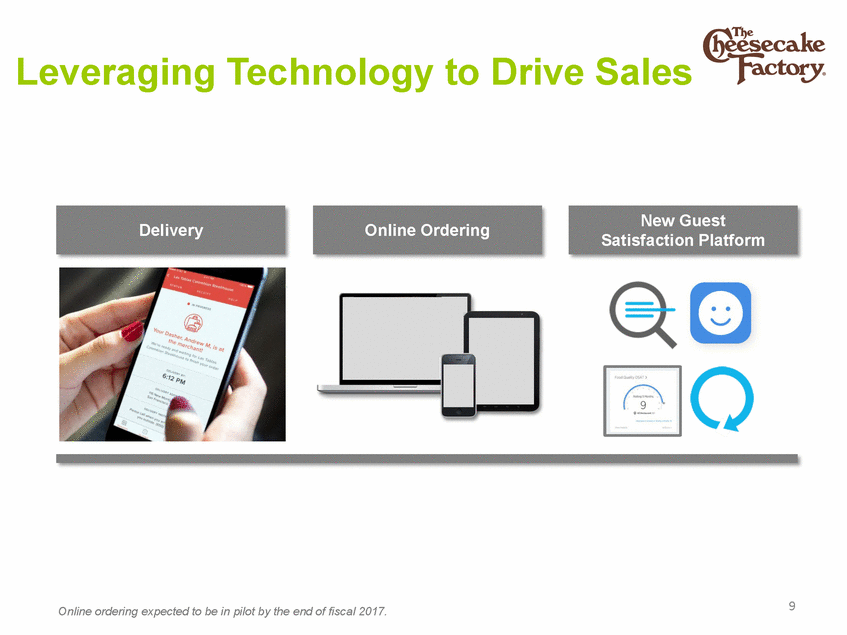
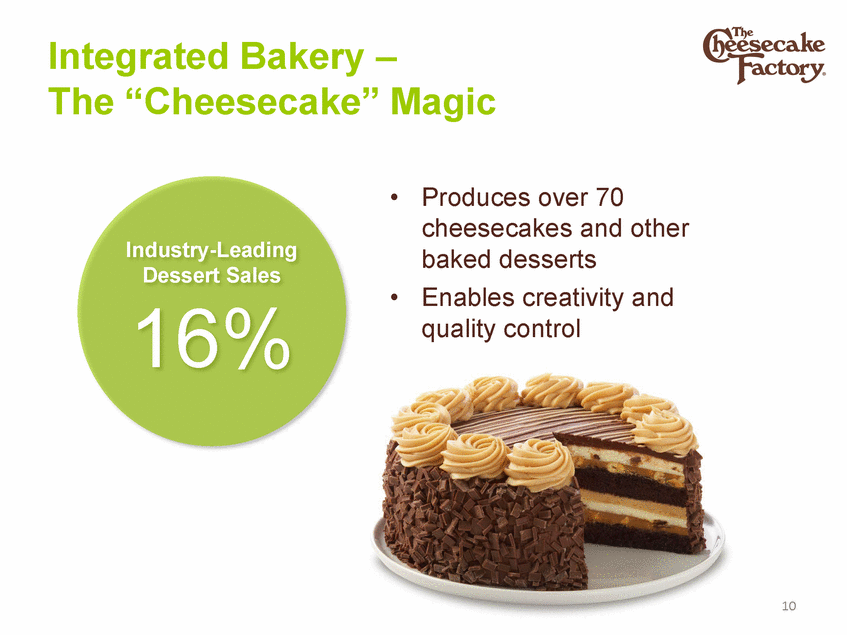
Integrated Bakery – The “Cheesecake” Magic • Produces over 70 cheesecakes and other baked desserts Industry-Leading Dessert Sales 16% • Enables creativity and quality control 10
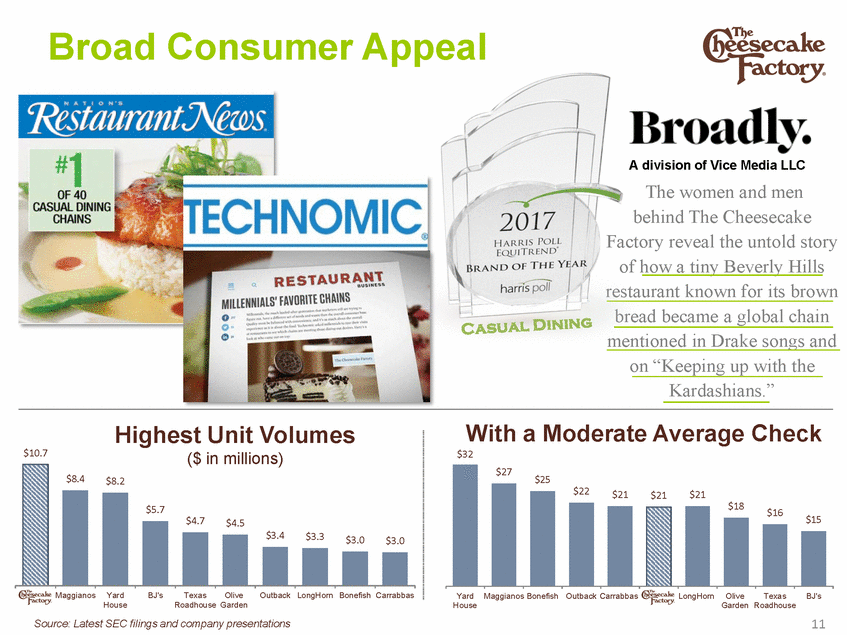
Broad Consumer Appeal A division of Vice Media LLC The women and men behind The Cheesecake Factory reveal the untold story of how a tiny Beverly Hills restaurant known for its brown bread became a global chain mentioned in Drake songs and on “Keeping up with the Kardashians.” With $32 a Moderate Average Check Highest Unit Volumes ($ in millions) $10.7 $25 $15 $4.7 $4.5 Maggianos Yard House BJ'sTexas OliveOutback LongHorn Bonefish Carrabbas Yard House Maggianos Bonefish Outback Carrabbas LongHorn Olive TexasBJ's Roadhouse Garden Garden Roadhouse Source: Latest SEC filings and company presentations 11 $27 $22$21$21$21 $18$16 $8.4$8.2 $5.7 $3.4$3.3$3.0$3.0
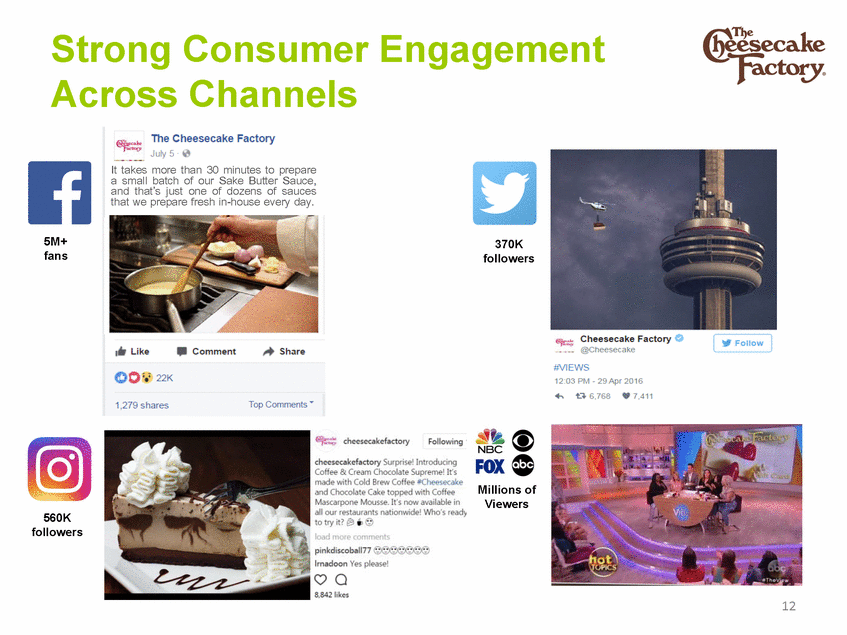
Strong Consumer Across Channels Engagement It takes more than 30 minutes to prepare a small batch of our Sake Butter Sauce, and that’s just one of dozens of sauces that we prepare fresh in-house every day. 5M+ fans 370K followers Millions of Viewers 560K followers 12
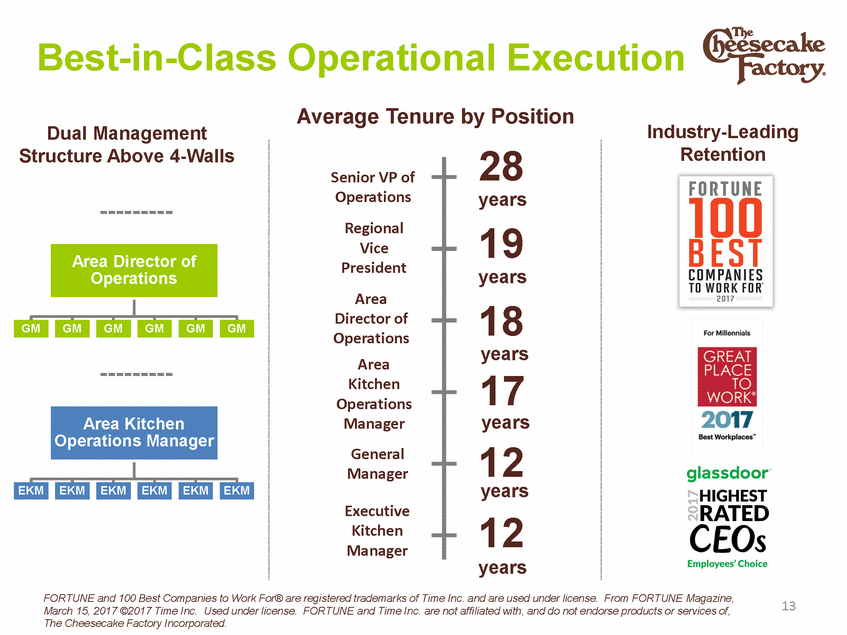
Best-in-Class Operational Execution Average Tenure by Position Industry-Leading Retention Dual Management Structure Above 4-Walls 28 years 19 years 18 years 17 years 12 years 12 Senior VP of Operations Regional Vice President Area Director of Operations Area Kitchen Operations Manager General Manager ------------------Executive Kitchen Manager years FORTUNE and 100 Best Companies to Work For® are registered trademarks of Time Inc. and are used under license. From FORTUNE Magazine, March 15, 2017 ©2017 Time Inc. Used under license. FORTUNE and Time Inc. are not affiliated with, and do not endorse products or services of, The Cheesecake Factory Incorporated. 13 EKM EKM EKM EKM EKM EKM Area Kitchen Operations Manager GM GM GM GM GM GM Area Director of Operations
Leveraging Technology to Manage Costs 14 Dashboards Automated Production Call Market-Based Labor Analytics Kitchen Management System
Diversified Growth Drivers 15
The Cheesecake Factory – Returns-Focused Domestic Growth Opportunity for 300 domestic locations over time • • Site-based strategy Focused on premier locations – high street, lifestyle centers and A malls Infill and new markets Target 7,500 – 10,000 sq. ft. Expect to open as many as 4 - 6 Company-owned restaurants in fiscal 2018 • • • 16 * Illustrative example of target returns for new restaurant openings. Average Unit Economics* Sales $10.7 ~18% $8+ 20% - 25% EBITDA % Cash Capex Investment Cash-on-Cash Return
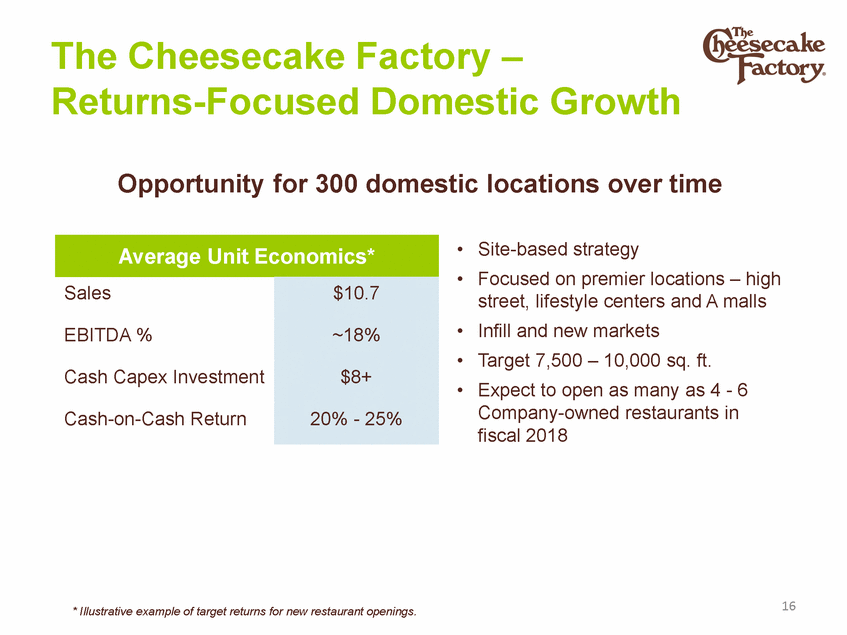
The Cheesecake Factory – Expanding International Licensed Presence • Expect as many as 4 - 5 restaurants to open under licensing agreements internationally in fiscal 2018 Continued expansion within current geographies Potential for additional geographies with current licensees Opportunity to add licensees and territories • • • 17 Shanghai $0 Capital Expenditure +1¢ Per Restaurant in EPS, on Average
Incremental Growth Opportunities North Italia and Flower Child investment Bringing The Cheesecake Factory to Canada Further leveraging the power of The Cheesecake Factory brand in the CPG channel Measured growth of Grand Lux Cafe and RockSugar Internal development of a fast casual concept 18
Track Record of Consistent Financial Performance 19
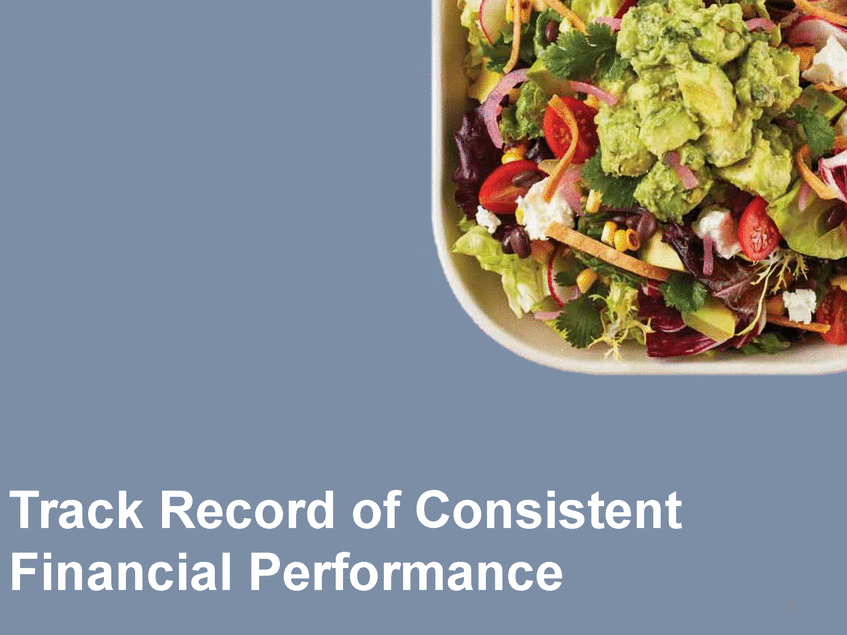
Continuing to Outperform the Industry 2010 2011 2012 2013 2014 2015 2.6% 2016 3Q17 YTD 2.2% 2.0% 2.0% 1.5% 1.5% 1.2% 1.1% 1.0% 0.5% (0.2)% (0.5)% (0.8)% (1.2)% (1.4)% (1.4)% Knapp-Track Index 20
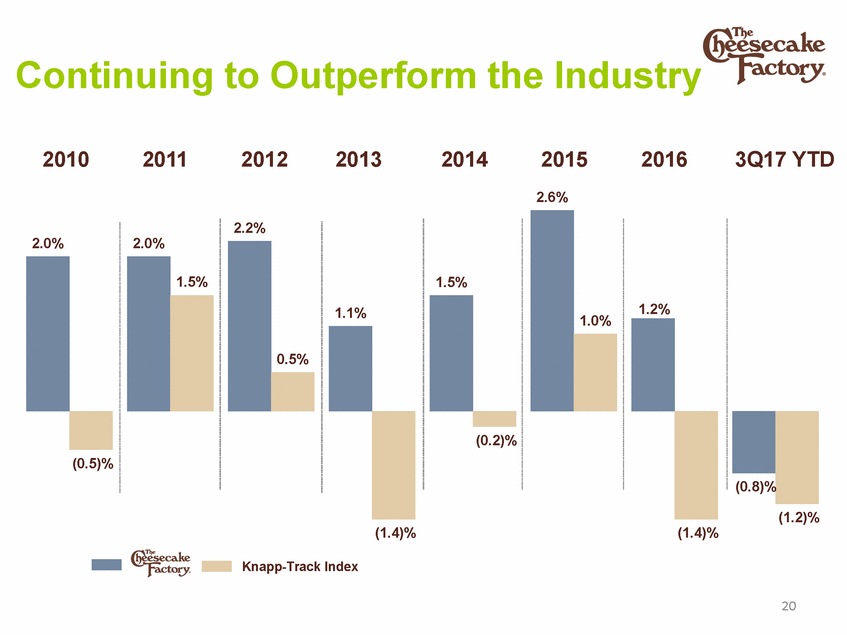
Managing Costs to Support Profitability Adjusted Earnings Per Share* $1.97 2010 2011 2012 2013 2014 2015 2016 2017E** 2018E** * Please see Appendix for GAAP to non-GAAP reconciliations. ** Midpoint of guidance ranges provided November 1, 2017. 21 $2.83 $2.59$2.63 $2.37 $2.10 $1.88 $1.64 $1.42
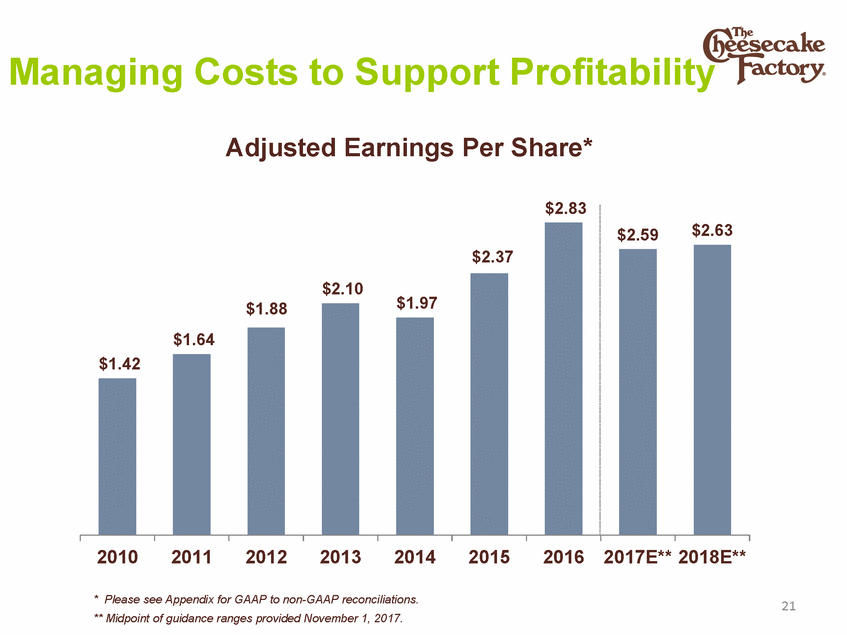
Our Restaurants Generate Significant Cash Flow Cash Flow and Strong Balance Sheet Provide Significant Financial ($ millions) $172 Flexibility $173 $148 ~$145 2010 2011 2012 2013 2014 2015 2016 2017E* 2018E* Free Cash Flow Proceeds from Exercise of Stock Options Free cash flow defined as cash flow from operations less capital expenditures/investments. Please see Appendix for GAAP to non-GAAP reconciliations. *Based on 2017 and 2018 guidance provided November 1, 2017. 22 ~$155 $156 $149 $109 $135
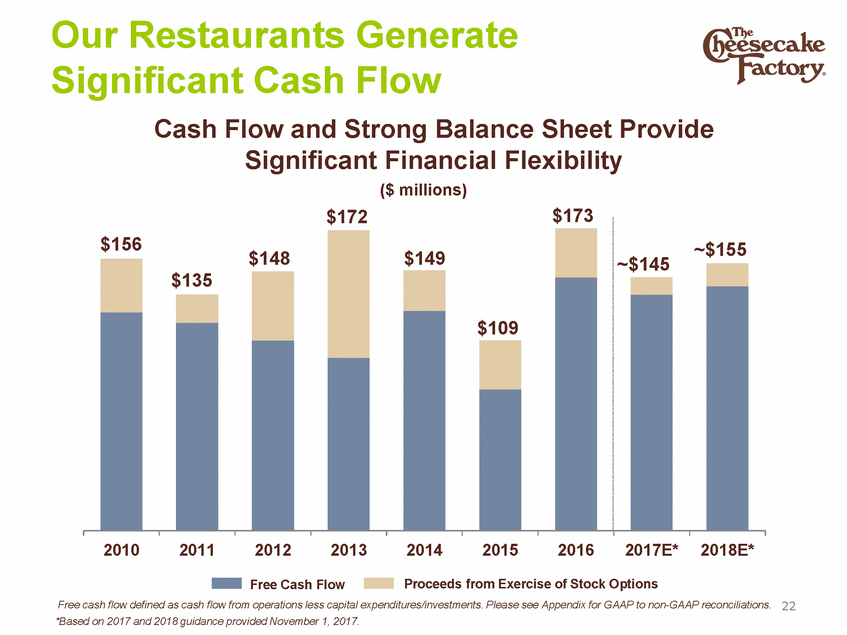
Effective Capital Allocation Supports Our Financial Objectives ~$1 Billion in Share Repurchases Reducing WASO 3% Per Year Committed to Continuing ($ millions) to Grow Dividend 60,446 $13 2010 2011 2012 2013 2014 2015 Dividend 2016 2017E* Capex / Investment Share Repurchases WASO 23 *2017 guidance provided November 1, 2017. ~48,200 $42 $27 ~$50 $36 $146 $184 $30 $109 ~$125 - $150 $141 $172 $101 $158 $154 ~$120 $114 $106 $52 $86 $77 $42
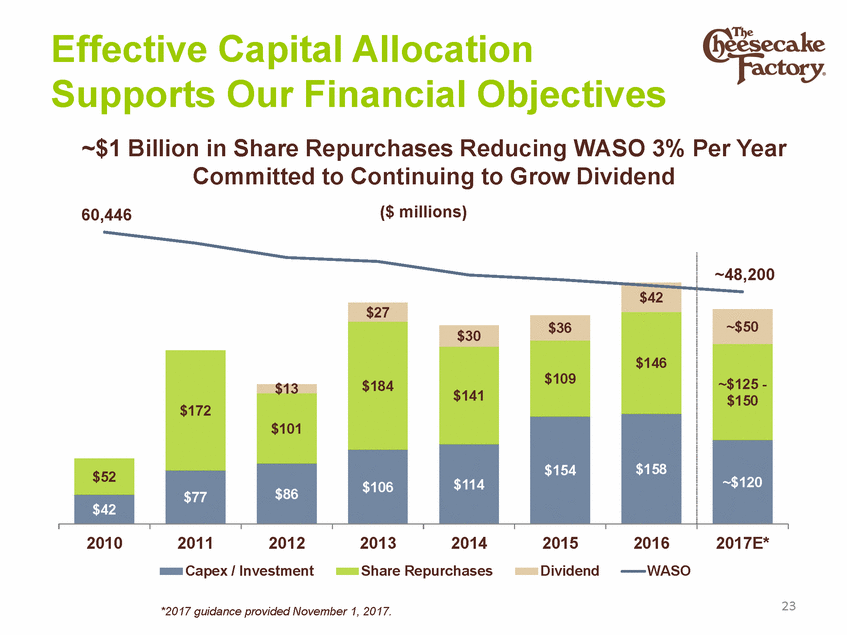
Disciplined, Returns-Focused Growth Has Paid Off Return on Invested Capital (ROIC) 14% 13% 13% 2010 2011 2012 2013 2014 2015 2016 2017E - 2018E ROIC = NOPAT / Average invested capital NOPAT = Income from operations excluding non-recurring expenses (-) income tax provision Invested Capital = Property and equipment + long-term assets + net working capital (-) cash and cash equivalents 24 17% 15% 15%15% 14%
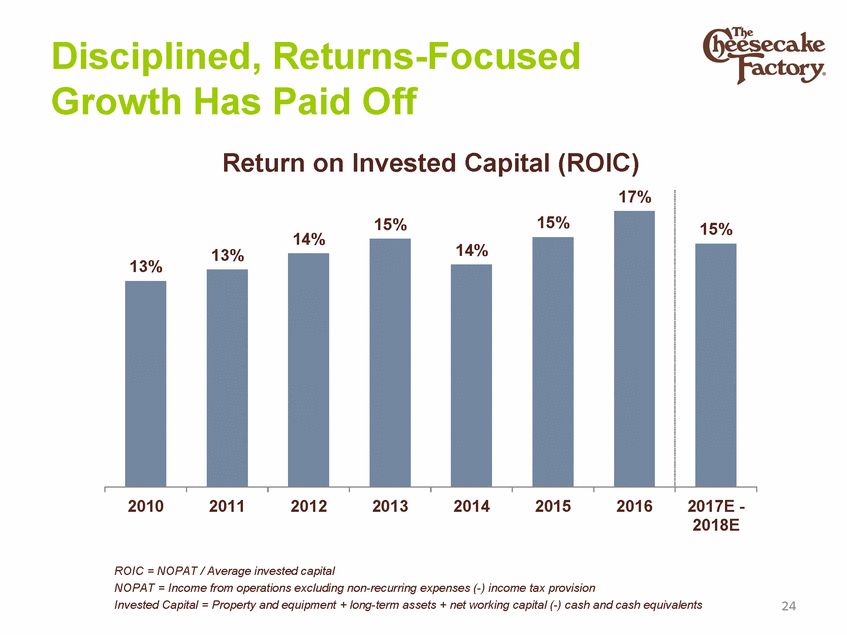
Creating Value for Shareholders Long-Term Objective: Mid-Teens Total Return to Shareholders (EPS + Dividend) • 2017-2018 represents down cycle impact on margins Historical average of 8% - 8.5% operating margin Targeting recapture of 1%+ comparable sales growth at The Cheesecake Factory Support operating margin with international royalty stream and incremental growth opportunities, while maintaining core Cheesecake Factory restaurant-level margins Core Business ~5% • Comparable Sales Growth • Unit Growth Operating Margin • International Licensed Incremental Growth Opportunities Share Repurchases Dividend 25 Total Return to Shareholders ~1-2% ~3-4% Flat ~2% ~2% ~3% ~2-3%
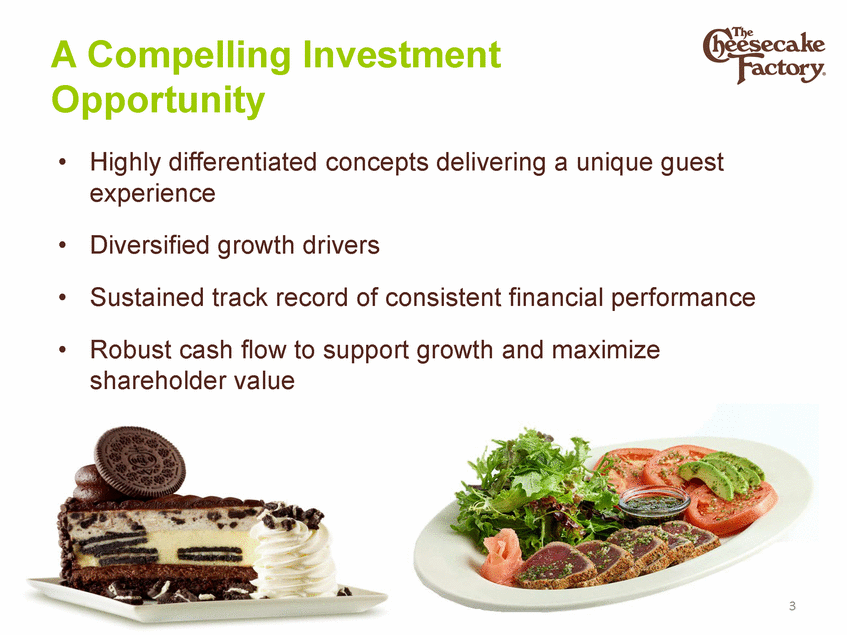
A Compelling Investment Opportunity • Highly differentiated concepts delivering experience a unique guest • • Diversified growth drivers Sustained track record of consistent financial performance • Robust cash flow to support growth and maximize shareholder value 26
Appendix 27
Non-GAAP Reconciliation In addition to the results provided in accordance with the Generally Accepted Accounting Principles (“GAAP”) in this presentation, the Company is providing non-GAAP measurements which present diluted net income per share excluding the impact of certain items and free cash flow. The non-GAAP measurements are intended to supplement the presentation of the company’s financial results in accordance with GAAP. The company believes facilitate that the presentation of these items provides additional information to the comparison of past and present financial results. 28
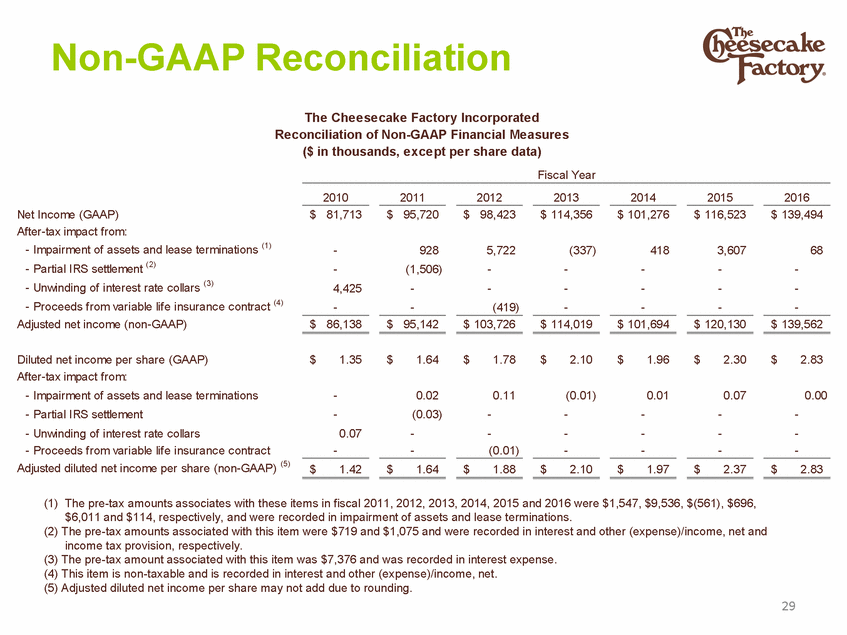
Non-GAAP Reconciliation The Cheesecake Factory Incorporated Reconciliation of Non-GAAP Financial Measures ($ in thousands, except per share data) Fiscal Year 2010 2011 2012 2013 2014 2015 2016 Net Income (GAAP) After-tax impact from: - Impairment of assets and lease terminations (1) - Partial IRS settlement (2) - Unwinding of interest rate collars (3) - Proceeds from variable life insurance contract (4) Adjusted net income (non-GAAP) $ 81,713 $ 95,720 $ 98,423 $ 114,356 $ 101,276 $ 116,523 $ 139,494 - - 4,425 - 928 (1,506) - - 5,722 - - (419) (337) 418 3,607 - - - 68 - - - - - - - - - $ 86,138 $ 95,142 $ 103,726 $ 114,019 $ 101,694 $ 120,130 $ 139,562 Diluted net income per share (GAAP) After-tax impact from: - Impairment of assets and lease terminations - Partial IRS settlement - Unwinding of interest rate collars - Proceeds from variable life insurance contract Adjusted diluted net income per share (non-GAAP) (5) $ 1.35 $ 1.64 $ 1.78 $ 2.10 $ 1.96 $ 2.30 $ 2.83 - - 0.02 (0.03) - - 0.11 (0.01) - - - 0.01 0.07 0.00 - - (0.01) - - - - - - - - - 0.07 - $ 1.42 $ 1.64 $ 1.88 $ 2.10 $ 1.97 $ 2.37 $ 2.83 (1) The pre-tax amounts associates with these items in fiscal 2011, 2012, 2013, 2014, 2015 and 2016 were $1,547, $9,536, $(561), $696, $6,011 and $114, respectively, and were recorded in impairment of assets and lease terminations. (2) The pre-tax amounts associated with this item were $719 and $1,075 and were recorded in interest and other (expense)/income, net and income tax provision, respectively. (3) The pre-tax amount associated with this item was $7,376 and was recorded in interest expense. (4) This item is non-taxable and is recorded in interest and other (expense)/income, net. (5) Adjusted diluted net income per share may not add due to rounding. 29
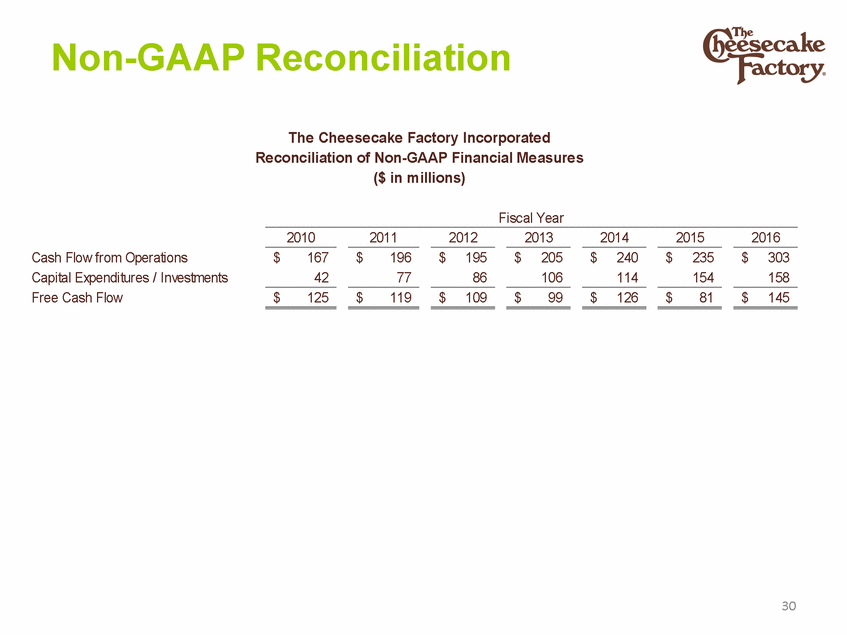
Non-GAAP Reconciliation The Cheesecake Factory Incorporated Reconciliation of Non-GAAP Financial Measures ($ in millions) Fiscal Year 2010 2011 2012 2013 2014 2015 2016 Cash Flow from Operations Capital Expenditures / Investments Free Cash Flow $ 167 42 $ 196 77 $ 195 86 $ 205 106 $ 240 114 $ 235 154 $ 303 158 $ 125 $ 119 $ 109 $ 99 $ 126 $ 81 $ 145 30
