Attached files
| file | filename |
|---|---|
| 8-K - 8-K - Jernigan Capital, Inc. | tv479278_8k.htm |
Exhibit 99.1
1 Investor Presentation November 2017
2 Safe Harbor Disclosure Regarding Forward - Looking Statements This presentation includes "forward - looking statements" within the meaning of Section 27A of the Securities Act of 1933 and Sect ion 21E of the Securities Exchange Act of 1934 and other federal securities laws, including statements regarding our future performance, rates of return, ability to obtain future financing, including our ability to increase the capacity under our credit facility, exit capitalization rates, our use of capital, the timing of our investment cycle, the expected timing of certificates of occupancy, our ability to acquire wholly - owned assets, future profits from investments, our future stock price, our dividends to our common stockholders and the holders of our Series A Pr efe rred Stock, our loan pipeline, our anticipated loan closings, future funding of existing loan commitments, and components of our fourth quarter 2017 and preliminary full - year 2018 earnings guidance. The ultimate occurrence of events and results referenced in these forward - looking statements is subject to known and unknown risks and uncertainties, many of which are beyond our control. Such risks include our ability to ob tain additional liquidity to fund our loan pipeline, our ability to make distributions at expected levels, the potential impact of interest r ate fluctuations, the uncertainty as to the value of our investments, the lack of liquidity in our investments and whether we can realize expected gai ns from our equity participation interests. These forward - looking statements are based upon our present intentions and expectations, but the events and results referenced in these statements are not guaranteed to occur. Investors should not place undue reliance upon forward - looki ng statements. There can be no assurance that our expectations of the future performance of our investments will be achieved. This informati on provided herein is as of this date, and we undertake no duty to update any forward - looking statements contained herein. For a discussion of these and other risks facing our business, see the information under the heading “Risk Factors” in our Annual Report on Form 10 - K for the year ended December 31, 2016 and in other filings we make with the Securities and Exchange Commission (“SEC”) from time to time, which are accessible on the SEC’s website at www.sec.gov . This presentation contains statistics and other data that has been obtained from or compiled from information made available by third parties. We have not independently verified such statistics or data . Unless otherwise indicated, all metrics presented herein are as of September 30, 2017 . Contact: Jernigan Capital, Inc. Investor Relations (901) 567 - 9580 investorrelations@jernigancapital.com
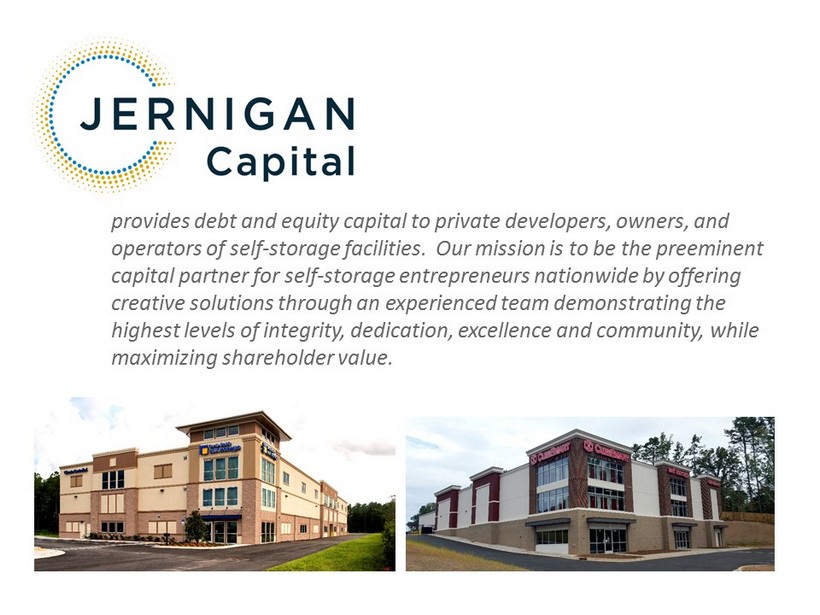
3 March 2017 provides debt and equity capital to private developers, owners, and operators of self - storage facilities. Our mission is to be the preeminent capital partner for self - storage entrepreneurs nationwide by offering creative solutions through an experienced team demonstrating the highest levels of integrity, dedication, excellence and community, while maximizing shareholder value.
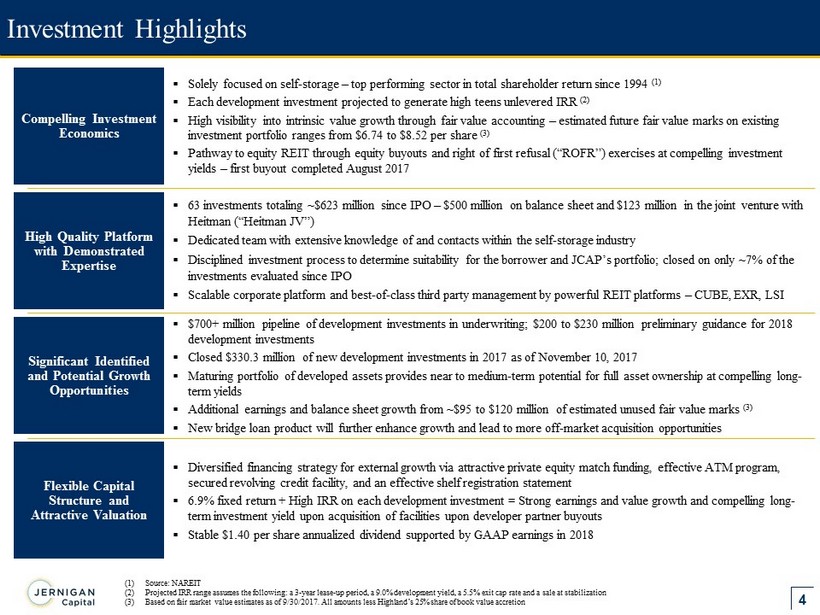
4 ▪ $700+ million pipeline of development investments in underwriting; $200 to $230 million preliminary guidance for 2018 development investments ▪ Closed $330.3 million of new development investments in 2017 as of November 10, 2017 ▪ Maturing portfolio of developed assets provides near to medium - term potential for full asset ownership at compelling long - term yields ▪ Additional earnings and balance sheet growth from ~$95 to $120 million of estimated unused fair value marks (3) ▪ New bridge loan product will further enhance growth and lead to more off - market acquisition opportunities Significant Identified and Potential Growth Opportunities Investment Highlights Compelling Investment Economics ▪ Solely focused on self - storage – top performing sector in total shareholder return since 1994 (1) ▪ Each development investment projected to generate high teens unlevered IRR (2) ▪ High visibility into intrinsic value growth through fair value accounting – estimated future fair value marks on existing investment portfolio ranges from $6.74 to $8.52 per share (3) ▪ P athway to equity REIT through equity buyouts and right of first refusal (“ROFR”) exercises at compelling investment yields – first buyout completed August 2017 Flexible Capital Structure and Attractive Valuation ▪ Diversified financing strategy for external growth via attractive private equity match funding, effective ATM program, secured revolving credit facility, and an effective shelf registration statement ▪ 6.9 % fixed return + High IRR on each development investment = Strong earnings and value growth and compelling long - term investment yield upon acquisition of facilities upon developer partner buyouts ▪ Stable $1.40 per share annualized dividend supported by GAAP earnings in 2018 (1) Source: NAREIT (2) Projected IRR range assumes the following: a 3 - year lease - up period, a 9.0% development yield, a 5.5% exit cap rate and a sale at stabilization (3) Based on fair market value estimates as of 9/30/2017. All amounts less Highland’s 25% share of book value accretion High Quality Platform with Demonstrated Expertise ▪ 63 investments totaling ~$623 million since IPO – $500 million on balance sheet and $123 million in the joint venture with Heitman (“Heitman JV”) ▪ Dedicated team with extensive knowledge of and contacts within the self - storage industry ▪ Disciplined investment process to determine suitability for the borrower and JCAP’s portfolio; closed on only ~7% of the investments evaluated since IPO ▪ Scalable corporate platform and best - of - class third party management by powerful REIT platforms – CUBE, EXR, LSI
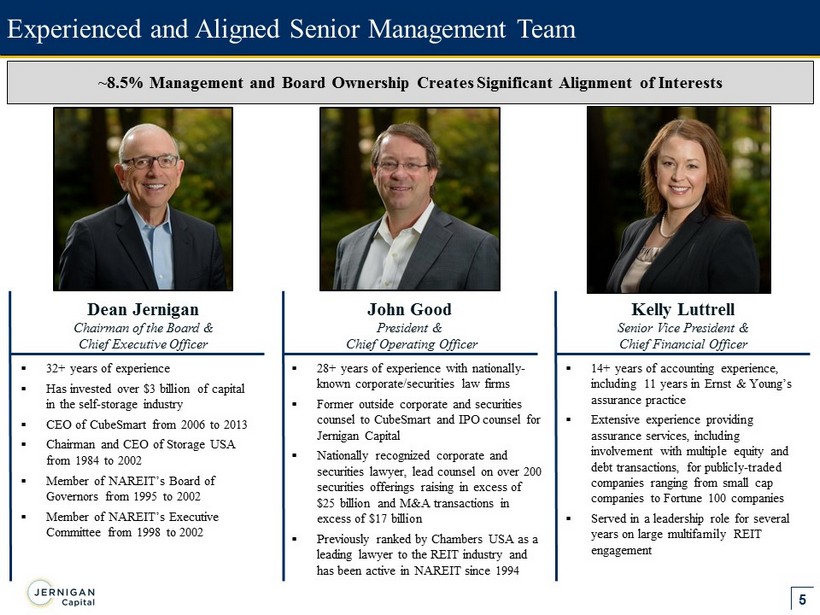
5 Experienced and Aligned Senior Management Team ~8.5% Management and Board Ownership Creates Significant Alignment of Interests Dean Jernigan Chairman of the Board & Chief Executive Officer John Good President & Chief Operating Officer Kelly Luttrell Senior Vice President & Chief Financial Officer ▪ 32+ years of experience ▪ Has invested over $3 billion of capital in the self - storage industry ▪ CEO of CubeSmart from 2006 to 2013 ▪ Chairman and CEO of Storage USA from 1984 to 2002 ▪ Member of NAREIT’s Board of Governors from 1995 to 2002 ▪ Member of NAREIT’s Executive Committee from 1998 to 2002 ▪ 28+ years of experience with nationally - known corporate/securities law firms ▪ Former outside corporate and securities counsel to CubeSmart and IPO counsel for Jernigan Capital ▪ Nationally recognized corporate and securities lawyer, lead counsel on over 200 securities offerings raising in excess of $25 billion and M&A transactions in excess of $17 billion ▪ Previously ranked by Chambers USA as a leading lawyer to the REIT industry and has been active in NAREIT since 1994 ▪ 14+ years of accounting experience, including 11 years in Ernst & Young’s assurance practice ▪ Extensive experience providing assurance services, including involvement with multiple equity and debt transactions, for publicly - traded companies ranging from small cap companies to Fortune 100 companies ▪ Served in a leadership role for several years on large multifamily REIT engagement

6 Experienced Senior Management Team with Significant Ownership Significant Identified and Potential Growth Opportunities Compelling Investment Economics Flexible Capital Structure and Attractive Valuation High Quality Platform with Demonstrated Expertise Attractive Investment Thesis High ROI Investment Opportunity in Self - Storage Sector
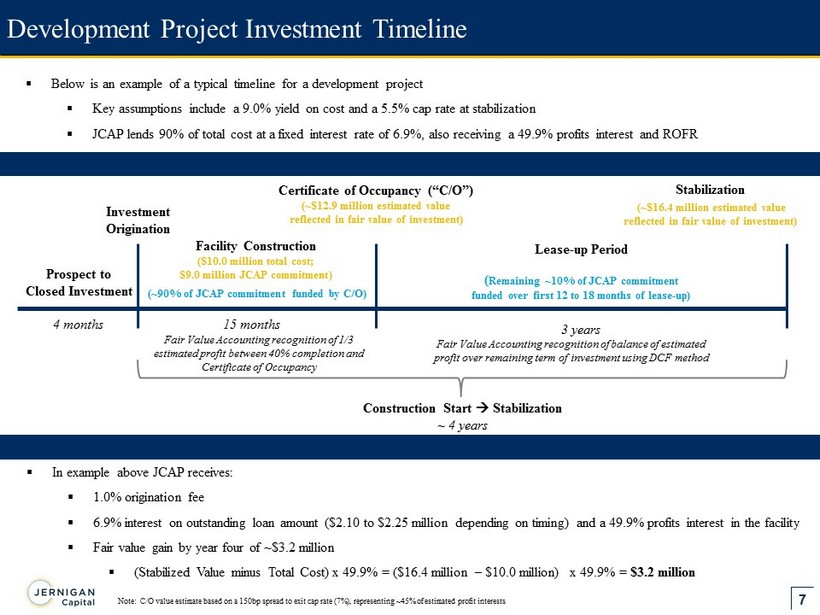
7 Development Project Investment Timeline Prospect to Closed Investment Facility Construction ($ 10.0 million total cost; $9.0 million JCAP commitment) Lease - up P eriod Certificate of Occupancy (“C/O”) (~$ 12.9 million estimated value r eflected in fair value of investment) Investment Origination Stabilization (~$ 16.4 million estimated value reflected in fair value of investment) Construction Start Stabilization ~ 4 years ▪ Below is an example of a typical timeline for a development project ▪ Key assumptions include a 9.0% yield on cost and a 5.5% cap rate at stabilization ▪ JCAP lends 90% of total cost at a fixed interest rate of 6.9%, also receiving a 49.9% profits interest and ROFR Fair Value Accounting recognition of 1/3 estimated profit between 40% completion and Certificate of Occupancy Fair Value Accounting recognition of balance of estimated profit over remaining term of investment using DCF method Note: C/O value estimate based on a 150bp spread to exit cap rate (7%), representing ~45% of estimated profit interests ▪ In example above JCAP receives: ▪ 1.0% origination fee ▪ 6.9% interest on outstanding loan amount ($2.10 to $2.25 million depending on timing) and a 49.9% profits interest in the facility ▪ Fair value gain by year four of ~$3.2 million ▪ (Stabilized Value minus Total Cost) x 49.9% = ($ 16.4 million – $ 10.0 million) x 49.9% = $ 3.2 m illion (~90% of JCAP commitment funded by C/O) 15 months 3 years ( R emaining ~10% of JCAP commitment funded over first 12 to 18 months of lease - up) 4 months
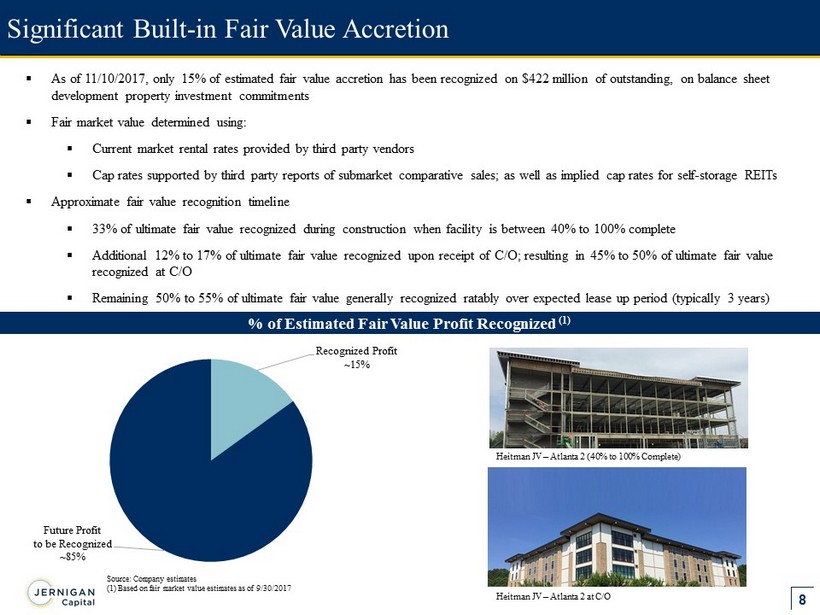
8 Significant Built - in Fair Value Accretion Source: Company estimates (1) Based on fair market value estimates as of 9/30/2017 ▪ As of 11/10/2017, only 15% of estimated fair value accretion has been recognized on $422 million of outstanding, on balance s hee t development property investment commitments ▪ Fair market v alue determined using: ▪ Current market rental rates provided by third party vendors ▪ Cap rates supported by third party reports of submarket comparative sales; as well as implied c ap rates for self - storage REITs ▪ Approximate fair value recognition timeline ▪ 33% of ultimate fair value recognized during construction when facility is between 40% to 100% complete ▪ Additional 12% to 17% of ultimate fair value recognized upon receipt of C/O; resulting in 45% to 50% of ultimate fair value recognized at C/O ▪ Remaining 50% to 55% of ultimate fair value generally recognized ratably over expected lease up period (typically 3 years) % of Estimated Fair Value Profit Recognized (1) Recognized Profit ~ 15% Future Profit to be Recognized ~ 85% Heitman JV – Atlanta 2 (40% to 100% Complete) Heitman JV – Atlanta 2 at C/O

9 Potential FMV Accretion (1) Assumptions include the following: - Capital available includes $55 million cash, $115 million Highland preferred and $200 million LOC - ~$220 million of available capital used to fund remaining cash portion of closed investments and ~$140 million remaining capi tal used for future balance sheet investments - All amounts less Highland’s 25% share of book value accretion Potential Future FMV Accretion Per Share (1) ▪ A significant portion of future fair market value accretion is from loans that have already closed ▪ The table below displays potential future fair market value (“FMV”) accretion per share ▪ Using current fair market value estimates for closed loans ▪ Sensitizes development yield and exit cap rate for future loans based on current capital availability % of Future FMV Accretion from Closed Investments (1) Exit Cap Rate Development Yield 8.0% 8.5% 9.0% 9.5% 10.0% 10.5% 11.0% 4.5% $10.88 $11.34 $11.80 $12.26 $12.71 $13.17 $13.63 5.0% $10.15 $10.56 $10.98 $11.39 $11.80 $12.21 $12.62 5.5% $9.55 $9.93 $10.30 $10.68 $11.05 $11.42 $11.80 6.0% $9.06 $9.40 $9.74 $10.08 $10.43 $10.77 $11.11 6.5% $8.63 $8.95 $9.27 $9.58 $9.90 $10.22 $10.53 Exit Cap Rate Development Yield 8.0% 8.5% 9.0% 9.5% 10.0% 10.5% 11.0% 4.5% 70.6% 67.8% 65.1% 62.7% 60.4% 58.3% 56.4% 5.0% 75.7% 72.7% 70.0% 67.5% 65.1% 62.9% 60.9% 5.5% 80.4% 77.4% 74.6% 72.0% 69.5% 67.3% 65.1% 6.0% 84.9% 81.8% 78.9% 76.2% 73.7% 71.3% 69.1% 6.5% 89.0% 85.9% 82.9% 80.2% 77.6% 75.2% 73.0%
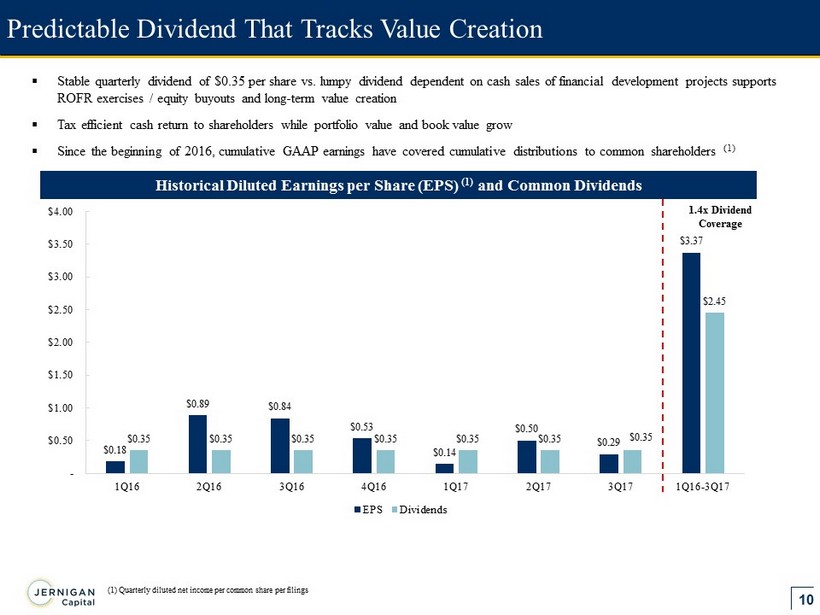
10 Predictable Dividend That Tracks Value Creation (1) Quarterly diluted net income per common share per filings ▪ Stable quarterly dividend of $0.35 per share vs. lumpy dividend dependent on cash sales of financial development projects sup por ts ROFR exercises / equity buyouts and long - term value creation ▪ Tax efficient cash return to shareholders while portfolio value and book value grow ▪ Since the beginning of 2016, cumulative GAAP earnings have covered cumulative distributions to common shareholders (1) Historical Diluted Earnings per Share (EPS) (1) and Common Dividends $0.18 $0.89 $0.84 $0.53 $0.14 $0.50 $0.29 $3.37 $0.35 $0.35 $0.35 $0.35 $0.35 $0.35 $0.35 $2.45 - $0.50 $1.00 $1.50 $2.00 $2.50 $3.00 $3.50 $4.00 1Q16 2Q16 3Q16 4Q16 1Q17 2Q17 3Q17 1Q16-3Q17 EPS Dividends 1.4x Dividend Coverage

11 Selective Underwriting $9.1 billion Investments Reviewed $1.1 billion Term Sheets Issued $821 million Signed Term Sheets $623 million (~7% of Evaluated) Closed Investments* Stringent Underwriting Process Based on Management’s Extensive Experience and Successful Track Record Investing in Self - Storage * As of November 10, 2017
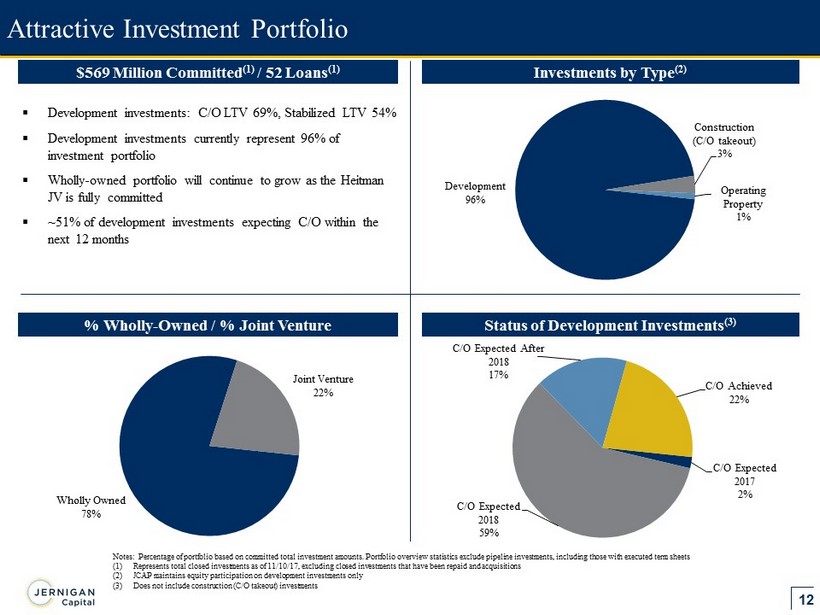
12 Attractive Investment Portfolio % Wholly - Owned / % Joint Venture Status of Development Investments (3) ▪ Development investments: C/O LTV 69%, Stabilized LTV 54% ▪ Development investments currently represent 96% of investment portfolio ▪ Wholly - owned portfolio will continue to grow as the Heitman JV is fully committed ▪ ~51% of development investments expecting C/O within the next 12 months Notes: Percentage of portfolio based on committed total investment amounts . Portfolio overview statistics exclude pipeline investments, including those with executed term sheets (1) Represents total closed investments as of 11/10/17 , excluding closed investments that have been repaid and acquisitions (2) JCAP maintains equity participation on development investments only (3) Does not include construction (C/O takeout) investments $569 Million Committed (1) / 52 Loans (1) Investments by Type (2) Development 96% Construction (C/O takeout) 3% Operating Property 1% Wholly Owned 78% Joint Venture 22% C/O Expected 2017 2% C/O Expected 2018 59% C/O Expected After 2018 17% C/O Achieved 22%
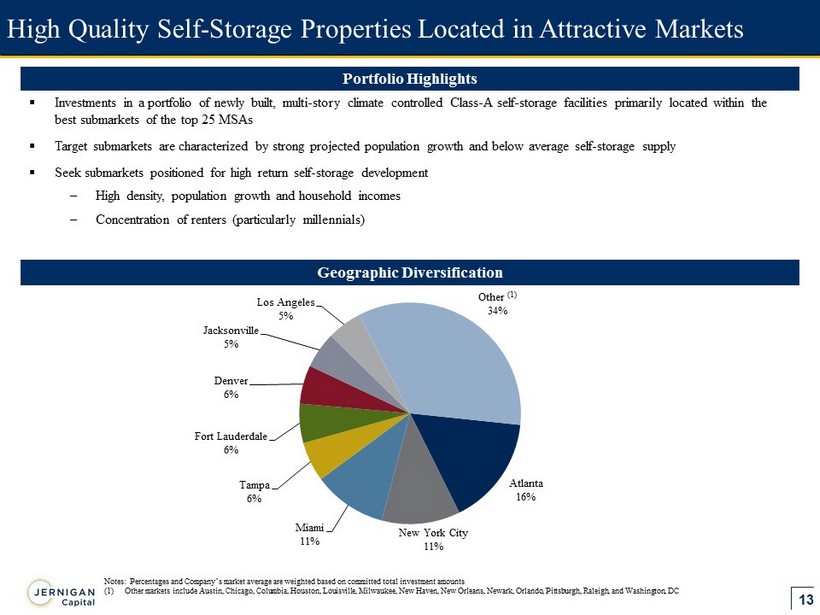
13 High Quality Self - Storage Properties Located in Attractive Markets Geographic Diversification Notes: Percentages and Company’s market average are weighted based on committed total investment amounts (1) Other markets include Austin, Chicago, Columbia, Houston , Louisville , Milwaukee, New Haven, New Orleans, Newark, Orlando, Pittsburgh , Raleigh, and Washington, DC ▪ Investments in a portfolio of newly built, multi - story climate controlled Class - A self - storage facilities primarily located within the best submarkets of the top 25 MSAs ▪ Target submarkets are characterized by strong projected population growth and below average self - storage supply ▪ Seek submarkets positioned for high return self - storage development – High density, population growth and household incomes – Concentration of renters (particularly millennials ) Portfolio Highlights Atlanta 16% New York City 11% Miami 11% Tampa 6% Fort Lauderdale 6% Denver 6% Jacksonville 5% Los Angeles 5% Other (1) 34%

14 Austin Orlando 1 Atlanta 1 Atlanta 2 ▪ Faster lease - up – vast majority of projects exceeding occupancy projections ▪ Cost savings from faster lease - up Consistent Outperformance Relative to Underwriting (1) Months open and physical occupancy as of 11/9/17 (2) Orlando 1 (51,235 NRSF) was at 86.2% physical o ccupancy on 7/18/17. On 7/19/17 a 42,730 NRSF addition opened for business. Occupancy reflected is for combined facility (3) Property opened to partial leasing October 9, 2016. All floors opened to leasing February 2017 (4) (H ) denotes a facility that is part of our Heitman JV Commitment Date MSA Date Opened Months Open (1) Current Physical Occupancy (1) Year 2 UW Occupancy 6/19/2015 Tampa 1 4/11/2016 19 84.0% 70.0 % 4/21/2015 Orlando 1/2 5/1/2016 19 (2) 72.2% 70.0% 6/26/2015 Atlanta 2 5/24/2016 18 72.6% 70.0% 6/10/2015 Atlanta 1 5/25/2016 18 62.0% 70.0% 9/30/2015 Jacksonville 1 8/12/2016 15 90.7% 70.0% 6/29/2015 Charlotte 1 8/18/2016 15 41.6% 70.0% 7/2/2015 Milwaukee 10/9/2016 (3) 13 29.9% 70.0% Average (Facilities open for more than 1 year) 16.7 64.7% 70.0% Commitment Date MSA Date Opened Months Open (1) Current Physical Occupancy (1) Year 1 UW Occupancy 7/31/2015 New Haven 12/16/2016 11 47.2% 40.0% 10/27/2015 Austin 3/16/2017 8 28.0% 40.0% 8/10/2015 Pittsburgh 5/11/2017 6 16.4% 40.0% 7/19/2016 Jacksonville (H) (4) 7/26/2017 4 30.7% 40.0% 9/26/2016 Columbia (H) (4) 8/23/2017 3 14.5% 40.0% 8/16/2016 Atlanta 2 (H ) (4) 9/14/2017 2 5.0% 40.0% 4/11/2016 Washington DC (H ) (4) 9/25/2017 2 6.4% 40.0% 1/4/2017 New York City 2 9/29/2017 1 6.0% 40.0% Average (Facilities open for less than 1 year) 4.5 19.3% 40.0% Average (All facilities ) 10.2 40.5% Underwriting Track Record
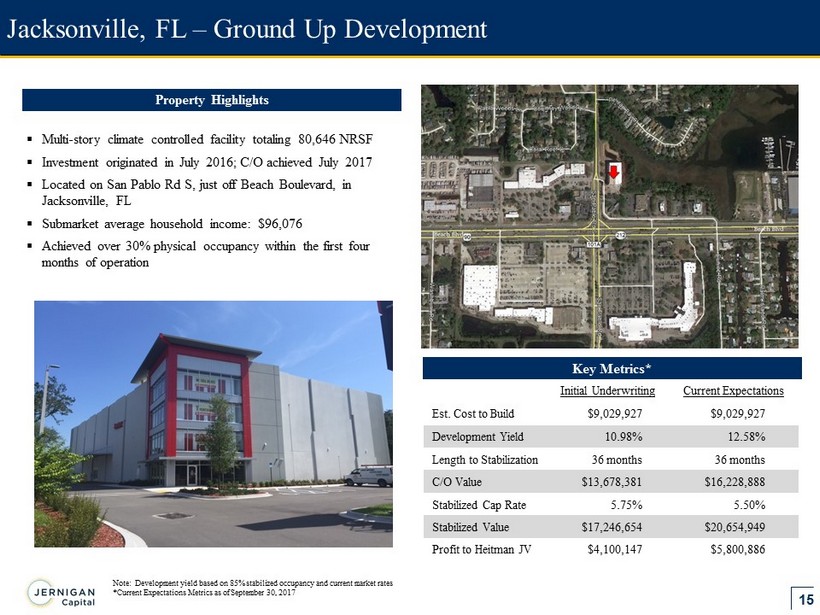
15 Jacksonville, FL – Ground Up Development Initial Underwriting Current Expectations Est. Cost to Build $9,029,927 $9,029,927 Development Yield 10.98% 12.58% Length to Stabilization 36 months 36 months C/O Value $13,678,381 $16,228,888 Stabilized Cap Rate 5.75% 5.50% Stabilized Value $17,246,654 $20,654,949 Profit to Heitman JV $4,100,147 $5,800,886 Key Metrics* Property Highlights ▪ Multi - story climate controlled facility totaling 80,646 NRSF ▪ Investment originated in July 2016; C/O achieved July 2017 ▪ Located on San Pablo Rd S, just off Beach Boulevard, in Jacksonville, FL ▪ Submarket average household income: $96,076 ▪ Achieved over 30% physical occupancy within the first four months of operation Note: Development yield based on 85% stabilized occupancy and current market rates *Current Expectations Metrics as of September 30, 2017
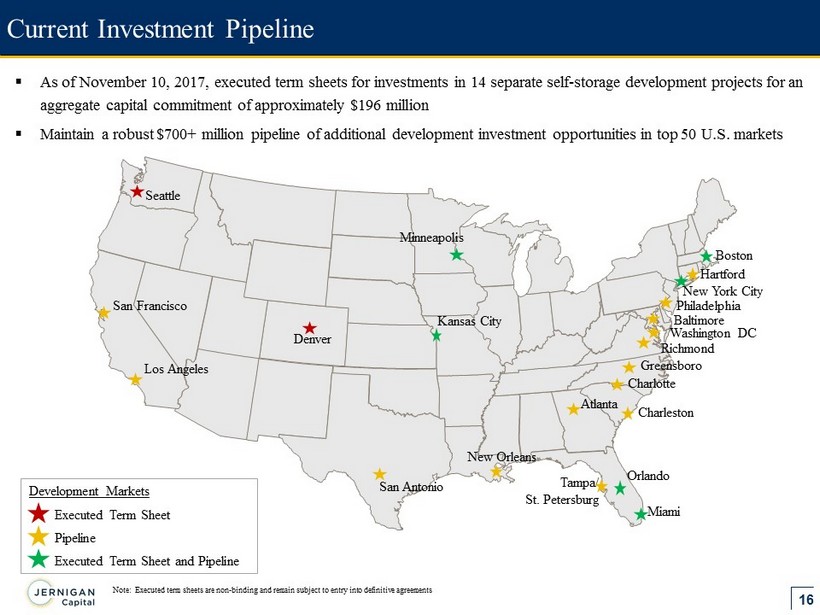
16 Current Investment Pipeline Note: Executed term sheets are non - binding and remain subject to entry into definitive agreements Atlanta Denver Boston Miami New Orleans New York City Orlando Seattle Los Angeles Richmond Tampa / St . Petersburg Development Markets Executed Term Sheet Pipeline Executed Term Sheet and Pipeline Hartford Washington DC Minneapolis Kansas City Baltimore San Antonio San Francisco Charlotte Greensboro Philadelphia Charleston ▪ As of November 10, 2017, executed term sheets for investments in 14 separate self - storage development projects for an aggregate capital commitment of approximately $196 million ▪ Maintain a robust $700+ million pipeline of additional development investment opportunities in top 50 U.S. markets
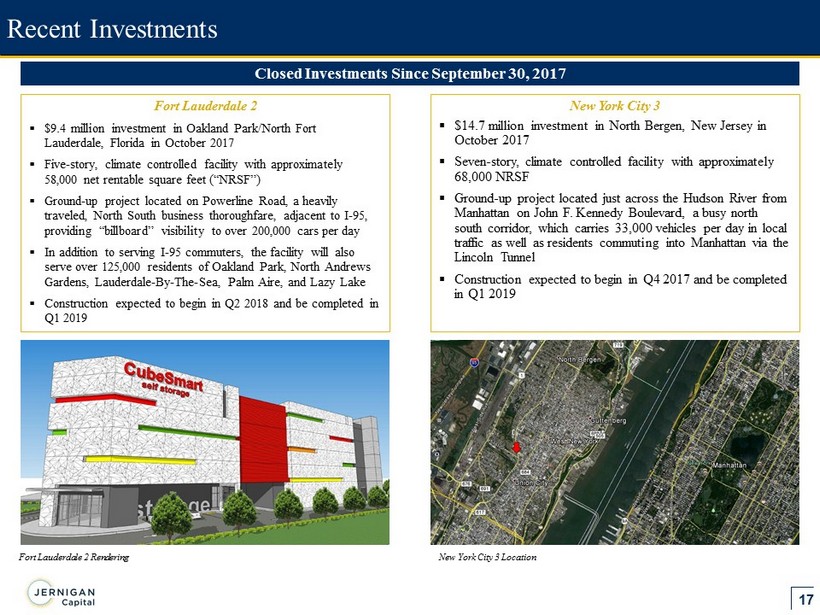
17 Recent Investments Closed Investments Since September 30, 2017 Fort Lauderdale 2 ▪ $ 9.4 million investment in Oakland Park/North Fort Lauderdale, Florida in October 2017 ▪ Five - story, climate controlled facility with approximately 58,000 net rentable square feet (“NRSF”) ▪ Ground - up project located on Powerline Road, a heavily traveled, North South business thoroughfare, adjacent to I - 95, providing “billboard” visibility to over 200,000 cars per day ▪ In addition to serving I - 95 commuters, the facility will also serve over 125,000 residents of Oakland Park, North Andrews Gardens, Lauderdale - By - The - Sea, Palm Aire, and Lazy Lake ▪ Construction expected to begin in Q2 2018 and be completed in Q1 2019 New York City 3 ▪ $14.7 million investment in North Bergen, New Jersey in October 2017 ▪ Seven - story, climate controlled facility with approximately 68,000 NRSF ▪ Ground - up project located just across the Hudson River from Manhattan on John F. Kennedy Boulevard, a busy north south corridor, which carries 33,000 vehicles per day in local traffic as well as residents commuting into Manhattan via the Lincoln Tunnel ▪ Construction expected to begin in Q4 2017 and be completed in Q1 2019 Fort Lauderdale 2 Rendering New York City 3 Location

18 Orlando, FL Acquisition Case Study Investment Highlights ▪ Multi - story climate controlled, non climate, and covered RV space facility totaling 93,965 NRSF ▪ Phase 1 of facility received C/O in May 2016; P hase 2 received C/O in June 2017 ▪ Although facility opened in two stages; current occupancy for combined facility is 72.2% – well ahead of underwritten lease up expectations ▪ In January 2017, JCAP purchased 25.1% of its partner's interest in Phase 1 for $1.3 million ▪ In August 2017, JCAP acquired full ownership of the facility by purchasing its partner’s remaining 25.1% profits interest in P hase 1 and its partner’s 50.1% profits interest in P hase 2, for $1.6 million ▪ Expected investment yield on JCAP cost once facility stabilizes is an attractive 8.1% ▪ The now wholly - owned Orlando facility illustrates JCAP’s clear pathway to become a hybrid equity REIT
19 Recent Financial Highlights ▪ Reported Q3 2017 EPS of $0.29 per share and Adjusted EPS of $0.35 per share ▪ Closed on $330.3 million of new development investments with profits interests comprising 26 projects between January 1, 2017 and November 10, 2017; updated full - year 2017 projected closings range to be between $395 million to $405 million ▪ Provided full - year 2018 range of projected closings of new development investments with profits interests of $200 million to $230 million ▪ Guided to total revenue range of $24 million to $26 million and a fair value appreciation range of $46 million to $56 million for full - year 2018, increases at the midpoint of approximately 104% and 382% over expected full - year 2017 revenue and fair valuation appreciation, respectively (1) ▪ Issued $10 million of additional shares of Series A Preferred Stock in October 2017, increasing the total balance of Series A Preferred Stock to $20 million, leaving $105 million available to be issued by July 2018 ▪ Obtained $100 million senior secured revolving credit facility with an accordion feature permitting expansion up to $200 million ▪ Launched $50.0 million at - the - market offering (“ATM”) program on April 5, 2017 and subsequently has sold 1,122,618 shares of common stock at a weighted average price of $22.63 per share through November 10, 2017 under the ATM program (1) See our earnings press release dated November 1, 2017 for the applicable assumptions for this guidance
20 Appendix
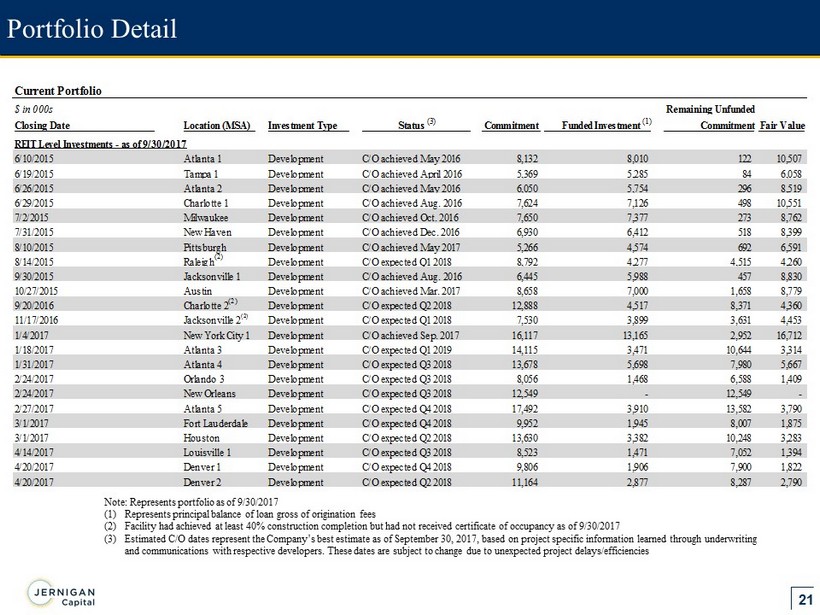
21 Portfolio Detail Note: Represents portfolio as of 9 /30/2017 (1) Represents principal balance of loan gross of origination fees (2) Facility had achieved at least 40% construction completion but had not received certificate of occupancy as of 9/30/2017 (3) Estimated C/O dates represent the Company’s best estimate as of September 30, 2017, based on project specific information learned through underwriting and communications with respective developers. These dates are subject to change due to unexpected project delays/efficiencies (1) Current Portfolio $ in 000s Remaining Unfunded Closing Date Location (MSA) Investment Type Status (3) Commitment Funded Investment (1) Commitment Fair Value REIT Level Investments - as of 9/30/2017 6/10/2015 Atlanta 1 Development C/O achieved May 2016 8,132 8,010 122 10,507 6/19/2015 Tampa 1 Development C/O achieved April 2016 5,369 5,285 84 6,058 6/26/2015 Atlanta 2 Development C/O achieved May 2016 6,050 5,754 296 8,519 6/29/2015 Charlotte 1 Development C/O achieved Aug. 2016 7,624 7,126 498 10,551 7/2/2015 Milwaukee Development C/O achieved Oct. 2016 7,650 7,377 273 8,762 7/31/2015 New Haven Development C/O achieved Dec. 2016 6,930 6,412 518 8,399 8/10/2015 Pittsburgh Development C/O achieved May 2017 5,266 4,574 692 6,591 8/14/2015 Raleigh (2) Development C/O expected Q1 2018 8,792 4,277 4,515 4,260 9/30/2015 Jacksonville 1 Development C/O achieved Aug. 2016 6,445 5,988 457 8,830 10/27/2015 Austin Development C/O achieved Mar. 2017 8,658 7,000 1,658 8,779 9/20/2016 Charlotte 2 (2) Development C/O expected Q2 2018 12,888 4,517 8,371 4,360 11/17/2016 Jacksonville 2 (2) Development C/O expected Q1 2018 7,530 3,899 3,631 4,453 1/4/2017 New York City 1 Development C/O achieved Sep. 2017 16,117 13,165 2,952 16,712 1/18/2017 Atlanta 3 Development C/O expected Q1 2019 14,115 3,471 10,644 3,314 1/31/2017 Atlanta 4 Development C/O expected Q3 2018 13,678 5,698 7,980 5,667 2/24/2017 Orlando 3 Development C/O expected Q3 2018 8,056 1,468 6,588 1,409 2/24/2017 New Orleans Development C/O expected Q3 2018 12,549 - 12,549 - 2/27/2017 Atlanta 5 Development C/O expected Q4 2018 17,492 3,910 13,582 3,790 3/1/2017 Fort Lauderdale Development C/O expected Q4 2018 9,952 1,945 8,007 1,875 3/1/2017 Houston Development C/O expected Q2 2018 13,630 3,382 10,248 3,283 4/14/2017 Louisville 1 Development C/O expected Q3 2018 8,523 1,471 7,052 1,394 4/20/2017 Denver 1 Development C/O expected Q4 2018 9,806 1,906 7,900 1,822 4/20/2017 Denver 2 Development C/O expected Q2 2018 11,164 2,877 8,287 2,790
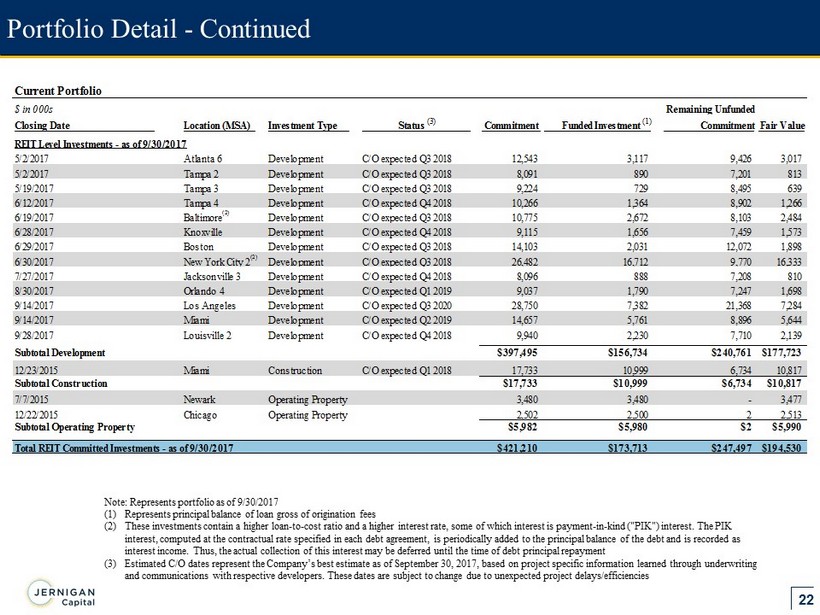
22 Portfolio Detail - Continued (1) Note: Represents portfolio as of 9/30/2017 (1) Represents principal balance of loan gross of origination fees (2) These investments contain a higher loan - to - cost ratio and a higher interest rate, some of which interest is payment - in - kind ("PI K") interest. The PIK interest, computed at the contractual rate specified in each debt agreement, is periodically added to the principal balance o f t he debt and is recorded as interest income. Thus, the actual collection of this interest may be deferred until the time of debt principal repayment (3) Estimated C/O dates represent the Company’s best estimate as of September 30, 2017, based on project specific information lea rne d through underwriting and communications with respective developers. These dates are subject to change due to unexpected project delays/efficiencie s Current Portfolio $ in 000s Remaining Unfunded Closing Date Location (MSA) Investment Type Status (3) Commitment Funded Investment (1) Commitment Fair Value REIT Level Investments - as of 9/30/2017 5/2/2017 Atlanta 6 Development C/O expected Q3 2018 12,543 3,117 9,426 3,017 5/2/2017 Tampa 2 Development C/O expected Q3 2018 8,091 890 7,201 813 5/19/2017 Tampa 3 Development C/O expected Q3 2018 9,224 729 8,495 639 6/12/2017 Tampa 4 Development C/O expected Q4 2018 10,266 1,364 8,902 1,266 6/19/2017 Baltimore (2) Development C/O expected Q3 2018 10,775 2,672 8,103 2,484 6/28/2017 Knoxville Development C/O expected Q4 2018 9,115 1,656 7,459 1,573 6/29/2017 Boston Development C/O expected Q3 2018 14,103 2,031 12,072 1,898 6/30/2017 New York City 2 (2) Development C/O expected Q3 2018 26,482 16,712 9,770 16,333 7/27/2017 Jacksonville 3 Development C/O expected Q4 2018 8,096 888 7,208 810 8/30/2017 Orlando 4 Development C/O expected Q1 2019 9,037 1,790 7,247 1,698 9/14/2017 Los Angeles Development C/O expected Q3 2020 28,750 7,382 21,368 7,284 9/14/2017 Miami Development C/O expected Q2 2019 14,657 5,761 8,896 5,644 9/28/2017 Louisville 2 Development C/O expected Q4 2018 9,940 2,230 7,710 2,139 Subtotal Development $397,495 $156,734 $240,761 $177,723 12/23/2015 Miami Construction C/O expected Q1 2018 17,733 10,999 6,734 10,817 Subtotal Construction $17,733 $10,999 $6,734 $10,817 7/7/2015 Newark Operating Property 3,480 3,480 - 3,477 12/22/2015 Chicago Operating Property 2,502 2,500 2 2,513 Subtotal Operating Property $5,982 $5,980 $2 $5,990 Total REIT Committed Investments - as of 9/30/2017 $421,210 $173,713 $247,497 $194,530

23 Portfolio Detail - Continued Note: Represents portfolio as of 9/30/2017 (1) Represents principal balance of loan gross of origination fees (2) Total represents portfolio as of 9/30/17 plus investments closed from 10/1/2017 - 11/10/2017 (3) Estimated C/O dates represent the Company’s best estimate as of September 30, 2017, based on project specific information lea rne d through underwriting and communications with respective developers. These dates are subject to change due to unexpected project delays/efficiencie s Current Portfolio $ in 000s Remaining Unfunded Closing Date Location (MSA) Investment Type Status (3) Size Funded Investment (1) Commitment Fair Value Heitman Joint Venture 5/14/2015 Miami 1 Development C/O expected Q1 2018 $13,867 $9,455 $4,412 $10,929 5/14/2015 Miami 2 Development C/O expected Q1 2018 14,849 8,486 6,363 8,947 9/25/2015 Fort Lauderdale Development C/O expected Q1 2018 13,230 7,298 5,932 7,796 4/15/2016 Washington DC Development C/O achieved Sep. 2017 17,269 14,346 2,923 15,937 4/29/2016 Atlanta 1 Development C/O expected Q1 2018 10,223 5,140 5,083 5,459 7/19/2016 Jacksonville Development C/O achieved Jul. 2017 8,127 6,989 1,138 10,541 7/21/2016 New Jersey Development C/O expected Q2 2018 7,828 1,621 6,207 1,561 8/15/2016 Atlanta 2 Development C/O achieved Sep. 2017 8,772 6,535 2,237 7,423 8/25/2016 Denver Development C/O expected Q4 2017 11,032 7,605 3,427 8,678 9/28/2016 Columbia Development C/O achieved Aug. 2017 9,199 7,651 1,548 8,525 12/22/2016 Raleigh Development C/O expected Q2 2018 8,877 2,431 6,446 2,398 Total Heitman JV Investments $123,273 $77,557 $45,716 $88,194 Total REIT + Heitman JV Committed Investments - as of 9/30/2017 $544,483 $251,270 $293,213 $282,724 Recent REIT Level Investments - Closed 9/30/17 - 11/10/17 10/12/2017 Fort Lauderdale 2 Development C/O expected Q1 2019 $9,459 NA NA NA 10/30/2017 New York City 3 Development C/O expected Q1 2019 14,701 NA NA NA Total Recent REIT Level Investments - Closed 9/30/17 - 11/10/17 $24,161 NA NA NA Total REIT + Heitman JV Committed Investments as of September 30, 2017 + Recent Committed Investments (2) $568,644 NA NA NA
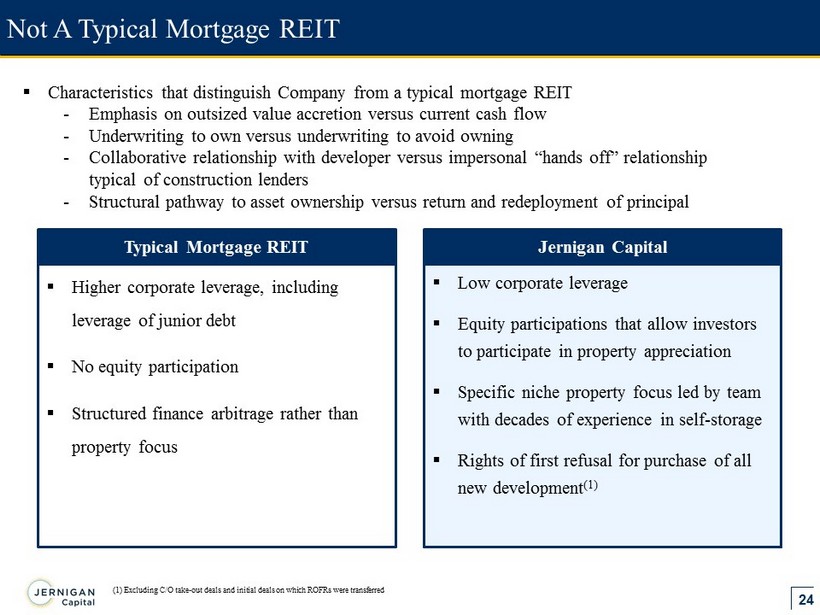
24 Not A Typical Mortgage REIT Typical Mortgage REIT ▪ Higher corporate leverage, including leverage of junior debt ▪ No equity participation ▪ Structured finance arbitrage rather than property focus Jernigan Capital ▪ Low corporate leverage ▪ Equity participations that allow investors to participate in property appreciation ▪ Specific niche property focus led by team with decades of experience in self - storage ▪ Rights of first refusal for purchase of all new development (1) ▪ Characteristics that distinguish Company from a typical mortgage REIT - Emphasis on outsized value accretion versus current cash flow - Underwriting to own versus underwriting to avoid owning - Collaborative relationship with developer versus impersonal “hands off” relationship typical of construction lenders - Structural pathway to asset ownership versus return and redeployment of principal (1) Excluding C/O take - out deals and initial deals on which ROFRs were transferred

25 ▪ Primary focus on programmatic self - storage development in top - tier markets ▪ Seek experienced developers looking for a reliable and fair capital partner – High character, financial stability and proven track record for picking great sites – Known to JCAP management – Loyalty High ROI Business Model Executed in Top Self - Storage Markets Providing Innovative Financing Solutions for the Self - Storage Industry Illustrative Development Property Investment Deve l op m ent Investments G r ound - up C onstruction Major R e d eve lopm e nt Attractive Risk - Adjusted Returns Through Equity Participations Note: Prior investments have included both stabilized property and construction loans (1) Leverage opportunity through secured credit facility $ 10.0 million Development Cost $ 9.0 million JCAP Investment (with ROFR) 6 year / 6.9% Interest Rate $ 1.0 million Developer Equity $ 5.4 million Leverage Opportunity (1) Leverage created for JCAP at Certificate of Occupancy typically at 30 - day LIBOR plus spread $ 3.6 million JCAP Net Implied Retained Interest JCAP Equity Participation 49.9% Cash flows, Refinancing, and Sale Proceeds ▪ 90% LTC ▪ 6 year term ▪ Equity participation ▪ 10 - 30% fund e d a t o r i g ination; b a l a n c e funded ov e r 9 - 16 months Primary Investment Strategy Typical Investment Terms
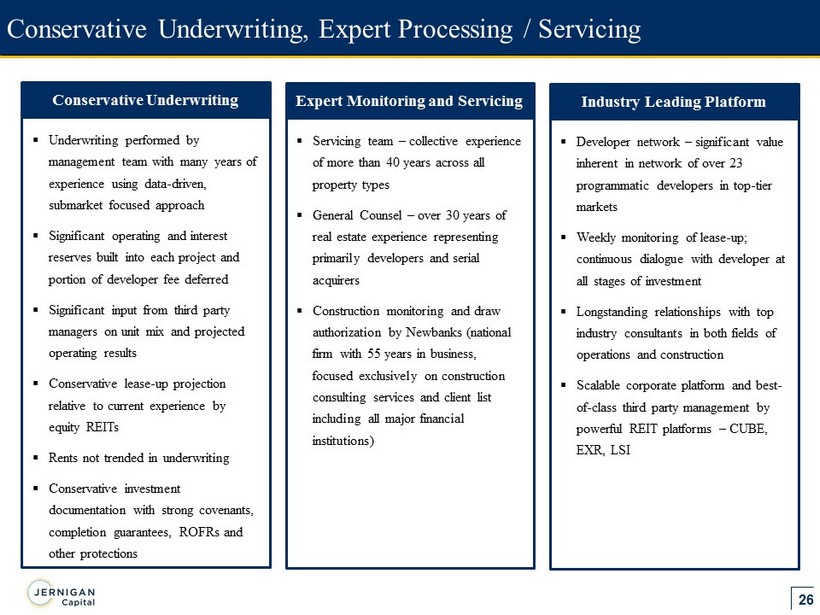
26 Conservative Underwriting, Expert Processing / Servicing ▪ Underwriting performed by management team with many years of experience using data - driven, submarket focused approach ▪ Significant operating and interest reserves built into each project and portion of developer fee deferred ▪ Significant input from third party managers on unit mix and projected operating results ▪ Conservative lease - up projection relative to current experience by equity REITs ▪ Rents not trended in underwriting ▪ Conservative investment documentation with strong covenants, completion guarantees, ROFRs and other protections Conservative Underwriting ▪ Servicing team – collective experience of more than 40 years across all property types ▪ General Counsel – over 30 years of real estate experience representing primarily developers and serial acquirers ▪ Construction monitoring and draw authorization by Newbanks (national firm with 55 years in business, focused exclusively on construction consulting services and client list including all major financial institutions ) Expert Monitoring and Servicing ▪ Developer network – significant value inherent in network of over 23 programmatic developers in top - tier markets ▪ Weekly monitoring of lease - up; continuous dialogue with developer at all stages of investment ▪ Longstanding relationships with top industry consultants in both fields of operations and construction ▪ Scalable corporate platform and best - of - class third party management by powerful REIT platforms – CUBE, EXR, LSI Industry Leading Platform
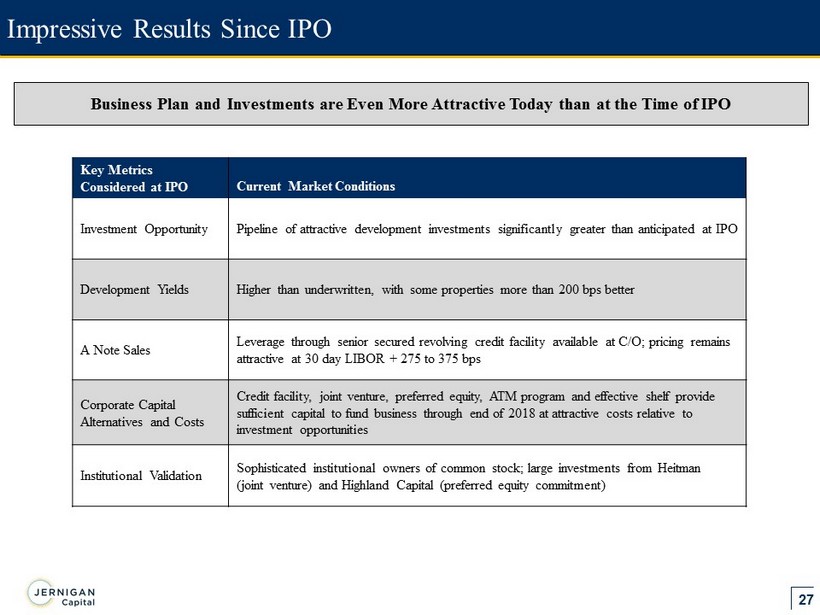
27 Business Plan and Investments are Even More Attractive Today than at the Time of IPO Impressive Results Since IPO Key Metrics Considered at IPO Current Market Conditions Investment Opportunity Pipeline of attractive development investments s ignificantly greater than anticipated at IPO Development Yields Higher than underwritten, with some properties more than 200 bps better A Note Sales Leverage through senior secured revolving credit facility available at C/O; pricing remains attractive at 30 day LIBOR + 275 to 375 bps Corporate Capital Alternatives and Costs Credit facility, joint venture, preferred equity, ATM program and effective shelf provide sufficient capital to fund business through end of 2018 at attractive costs relative to investment opportunities Institutional Validation Sophisticated institutional owners of common stock; large investments from Heitman (joint venture) and Highland Capital (preferred equity commitment)
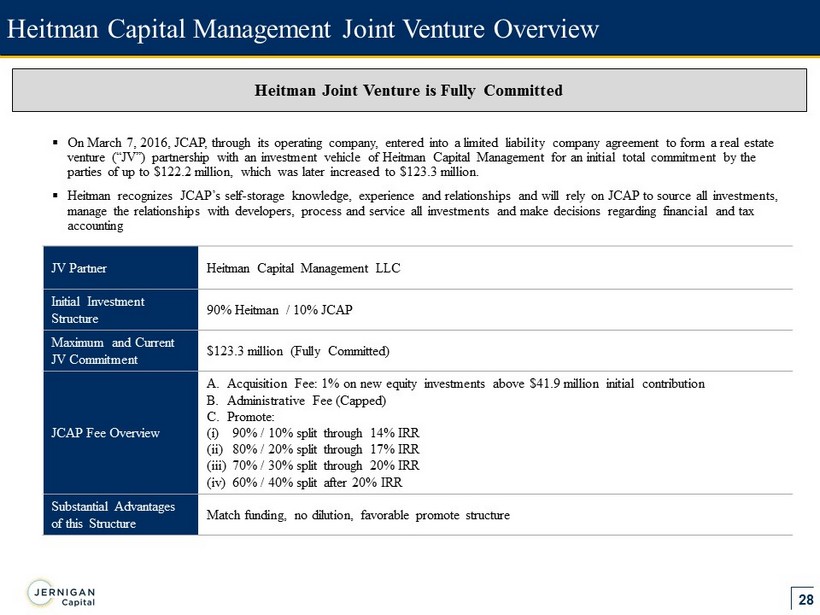
28 Heitman Capital Management Joint Venture Overview ▪ On March 7, 2016, JCAP, through its operating company, entered into a limited liability company agreement to form a real estate venture (“JV”) partnership with an investment vehicle of Heitman Capital Management for an initial total commitment by the parties of up to $122.2 million, which was later increased to $ 123.3 million. ▪ Heitman recognizes JCAP’s self - storage knowledge, experience and relationships and will rely on JCAP to source all investments, manage the relationships with developers, process and service all investments and make decisions regarding financial and tax accounting JV Partner Heitman Capital Management LLC Initial Investment Structure 90% Heitman / 10% JCAP Maximum and Current JV Commitment $123.3 million (Fully Committed) JCAP Fee Overview A. Acquisition Fee: 1% on new equity investments above $41.9 million initial contribution B. Administrative Fee (Capped) C. Promote: (i) 90% / 10% split through 14% IRR (ii) 80% / 20% split through 17% IRR (iii) 70% / 30% split through 20% IRR (iv) 60% / 40% split after 20% IRR Substantial Advantages of this Structure Match funding, no dilution, favorable promote structure Heitman Joint Venture is Fully Committed
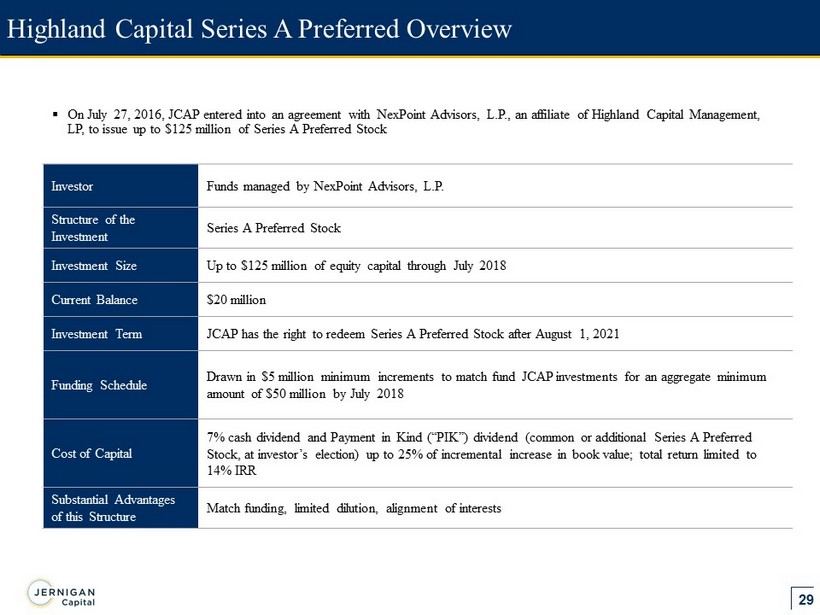
29 Highland Capital Series A Preferred Overview ▪ On July 27, 2016, JCAP entered into an agreement with NexPoint Advisors, L.P., an affiliate of Highland Capital Management, LP, to issue up to $125 million of Series A Preferred Stock Investor Funds managed by NexPoint Advisors, L.P. Structure of the Investment Series A Preferred Stock Investment Size Up to $125 million of equity capital through July 2018 Current Balance $20 million Investment Term JCAP has the right to redeem Series A Preferred Stock after August 1, 2021 Funding Schedule Drawn in $5 million minimum increments to match fund JCAP investments for an aggregate minimum amount of $50 million by July 2018 Cost of Capital 7% cash dividend and Payment in Kind (“PIK”) dividend (common or additional Series A P referred Stock, at investor’s election) up to 25% of incremental increase in book value; total return limited to 14% IRR Substantial Advantages of this Structure Match funding, limited dilution, alignment of interests
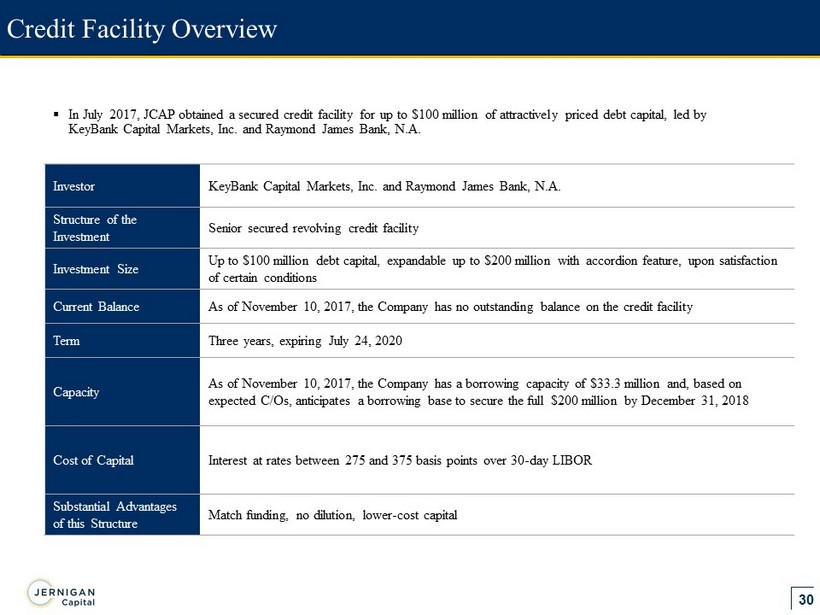
30 Credit Facility Overview Investor KeyBank Capital Markets, Inc. and Raymond James Bank, N.A. Structure of the Investment Senior secured revolving credit facility Investment Size Up to $100 million debt capital, e xpandable up to $200 million with accordion feature, upon satisfaction of certain conditions Current Balance As of November 10, 2017, the Company has no outstanding balance on the credit facility Term Three years, expiring July 24, 2020 Capacity As of November 10, 2017, the Company has a borrowing capacity of $33.3 million and, based on expected C/Os, anticipates a borrowing base to secure the full $200 million by December 31, 2018 Cost of Capital Interest at rates between 275 and 375 basis points over 30 - day LIBOR Substantial Advantages of this Structure Match funding, no dilution, lower - cost capital ▪ In July 2017, JCAP obtained a secured credit facility for up to $100 million of attractively priced debt capital, led by KeyBank Capital Markets, Inc. and Raymond James Bank, N.A.