Attached files
| file | filename |
|---|---|
| EX-32.1 - EX-32.1 - Corporate Capital Trust II | d488058dex321.htm |
| EX-31.2 - EX-31.2 - Corporate Capital Trust II | d488058dex312.htm |
| EX-31.1 - EX-31.1 - Corporate Capital Trust II | d488058dex311.htm |
Table of Contents
UNITED STATES
SECURITIES AND EXCHANGE COMMISSION
Washington, D.C. 20549
FORM 10-Q
| ☒ | QUARTERLY REPORT PURSUANT TO SECTION 13 OR 15 (d) OF THE SECURITIES EXCHANGE ACT OF 1934 |
For the quarterly period ended September 30, 2017
OR
| ☐ | TRANSITION REPORT PURSUANT TO SECTION 13 OR 15 (d) OF THE SECURITIES EXCHANGE ACT OF 1934 |
Commission file number: 814-01108
CORPORATE CAPITAL TRUST II
(Exact name of registrant as specified in its charter)
| Delaware | 47-1595504 | |
| (State or other jurisdiction of incorporation or organization) |
(I.R.S. Employer Identification No.) | |
| CNL Center at City Commons 450 South Orange Avenue Orlando, Florida |
32801 | |
| (Address of principal executive offices) | (Zip Code) | |
Registrant’s telephone number, including area code (866) 745-3797
Indicate by check mark whether the registrant (1) has filed all reports required to be filed by Section 13 or 15(d) of the Securities Exchange Act of 1934 during the preceding 12 months (or for such shorter period that the registrant was required to file such reports), and (2) has been subject to such filing requirements for the past 90 days. Yes ☒ No ☐
Indicate by check mark whether the registrant has submitted electronically and posted on its corporate Web site, if any, every Interactive Data File required to be submitted and posted pursuant to Rule 405 of Regulation S-T (§232.405 of this chapter) during the preceding 12 months (or for such shorter period that the registrant was required to submit and post such files). Yes ☐ No ☐
Indicate by check mark whether the registrant is a large accelerated filer, an accelerated filer, a non-accelerated filer, or a smaller reporting company. See the definitions of “large accelerated filer,” “accelerated filer,” “smaller reporting company,” and “emerging growth company” in Rule 12b-2 of the Exchange Act.
| Large accelerated filer | ☐ | Accelerated filer | ☐ | |||||
| Non-accelerated filer | ☒ Do not check if smaller reporting company | Smaller reporting company | ☐ | |||||
| Emerging growth company | ☐ | |||||||
If an emerging growth company, indicate by check mark if the registrant has elected not to use the extended transition period for complying with any new or revised financial accounting standards provided pursuant to Section 13(a) of the Exchange Act. ☐
Indicate by check mark whether the registrant is a shell company (as defined in Rule 12b-2 of the Exchange Act). Yes ☐ No ☒
The number of shares of common stock of the registrant outstanding as of November 8, 2017 was 12,236,307.
Table of Contents
INDEX
| PAGE | ||||||
| PART I. |
FINANCIAL INFORMATION |
|||||
| Item 1. |
||||||
| 2 | ||||||
| 3 | ||||||
| 4 | ||||||
| Condensed Statements of Cash Flows for the nine months ended September 30, 2017 and 2016 (unaudited) |
5 | |||||
| Condensed Schedules of Investments as of September 30, 2017 (unaudited) and December 31, 2016 |
6 | |||||
| 18 | ||||||
| Item 2. |
Management’s Discussion and Analysis of Financial Condition and Results of Operations |
37 | ||||
| Item 3. |
54 | |||||
| Item 4. |
55 | |||||
| Item 1. |
56 | |||||
| Item 1A. |
56 | |||||
| Item 2. |
56 | |||||
| Item 3. |
56 | |||||
| Item 4. |
56 | |||||
| Item 5. |
56 | |||||
| Item 6. |
56 | |||||
| 57 | ||||||
| 58 | ||||||
Table of Contents
| Item 1. | Financial Statements |
Condensed Statements of Assets and Liabilities
| September 30, 2017 | December 31, 2016 | |||||||
| (unaudited) | ||||||||
| Assets |
| |||||||
| Investment at fair value: |
||||||||
| Non-controlled, non-affiliated investments (amortized cost of $147,307,317 and $55,455,599, respectively) |
$ | 148,277,234 | $ | 56,192,783 | ||||
| Cash |
5,626,838 | 3,843,177 | ||||||
| Interest receivable |
1,351,538 | 332,207 | ||||||
| Receivable for investments sold |
1,805,377 | 2,562,122 | ||||||
| Principal receivable |
70,565 | 25,163 | ||||||
| Unrealized appreciation on foreign currency forward contracts |
77,173 | — | ||||||
| Receivable from advisors |
— | 281,497 | ||||||
| Prepaid expenses |
233,429 | 55,346 | ||||||
|
|
|
|
|
|||||
| Total assets |
157,442,154 | 63,292,295 | ||||||
|
|
|
|
|
|||||
| Liabilities |
| |||||||
| Revolving credit facility |
31,500,000 | — | ||||||
| Payable for investment purchased |
15,614,619 | 7,248,119 | ||||||
| Accrued performance-based incentive fees |
303,107 | 167,068 | ||||||
| Distributions payable |
— | 251,754 | ||||||
| Accrued trustees’ fees |
4,676 | 1,632 | ||||||
| Accrued distribution and shareholder servicing fees |
85,848 | 54,567 | ||||||
| Accrued professional services |
212,589 | 186,238 | ||||||
| Payable to advisors |
221,251 | — | ||||||
| Other accrued expenses and liabilities |
944,671 | 365,626 | ||||||
|
|
|
|
|
|||||
| Total liabilities |
48,886,761 | 8,275,004 | ||||||
|
|
|
|
|
|||||
| Commitments and contingencies (Note 11) |
||||||||
| Net Assets |
$ | 108,555,393 | $ | 55,017,291 | ||||
|
|
|
|
|
|||||
| Components of Net Assets |
| |||||||
| Preferred stock, $0.001 par value per share, 100,000,000 shares authorized and unissued at September 30, 2017 and December 31, 2016 |
$ | — | $ | — | ||||
| Common stock, $0.001 par value per share, 1,000,000,000 shares authorized, 11,767,474 and 5,944,203 shares issued and outstanding at September 30, 2017 and December 31, 2016, respectively |
11,767 | 5,944 | ||||||
| Paid-in capital in excess of par value |
108,575,786 | 54,258,832 | ||||||
| Undistributed (distributions in excess of) net investment income |
(1,043,710 | ) | 55,521 | |||||
| Accumulated net realized losses |
(35,568 | ) | (35,568 | ) | ||||
| Accumulated net unrealized appreciation on investments and foreign currency translation |
1,047,118 | 732,562 | ||||||
|
|
|
|
|
|||||
| Net assets |
$ | 108,555,393 | $ | 55,017,291 | ||||
|
|
|
|
|
|||||
| Net asset value per share |
$ | 9.23 | $ | 9.26 | ||||
|
|
|
|
|
|||||
See notes to condensed financial statements.
2
Table of Contents
Condensed Statements of Operations (unaudited)
| Three Months Ended September 30, |
Nine Months Ended September 30, |
|||||||||||||||
| 2017 | 2016 | 2017 | 2016 | |||||||||||||
| Investment income |
||||||||||||||||
| Interest income |
$ | 2,203,821 | $ | 326,873 | $ | 5,181,353 | $ | 438,244 | ||||||||
| Fee income |
338,544 | 4,770 | 384,685 | 5,917 | ||||||||||||
|
|
|
|
|
|
|
|
|
|||||||||
| Total investment income |
2,542,365 | 331,643 | 5,566,038 | 444,161 | ||||||||||||
|
|
|
|
|
|
|
|
|
|||||||||
| Operating expenses |
||||||||||||||||
| Investment advisory fees |
628,397 | 165,183 | 1,519,887 | 225,666 | ||||||||||||
| Professional services |
64,212 | 129,162 | 495,628 | 600,304 | ||||||||||||
| Administrative services |
327,037 | 127,974 | 719,875 | 268,582 | ||||||||||||
| Custodian and accounting fees |
89,623 | 48,977 | 243,262 | 113,568 | ||||||||||||
| Interest expense |
326,305 | — | 326,305 | — | ||||||||||||
| Trustee fees and expenses |
52,123 | 49,017 | 155,437 | 114,017 | ||||||||||||
| Organization expenses |
117,334 | — | 205,173 | — | ||||||||||||
| Insurance |
42,397 | 40,191 | 122,936 | 64,498 | ||||||||||||
| Performance-based incentive fees |
109,394 | 96,726 | 136,039 | 110,906 | ||||||||||||
| Distribution and shareholder servicing fees |
251,611 | 79,074 | 686,677 | 109,816 | ||||||||||||
| Offering expense |
91,280 | — | 91,280 | — | ||||||||||||
| Other |
50,126 | 43,080 | 174,910 | 60,954 | ||||||||||||
|
|
|
|
|
|
|
|
|
|||||||||
| Total operating expenses |
2,149,839 | 779,384 | 4,877,409 | 1,668,311 | ||||||||||||
| Expense support |
(606,252 | ) | (603,584 | ) | (1,866,650 | ) | (1,447,589 | ) | ||||||||
|
|
|
|
|
|
|
|
|
|||||||||
| Net operating expenses |
1,543,587 | 175,800 | 3,010,759 | 220,722 | ||||||||||||
|
|
|
|
|
|
|
|
|
|||||||||
| Net investment income |
998,778 | 155,843 | 2,555,279 | 223,439 | ||||||||||||
|
|
|
|
|
|
|
|
|
|||||||||
| Net realized and unrealized gains |
||||||||||||||||
| Net realized gains on: |
||||||||||||||||
| Non-controlled, non-affiliated transactions |
57,498 | 71,463 | 361,567 | 71,831 | ||||||||||||
| Foreign currency transactions |
2,989 | — | 5,778 | — | ||||||||||||
|
|
|
|
|
|
|
|
|
|||||||||
| Net realized gains |
60,487 | 71,463 | 367,345 | 71,831 | ||||||||||||
|
|
|
|
|
|
|
|
|
|||||||||
| Net change in unrealized appreciation on: |
||||||||||||||||
| Non-controlled, non-affiliated investments |
410,134 | 410,639 | 232,733 | 480,425 | ||||||||||||
| Foreign currency forward contracts |
77,173 | — | 77,173 | — | ||||||||||||
| Foreign currency translation |
(828 | ) | 2,274 | 4,650 | 2,274 | |||||||||||
|
|
|
|
|
|
|
|
|
|||||||||
| Net change in unrealized appreciation |
486,479 | 412,913 | 314,556 | 482,699 | ||||||||||||
|
|
|
|
|
|
|
|
|
|||||||||
| Net realized and unrealized gains |
546,966 | 484,376 | 681,901 | 554,530 | ||||||||||||
|
|
|
|
|
|
|
|
|
|||||||||
| Net increase in net assets resulting from operations |
$ | 1,545,744 | $ | 640,219 | $ | 3,237,180 | $ | 777,969 | ||||||||
|
|
|
|
|
|
|
|
|
|||||||||
| Net investment income per share |
$ | 0.09 | $ | 0.06 | $ | 0.28 | $ | 0.14 | ||||||||
|
|
|
|
|
|
|
|
|
|||||||||
| Diluted and basic earnings per share |
$ | 0.14 | $ | 0.23 | $ | 0.35 | $ | 0.47 | ||||||||
|
|
|
|
|
|
|
|
|
|||||||||
| Weighted average number of shares of common stock outstanding (basic and diluted) |
11,024,578 | 2,756,657 | 9,231,778 | 1,646,189 | ||||||||||||
|
|
|
|
|
|
|
|
|
|||||||||
| Distributions declared per share |
$ | 0.15 | $ | 0.14 | $ | 0.44 | $ | 0.34 | ||||||||
|
|
|
|
|
|
|
|
|
|||||||||
See notes to condensed financial statements.
3
Table of Contents
Condensed Statements of Changes in Net Assets (unaudited)
| Nine Months Ended September 30, |
||||||||
| 2017 | 2016 | |||||||
| Operations |
||||||||
| Net investment income |
$ | 2,555,279 | $ | 223,439 | ||||
| Net realized gains on investments and foreign currency transactions |
367,345 | 71,831 | ||||||
| Net change in unrealized appreciation on investments, foreign currency |
314,556 | 482,699 | ||||||
|
|
|
|
|
|||||
| Net increase in net assets resulting from operations |
3,237,180 | 777,969 | ||||||
|
|
|
|
|
|||||
| Distributions to shareholders from |
||||||||
| Net investment income |
(2,555,279 | ) | (223,439 | ) | ||||
| Net realized gains |
(367,345 | ) | (71,831 | ) | ||||
| Distributions in excess of net investment income (Note 7) |
(1,099,231 | ) | (245,521 | ) | ||||
|
|
|
|
|
|||||
| Net decrease in net assets resulting from shareholders’ distributions |
(4,021,855 | ) | (540,791 | ) | ||||
|
|
|
|
|
|||||
| Capital share transactions |
||||||||
| Issuance of shares of common stock |
52,231,322 | 34,451,942 | ||||||
| Reinvestment of shareholders’ distributions |
2,091,455 | 183,613 | ||||||
|
|
|
|
|
|||||
| Net increase in net assets resulting from capital share transactions |
54,322,777 | 34,635,555 | ||||||
|
|
|
|
|
|||||
| Total increase in net assets |
53,538,102 | 34,872,733 | ||||||
| Net assets at beginning of period |
55,017,291 | 202,000 | ||||||
|
|
|
|
|
|||||
| Net assets at end of period |
$ | 108,555,393 | $ | 35,074,733 | ||||
|
|
|
|
|
|||||
| Capital share activity |
||||||||
| Shares issued from subscriptions |
5,599,058 | 3,781,001 | ||||||
| Shares issued from reinvestment of distributions |
224,213 | 20,021 | ||||||
|
|
|
|
|
|||||
| Net increase in shares outstanding |
5,823,271 | 3,801,022 | ||||||
|
|
|
|
|
|||||
| Distributions in excess of net investment income at end of period |
$ | (1,043,710 | ) | $ | (245,521 | ) | ||
|
|
|
|
|
|||||
See notes to condensed financial statements.
4
Table of Contents
Condensed Statements of Cash Flows (unaudited)
| Nine Months Ended September 30, |
||||||||
| 2017 | 2016 | |||||||
| Operating Activities: |
||||||||
| Net increase in net assets resulting from operations |
$ | 3,237,180 | $ | 777,969 | ||||
| Adjustments to reconcile net increase in net assets resulting from operations |
||||||||
| Purchases of investments |
(145,852,978 | ) | (32,768,960 | ) | ||||
| Increase in payable for investments purchased |
8,366,500 | 16,480,488 | ||||||
| Proceeds from sales of investments |
41,656,887 | 1,470,350 | ||||||
| Proceeds from principal payments |
13,327,631 | 113,571 | ||||||
| Net realized gain on investments |
(361,567 | ) | (71,831 | ) | ||||
| Net change in unrealized appreciation on investments |
(232,733 | ) | (480,425 | ) | ||||
| Net change in unrealized appreciation on foreign currency forward contracts |
(77,173 | ) | — | |||||
| Net change in unrealized appreciation on foreign currency translation |
(4,650 | ) | (2,274 | ) | ||||
| Amortization of premium/discount – net |
(621,692 | ) | (104,529 | ) | ||||
| Amortization of deferred financing cost |
22,529 | — | ||||||
| Decrease (increase) in receivable for investments sold |
761,349 | (749,310 | ) | |||||
| Increase in principal receivable |
(45,356 | ) | (18,634 | ) | ||||
| Decrease (increase) in receivable from advisors |
281,497 | (225,073 | ) | |||||
| Increase in interest receivable |
(1,019,331 | ) | (114,657 | ) | ||||
| Increase in prepaid expenses |
(59,315 | ) | (95,577 | ) | ||||
| Increase in payable to advisors |
214,615 | — | ||||||
| Increase in accrued professional services |
26,351 | — | ||||||
| Increase in accrued performance-based incentive fees |
136,039 | 110,906 | ||||||
| Increase in accrued distribution and shareholder servicing fees |
31,281 | 32,578 | ||||||
| Increase in accrued trustees’ fees |
3,044 | 5,284 | ||||||
| Increase in other accrued expenses and liabilities |
585,681 | 562,568 | ||||||
|
|
|
|
|
|||||
| Net cash used in operating activities |
(79,624,211 | ) | (15,077,556 | ) | ||||
|
|
|
|
|
|||||
| Financing Activities: |
||||||||
| Proceeds from issuance of shares of common stock |
52,231,322 | 34,451,942 | ||||||
| Borrowings under revolving credit facility |
31,500,000 | — | ||||||
| Distributions paid |
(2,182,154 | ) | (357,178 | ) | ||||
| Deferred financing costs |
(141,296 | ) | — | |||||
|
|
|
|
|
|||||
| Net cash provided by financing activities |
81,407,872 | 34,094,764 | ||||||
|
|
|
|
|
|||||
| Net increase in cash |
1,783,661 | 19,017,208 | ||||||
| Cash, beginning of period |
3,843,177 | 202,000 | ||||||
|
|
|
|
|
|||||
| Cash, end of period |
$ | 5,626,838 | $ | 19,219,208 | ||||
|
|
|
|
|
|||||
| Supplemental disclosure of cash flow information and non-cash financing activities: |
||||||||
| Distribution reinvested |
$ | 2,091,455 | $ | 183,613 | ||||
|
|
|
|
|
|||||
| Excise taxes paid |
$ | 6,107 | $ | — | ||||
|
|
|
|
|
|||||
See notes to condensed financial statements.
5
Table of Contents
Corporate Capital Trust II
Condensed Schedule of Investments (unaudited)
As of September 30, 2017
| Company (a)(b) |
Footnotes | Industry |
Interest Rate |
Base Rate Floor |
Maturity Date |
No. Shares/ Principal Amount (c) |
Cost (d) | Fair Value | ||||||||||||||||||||||
| First Lien Senior Secured Loan—82.6% |
||||||||||||||||||||||||||||||
| ABB CONCISE Optical Group, LLC |
(1) | Retailing |
L + 500 | 1.00 | % | 6/15/2023 | $ | 511,008 | $ | 509,579 | $ | 512,286 | ||||||||||||||||||
| ABILITY Network, Inc. |
(2) | Health Care Equipment & Services |
L + 500 | 1.00 | % | 5/14/2021 | 200,711 | 197,599 | 202,343 | |||||||||||||||||||||
| Accuride Corp. |
(1) | Capital Goods |
L + 700 | 1.00 | % | 11/17/2023 | 2,097,251 | 2,070,447 | 2,131,331 | |||||||||||||||||||||
| Acosta Holdco, Inc. |
(2) | Commercial & Professional Services |
L + 325 | 1.00 | % | 9/26/2021 | 2,761,380 | 2,500,570 | 2,454,176 | |||||||||||||||||||||
| Advantage Sales & Marketing, Inc. |
(2) | Commercial & Professional Services |
L + 325 | 1.00 | % | 7/23/2021 | 617,648 | 589,679 | 583,681 | |||||||||||||||||||||
| BakerCorp International, Inc. |
(e)(1) | Capital Goods |
L + 300 | 1.25 | % | 2/7/2020 | 4,576,973 | 4,416,089 | 4,430,510 | |||||||||||||||||||||
| Bay Club, Co. |
(2) | Consumer Services |
L + 650 | 1.00 | % | 8/31/2022 | 2,229,946 | 2,199,525 | 2,263,395 | |||||||||||||||||||||
| Belk, Inc. |
(1) | Retailing |
L + 475 | 1.00 | % | 12/12/2022 | 4,959,569 | 4,421,970 | 4,173,353 | |||||||||||||||||||||
| Commercial Barge Line, Co. |
(2) | Transportation |
L + 875 | 1.00 | % | 11/12/2020 | 534,793 | 511,043 | 426,498 | |||||||||||||||||||||
| David’s Bridal, Inc. |
(1) | Retailing |
L + 400 | 1.25 | % | 10/11/2019 | 398,233 | 376,958 | 314,803 | |||||||||||||||||||||
| DigiCert, Inc. |
(e)(1) | Software & Services |
L + 475 | 1.00 | % | 9/20/2024 | 1,975,230 | 1,965,354 | 1,997,451 | |||||||||||||||||||||
| Distribution International, Inc. |
(1) | Retailing |
L + 500 | 1.00 | % | 12/15/2021 | 7,162,993 | 6,173,253 | 6,169,128 | |||||||||||||||||||||
| FleetPride Corp. |
(e)(1) | Capital Goods |
L + 400 | 1.25 | % | 11/19/2019 | 3,982,759 | 3,780,408 | 3,938,789 | |||||||||||||||||||||
| Foresight Energy, LLC |
(e)(f)(1) | Materials |
L + 575 | 1.00 | % | 3/17/2022 | 3,684,829 | 3,545,777 | 3,459,152 | |||||||||||||||||||||
| Frontline Technologies Group, LLC |
(g)(1) | Software & Services |
L + 650 | 1.00 | % | 9/18/2023 | 4,535,549 | 4,454,514 | 4,453,905 | |||||||||||||||||||||
| Intelsat S.A. (LUX) |
(f)(h)(1) | Media |
L + 275 | 1.00 | % | 6/30/2019 | 3,105,790 | 3,095,711 | 3,100,277 | |||||||||||||||||||||
| JC Penney Corp., Inc. |
(f)(1) | Retailing |
L + 425 | 1.00 | % | 6/23/2023 | 1,029,812 | 1,022,317 | 1,004,067 | |||||||||||||||||||||
| Jo-Ann Stores, Inc. |
(3) | Retailing |
L + 500 | 1.00 | % | 10/20/2023 | 3,506,107 | 3,475,120 | 3,361,480 | |||||||||||||||||||||
See notes to condensed financial statements.
6
Table of Contents
Corporate Capital Trust II
Condensed Schedule of Investments (unaudited) (continued)
As of September 30, 2017
| Company (a)(b) |
Footnotes | Industry |
Interest Rate |
Base Rate Floor |
Maturity Date |
No. Shares/ Principal Amount (c) |
Cost (d) | Fair Value | ||||||||||||||||||||
| Koosharem, LLC |
(1) | Commercial & Professional Services |
L + 650 | 1.00 | % | 5/15/2020 | $ | 2,501,247 | $ | 2,280,038 | $ | 2,390,567 | ||||||||||||||||
| MedAssets, Inc. |
(2) | Health Care Equipment & Services |
L + 450 | 1.00 | % | 10/20/2022 | 71,535 | 72,004 | 71,847 | |||||||||||||||||||
| Monitronics International, Inc. |
(e)(1) | Commercial & Professional Services |
L + 550 | 1.00 | % | 9/30/2022 | 2,032,307 | 1,990,772 | 2,021,637 | |||||||||||||||||||
| NCI, Inc. |
(g)(1) | Software & Services |
L + 750 | 1.00 | % | 8/15/2024 | 4,341,240 | 4,287,920 | 4,292,141 | |||||||||||||||||||
| Netsmart Technologies, Inc. |
(1) | Health Care Equipment & Services |
L + 450 | 1.00 | % | 4/19/2023 | 81,015 | 80,836 | 82,128 | |||||||||||||||||||
| P2 Energy Solutions, Inc. |
(f)(1) | Software & Services |
L + 400 | 1.00 | % | 10/30/2020 | 3,317,070 | 3,240,323 | 3,238,289 | |||||||||||||||||||
| Paradigm Acquisition Corp. |
(1) | Health Care Equipment & Services |
L + 500 | 1.00 | % | 6/2/2022 | 1,481,061 | 1,481,061 | 1,488,466 | |||||||||||||||||||
| Polyconcept North America, Inc. |
(2) | Consumer Durables & Apparel |
L + 475 | 1.00 | % | 8/16/2023 | 332,518 | 329,703 | 334,182 | |||||||||||||||||||
| Quorum Health Corp. |
(2) | Health Care Equipment & Services |
L + 675 | 1.00 | % | 4/29/2022 | 4,679,096 | 4,665,413 | 4,752,206 | |||||||||||||||||||
| Savers, Inc. |
(1) | Retailing |
L + 375 | 1.25 | % | 7/9/2019 | 1,076,501 | 993,480 | 1,011,104 | |||||||||||||||||||
| Sequa Corp. |
(1) | Materials |
L + 550 | 1.00 | % | 11/28/2021 | 1,549,365 | 1,561,686 | 1,563,170 | |||||||||||||||||||
| SIRVA Worldwide, Inc. |
(1) | Commercial & Professional Services |
L + 650 | 1.00 | % | 11/22/2022 | 2,132,436 | 2,084,419 | 2,153,760 | |||||||||||||||||||
| SMART Global Holdings, Inc. |
(f)(g)(4) | Semiconductors & Semiconductor Equipment |
P + 400 | 0.00 | % | 8/9/2022 | 77,170 | 77,171 | 66,776 | |||||||||||||||||||
| (f)(g)(1) | L + 625 | 1.00 | % | 8/9/2022 | 3,344,953 | 3,279,873 | 3,275,699 | |||||||||||||||||||||
| Staples Canada, Inc. (CAN) |
(f)(g)(h)(5)(CAD) | Retailing |
CDOR + 700 | 1.00 | % | 7/2/2023 | C$ | 5,688,847 | 4,605,176 | 4,468,099 | ||||||||||||||||||
| Sutherland Global Services, Inc. |
(f)(1) | Software & Services |
L + 537.5 | 1.00 | % | 4/23/2021 | $ | 3,054,550 | 2,970,412 | 2,937,469 | ||||||||||||||||||
| (f)(1) | L + 537.5 | 1.00 | % | 4/23/2021 | 711,030 | 691,445 | 683,776 | |||||||||||||||||||||
| Talbots, Inc. |
(2) | Retailing |
L + 450 | 1.00 | % | 3/19/2020 | 1,689,980 | 1,591,601 | 1,639,281 | |||||||||||||||||||
| TruGreen, LP |
(2) | Consumer Services |
L + 400 | 1.00 | % | 4/13/2023 | 1,577,258 | 1,592,961 | 1,598,945 | |||||||||||||||||||
| TTM Technologies, Inc. |
(e)(f)(1) | Technology Hardware & Equipment |
L + 250 | 0.00 | % | 9/13/2024 | 9,118 | 9,072 | 9,181 | |||||||||||||||||||
See notes to condensed financial statements.
7
Table of Contents
Corporate Capital Trust II
Condensed Schedule of Investments (unaudited) (continued)
As of September 30, 2017
| Company (a)(b) |
Footnotes | Industry |
Interest Rate |
Base Rate Floor |
Maturity Date |
No. Shares/ Principal Amount (c) |
Cost (d) | Fair Value | ||||||||||||||||||||
| Utility One Source, LP |
(2) | Capital Goods |
L + 550 | 1.00 | % | 4/7/2023 | $ | 3,313,585 | $ | 3,294,344 | $ | 3,404,709 | ||||||||||||||||
| Vencore, Inc. (fka SI Organization, Inc.) |
(1) | Capital Goods |
L + 475 | 1.00 | % | 11/23/2019 | 598,816 | 598,845 | 605,178 | |||||||||||||||||||
| Vertafore, Inc. |
(2) | Software & Services |
L + 325 | 1.00 | % | 6/30/2023 | 139,531 | 138,904 | 140,229 | |||||||||||||||||||
| Wheels Up Partners, LLC |
(g)(2) | Transportation |
L + 710 | 1.00 | % | 8/1/2024 | 1,378,125 | 1,366,627 | 1,364,633 | |||||||||||||||||||
| (g)(1) | L + 710 | 1.00 | % | 11/1/2024 | 551,461 | 545,958 | 545,958 | |||||||||||||||||||||
| WireCo WorldGroup, Inc. |
(1) | Capital Goods |
L + 550 | 1.00 | % | 9/29/2023 | 559,241 | 558,379 | 566,408 | |||||||||||||||||||
|
|
|
|
|
|||||||||||||||||||||||||
| Total First Lien Senior Secured Loan |
$ | 89,694,336 | $ | 89,682,463 | ||||||||||||||||||||||||
|
|
|
|
|
|||||||||||||||||||||||||
| Second Lien Senior Secured Loan—23.9% |
||||||||||||||||||||||||||||
| Albany Molecular Research, Inc. |
(1) | Pharmaceuticals, Biotechnology & Life Sciences |
L + 700 | 1.00 | % | 8/28/2025 | $ | 913,260 | $ | 908,740 | $ | 928,100 | ||||||||||||||||
| Applied Systems, Inc. |
(e)(1) | Software & Services |
L + 700 | 1.00 | % | 9/12/2025 | 2,623,620 | 2,623,620 | 2,713,807 | |||||||||||||||||||
| Arclin, Inc. |
(1) | Materials |
L + 875 | 1.00 | % | 2/9/2025 | 424,480 | 420,468 | 430,317 | |||||||||||||||||||
| BJ’s Wholesale Club, Inc. |
(2) | Food & Staples Retailing |
L + 750 | 1.00 | % | 1/27/2025 | 949,470 | 940,525 | 910,067 | |||||||||||||||||||
| CTI Foods Holding Co., LLC |
(2) | Food, Beverage & Tobacco |
L + 725 | 1.00 | % | 6/28/2021 | 222,222 | 207,053 | 180,833 | |||||||||||||||||||
| FleetPride Corp. |
(1) | Capital Goods |
L + 800 | 1.25 | % | 5/19/2020 | 852,944 | 768,688 | 825,931 | |||||||||||||||||||
| Genoa, a QoL Healthcare Co., LLC |
(2) | Health Care Equipment & Services |
L + 800 | 1.00 | % | 10/28/2024 | 352,940 | 353,674 | 362,646 | |||||||||||||||||||
| Grocery Outlet, Inc. |
(1) | Food & Staples Retailing |
L + 825 | 1.00 | % | 10/21/2022 | 198,393 | 185,473 | 200,130 | |||||||||||||||||||
| iParadigms Holdings, LLC |
(1) | Software & Services |
L + 725 | 1.00 | % | 7/29/2022 | 189,244 | 184,794 | 184,749 | |||||||||||||||||||
| Misys, Ltd. (GBR) |
(f)(h)(1) | Software & Services |
L + 725 | 1.00 | % | 6/13/2025 | 2,813,780 | 2,825,606 | 2,871,561 | |||||||||||||||||||
| NEP Group, Inc. |
(2) | Media |
L + 700 | 1.00 | % | 1/23/2023 | 239,379 | 229,488 | 241,623 | |||||||||||||||||||
| Neustar, Inc. |
(e)(1) | Software & Services |
L + 800 | 1.00 | % | 8/8/2025 | 1,807,220 | 1,780,112 | 1,834,328 | |||||||||||||||||||
See notes to condensed financial statements.
8
Table of Contents
Corporate Capital Trust II
Condensed Schedule of Investments (unaudited) (continued)
As of September 30, 2017
| Company (a)(b) |
Footnotes | Industry |
Interest Rate |
Base Rate Floor |
Maturity Date |
No. Shares/ Principal Amount (c) |
Cost (d) | Fair Value | ||||||||||||||||||||
| Polyconcept North America, Inc. |
(2)(g) | Consumer Durables & Apparel |
L + 1000 | 1.00 | % | 2/16/2024 | $ | 624,235 | $ | 610,761 | $ | 637,590 | ||||||||||||||||
| Press Ganey Holdings, Inc. |
(2) | Health Care Equipment & Services |
L + 725 | 1.00 | % | 10/21/2024 | 2,024,940 | 2,051,597 | 2,065,439 | |||||||||||||||||||
| Sequa Corp. |
(e)(1) | Materials |
L + 900 | 1.00 | % | 4/28/2022 | 3,467,560 | 3,509,205 | 3,564,010 | |||||||||||||||||||
| Sparta Systems, Inc. |
(g)(1) | Software & Services |
L + 825 | 1.00 | % | 7/27/2025 | 2,437,540 | 2,401,466 | 2,378,639 | |||||||||||||||||||
| SRS Distribution, Inc. |
(e)(2) | Capital Goods |
L + 875 | 1.00 | % | 2/24/2023 | 2,755,948 | 2,768,906 | 2,835,182 | |||||||||||||||||||
| Sungard Public Sector, LLC |
(g)(1) | Software & Services |
L + 850 | 1.00 | % | 1/30/2025 | 654,480 | 648,324 | 655,972 | |||||||||||||||||||
| Vencore, Inc. (fka SI Organization, Inc.) |
(1) | Capital Goods |
L + 875 | 1.00 | % | 5/23/2020 | 460,504 | 455,152 | 464,821 | |||||||||||||||||||
| WireCo WorldGroup, Inc. |
(1) | Capital Goods |
L + 900 | 1.00 | % | 9/30/2024 | 1,632,350 | 1,627,143 | 1,646,127 | |||||||||||||||||||
|
|
|
|
|
|||||||||||||||||||||||||
| Total Second Lien Senior Secured Loan |
$ | 25,500,795 | $ | 25,931,872 | ||||||||||||||||||||||||
|
|
|
|
|
|||||||||||||||||||||||||
| Other Senior Secured Debt—3.3% | ||||||||||||||||||||||||||||
| Avantor, Inc. |
(e)(i) | Pharmaceuticals, Biotechnology & Life Sciences |
6.00 | % | 10/1/2024 | $ | 776,000 | $ | 776,000 | $ | 794,430 | |||||||||||||||||
| Cornerstone Chemical Co. |
(i) | Materials |
6.75 | % | 8/15/2024 | 2,682,000 | 2,686,516 | 2,675,295 | ||||||||||||||||||||
| DJO Finance, LLC |
(i) | Health Care Equipment & Services |
8.13 | % | 6/15/2021 | 82,000 | 78,105 | 78,515 | ||||||||||||||||||||
|
|
|
|
|
|||||||||||||||||||||||||
| Total Other Senior Secured Debt |
$ | 3,540,621 | $ | 3,548,240 | ||||||||||||||||||||||||
|
|
|
|
|
|||||||||||||||||||||||||
| Total Senior Debt |
$ | 118,735,752 | $ | 119,162,575 | ||||||||||||||||||||||||
|
|
|
|
|
|||||||||||||||||||||||||
| Subordinated Debt—24.2% | ||||||||||||||||||||||||||||
| Allegheny Technologies, Inc. |
(f) | Materials |
7.88 | % | 8/15/2023 | $ | 4,350,000 | $ | 4,342,590 | $ | 4,714,312 | |||||||||||||||||
| Cincinnati Bell, Inc. |
(f)(i)(e) | Telecommunication Services |
8.00 | % | 10/15/2025 | 587,000 | 587,000 | 589,935 | ||||||||||||||||||||
| Clear Channel International BV (NLD) |
(h)(i)(f) | Media |
8.75 | % | 12/15/2020 | 3,779,000 | 3,924,925 | 3,967,950 | ||||||||||||||||||||
| ClubCorp Club Operations, Inc. |
(i) | Consumer Services |
8.50 | % | 9/15/2025 | 4,140,000 | 4,084,360 | 4,067,550 | ||||||||||||||||||||
| Intelsat S.A. (LUX) |
(f)(h) | Media |
7.25 | % | 10/15/2020 | 1,334,000 | 1,272,837 | 1,283,975 | ||||||||||||||||||||
See notes to condensed financial statements.
9
Table of Contents
Corporate Capital Trust II
Condensed Schedule of Investments (unaudited) (continued)
As of September 30, 2017
| Company (a)(b) |
Footnotes | Industry |
Interest Rate |
Base Rate Floor |
Maturity Date |
No. Shares/ Principal Amount (c) |
Cost (d) | Fair Value | ||||||||||||||||||||||
| Kenan Advantage Group, Inc. |
(i) | Transportation |
7.88 | % | 7/31/2023 | $ | 2,620,000 | $ | 2,725,064 | $ | 2,692,050 | |||||||||||||||||||
| Pactiv, LLC |
Materials |
7.95 | % | 12/15/2025 | 849,000 | 939,711 | 955,125 | |||||||||||||||||||||||
| 8.38 | % | 4/15/2027 | 2,653,000 | 2,971,460 | 3,024,420 | |||||||||||||||||||||||||
| Solera Holdings, Inc. |
(f)(i) | Software & Services |
10.50 | % | 3/1/2024 | 1,849,000 | 2,097,617 | 2,104,994 | ||||||||||||||||||||||
| Tenet Healthcare Corp. |
(f) | Health Care Equipment & Services |
6.75 | % | 6/15/2023 | 841,000 | 832,941 | 806,309 | ||||||||||||||||||||||
| (f)(i) | 7.00 | % | 8/1/2025 | 31,000 | 30,696 | 29,140 | ||||||||||||||||||||||||
| Triumph Group, Inc. |
(f)(i) | Capital Goods |
7.75 | % | 8/15/2025 | 1,360,000 | 1,360,000 | 1,431,400 | ||||||||||||||||||||||
| Vertiv Group Corp. |
(i) | Technology Hardware & Equipment |
9.25 | % | 10/15/2024 | 508,000 | 551,806 | 571,500 | ||||||||||||||||||||||
|
|
|
|
|
|||||||||||||||||||||||||||
| Total Subordinated Debt |
$ | 25,721,007 | $ | 26,238,660 | ||||||||||||||||||||||||||
|
|
|
|
|
|||||||||||||||||||||||||||
| Equity/Other—2.6% |
||||||||||||||||||||||||||||||
| Misys, Ltd. (CYM), Perpetual Preferred Equity |
(h)(j)(f)(g) | Software & Services |
L + 1025 | 1.00 | % | 2,841 | $ | 2,788,134 | $ | 2,821,178 | ||||||||||||||||||||
| Polyconcept North America, Inc., Membership Units |
(g)* | Consumer Durables & Apparel |
624 | 62,424 | 54,821 | |||||||||||||||||||||||||
|
|
|
|
|
|||||||||||||||||||||||||||
| Total Equity/Other |
$ | 2,850,558 | $ | 2,875,999 | ||||||||||||||||||||||||||
|
|
|
|
|
|||||||||||||||||||||||||||
| TOTAL INVESTMENTS — 136.6%(k) |
$ | 147,307,317 | $ | 148,277,234 | ||||||||||||||||||||||||||
|
|
|
|
|
|||||||||||||||||||||||||||
| OTHER ASSETS IN EXCESS OF LIABILITIES—(36.6%) |
(39,721,841 | ) | ||||||||||||||||||||||||||||
|
|
|
|||||||||||||||||||||||||||||
| NET ASSETS—100.0% |
$ | 108,555,393 | ||||||||||||||||||||||||||||
|
|
|
|||||||||||||||||||||||||||||
| (a) | Security may be an obligation of one or more entities affiliated with the named company. |
| (b) | Non-controlled/non-affiliated investments as defined by the Investment Company Act of 1940, as amended (“1940 Act”), unless otherwise indicated. Non-controlled/non-affiliated investments are investments that are neither controlled investments nor affiliated investments. |
| (c) | Denominated in U.S. dollars unless otherwise noted. |
| (d) | Represents amortized cost for debt securities and cost for equity investments translated to U.S. dollars. |
See notes to condensed financial statements.
10
Table of Contents
Corporate Capital Trust II
Condensed Schedule of Investments (unaudited) (continued)
As of September 30, 2017
| (e) | Position or portion thereof unsettled as of September 30, 2017. |
| (f) | The investment is not a qualifying asset as defined in Section 55(a) under the 1940 Act. A business development company may not acquire any asset other than qualifying assets, unless, at the time the acquisition is made, qualifying assets represent at least 70% of the company’s total assets. As of September 30, 2017, 71.3% of the Company’s total assets represented qualifying assets. |
| (g) | Investments classified as Level 3 whereby fair value was determined by the Company’s Board of Trustees (see Note 2). |
| (h) | A portfolio company domiciled in a foreign country. The jurisdiction of the security issuer may be a different country than the domicile of the portfolio company. |
| (i) | This security was acquired in a transaction that was exempt from the registration requirements of the Securities Act of 1933, as amended (the “Securities Act”), pursuant to Rule 144A thereunder. This security may be resold only in transactions that are exempt from the registration requirements of the Securities Act, normally to qualified institutional buyers. |
| (j) | The issue of this security may elect at any time to capitalize distributions. |
| (k) | As of September 30, 2017, the aggregate gross unrealized appreciation for all securities in which there was an excess of value over tax cost was $2,014,271; the aggregate gross unrealized depreciation for all securities in which there was an excess of tax cost over value was $1,044,354; the net unrealized appreciation was $969,917; the aggregate cost of securities for Federal income tax purposes was $147,307,317. |
| (1) | The interest rate on these investments is subject to a base rate of 3-Month LIBOR, which at September 30, 2017 was 1.33%. The current base rate for each investment may be different from the reference rate on September 30, 2017. |
| (2) | The interest rate on these investments is subject to a base rate of 1-Month LIBOR, which at September 30, 2017 was 1.23%. The current base rate for each investment may be different from the reference rate on September 30, 2017. |
| (3) | The interest rate on these investments is subject to a base rate of 6-Month LIBOR, which at September 30, 2017 was 1.51%. The current base rate for each investment may be different from the reference rate on September 30, 2017. |
| (4) | The interest rate on these investments is subject to a base rate of the PRIME rate, which at September 30, 2017 was 4.25%. The current base rate for each investment may be different from the reference rate on September 30, 2017. |
| (5) | The interest rate on these investments is subject to a base rate of 3-Month Canadian Banker Acceptance Rate, which at September 30, 2017 was 1.42%. The current base rate for each investment may be different from the reference rate on September 30, 2017. |
| * | Non-income producing security. |
See notes to condensed financial statements.
11
Table of Contents
Corporate Capital Trust II
Condensed Schedule of Investments (unaudited) (continued)
As of September 30, 2017
A summary of outstanding financial instruments at September 30, 2017 is as follows:
Foreign Currency Forward Contracts
| Foreign Currency |
Settlement Date |
Counterparty |
Amount and Transaction |
US$ Value at Settlement Date |
US$ Value at September 30, 2017 |
Unrealized Appreciation |
||||||||||||||
| CAD |
Oct 10, 2019 | JP Morgan Chase Bank | C$ | 5,690,000 Sold | 4,642,061 | 4,564,888 | 77,173 | |||||||||||||
|
|
|
|
|
|
|
|||||||||||||||
| Total |
$ | 4,642,061 | $ | 4,564,888 | $ | 77,173 | ||||||||||||||
|
|
|
|
|
|
|
|||||||||||||||
Abbreviations:
CAD – Canadian Dollar; local currency investment amount is denominated in Canadian Dollar. C$1 / U.S. $0.80 as of September 30, 2017.
CAN - Canada
GBR - United Kingdom
LUX - Luxembourg
NLD - Netherlands
L = LIBOR - London Interbank Offered Rate, typically 3-Month
P = PRIME - U.S. Prime Rate
CDOR = Canadian Banker Acceptance Rate
See notes to condensed financial statements.
12
Table of Contents
Corporate Capital Trust II
Condensed Schedule of Investments
As of December 31, 2016
| Company (a)(b) |
Footnotes | Industry |
Interest Rate |
Base Rate Floor |
Maturity Date |
No. Shares/ Principal Amount (c) |
Cost (d) | Fair Value | ||||||||||||||||||||||
| First Lien Senior Secured Loans—72.1% |
||||||||||||||||||||||||||||||
| ABB CONCISE Optical Group, LLC |
(1) | Retailing |
L + 500 | 1.00 | % | 6/15/2023 | $ | 514,880 | $ | 513,108 | $ | 521,959 | ||||||||||||||||||
| ABILITY Network, Inc. |
(1) | Health Care Equipment & Services |
L + 500 | 1.00 | % | 5/14/2021 | 202,267 | 198,590 | 203,278 | |||||||||||||||||||||
| Accuride Corp |
(1) | Capital Goods |
L + 700 | 1.00 | % | 11/3/2023 | 788,670 | 765,163 | 772,897 | |||||||||||||||||||||
| BakerCorp International Inc |
(1) | Capital Goods |
L + 300 | 1.25 | % | 2/7/2020 | 114,026 | 100,373 | 109,323 | |||||||||||||||||||||
| Bay Club, Co. |
(1) | Consumer Services |
L + 650 | 1.00 | % | 8/24/2022 | 1,226,258 | 1,202,771 | 1,236,988 | |||||||||||||||||||||
| Belk, Inc. |
(1) | Retailing |
L + 475 | 1.00 | % | 12/12/2022 | 1,229,651 | 1,114,290 | 1,064,675 | |||||||||||||||||||||
| Caesars Growth Properties Holdings LLC |
(e)(f)(1) | Consumer Services |
L + 525 | 1.00 | % | 5/8/2021 | 534,486 | 535,552 | 539,331 | |||||||||||||||||||||
| Commercial Barge Line, Co. |
(1) | Transportation |
L + 875 | 1.00 | % | 11/12/2020 | 556,474 | 527,276 | 526,795 | |||||||||||||||||||||
| CSM Bakery Products |
(1) | Food, Beverage & Tobacco |
L + 400 | 1.00 | % | 7/3/2020 | 1,496,141 | 1,453,460 | 1,359,244 | |||||||||||||||||||||
| David’s Bridal, Inc. |
(1) | Retailing |
L + 400 | 1.25 | % | 10/11/2019 | 854,141 | 793,882 | 757,696 | |||||||||||||||||||||
| Distribution International, Inc. |
(1) | Retailing |
L + 500 | 1.00 | % | 12/15/2021 | 2,154,232 | 1,870,577 | 1,863,411 | |||||||||||||||||||||
| FleetPride Corp. |
(1) | Capital Goods |
L + 400 | 1.25 | % | 11/19/2019 | 1,544,197 | 1,334,388 | 1,467,628 | |||||||||||||||||||||
| Genesys Telecommunications Laboratories, Inc. |
(1) | Software & Services |
L + 525 | 0.75 | % | 12/1/2023 | 1,486,000 | 1,463,845 | 1,516,188 | |||||||||||||||||||||
| Global Eagle Entertainment Inc |
(e)(f)(3) | Media |
L + 600 | 1.00 | % | 12/22/2022 | 1,007,850 | 977,615 | 993,992 | |||||||||||||||||||||
| Heartland Dental Care, Inc. |
(1) | Pharmaceuticals, Biotechnology & Life Sciences |
L + 450 | 1.00 | % | 12/21/2018 | 261,836 | 259,498 | 262,572 | |||||||||||||||||||||
| Information Resources Inc |
(e)(2) | Commercial & Professional Services |
L + 425 | 1.00 | % | 12/20/2023 | 608,070 | 605,030 | 613,391 | |||||||||||||||||||||
| Integra Telecom Holdings, Inc. |
(1) | Telecommunication Services |
L + 425 | 1.00 | % | 8/14/2020 | 1,581,949 | 1,585,804 | 1,589,068 | |||||||||||||||||||||
| Koosharem, LLC |
(1) | Commercial & Professional Services |
L + 650 | 1.00 | % | 5/15/2020 | 2,150,648 | 1,905,116 | 1,949,025 | |||||||||||||||||||||
| MedAssets, Inc. |
(2) | Health Care Equipment & Services |
L + 550 | 1.00 | % | 10/20/2022 | 1,564,578 | 1,574,521 | 1,588,046 | |||||||||||||||||||||
| Netsmart Technologies, Inc. |
(1) | Health Care Equipment & Services |
L + 450 | 1.00 | % | 4/19/2023 | 81,630 | 81,430 | 82,064 | |||||||||||||||||||||
See notes to condensed financial statements.
13
Table of Contents
Corporate Capital Trust II
Condensed Schedule of Investments (continued)
As of December 31, 2016
| Company (a)(b) |
Footnotes | Industry |
Interest Rate |
Base Rate Floor |
Maturity Date |
No. Shares/ Principal Amount (c) |
Cost (d) | Fair Value | ||||||||||||||||||||||
| NewWave Communications, Inc. |
(1) | Media |
L + 375 | 1.00 | % | 4/30/2020 | $ | 75,401 | $ | 70,127 | $ | 75,190 | ||||||||||||||||||
| P2 Energy Solutions, Inc. |
(e)(f)(1) | Software & Services |
L + 400 | 1.00 | % | 10/30/2020 | 532,707 | 507,403 | 508,069 | |||||||||||||||||||||
| PAE Holding Corp |
(1) | Capital Goods |
L + 550 | 1.00 | % | 10/7/2022 | 2,195,480 | 2,194,968 | 2,217,435 | |||||||||||||||||||||
| Paradigm Acquisition Corp. |
(1) | Health Care Equipment & Services |
L + 500 | 1.00 | % | 6/2/2022 | 1,492,424 | 1,492,424 | 1,485,581 | |||||||||||||||||||||
| Polyconcept North America, Inc. |
(2) | Consumer Durables & Apparel |
L + 525 | 1.00 | % | 8/10/2023 | 335,030 | 331,819 | 339,218 | |||||||||||||||||||||
| RedPrairie Corp. |
(2) | Software & Services |
L + 350 | 1.00 | % | 10/12/2023 | 1,000,000 | 1,003,681 | 1,012,625 | |||||||||||||||||||||
| Riverbed Technology, Inc. |
(2) | Technology Hardware & Equipment |
L + 325 | 1.00 | % | 4/25/2022 | 34,550 | 34,550 | 34,847 | |||||||||||||||||||||
| Safway Group Holding, LLC |
(1) | Capital Goods |
L + 475 | 1.00 | % | 8/21/2023 | 1,496,250 | 1,505,619 | 1,520,250 | |||||||||||||||||||||
| Savers, Inc. |
(1) | Retailing |
L + 375 | 1.25 | % | 7/9/2019 | 693,117 | 611,151 | 645,032 | |||||||||||||||||||||
| Sequa Corp. |
(1) | Capital Goods |
L + 400 | 1.25 | % | 6/19/2017 | 1,752,773 | 1,554,319 | 1,664,696 | |||||||||||||||||||||
| SI Organization, Inc. |
(1) | Capital Goods |
L + 475 | 1.00 | % | 11/23/2019 | 603,600 | 603,636 | 611,335 | |||||||||||||||||||||
| SIRVA Worldwide, Inc. |
(e)(1) | Commercial & Professional Services |
L + 650 | 1.00 | % | 11/18/2022 | 2,148,550 | 2,094,836 | 2,110,950 | |||||||||||||||||||||
| TIBCO Software, Inc. |
(2) | Software & Services |
L + 550 | 1.00 | % | 12/4/2020 | 1,416,198 | 1,355,664 | 1,424,759 | |||||||||||||||||||||
| TruGreen, LP |
(2) | Consumer Services |
L + 550 | 1.00 | % | 4/13/2023 | 1,585,224 | 1,601,050 | 1,610,984 | |||||||||||||||||||||
| USIC Holdings Inc |
(1) | Capital Goods |
L + 375 | 1.00 | % | 12/31/2023 | 1,054,790 | 1,052,172 | 1,065,776 | |||||||||||||||||||||
| Vertafore Inc |
(e)(1) | Software & Services |
L + 375 | 1.00 | % | 6/30/2023 | 140,588 | 139,884 | 141,328 | |||||||||||||||||||||
| Vertiv, Co. |
(2) | Technology Hardware & Equipment |
L + 500 | 1.00 | % | 11/30/2023 | 2,197,160 | 2,142,506 | 2,230,117 | |||||||||||||||||||||
| WireCo WorldGroup, Inc. |
(1) | Capital Goods |
L + 550 | 1.00 | % | 7/21/2023 | 563,478 | 562,571 | 570,259 | |||||||||||||||||||||
| Xerox Business Services, LLC |
(e)(f)(3) | Software & Services |
L + 550 | 0.75 | % | 12/7/2023 | 1,380,513 | 1,357,477 | 1,399,495 | |||||||||||||||||||||
|
|
|
|
|
|||||||||||||||||||||||||||
| Total First Lien Senior Secured Loans |
$ | 39,078,146 | $ | 39,685,517 | ||||||||||||||||||||||||||
|
|
|
|
|
|||||||||||||||||||||||||||
See notes to condensed financial statements.
14
Table of Contents
Corporate Capital Trust II
Condensed Schedule of Investments (continued)
As of December 31, 2016
| Company (a)(b) |
Footnotes | Industry |
Interest Rate |
Base Rate Floor |
Maturity Date |
No. Shares/ Principal Amount (c) |
Cost (d) | Fair Value | ||||||||||||||||||||||
| Second Lien Senior Secured Loans—19.2% |
||||||||||||||||||||||||||||||
| Applied Systems, Inc. |
(1) | Software & Services |
L + 650 | 1.00 | % | 1/24/2022 | $ | 1,396,857 | $ | 1,394,216 | $ | 1,414,667 | ||||||||||||||||||
| BJ’s Wholesale Club Inc |
(1) | Food & Staples Retailing |
L + 750 | 1.00 | % | 3/26/2020 | 2,035,800 | 2,048,601 | 2,064,210 | |||||||||||||||||||||
| CTI Foods Holding Co., LLC |
(1) | Food, Beverage & Tobacco |
L + 725 | 1.00 | % | 6/28/2021 | 222,222 | 204,665 | 202,222 | |||||||||||||||||||||
| Formula One (LUX) |
(e)(f)(g)(3) | Media |
L + 675 | 1.00 | % | 7/29/2022 | 422,630 | 421,573 | 426,856 | |||||||||||||||||||||
| Genoa, QoL Healthcare Co., LLC |
(1) | Health Care Equipment & Services |
L + 800 | 1.00 | % | 10/28/2024 | 352,940 | 353,708 | 352,940 | |||||||||||||||||||||
| Grocery Outlet, Inc. |
(1) | Food & Staples Retailing |
L + 825 | 1.00 | % | 10/21/2022 | 198,393 | 184,154 | 198,951 | |||||||||||||||||||||
| iParadigms Holdings, LLC |
(1) | Software & Services |
L + 725 | 1.00 | % | 7/29/2022 | 189,244 | 184,279 | 182,620 | |||||||||||||||||||||
| Misys, Ltd. (GBR) |
(f)(h)(g) | Software & Services |
12.00 | % | 6/12/2019 | 54,320 | 57,241 | 57,794 | ||||||||||||||||||||||
| NEP Group, Inc. |
(1) | Media |
L + 875 | 1.25 | % | 7/22/2020 | 215,054 | 202,787 | 217,204 | |||||||||||||||||||||
| NewWave Communications, Inc. |
(1) | Media |
L + 800 | 1.00 | % | 10/30/2020 | 206,718 | 202,226 | 201,292 | |||||||||||||||||||||
| Polyconcept North America, Inc. |
(2)(i) | Consumer Durables & Apparel |
L + 1000 | 1.00 | % | 12/31/2023 | 624,235 | 609,336 | 615,616 | |||||||||||||||||||||
| Press Ganey Holdings, Inc. |
(2) | Health Care Equipment & Services |
L + 725 | 1.00 | % | 10/21/2024 | 2,024,940 | 2,053,581 | 2,065,439 | |||||||||||||||||||||
| SI Organization, Inc. |
(1) | Capital Goods |
L + 875 | 1.00 | % | 5/23/2020 | 460,504 | 453,937 | 465,494 | |||||||||||||||||||||
| SRS Distribution, Inc. |
(1) | Capital Goods |
L + 875 | 1.00 | % | 2/24/2023 | 444,840 | 436,419 | 459,716 | |||||||||||||||||||||
| WireCo WorldGroup, Inc. |
(3)(e) | Capital Goods |
L + 950 | 1.00 | % | 7/12/2024 | 1,632,350 | 1,626,765 | 1,646,633 | |||||||||||||||||||||
|
|
|
|
|
|||||||||||||||||||||||||||
| Total Second Lien Senior Secured Loans |
$ | 10,433,488 | $ | 10,571,654 | ||||||||||||||||||||||||||
|
|
|
|
|
|||||||||||||||||||||||||||
| Total Senior Debt |
$ | 49,511,634 | $ | 50,257,171 | ||||||||||||||||||||||||||
|
|
|
|
|
|||||||||||||||||||||||||||
| Subordinated Debt—10.7% |
||||||||||||||||||||||||||||||
| Allegheny Technologies Inc |
(f) | Materials |
7.88 | % | 8/15/2023 | $ | 2,339,000 | $ | 2,278,936 | $ | 2,292,220 | |||||||||||||||||||
| Dynegy Inc |
(f) | Utilities |
6.75 | % | 11/1/2019 | 978,000 | 988,195 | 995,115 | ||||||||||||||||||||||
See notes to condensed financial statements.
15
Table of Contents
Corporate Capital Trust II
Condensed Schedule of Investments (continued)
As of December 31, 2016
| Company (a)(b) |
Footnotes | Industry | Interest Rate |
Base Rate Floor |
Maturity Date |
No. Shares/ Principal Amount (c) |
Cost (d) | Fair Value | ||||||||||||||||||||||||
| JC Penney Corp., Inc. |
(f) | Retailing | 8.13 | % | 10/1/2019 | $ | 1,383,000 | $ | 1,497,869 | $ | 1,493,640 | |||||||||||||||||||||
| Netflix, Inc. |
(f) | Retailing | 5.88 | % | 2/15/2025 | 1,017,000 | 1,116,541 | 1,097,089 | ||||||||||||||||||||||||
|
|
|
|
|
|||||||||||||||||||||||||||||
| Total Subordinated Debt |
$ | 5,881,541 | $ | 5,878,064 | ||||||||||||||||||||||||||||
|
|
|
|
|
|||||||||||||||||||||||||||||
| Equity—0.1% |
||||||||||||||||||||||||||||||||
| Polyconcept North America Holdings LLC, Membership Units |
(i) | Consumer Durables & Apparel | 624 | $ | 62,424 | $ | 57,548 | |||||||||||||||||||||||||
|
|
|
|
|
|||||||||||||||||||||||||||||
| Total Equity |
$ | 62,424 | $ | 57,548 | ||||||||||||||||||||||||||||
|
|
|
|
|
|||||||||||||||||||||||||||||
| TOTAL INVESTMENTS — 102.1%(h) |
$ | 55,455,599 | $ | 56,192,783 | ||||||||||||||||||||||||||||
|
|
|
|
|
|||||||||||||||||||||||||||||
| OTHER ASSETS IN EXCESS OF LIABILITIES—(2.1%) |
(1,175,492 | ) | ||||||||||||||||||||||||||||||
|
|
|
|||||||||||||||||||||||||||||||
| NET ASSETS—100.0% |
$ | 55,017,291 | ||||||||||||||||||||||||||||||
|
|
|
|||||||||||||||||||||||||||||||
| (a) | Security may be an obligation of one or more entities affiliated with the named company. |
| (b) | Non-controlled/non-affiliated investments as defined by the Investment Company Act of 1940, as amended (“1940 Act”), unless otherwise indicated. Non-controlled/non-affiliated investments are investments that are neither controlled investments nor affiliated investments. |
| (c) | Denominated in U.S. dollars unless otherwise noted. |
| (d) | Represents amortized cost for debt securities and cost for equity investments translated to U.S. dollars. |
| (e) | Position or portion thereof unsettled as of December 31, 2016. |
| (f) | The investment is not a qualifying asset as defined in Section 55(a) under the 1940 Act. A business development company may not acquire any assets other than qualifying assets, unless, at the time the acquisition is made, qualifying assets represent at least 70% of the company’s total assets. 83.9% of the Company’s total assets represented qualifying assets as of December 31, 2016. |
| (g) | A portfolio company domiciled in a foreign country. The jurisdiction of the security issuer may be a different country than the domicile of the portfolio company. |
| (h) | As of December 31, 2016, the aggregate gross unrealized appreciation for all securities in which there was an excess of value over tax cost was $930,483; the aggregate gross unrealized depreciation for all securities in which there was an excess of tax cost over value was $228,867; the net unrealized appreciation was $701,616; the aggregate cost of securities for Federal income tax purposes was $55,491,167. |
| (i) | Investments classified as Level 3 whereby fair value was determined by the Company’s board of trustees (see Note 2). |
See notes to condensed financial statements.
16
Table of Contents
Corporate Capital Trust II
Condensed Schedule of Investments (continued)
As of December 31, 2016
| (1) | The interest rate on these investments is subject to a base rate of 3-Month LIBOR, which at December 31, 2016 was 1.00%. The current base rate for each investment may be different from the reference rate on December 31, 2016. |
| (2) | The interest rate on these investments is subject to a base rate of 1-Month LIBOR, which at December 31, 2016 was 0.77%. The current base rate for each investment may be different from the reference rate on December 31, 2016. |
| (3) | The interest rate on these investments is subject to a base rate of 6-Month LIBOR, which at December 31, 2016 was 1.32%. The current base rate for each investment may be different from the reference rate on December 31, 2016. |
Abbreviations:
GBR - United Kingdom
LUX - Luxembourg
L = LIBOR - London Interbank Offered Rate, typically 3-Month
See notes to condensed financial statements.
17
Table of Contents
CORPORATE CAPITAL TRUST II
Notes to Condensed Financial Statements (Unaudited)
| 1. | Principal Business and Organization |
Corporate Capital Trust II (the “Company”) was formed as a Delaware statutory trust on August 12, 2014. The Company is a non-diversified closed-end management investment company and has elected to be regulated as a business development company under the Investment Company Act of 1940 (the “1940 Act”). The Company’s investment objective is to provide its shareholders with current income and, to a lesser extent, long-term capital appreciation, by investing primarily in the debt of privately owned U.S. companies with a focus on originated transactions sourced through the networks of its advisors. The Company has elected to be taxed as a regulated investment company (“RIC”) under the Internal Revenue Code of 1986, as amended (the “Code”) and operate in a manner so as to qualify for the tax treatment applicable to RICs.
The Company is externally managed by CNL Fund Advisors II, LLC (“CNL”) and KKR Credit Advisors (US) LLC (“KKR”, and together with CNL, the “Advisors”), which are collectively responsible for sourcing potential investments, conducting due diligence on prospective investments, analyzing investment opportunities, structuring investments, determining the securities and other assets that the Company will purchase, retain or sell and monitoring the Company’s portfolio on an ongoing basis. Both of the Advisors are registered as investment advisers with the Securities and Exchange Commission (“SEC”). CNL also provides the administrative services necessary for the Company to operate.
On September 29, 2014, the Company filed a registration statement on Form N-2 (the “Registration Statement”) with the SEC to register its common stock. The Registration Statement, as amended, provides for the sale on a continuous basis of up to $2.6 billion of shares of common stock (275 million shares) (the “Offering”). The Registration Statement was declared effective on October 9, 2015, at which time the Company’s Offering commenced.
On March 1, 2016 the Company satisfied its minimum offering requirement to accumulate in excess of $2.25 million in subscriptions in an escrow account via the Share Purchase Agreements entered into with the Advisors. On March 1, 2016, the Company issued shares of common stock in exchange for the subscription capital in the escrow account. The Company commenced principal and investment operations on March 1, 2016.
In June 2017, the Company obtained co-investment exemptive relief from the SEC and began investing in co-investment transactions with affiliates of KKR.
| 2. | Significant Accounting Policies |
Basis of Presentation – The accompanying condensed financial statements of the Company are prepared in accordance with the instructions to Form 10-Q and accounting principles generally accepted in the United States of America (“GAAP”). The Company is an investment company following accounting and reporting guidance in Financial Accounting Standards Board (“FASB”) Accounting Standards Codification (“ASC”) Topic 946, Financial Services—Investment Companies (“ASC Topic 946”). The unaudited condensed financial statements reflect all normal recurring adjustments, which are, in the opinion of management, necessary for the fair presentation of the Company’s results for the interim periods presented. The results of operations for interim periods are not indicative of results to be expected for the full year.
Certain financial information that is normally included in annual financial statements, including certain financial statement footnotes, prepared in accordance with GAAP, is not required for interim reporting purposes and has been condensed or omitted herein. These financial statements should be read in conjunction with the Company’s financial statements and notes related thereto included in the Company’s Annual Report on Form 10-K for the period ended December 31, 2016, which was filed with the SEC on March 17, 2017.
Use of Estimates – The preparation of the condensed financial statements in conformity with GAAP requires management to make estimates and assumptions that affect (i) the reported amounts of assets and liabilities at the date of the condensed financial statements, (ii) the reported amounts of income and expenses during the reporting periods presented and (iii) disclosure of contingent assets and liabilities at the date of the condensed financial statements. Actual results could differ from those estimates.
Cash – Cash consists of demand deposits.
18
Table of Contents
| 2. | Significant Accounting Policies (continued) |
Valuation of Investments – The Company measures the value of its investments in accordance with ASC Topic 820, Fair Value Measurements and Disclosure (“ASC Topic 820”), issued by the FASB. Fair value is the price that would be received to sell an asset or paid to transfer a liability in an orderly transaction between market participants at the measurement date. Market participants are defined as buyers and sellers in the principal or most advantageous market (which may be a hypothetical market) that are independent, knowledgeable, and willing and able to transact. In accordance with ASC Topic 820, the Company considers its principal market to be the market that has the greatest volume and level of activity.
ASC Topic 820 defines hierarchical levels directly related to the amount of subjectivity associated with the inputs used to determine fair values of assets and liabilities. The hierarchical levels and types of inputs used to measure fair value for each level are described as follows:
Level 1 – Quoted prices are available in active markets for identical investments as of the reporting date. Publicly listed equities and debt securities, publicly listed derivatives, money market/short-term investment funds and foreign currency are generally included in Level 1. The Company does not adjust the quoted price for these investments.
Level 2 – Valuation inputs are other than quoted prices in active markets, which are either directly or indirectly observable as of the reporting date, and fair value is determined through the use of models or other valuation methodologies. In certain cases, debt and equity securities are valued on the basis of prices from orderly transactions for similar investments in active markets between market participants and provided by reputable dealers or independent pricing services. In determining the value of a particular investment, independent pricing services may use certain information with respect to transactions in such investments, quotations from dealers, pricing matrices, market transactions in comparable investments, and various relationships between investments. Investments generally included in this category are corporate bonds and loans that are priced based on observable inputs. Investments generally included in this category are corporate bonds and loans, convertible debt indexed to publicly listed securities, foreign currency forward contracts, cross currency and certain over-the-counter derivatives.
Level 3 – Valuation inputs are unobservable for the investment and include situations where there is little, if any, market activity for the investment. The inputs into the determination of fair value require significant judgment or estimation. Investments generally included in this category are illiquid corporate bonds and loans, unlisted common and preferred stock investments, and equity options that lack observable market pricing.
In certain cases, the inputs used to measure fair value may fall within different levels of the fair value hierarchy. In such cases, an investment’s level within the fair value hierarchy is based on the lowest level of input that is significant to the fair value measurement. Depending on the relative liquidity in the markets for certain investments, the Company may transfer assets to Level 3 if it determines that observable quoted prices, obtained directly or indirectly, are not available or reliable. The Company’s assessment of the significance of a particular input to the fair value measurement requires judgment, and the consideration of factors specific to the investment.
Investments for which market quotations are readily available are valued using market quotations, which are generally obtained from independent pricing services, broker-dealers or market makers. With respect to the Company’s portfolio investments for which market quotations are not readily available, the Company’s board of trustees is responsible for determining in good faith the fair value of the Company’s portfolio investments in accordance with the valuation policy and procedures approved by the board of trustees, based on, among other things, the input of the Company’s Advisors and management, its audit committee, and independent third-party valuation firms.
The Company and the board of trustees conduct their fair value determination process on a monthly basis and any other time when a decision regarding the fair value of the portfolio investments is required. A determination of fair value involves subjective judgments and estimates. Due to the inherent uncertainty of determining the fair value of portfolio investments that do not have a readily available market value, the fair value of the investments may differ significantly from the values that would have been determined had a readily available market value existed for such investments, and the differences could be material. Further, such investments are generally less liquid than publicly traded securities. If the Company were required to liquidate a portfolio investment that does not have a readily available market value in a forced or liquidation sale, the Company could realize significantly less than the value recorded by the Company.
19
Table of Contents
| 2. | Significant Accounting Policies (continued) |
The Company and its Advisors undertake a multi-step valuation process each quarter for determining the fair value of the Company’s investments, the market prices of which are not readily available, as described below:
| • | Each portfolio company or investment is initially valued by the Company’s independent third party valuation firm which provided a valuation range (external valuation) and/or KKR (internal valuation). |
| • | Valuation recommendations are formulated and documented by KKR and reviewed by KKR’s valuation committee. The KKR valuation committee then provides its valuation recommendation for each portfolio investment, along with supporting documentation, to CNL and the Company. |
| • | After the Company’s management has substantially completed its review, it forwards the valuation recommendations and supporting documentation for audit committee review. |
| • | The Company’s board of trustees then discusses the investment valuation recommendations with the Advisors and management and, based on those discussions and the related review process conducted by the Company’s audit committee, determines the fair value of the investments in good faith. |
The valuation techniques used by the Company for the assets and liabilities that are classified as Level 3 in the fair value hierarchy are described below.
Senior Debt and Subordinated Debt: Senior debt and subordinated debt investments are initially valued at transaction price and are subsequently valued using (i) market data for similar instruments (e.g., recent transactions or indicative broker quotes), (ii) comparisons to benchmark derivative indices or (iii) valuation models. Valuation models are generally based on yield analysis and discounted cash flow techniques, where the key inputs are based on relative value analyses and the assignment of risk-adjusted discounted rates, based on the analysis of similar instruments from similar issuers. In addition, an illiquidity discount is applied where appropriate.
Equity/Other Investments: Equity/other investments are initially valued at transaction price and are subsequently valued using valuation models in the absence of readily observable market prices. Valuation models are generally based on (i) market and income (discounted cash flow) approaches, in which various internal and external factors are considered, and (ii) earnings before interest, taxes, depreciation and amortization (“EBITDA”) valuation multiples analysis. Factors include key financial inputs and recent public and private transactions for comparable investments. Key inputs used for the discounted cash flow approach include the weighted average cost of capital and assumed inputs used to calculate terminal values, such as EBITDA exit multiples. The fair value for a particular investment will generally be within the value range conclusions derived by the two approaches. Upon completion of the valuations conducted, an illiquidity discount is applied where appropriate.
The Company utilizes several valuation techniques that use unobservable pricing inputs and assumptions in determining the fair value of its Level 3 investments. The valuation techniques, as well as key unobservable inputs that have a significant impact on the Company’s Level 3 valuations, are described in Note 5. “Fair Value of Financial Instruments.” The unobservable pricing inputs and assumptions may differ by asset and in the application of the Company’s valuation methodologies. The reported fair value estimates could vary materially if the Company had chosen to incorporate different unobservable pricing inputs and other assumptions.
Security Transactions, Realized/Unrealized Gains or Losses, and Income Recognition – Investment transactions are recorded on the trade date. The Company measures realized gains or losses from the sale of investments using the specific identification method. Realized gains or losses are measured by the difference between the net proceeds from the sale and the amortized cost basis of the investment without regard to unrealized gains or losses previously recognized, and include investments charged off during the period, net of recoveries. Unrealized gains or losses primarily reflect the change in investment values, including the reversal of previously recorded unrealized gains or losses when gains or losses are realized. The amortized cost basis of investments includes (i) the original cost and (ii) adjustments for the accretion/amortization of market discounts and premiums and original issue discount and loan origination fees. The Company reports changes in fair value of investments as a component of net change in unrealized appreciation (depreciation) on investments in the condensed statements of operations.
Interest Income – Interest income is recorded on an accrual basis and includes amortization of premiums to par value and accretion of discounts to par value. Discounts and premiums to par value on securities purchased are accreted/amortized into interest income over the life of the respective security using the effective interest method. Generally, loan origination, closing, commitment and other fees received by the Company directly or indirectly from borrowers in connection with the closing of investments are accreted over the contractual life of the debt investment as interest income based on the effective interest method. Upon prepayment of a debt investment, any prepayment penalties and unamortized loan fees and discounts are recorded as interest income.
20
Table of Contents
| 2. | Significant Accounting Policies (continued) |
Debt securities are placed on nonaccrual status when principal or interest payments are at least 90 days past due or when there is reasonable doubt that principal or interest will be collected. Generally, accrued interest is reversed against interest income when a debt security is placed on nonaccrual status. Interest payments received on debt securities on nonaccrual status may be recognized as interest income or applied to principal based on management’s judgment. Debt securities on nonaccrual status are restored to accrual status when past due principal and interest are paid and, in management’s judgment, such investments are likely to remain current on interest payment obligations. The Company may make exceptions to this treatment if the debt security has sufficient collateral value and is in the process of collection.
Fee Income – In its role as the Company’s investment sub-advisor, KKR or its affiliates may provide financial advisory services to portfolio companies and in return may receive fees for capital structuring services. KKR is obligated to remit to the Company any earned capital structuring fees based on the pro-rata portion of the Company’s investment in co-investment transactions and originated investments. These fees are generally nonrecurring and are recognized as fee income by the Company upon the investment closing date. The Company may also receive fees for commitments, amendments and other services related to portfolio companies. Such fees are recognized as fee income when earned or the services are rendered.
Dividend Income – Dividend income on preferred equity securities is recorded as dividend income on an accrual basis to the extent such amounts are payable by the portfolio company and are expected to be collected. Dividend income on common equity securities is recorded on the record date for private portfolio companies or on the ex-dividend date for publicly traded portfolio companies. Each distribution received from a limited liability company (“LLC”) and limited partnership (“LP”) investments are evaluated to determine if the distribution should be recorded as dividend income or a return of capital. Generally, the Company will not record distributions from equity investments in LLCs and LPs as dividend income unless there are sufficient accumulated earnings in the LLC and LP prior to the distribution. Distributions that are classified as a return of capital are recorded as a reduction in the cost basis of the investment.
Derivative Instruments – The Company’s derivative instruments consists of a foreign currency contract. The Company recognizes all derivative instruments as assets or liabilities at fair value in its condensed financial statements. Derivative contracts entered into by the Company are not designated as hedging instruments, and as a result, the Company presents changes in fair value through net change in unrealized appreciation (depreciation) on derivative instruments in the condensed statements of operations. Realized gains and losses that occur upon the cash settlement of the derivative instruments are included in net realized gains (losses) on derivative instruments in the condensed statements of operations.
Paid In Capital – The Company records the proceeds from the sale of its common stock on a net basis to (i) capital stock and (ii) paid-in capital in excess of par value, excluding up-front selling commissions and dealer manager fees.
Deferred Financing Costs – Financing costs, including upfront fees, commitment fees and legal fees related to the Company’s credit facility are deferred and amortized over the life of the related financing instrument using the straight-line method. The amortization of deferred financing costs is included in interest expense in the condensed statements of operations.
Foreign Currency Translation, Transactions and Gains/Losses – Foreign currency amounts are translated into U.S. dollars on the following basis: (i) at the exchange rate on the last business day of the reporting period for the fair value of investment securities, other assets and liabilities; and (ii) at the prevailing exchange rate on the respective recording dates for the purchase and sale of investment securities, income, expenses, gains and losses.
Net assets and fair values are presented based on the applicable foreign exchange rates described above and the Company does not isolate that portion of the results of operations resulting from changes in foreign exchange rates on investments from the fluctuations arising from changes in fair values of investments held; therefore, fluctuations related to foreign exchange rate conversions are included with the net realized gains (losses) and unrealized appreciation (depreciation) on investments.
Net realized gains or losses on foreign currency transactions arise from sales of foreign currency, and the difference between the amounts of dividends, interest, and foreign withholding taxes recorded by the Company and the U.S. dollar equivalent of the amounts actually received or paid by the Company.
Unrealized appreciation (depreciation) from foreign currency translation for other receivables or payables is presented as net change in unrealized appreciation (depreciation) in foreign currency translation in the condensed statements of operations.
21
Table of Contents
| 2. | Significant Accounting Policies (continued) |
Management Fees – The Company incurs a base management fee (recorded as investment advisory fees) and performance-based incentive fees, including (i) a subordinated incentive fee on income and (ii) an incentive fee on capital gains, due to its Advisors pursuant to an investment advisory agreement described in Note 6. “Related Party Transactions.” The two components of performance-based incentive fees are combined and expensed in the condensed statements of operations and accrued as accrued performance-based incentive fees in the condensed statements of assets and liabilities. Pursuant to the terms of the investment advisory agreement, the incentive fee on capital gains is determined and payable in arrears as of the end of each calendar year (or upon termination of the investment advisory agreement) based on the Company’s realized capital gains on a cumulative basis from inception, net of all realized capital losses on a cumulative basis and unrealized depreciation at year end, less the aggregate amount of any previously paid capital gains incentive fees. Although the terms of the investment advisory agreement do not provide for the inclusion of unrealized gains in the calculation of the incentive fee on capital gains, pursuant to relevant authoritative guidance for investment companies, the Company includes unrealized gains in the calculation of the incentive fee on capital gains expense and related accrued incentive fee on capital gains. This accrual reflects the incentive fees that would be payable to the Advisors if the Company’s entire portfolio was liquidated at its fair value as of the balance sheet date even though the Advisors are not entitled to an incentive fee with respect to unrealized gains unless and until such gains are actually realized.
Organization and Offering Expenses – Organization expenses are expensed on the Company’s statement of operations. Offering expenses will be capitalized on the Company’s statement of assets and liabilities as deferred offering expenses and expensed to the Company’s statement of operations over a 12-month period, noting, however, the deferral period will not exceed 12 months from the date the Advisors incurred the offering expenses.
Earnings per Share – Earnings per share is calculated based upon the weighted average number of shares of common stock outstanding during the reporting period.
Distributions – Weekly distributions are generally declared quarterly by the Company’s board of trustees and recognized as a liability on the applicable record date. Distributions are paid monthly. The Company has adopted a distribution reinvestment plan that provides for reinvestment of distributions on behalf of shareholders. Shareholders who have elected to participate in the distribution reinvestment plan will have their cash distribution automatically reinvested in additional shares of common stock at a price per share equivalent to the then current public offering price, net of up-front selling commissions and dealer manager fees.
Federal Income Taxes – The Company has elected to be treated for federal income tax purposes, and intends to maintain its qualification, as a RIC under Subchapter M of the Code. Generally, a RIC is not subject to federal income taxes on distributed income and gains if it distributes at least 90% of its “Investment Company Taxable Income,” as defined in the Code. The Company intends to distribute sufficient amounts to maintain RIC status and minimize income taxes on undistributed capital gains and investment company taxable income.
The Company is generally subject to nondeductible federal excise taxes if it does not distribute to its shareholders an amount at least equal to the sum of (i) 98% of its net ordinary income for the calendar year, (ii) 98.2% of its capital gains in excess of capital losses for the one-year period generally ending on October 31 of the calendar year and (iii) any ordinary income and net capital gains for preceding years that were not distributed during such years and on which the Company paid no federal income tax. The Company may pay a 4% nondeductible federal excise tax on under-distribution of capital gains and net ordinary income.
The Company recognizes in its condensed financial statements the effect of a tax position when it is deemed more likely than not, based on the technical merits, that the position will be sustained upon examination. Tax benefits of positions not deemed to meet the more-likely-than-not threshold are recorded as tax expenses in the current year. The Company did not have any uncertain tax positions that met the recognition or measurement criteria of ASC 740-10-25, Income Taxes – Overall –Recognition, nor did it have any unrecognized tax benefits for the periods presented herein. Although the Company files federal and state tax returns, its major tax jurisdiction is federal.
Permanent book and tax basis differences are reclassified among the Company’s capital accounts, as appropriate on an annual basis. Additionally, the tax character and amount of distributions is determined in accordance with the Code which differs from GAAP.
Recent Accounting Pronouncements - In August 2016, the FASB issued ASU 2016-15, “Statement of Cash Flows (Topic 230): Classification of Certain Cash Receipts and Cash Payments,” which will make eight targeted changes to how cash receipts and cash payments are presented and classified in the statement of cash flows. The ASU further clarifies how the predominance principle should be applied to cash receipts and payments relating to more than one class of cash flows. The ASU is effective for annual reporting periods, and interim periods within those annual periods, beginning after December 15, 2017. The ASU is to be applied retrospectively for each period presented. The Company does not expect this ASU to have a material impact on the Company’s statement of cash flows.
22
Table of Contents
| 2. | Significant Accounting Policies (continued) |
In November 2016, the FASB issued ASU 2016-18, “Statement of Cash Flows (Topic 230): Restricted Cash,” which modifies the presentation of the statement of cash flows and requires reconciliation to the overall change in the total of cash, cash equivalents, restricted cash and restricted cash equivalents. As a result, the statement of cash flows will no longer present transfers between cash and cash equivalents and restricted cash and restricted cash equivalents. The ASU is effective for annual reporting periods, and interim periods within those annual periods, beginning after December 15, 2017, with early adoption permitted. The ASU is to be applied retrospectively for each period presented. The Company adopted this ASU on December 31, 2016 and the adoption has not materially impacted the presentation of the Company’s cash flows.
In May 2014, the Financial Accounting Standards Board (the “FASB”) issued Accounting Standards Update (“ASU”) No. 2014-09, Revenue from Contracts with Customers (Topic 606). The guidance in this ASU supersedes the revenue recognition requirements in Revenue Recognition (Topic 605). Under the new guidance, an entity should recognize revenue to depict the transfer of promised goods or services to customers in an amount that reflects the consideration to which the entity expects to be entitled in exchange for those goods or services. The amendments in ASU No. 2014-09 are effective for annual reporting periods beginning after December 15, 2017, including interim periods within that reporting period. In March 2016, the FASB issued ASU No. 2016-08, Revenue from Contracts with Customers (Topic 606): Principal versus Agent Considerations, which clarifies the guidance in ASU No. 2014-09 and has the same effective date as the original standard. In April 2016, the FASB issued ASU No. 2016-10, Revenue from Contracts with Customers (Topic 606): Identifying Performance Obligations and Licensing, an update on identifying performance obligations and accounting for licenses of intellectual property. In May 2016, the FASB issued ASU No. 2016-12, Revenue from Contracts with Customers (Topic 606): Narrow-Scope Improvements and Practical Expedients, which includes amendments for enhanced clarification of the guidance. In December 2016, the FASB issued ASU No. 2016-20, Technical Corrections and Improvements to Revenue from Contracts with Customers (Topic 606), the amendments in this update are of a similar nature to the items typically addressed in the technical corrections and improvements project. Additionally, in February 2017, the FASB issued ASU No. 2017-05, Other Income - Gains and Losses from the Derecognition of Nonfinancial Assets (subtopic 610-20): Clarifying the Scope of Asset Derecognition Guidance and Accounting for Partial Sales of Nonfinancial Assets, an update clarifying that a financial asset is within the scope of Subtopic 610-20 if it is deemed an “in-substance non-financial asset.” The Company has evaluated the impact of ASU Nos. 2014-09, 2016-08, 2016-10, 2016-12, and 2016-20 (the “ASUs”), and does not expect the ASUs to have a material impact on the Company’s statement of operations.
| 3. | Investments |
The Company is engaged in a strategy to invest primarily in the debt of privately owned and thinly traded U.S. companies. The primary investment concentrations include (i) senior debt securities and (ii) subordinated debt securities. The Company’s investments may, in some cases, be accompanied by warrants, options or other forms of equity participation. The Company may separately purchase common or preferred equity interests, including non-controlling equity investments. Additionally, the Company may invest in convertible securities, derivatives and private investment funds. The Company may also co-invest with third parties through partnerships, joint ventures or other entities, thereby acquiring jointly controlled or non-controlling interests in certain investments in conjunction with participation by one or more third parties in such investment. The fair value of the Company’s investments will generally fluctuate with, among other things, changes in prevailing interest rates, the general supply of, and demand for, debt capital among private and public companies, general domestic and global economic conditions, the condition of certain financial markets, developments or trends in any particular industry and changes in the financial condition and credit quality of each security’s issuer.
As of September 30, 2017 and December 31, 2016, the Company’s investment portfolio consisted of the following:
| As of September 30, 2017 | ||||||||||||||||
| Asset Category |
Amortized Cost |
Fair Value |
Percentage of Investment Portfolio |
Percentage of Net Assets |
||||||||||||
| Senior debt |
||||||||||||||||
| First lien senior secured loans |
$ | 89,694,336 | $ | 89,682,463 | 60.5 | % | 82.6 | % | ||||||||
| Second lien senior secured loans |
25,500,795 | 25,931,872 | 17.5 | 23.9 | ||||||||||||
| Other senior secured debt |
3,540,621 | 3,548,240 | 2.4 | 3.3 | ||||||||||||
|
|
|
|
|
|
|
|
|
|||||||||
| Total senior debt |
118,735,752 | 119,162,575 | 80.4 | 109.8 | ||||||||||||
| Subordinated debt |
25,721,007 | 26,238,660 | 17.7 | 24.2 | ||||||||||||
| Equity/Other |
2,850,558 | 2,875,999 | 1.9 | 2.6 | ||||||||||||
|
|
|
|
|
|
|
|
|
|||||||||
| Total investments |
$ | 147,307,317 | $ | 148,277,234 | 100.0 | % | 136.6 | % | ||||||||
|
|
|
|
|
|
|
|
|
|||||||||
23
Table of Contents
| 3. | Investments (continued) |
| As of December 31, 2016 | ||||||||||||||||
| Asset Category |
Amortized Cost |
Fair Value |
Percentage of Investment Portfolio |
Percentage of Net Assets |
||||||||||||
| Senior debt |
||||||||||||||||
| First lien senior secured loans |
$ | 39,078,146 | $ | 39,685,517 | 70.6 | % | 72.1 | % | ||||||||
| Second lien senior secured loans |
10,433,488 | 10,571,654 | 18.8 | 19.2 | ||||||||||||
|
|
|
|
|
|
|
|
|
|||||||||
| Total senior debt |
49,511,634 | 50,257,171 | 89.4 | 91.3 | ||||||||||||
| Subordinated debt |
5,881,541 | 5,878,064 | 10.5 | 10.7 | ||||||||||||
| Equity/Other |
62,424 | 57,548 | 0.1 | 0.1 | ||||||||||||
|
|
|
|
|
|
|
|
|
|||||||||
| Total investments |
$ | 55,455,599 | $ | 56,192,783 | 100.0 | % | 102.1 | % | ||||||||
|
|
|
|
|
|
|
|
|
|||||||||
As of September 30, 2017 and December 31, 2016, none of the Company’s debt investments were on nonaccrual status.
The industry composition and geographic dispersion of the Company’s investment portfolio as a percentage of total fair value of the Company’s investments as of September 30, 2017 and December 31, 2016 were as follows:
| Industry Composition |
As of September 30, 2017 | As of December 31, 2016 | ||||||
| Software & Services |
22.5 | % | 13.6 | % | ||||
| Retailing |
15.3 | 13.2 | ||||||
| Capital Goods |
15.0 | 22.5 | ||||||
| Materials |
13.7 | 4.1 | ||||||
| Health Care Equipment & Services |
6.7 | 10.3 | ||||||
| Commercial & Professional Services |
6.5 | 8.3 | ||||||
| Media |
5.8 | 3.4 | ||||||
| Consumer Services |
5.3 | 6.0 | ||||||
| Transportation |
3.4 | 0.9 | ||||||
| Semiconductors & Semiconductors Equipment |
2.3 | — | ||||||
| Pharmaceuticals, Biotechnology & Life Sciences |
1.2 | 0.5 | ||||||
| Food & Staples Retailing |
0.7 | 4.0 | ||||||
| Consumer Durables & Apparel |
0.7 | 1.8 | ||||||
| Telecommunications |
0.4 | 2.8 | ||||||
| Technology Hardware & Equipment |
0.4 | 4.0 | ||||||
| Food, Beverage & Tobacco |
0.1 | 2.8 | ||||||
| Utilities |
— | 1.8 | ||||||
|
|
|
|
|
|||||
| Total |
100.0 | % | 100.0 | % | ||||
|
|
|
|
|
|||||
| Geographic Dispersion(1) |
September 30, 2017 | December 31, 2016 | ||||||
| United States |
87.5 | % | 99.1 | % | ||||
| Canada |
3.0 | — | ||||||
| Luxembourg |
3.0 | 0.8 | ||||||
| Netherlands |
2.7 | — | ||||||
| Cayman Islands |
1.9 | — | ||||||
| United Kingdom |
1.9 | 0.1 | ||||||
|
|
|
|
|
|||||
| Total |
100.0 | % | 100.0 | % | ||||
|
|
|
|
|
|||||
| (1) | The geographic dispersion is determined by the portfolio company’s country of domicile or the jurisdiction of the security’s issuer. |
All portfolio companies held at September 30, 2017 were denominated in U.S. dollars except for one portfolio company, which was denominated in Canadian dollars and represented 3.0% of the investment portfolio. All portfolio companies held at December 31, 2016 were denominated in U.S. dollars.
24
Table of Contents
| 4. | Derivative Instruments |
The following is a summary of the fair value and location of the Company’s derivative instruments in the condensed statements of assets and liabilities held as of September 30, 2017:
| Fair Value | ||||||
| Derivative Instrument |
Statement Location |
September 30, 2017 | ||||
| Foreign currency forward contracts |
Unrealized appreciation on foreign currency forward contracts | $ | 77,173 | |||
|
|
|
|||||
| Total |
$ | 77,173 | ||||
|
|
|
|||||
The Company did not have any derivative instruments as of December 31, 2016.
Net unrealized gains and losses on derivative instruments recorded by the Company for the three and nine months ended September 30, 2017 are in the following locations in the condensed statements of operations:
| Net Unrealized Gains (Losses) | ||||||||||
| Three Months Ended September 30, |
Nine Months Ended September 30, |
|||||||||
| Derivative Instrument |
Statement Location |
2017 | 2017 | |||||||
| Foreign currency forward contracts |
Net change in unrealized appreciation on foreign currency forward contracts | $ | 77,173 | $ | 77,173 | |||||
|
|
|
|
|
|||||||
| Total |
$ | 77,173 | $ | 77,173 | ||||||
|
|
|
|
|
|||||||
There were no unrealized gains and losses on derivative instruments for the three and nine months ended September 30, 2016.
Foreign Currency Forward Contracts
The Company may enter into foreign currency forward contracts from time to time to facilitate settlement of purchases and sales of investments denominated in foreign currencies and to economically hedge the impact that an adverse change in foreign exchange rates would have on the value of the Company’s investments denominated in foreign currencies. A foreign currency forward contract is a commitment to purchase or sell a foreign currency at a future date at a negotiated forward rate. These contracts are marked-to-market by recognizing the difference between the contract forward exchange rate and the forward market exchange rate on the last day of the period presented as unrealized appreciation or depreciation. Realized gains or losses are recognized when forward contracts are settled. Risks arise as a result of the potential inability of the counterparties to meet the terms of their contracts. The Company attempts to limit counterparty risk by only dealing with well-known counterparties.
The Company entered into one foreign currency forward contract during the period which related to economic hedging of the Company’s foreign currency denominated debt investments. As of September 30, 2017, the Company’s open foreign currency forward contract was as follows:
| Foreign Currency Forward Contracts |
||||||||||||||||||||
| Foreign Currency |
Settlement Date |
Counterparty |
Notional Amount and Transaction |
US $ Value at Settlement Date |
US $ Value at September 30, 2017 |
Unrealized Appreciation |
||||||||||||||
| CAD |
Oct 10, 2019 | JP Morgan Chase Bank | C$ | 5,690,000 Sold | $ | 4,642,061 | $ | 4,564,888 | $ | 77,173 | ||||||||||
|
|
|
|
|
|
|
|||||||||||||||
| Total |
$ | 4,642,061 | $ | 4,564,888 | $ | 77,173 | ||||||||||||||
|
|
|
|
|
|
|
|||||||||||||||
25
Table of Contents
| 4. | Derivative Instruments (continued) |
The table below displays the Company’s foreign currency denominated debt investment and foreign currency forward contract as of September 30, 2017.
| Debt Investments Denominated in Foreign Currencies | Hedges | |||||||||||||||||||
| As of September 30, 2017 | As of September 30, 2017 | |||||||||||||||||||
| (in thousands) |
Par Value in Local Currency |
Par Value in US$ |
Fair Value | Net Foreign Currency Hedge Amount in Local Currency |
Net Foreign Currency Hedge Amount in U.S. Dollars |
|||||||||||||||
| Canadian Dollars |
C$ | 5,688,847 | $ | 4,605,176 | $ | 4,468,099 | C$ | 5,690,000 | $ | 4,564,888 | ||||||||||
|
|
|
|
|
|
|
|||||||||||||||
| Total |
$ | 4,605,176 | $ | 4,468,099 | $ | 4,564,888 | ||||||||||||||
|
|
|
|
|
|
|
|||||||||||||||
The Company did not have any foreign currency denominated debt investments or foreign currency forward contracts as of December 31, 2016.
| 5. | Fair Value of Financial Instruments |
The Company’s investments were categorized in the fair value hierarchy described in Note 2. “Significant Accounting Policies”, as follows as of September 30, 2017 and December 31, 2016:
| September 30, 2017 | ||||||||||||||||
| Description |
Level 1 | Level 2 | Level 3 | Total | ||||||||||||
| Senior debt |
$ | — | $ | 97,023,163 | $ | 22,139,412 | $ | 119,162,575 | ||||||||
| Subordinated debt |
— | 26,238,660 | — | 26,238,660 | ||||||||||||
| Equity/Other |
— | — | 2,875,999 | 2,875,999 | ||||||||||||
|
|
|
|
|
|
|
|
|
|||||||||
| Total investments |
$ | — | $ | 123,261,823 | $ | 25,015,411 | $ | 148,277,234 | ||||||||
|
|
|
|
|
|
|
|
|
|||||||||
| December 31, 2016 | ||||||||||||||||
| Description |
Level 1 | Level 2 | Level 3 | Total | ||||||||||||
| Senior debt |
$ | — | $ | 49,641,555 | $ | 615,616 | $ | 50,257,171 | ||||||||
| Subordinated debt |
— | 5,878,064 | — | 5,878,064 | ||||||||||||
| Equity/Other |
— | — | 57,548 | 57,548 | ||||||||||||
|
|
|
|
|
|
|
|
|
|||||||||
| Total investments |
$ | — | $ | 55,519,619 | $ | 673,164 | $ | 56,192,783 | ||||||||
|
|
|
|
|
|
|
|
|
|||||||||
In addition, the Company had one derivative, as described in Note 4 “Derivative Instruments,” which was categorized as Level 2 in
the fair value hierarchy as of September 30, 2017.
There were no transfers between Level 1 and Level 2 during the nine months ended September 30, 2017 and year ended December 31, 2016. The carrying value of cash is classified as Level 1 with respect to the fair value hierarchy. At September 30, 2017, the Company held 12 distinct investment positions classified as Level 3, representing an aggregate fair value of $25,015,411 or 16.9% of the total investment portfolio. At December 31, 2016, the Company held two distinct investment positions classified as Level 3, representing an aggregate fair value of $673,164 or 1.2% of the total investment portfolio. The ranges of unobservable inputs used in the fair value measurement of the Company’s Level 3 investments as of September 30, 2017 and December 31, 2016 were as follows:
| As of September 30, 2017 |
||||||||||||||||||||
| Asset Group |
Fair Value (1) |
Valuation Techniques | Unobservable Inputs | Range (Weighted Average) (2) |
Impact to Valuation from an Increase in Input (3) |
|||||||||||||||
| Senior Debt |
$ | 12,671,450 | Discounted Cash Flow | Discount Rate | 6.22% - 12.04% (10.11 | %) | Decrease | |||||||||||||
| 9,467,962 | Cost | N/A | N/A | N/A | ||||||||||||||||
|
|
|
|
|
|||||||||||||||||
| Equity/Other |
2,821,178 | Discounted Cash Flow | Discount Rate | 13.00% (13.00 | %) | Decrease | ||||||||||||||
| 54,821 | Market Comparables | EBITDA Multiple | 8.47x (8.47 | x) | Increase | |||||||||||||||
|
|
|
|||||||||||||||||||
| Illiquidity Discount | 10.00% (10.00 | %) | Decrease | |||||||||||||||||
|
|
|
|||||||||||||||||||
| Total |
$ | 25,015,411 | ||||||||||||||||||
|
|
|
|||||||||||||||||||
26
Table of Contents
| 5. | Fair Value of Financial Instruments (continued) |
| As of December 31, 2016 |
||||||||||||||||||
| Asset Group |
Fair Value (1) |
Valuation Techniques | Unobservable Inputs |
Range (Weighted Average) (2) |
Impact to Valuation from an Increase in Input (3) |
|||||||||||||
| Senior Debt |
$ | 615,616 | Discounted Cash Flow | Discount Rate | 12.95% (12.95 | %) | Decrease | |||||||||||
| EBITDA Multiple | 8.58x (8.58 | x) | Increase | |||||||||||||||
|
|
|
|
|
|||||||||||||||
| Equity/Other |
57,548 | Waterfall | Illiquidity Discounts | 10.00% (10.00 | %) | Decrease | ||||||||||||
| EBITDA Multiple | 8.58x (8.58 | x) | Increase | |||||||||||||||
|
|
|
|
|
|||||||||||||||
| Total |
$ | 673,164 | ||||||||||||||||
|
|
|
|||||||||||||||||
| (1) | Certain investments may be valued at cost for a period of time after an acquisition as the best indicator of fair value. |
| (2) | Weighted average amounts are based on the estimated fair values. |
| (3) | This column represents the directional change in the fair value of the Level 3 investments that would result from an increase to the corresponding unobservable input. A decrease to the input would have the opposite effect. Significant changes in these inputs in isolation could result in significantly higher or lower fair value measurements. |
The preceding tables represent the significant unobservable inputs as they relate to the Company’s determination of fair values for the majority of its investments categorized within Level 3 as of September 30, 2017 and December 31, 2016. In addition to the techniques and inputs noted in the table above, according to the Company’s valuation policy, the Company may also use other valuation techniques and methodologies when determining the fair value estimates for the Company’s investments. Any significant increases or decreases in the unobservable inputs would result in significant increases or decreases in the fair value of the Company’s investments.
Investments that do not have a readily available market value are valued utilizing a market approach, an income approach (i.e. discounted cash flow approach), or both approaches, as appropriate. The market comparables approach uses prices, including third party indicative broker quotes, and other relevant information generated by market transactions involving identical or comparable assets or liabilities (including a business). The income approach uses valuation techniques to convert future amounts (for example, cash flows or earnings) that are discounted based on a required or expected discount rate to derive a single present value amount. The measurement is based on the value indicated by current market expectations about those future amounts. In following these approaches, the types of factors the Company may take into account to determine the fair value of its investments include, as relevant: available current market data, including an assessment of the credit quality of the security’s issuer, relevant and applicable market trading and transaction comparables, applicable market yields and multiples, illiquidity discounts, security covenants, call protection provisions, information rights, the nature and realizable value of any collateral, the portfolio company’s ability to make payments, its earnings and cash flows, the markets in which the portfolio company does business, comparisons of financial ratios of peer companies that are public, data derived from merger and acquisition activities for comparable companies, and enterprise values, among other factors.
The following table provides reconciliations for the three and nine months ended September 30, 2017 of investments for which Level 3 inputs were used in determining fair value:
| Three Months Ended September 30, 2017 | ||||||||||||
| Senior Debt | Equity/Other | Total | ||||||||||
| Fair value balance as of June 30, 2017 |
$ | 2,627,851 | $ | 2,843,971 | $ | 5,471,822 | ||||||
| Additions (1) |
20,447,818 | — | 20,447,818 | |||||||||
| Sales |
(800,326 | ) | — | (800,326 | ) | |||||||
| Net change in unrealized appreciation (depreciation) (2) |
(143,415 | ) | 32,028 | (111,387 | ) | |||||||
| Net discount accretion |
7,484 | — | 7,484 | |||||||||
|
|
|
|
|
|
|
|||||||
| Fair value balance as of September 30, 2017 |
$ | 22,139,412 | $ | 2,875,999 | $ | 25,015,411 | ||||||
|
|
|
|
|
|
|
|||||||
| Change in net unrealized appreciation (depreciation) in investments still held as of September 30, 2017 (2) |
$ | (143,414 | ) | $ | 32,027 | $ | (111,387 | ) | ||||
|
|
|
|
|
|
|
|||||||
27
Table of Contents
| 5. | Fair Value of Financial Instruments (continued) |
| Nine Months Ended September 30, 2017 | ||||||||||||
| Senior Debt | Equity/Other | Total | ||||||||||
| Fair value balance as of December 31, 2016 |
$ | 615,616 | $ | 57,548 | $ | 673,164 | ||||||
| Additions (1) |
22,460,097 | 2,788,133 | 25,248,230 | |||||||||
| Sales |
(800,326 | ) | — | (800,326 | ) | |||||||
| Net change in unrealized appreciation (depreciation) (2) |
(144,661 | ) | 30,318 | (114,343 | ) | |||||||
| Net discount accretion |
8,686 | — | 8,686 | |||||||||
|
|
|
|
|
|
|
|||||||
| Fair value balance as of September 30, 2017 |
$ | 22,139,412 | $ | 2,875,999 | $ | 25,015,411 | ||||||
|
|
|
|
|
|
|
|||||||
| Change in net unrealized appreciation (depreciation) in investments still held as of September 30, 2017 (2) |
$ | (144,660 | ) | $ | 30,317 | $ | (114,343 | ) | ||||
|
|
|
|
|
|
|
|||||||
| (1) | Includes increases in the cost basis of investments resulting from new and add-on portfolio investments. |
| (2) | Included in net change in unrealized appreciation (depreciation) in the statement of operations. |
No securities were transferred into or out of the Level 3 hierarchy during the three and nine months ended September 30, 2017. All realized and unrealized gains and losses are included in earnings and are reported as separate line items within the Company’s statement of operations.
| 6. | Related Party Transactions |
On August 26, 2015 and August 27, 2015, respectively, the Company entered into share purchase agreements for the sale of shares of common stock to each of CNL and KKR for consideration of $5.0 million effective after the Company’s initial registration statement was declared effective by the SEC and prior to acceptance of other shareholders unaffiliated with the Company (the “Founder Stock Agreements” and “Share Purchase Agreements”). On March 1, 2016, the Advisors completed their purchases under the Founder Stock Agreements and Share Purchase Agreements and the Company received $5.0 million. The Company met its minimum offering requirement with proceeds received from CNL and KKR from these share purchase agreements.
As of September 30, 2017 and December 31, 2016, the Advisors owned 5% and 9%, respectively, of the Company’s outstanding shares. CNL is an affiliate of CNL Financial Group, Inc. (“CFG”). All of the Company’s executive officers also serve as executive officers of CNL and/or other CFG affiliates.
The Advisors received distributions from the Company of $81,283 and $243,848 for the three and nine months ended September 30, 2017, respectively, and $78,783 and $187,866 for the three and nine months ended September 30, 2016, respectively.
The Company was a party to a managing dealer agreement with CNL Securities Corp., an affiliate of CNL. CNL Securities Corp. serves as the managing dealer (the “Managing Dealer”) of the Company’s Offering and in connection therewith would receive up-front selling commissions of up to 2.00% of gross offering proceeds, up-front dealer manager fees of up to 2.75% of gross offering proceeds and ongoing distribution and shareholder servicing fees at an annualized rate of 1.25% of the Company’s most recently published net asset value per share, excluding shares issued through the distribution reinvestment plan. All or any portion of these fees may be re-allowed to participating brokers. Financial Industry Regulatory Authority (“FINRA”) Rule 2310 provides that the maximum underwriting compensation payable from any source to FINRA members participating in an offering may not exceed 10% of gross offering proceeds, excluding proceeds from a distribution reinvestment plan.
On March 16, 2017, the board of trustees approved an amended and restated managing dealer agreement (the “Managing Dealer Agreement”) between the Company and the Managing Dealer and approved an amended and restated distribution and shareholder servicing plan for the Company (the “Distribution and Shareholder Servicing Plan”). The new Managing Dealer Agreement and the Distribution and Shareholder Servicing Plan became effective on April 28, 2017, when the post-effective amendment to our registration statement on Form N-2 (File No. 333-199018) describing the new Managing Dealer Agreement and the Distribution and Shareholder Servicing Plan was declared effective by the SEC. The new Managing Dealer Agreement and the Distribution and Shareholder Servicing Plan lowers the ongoing distribution and shareholder servicing fee paid to the Managing Dealer from an annualized rate of 1.25% to an annualized rate of 1.00% of the Company’s net asset value per share. In addition, under the new Managing Dealer Agreement, the Company will cease paying the ongoing distribution and shareholder servicing fee when the total underwriting compensation paid from the upfront selling commissions, upfront dealer manager fees, and ongoing distribution and shareholder servicing fees attributable to our shares equals 8.5% of the aggregate gross offering proceeds from shares sold in the offering, excluding shares issued through the distribution reinvestment plan. The new Managing Dealer Agreement also removed the contingent deferred sales charge upon redemption of Company shares.
28
Table of Contents
| 6. | Related Party Transactions (continued) |
The Company is a party to an investment advisory agreement with CNL (the “Investment Advisory Agreement”) for the overall management of the Company’s activities. CNL is a party to a sub-advisory agreement with KKR (the “Sub-Advisory Agreement”), under which KKR is responsible for the day-to-day management of the Company’s investment portfolio. Pursuant to the Investment Advisory Agreement, CNL earns (i) a management fee equal to an annual rate of 2% of the Company’s average gross assets, and (ii) an incentive fee based on the Company’s performance. The incentive fee consists of (i) a subordinated incentive fee on income and (ii) an incentive fee on capital gains. CNL compensates KKR for advisory services that it provides to the Company with 50% of the fees that CNL receives under the Investment Advisory Agreement.
A subordinated incentive fee on income is payable to the Advisors each calendar quarter if the Company’s pre-incentive fee net investment fee income (as defined in the Investment Advisory Agreement and approved by the Company’s board of trustees) exceeds the 1.75% quarterly preference return to the Company’s shareholders (the ratio of pre-incentive fee net investment income divided by average adjusted capital). The Company did not incur any subordinated incentive fee on income during the quarter or nine months ended September 30, 2017.
The annual incentive fees on capital gains recorded for GAAP purposes are equal to (i) 20% of our realized and unrealized capital gains on a cumulative basis since inception, net of all realized capital losses and unrealized depreciation on a cumulative basis from inception, less (ii) the aggregate amount of any previously paid incentive fees on capital gains. For financial reporting purposes, in accordance with GAAP, the Company includes unrealized appreciation on the investment portfolio in the calculation of incentive fees on capital gains; however, such amounts are not payable by the Company unless and until the net unrealized appreciation is actually realized. The actual amount of incentive fees on capital gains that are due and payable to the Advisors is determined at the end of the calendar year. The Company accrued $303,107 for incentive fees on capital gains as of September 30, 2017.
Under the terms of the Investment Advisory Agreement CNL (and indirectly KKR) is entitled to receive up to 1.5% of gross offering proceeds as reimbursement for organization and offering expenses incurred by the Advisors on behalf of the Company. The Advisors have incurred organization and offering costs of approximately $5.2 million as of September 30, 2017. The Advisors waived the reimbursement of organization and offering expenses in connection with the Company’s gross capital raise received from the Offering from March 1, 2016 (when the Company satisfied the minimum offering requirement) through April 30, 2017 (the “O&O Reimbursement Waiver”). The O&O Reimbursement Waiver did not reduce the amount of organization and offering expenses incurred by the Advisors that are eligible for reimbursement in future periods based on subsequent gross capital raised by the Company after April 30, 2017. Gross capital raised by the Company after April 30, 2017 will be subject to the maximum organization and offering cost reimbursement of 1.5%. The Advisors were entitled to reimbursement of approximately $0.3 million of organization and offering expenses for gross capital raised for the period May 1, 2017 through September 30, 2017, of which approximately $0.2 million had been reimbursed to the Advisors as of September 30, 2017. Organization and offering costs subject to reimbursement will expire three years from the latter of (1) commencement of operations or (2) the date such costs were incurred.
Organization and offering expenses eligible for reimbursement by the Advisors will expire as follows:
| During the quarter ended |
||||
| March 31, 2019 |
$ | 2.2 million | ||
| June 30, 2019 |
0.7 million | |||
| September 30, 2019 |
0.5 million | |||
| December 31, 2019 |
0.5 million | |||
| March 31, 2020 |
0.3 million | |||
| June 30, 2020 |
0.4 million | |||
| September 30, 2020 |
0.3 million | |||
|
|
|
|||
| $ | 4.9 million | |||
|
|
|
|||
In addition, under the terms of the Investment Advisory Agreement, the Advisors are entitled to reimbursement of certain expenses incurred on behalf of the Company including expenses incurred in connection with its investment operations and investment transactions.
The Company is a party to an administrative services agreement with CNL, under which CNL performs, or oversees the performance of, various administrative services on behalf of the Company. Administrative services include investor services, general ledger accounting, fund accounting, maintaining required financial records, calculating the Company’s net asset value, filing tax returns, preparing and filing SEC reports, preparing, printing, and disseminating shareholder reports and generally overseeing the payment of the Company’s expenses and the performance of administrative and professional services rendered to the Company by others. The Company reimburses CNL for administrative expenses it incurs in performing its obligations.
29
Table of Contents
| 6. | Related Party Transactions (continued) |
The Company is a party to an Expense Support and Conditional Reimbursement Agreement, as amended (the “Expense Support Agreement”) with the Advisors pursuant to which the Advisors jointly and severally agree to pay to the Company some or all of its operating expenses (an “Expense Support Payment”) for each month during the Expense Support Payment Period (as defined below) in which the Company’s board of trustees declares a distribution to its shareholders. Expense Support Payments are made in accordance with the terms of the Expense Support Agreement. The “Expense Support Payment Period” commenced on March 1, 2016 and ends on December 31, 2017. The Advisors are entitled to be reimbursed promptly by the Company (a “Reimbursement Payment”) for Expense Support Payments made with respect to any class of common stock, subject to the limitation that no Reimbursement Payment may be made by the Company to the extent that it would cause the Company’s Other Operating Expenses (as defined in the Expense Support Agreement) for such class of common stock to exceed the lesser of (A) 1.75% of average net assets attributable to common shares on an annualized basis after taking such payment into account and (B) the percentage of our average net assets attributable to shares of such class of common stock represented by Other Operating Expenses (as defined in the Expense Support Agreement) during the period in which such Expense Support Payment from the Advisors was made (provided, however, that this clause (B) shall not apply to any reimbursement payment which relates to an Expense Support Payment from the Advisors made during the same period). Notwithstanding anything to the contrary in the Expense Support Agreement, no Reimbursement Payment shall be made with respect to any class of common stock if the effective rate of distributions per share on such class of common stock declared by the Company at the time of such Reimbursement Payment is less than the effective rate of distributions per share on such class of common stock at the time the Expense Support Payment was made to which such Reimbursement Payment relates. For this purpose, “effective rate of distributions per share” means actual declared distribution rate per share exclusive of return of capital, if any. The Company’s obligation to reimburse each Expense Support Payment terminates three years from the date on which such Expense Support Payment was paid or waived by the Advisors.
Related party fees and expenses incurred on behalf of the Company during the three and nine months ended September 30, 2017 and 2016 are summarized below:
| Three Months Ended September 30, |
Nine Months Ended September 30, | |||||||||||||
| Related Party |
Source Agreement & Description |
2017 | 2016 |
2017 | 2016 | |||||||||
| CNL Securities Corp. |
Managing Dealer Agreement: Up-front selling commissions and dealer manager fees |
$ | 653,487 | $920,740 | $ | 2,560,428 | $1,444,446 | |||||||
| Distribution and shareholder servicing fees | 251,611 | 79,074 | 686,677 | 109,816 | ||||||||||
| CNL and KKR |
Investment Advisory Agreement: Base management fees (investment advisory fees) (1) |
628,397 | 165,183 | 1,519,887 | 225,666 | |||||||||
| Incentive fee on capital gains (3) | 109,394 | — | 136,039 | — | ||||||||||
| Organization and offering expense reimbursement | 208,614 | — | 296,453 | — | ||||||||||
| KKR |
Investment Sub-Advisory Agreement: Investment expenses reimbursement (1)(2) |
6,636 | 4,483 | 13,768 | 4,483 | |||||||||
| CNL |
Administrative Services Agreement: Administrative and compliance services (1) |
177,548 | 87,021 | 475,908 | 175,817 | |||||||||
| CNL and KKR |
Expense Support Provided | (606,252 | ) | (603,584) | (1,866,650 | ) | (1,447,589) | |||||||
| (1) | Expenses subject to Expense Support. |
| (2) | Includes reimbursement of fees related to transactional expenses for prospective investments, including fees and expenses associated with performing due diligence reviews of investments that do not close, often referred to as “broken deal” costs. Broken deal costs were approximately $6,159 and $12,215 for the three and nine months ended September 30, 2017, respectively, and approximately $3,171 and $3,772 for the three and nine months ended September 30, 2016, respectively. |
| (3) | Incentive fees on capital gains are included in performance-based incentive fees in the condensed statements of operations. The following table provides additional details for the incentive fee on capital gains for the three and nine months ended September 30, 2017 and 2016: |
30
Table of Contents
| 6. | Related Party Transactions (continued) |
| Three Months Ended September 30, |
Nine Months Ended September 30, |
|||||||||||||||
| Incentive fee on Capital Gains |
2017 | 2016 | 2017 | 2016 | ||||||||||||
| Accrued incentive fee as of beginning of period |
$ | 193,713 | $ | 14,180 | $ | 167,068 | $ | — | ||||||||
| Incentive fee on capital gains during the three and nine months ended September 30, |
109,394 | 96,726 | 136,039 | 110,906 | ||||||||||||
| Less: Incentive fee on capital gains paid to the Advisors during the three and nine months ended September 30, |
— | — | — | — | ||||||||||||
|
|
|
|
|
|
|
|
|
|||||||||
| Accrued incentive fee as of September 30, |
303,107 | 110,906 | 303,107 | 110,906 | ||||||||||||
| Less: Accrued incentive fee on capital gains attributable to unrealized gains as of September 30, |
(303,107 | ) | (110,906 | ) | (303,107 | ) | (110,906 | ) | ||||||||
|
|
|
|
|
|
|
|
|
|||||||||
| Incentive fee on capital gains earned by and payable to the advisors as of September 30, |
$ | — | $ | — | $ | — | $ | — | ||||||||
|
|
|
|
|
|
|
|
|
|||||||||
As of September 30, 2017, the amount of Expense Support Payments provided by the Advisors since inception is approximately $4.1 million. Management believes that reimbursement payments by the Company to the Advisor were not probable under the terms of the Expense Support Agreements as of September 30, 2017.
The following table reflects the Expense Support Payments that may become subject to reimbursement:
| For the quarter ended |
Amount of Expense Support Payment |
Effective Rate of Distributions Per Share (1) |
Reimbursement Eligibility Expires During the Quarter Ended |
Lesser of Other Operating Expenses Ratio or 1.75% (2) |
||||||||||||
| March 31, 2016 |
$ | 204,420 | 6.0 | % | March 31, 2019 | 1.75 | % | |||||||||
| June 30, 2016 |
639,585 | 5.9 | % | June 30, 2019 | 1.75 | % | ||||||||||
| September 30, 2016 |
603,584 | 5.9 | % | September 30, 2019 | 1.75 | % | ||||||||||
| December 31, 2016 |
748,202 | 6.0 | % | December 31, 2019 | 1.75 | % | ||||||||||
| March 31, 2017 |
657,974 | 6.0 | % | March 31, 2020 | 1.75 | % | ||||||||||
| June 30, 2017 |
602,424 | 6.0 | % | June 30, 2020 | 1.75 | % | ||||||||||
| September 30, 2017 |
606,252 | 6.0 | % | September 30, 2020 | 1.75 | % | ||||||||||
|
|
|
|||||||||||||||
| $ | 4,062,441 | |||||||||||||||
|
|
|
|||||||||||||||
| (1) | The effective rate of distributions per share is expressed as a percentage equal to the projected annualized distribution amount as of the end of the applicable period (which is calculated by annualizing the regular weekly cash distribution per share as of such date without compounding), divided by the Company’s public offering price per share as of such date. |
| (2) | Represents the lesser of Other Operating Expenses as defined in the Expense Support Agreement or 1.75% of average net assets on an annualized basis. |
Indemnification - The Investment Advisory Agreement and the Sub-Advisory Agreement contain certain indemnification provisions in favor of the Advisors, their directors, officers, associated persons, and their affiliates. The managing dealer agreement contains certain indemnification provisions in favor of the managing dealer and each participating broker and their respective officers, directors, partners, employees, associated persons, agents and control persons. In addition, the Company’s declaration of trust contains certain indemnification provisions in favor of the Company’s officers, trustees, agents, and certain other persons. As of September 30, 2017, management believed that the risk of incurring any losses for such indemnification was remote.
| 7. | Distributions |
The Company’s board of trustees declared distributions of $0.011250 per share for 39 weekly record dates beginning on January 3, 2017 through and including September 26, 2017. Distributions were paid on January 4, 2017, February 1, 2017, March 1, 2017, March 29, 2017, April 26, 2017, May 31, 2017, June 28, 2017, July 26, 2017, August 30, 2017, and September 27, 2017.
31
Table of Contents
| 7. | Distributions (continued) |
The total and the sources of declared distributions on a GAAP basis for the nine months ended September 30, 2017 and 2016 are presented in the tables below.
| Nine Months Ended September 30, | ||||||||||||||||||||||||
| 2017 | 2016 | |||||||||||||||||||||||
| Per Share | Amount | Allocation | Per Share | Amount | Allocation | |||||||||||||||||||
| Total Declared Distributions |
$ | 0.44 | $ | 4,021,855 | 100.0 | % | $ | 0.34 | $ | 540,791 | 100.0 | % | ||||||||||||
| From net investment income |
0.28 | 2,555,279 | 63.5 | 0.14 | 223,439 | 41.3 | ||||||||||||||||||
| From net realized gains |
0.04 | 367,345 | 9.1 | 0.05 | 71,831 | 13.3 | ||||||||||||||||||
| Distributions in excess of net investment income |
0.12 | 1,099,231 | 27.4 | % | 0.15 | 245,521 | 45.4 | % | ||||||||||||||||
Net investment income includes Expense Support Payments of $1,866,650 and $1,447,589 which supported distributions of $4,021,855 and $540,791 during the nine months ended September 30, 2017 and 2016, respectively. Sources of distributions, other than net investment income and realized gains on a GAAP basis, include (i) the ordinary income component of prior year tax basis undistributed earnings and (ii) required adjustments to GAAP net investment income and realized gains in the current period to determine taxable income available for distributions. The following table summarizes the primary sources of differences between (i) GAAP net investment income and realized gains and (ii) taxable income available for distributions that contribute to tax-related distributions in excess of net investment income for the nine months ended September 30, 2017 and 2016.
| Nine Months Ended September 30, |
2017 (1) | 2016 (1) | ||||||
| Ordinary income component of tax basis undistributed earnings |
$ | 222,877 | $ | — | ||||
| Unearned performance-based incentive fees on unrealized gains |
136,039 | 110,906 | ||||||
| Distribution and shareholder servicing fees |
686,677 | 109,816 | ||||||
| Organization and offering expenses |
296,453 | — | ||||||
|
|
|
|
|
|||||
| Total (1) |
$ | 1,342,046 | $ | 220,722 | ||||
|
|
|
|
|
|||||
| (1) | The above table does not represent all adjustments to calculate taxable income available for distributions. |
For the nine months ended September 30, 2017, the tax-related sources of distributions of $1,342,046 were greater than the distributions in excess of net investment income of $1,099,231. As a result, the Company estimates that none of the distributions declared during the nine months ended September 30, 2017 would be classified as a tax basis return of capital. None of the distributions declared during the year ended December 31, 2016 were classified as a tax basis return of capital.
| 8. | Fee Income |
Fee income, which is nonrecurring, consisted of the following:
| Three Months Ended September 30, |
Nine Months Ended September 30, |
|||||||||||||||
| Fee Income |
2017 | 2016 | 2017 | 2016 | ||||||||||||
| Capital structuring fees |
$ | 332,190 | $ | — | $ | 332,190 | $ | — | ||||||||
| Commitment fees |
— | 4,100 | — | 4,100 | ||||||||||||
| Amendment fees |
4,860 | 402 | 42,052 | 1,549 | ||||||||||||
| Consent fees |
1,494 | 268 | 10,443 | 268 | ||||||||||||
|
|
|
|
|
|
|
|
|
|||||||||
| Total |
$ | 338,544 | $ | 4,770 | $ | 384,685 | $ | 5,917 | ||||||||
|
|
|
|
|
|
|
|
|
|||||||||
32
Table of Contents
| 9. | Share Transactions |
The following table summarizes the total shares issued and proceeds received in connection with the Company’s Offering and Share Purchase Agreements for the nine months ended September 30, 2017 and 2016.
| Nine Months Ended September 30, | ||||||||||||||||
| 2017 | 2016(1) | |||||||||||||||
| Shares | Amount | Shares | Amount | |||||||||||||
| Gross proceeds |
5,599,058 | $ | 54,791,750 | 3,781,001 | $ | 35,896,388 | ||||||||||
| Up-front selling commissions and dealer manager fees |
— | (2,560,428 | ) | — | (1,444,446 | ) | ||||||||||
|
|
|
|
|
|
|
|
|
|||||||||
| Net proceeds to company |
5,599,058 | 52,231,322 | 3,781,001 | 34,451,942 | ||||||||||||
| Reinvestment of distributions |
224,213 | 2,091,455 | 20,021 | 183,613 | ||||||||||||
|
|
|
|
|
|
|
|
|
|||||||||
| Net proceeds |
5,823,271 | $ | 54,322,777 | 3,801,022 | $ | 34,635,555 | ||||||||||
|
|
|
|
|
|
|
|
|
|||||||||
| Average net proceeds per share |
$9.33 | $9.11 | ||||||||||||||
| (1) | Commenced operations on March 1, 2016. |
As of September 30, 2017, the Company has sold or issued 11,767,474 shares of common stock through the Offering, Founder Stock Agreements and Share Purchase Agreements, including reinvestment of distributions, for total gross proceeds of $113,810,187.
As of December 31, 2016, the public offering price of our continuous public offering was $9.75 per share. On February 7, 2017, our board of trustees increased the public offering price of our continuous public offering of common stock from $9.75 per share to $9.80 per share. This increase in our public offering price is effective as of February 7, 2017. As a result of the increase in our public offering price per share, our maximum sales load per share and the net proceeds per share correspondingly increased from $0.463 to $0.466 and from $9.29 to $9.33, respectively.
| 10. | Borrowings |
On July 14, 2017, the Company entered into a senior secured revolving credit agreement (the “Credit Agreement”). The Credit Agreement provides for a revolving credit facility (the “Revolving Credit Facility”) consisting of loans to be made in dollars and other foreign currencies in an initial aggregate principal amount of $70 million. Availability under the Revolving Credit Facility will terminate on July 14, 2019 (the “Revolver Termination Date”) and the outstanding loans under the Revolving Credit Facility will mature on July 14, 2020. The Revolving Credit Facility also requires mandatory prepayment of interest and principal upon certain events during the term-out period commencing on the Revolver Termination Date. The stated borrowing rate under the Revolving Credit Facility is based on LIBOR plus an applicable spread of 2.75% or on an “alternate base rate” (as defined in the Credit Agreement). The Revolving Credit Facility includes an “accordion” feature that allows the Company, under certain circumstances, to increase the size of the facility to a maximum of $200 million. Under the Revolving Credit Facility, the Company has made certain representations and warranties and is required to comply with various covenants, reporting requirements and other customary requirements for similar revolving credit facilities.
As of September 30, 2017, the principal amount outstanding on the Revolving Credit Facility was $31.5 million. There was no principal amount outstanding on the Revolving Credit Facility as of September 30, 2016. The components of interest expense, average interest rates (i.e., base interest rate in effect plus the spread) and average outstanding balances for the Revolving Credit Facility for the three and nine months ended September 30, 2017 and 2016 were as follows:
| Three Months Ended September 30, |
Nine Months Ended September 30, |
|||||||||||||||
| Fee Income |
2017 | 2016 | 2017 | 2016 | ||||||||||||
| Stated interest expense |
$ | 138,058 | $ | — | $ | 138,058 | $ | — | ||||||||
| Unused commitment fees |
165,719 | — | 165,719 | — | ||||||||||||
| Amortization of deferred financing costs |
22,528 | — | 22,528 | — | ||||||||||||
|
|
|
|
|
|
|
|
|
|||||||||
| Total interest expense |
$ | 326,305 | $ | — | $ | 326,305 | $ | — | ||||||||
|
|
|
|
|
|
|
|
|
|||||||||
| Weighted average interest rate |
4.06 | % | — | % | 4.06 | % | — | % | ||||||||
| Average borrowings |
$ | 13,320,652 | $ | — | $ | 4,489,011 | $ | — | ||||||||
The weighted average stated interest rate and weighted average remaining years to maturity of the Company’s outstanding borrowings as of September 30, 2017 were 4.0% and 2.8 years, respectively.
33
Table of Contents
| 11. | Commitment & Contingences |
Unfunded commitments to provide funds to portfolio companies are not recorded in the Company’s condensed statements of assets and liabilities. Since these commitments may expire without being drawn upon, the total commitment amount does not necessarily represent future cash requirements. The Company has sufficient liquidity to fund these commitments. As of September 30, 2017, the Company’s unfunded commitments consisted of the following:
| Category / Company |
||||
| Unfunded Term Loan Commitments: |
||||
| Wheels Up Partners LLC |
$ | 2,757,304 | ||
| Frontline Technologies Group LLC |
889,323 | |||
| Unfunded Revolving Loan Commitments: |
||||
| Smart Modular Technologies, Inc. |
44,373 | |||
| Unfunded Equity Commitments: |
||||
| Polyconcept North America |
25,737 | |||
|
|
|
|||
| Total Unfunded Commitments |
$ | 3,716,737 | ||
|
|
|
|||
The Company funds its commitments as it receives funding notices from the portfolio companies. At September 30, 2017, the Company’s unfunded commitments have a fair value of ($4,781).
In the normal course of business, the Company may enter into guarantees on behalf of portfolio companies. Under these arrangements, the Company would be required to make payments to third parties if the portfolio companies were to default on their related payment obligations. The Company had no such guarantees outstanding at either September 30, 2017 or December 31, 2016.
34
Table of Contents
| 12. | Financial Highlights |
The following is a schedule of financial highlights for one share of common stock during the nine months ended September 30, 2017 and the period from March 1, 2016 (commencement of operations) through September 30, 2016.
| Nine Months Ended September 30, 2017 |
Period Ended September 30, 2016(1) |
|||||||
| OPERATING PERFORMANCE PER SHARE |
||||||||
| Net Asset Value, Beginning of Period |
$ | 9.26 | $ | 9.00 | ||||
|
|
|
|
|
|||||
| Net investment income (loss), before expense support (2) |
0.08 | (0.74 | ) | |||||
| Expense support(2) |
0.20 | 0.88 | ||||||
|
|
|
|
|
|||||
| Net investment income(2) |
0.28 | 0.14 | ||||||
| Net realized and unrealized gains(2)(3) |
0.09 | 0.34 | ||||||
|
|
|
|
|
|||||
| Net increase resulting from investment operations |
0.37 | 0.48 | ||||||
|
|
|
|
|
|||||
| Distributions from net investment income(4) |
(0.28 | ) | (0.14 | ) | ||||
| Distributions from net realized gains(4) |
(0.04 | ) | (0.05 | ) | ||||
| Distributions in excess of net investment income (4)(5) |
(0.12 | ) | (0.15 | ) | ||||
|
|
|
|
|
|||||
| Net decrease resulting from distributions to common shareholders |
(0.44 | ) | (0.34 | ) | ||||
|
|
|
|
|
|||||
| Issuance of common stock above net asset value (6) |
0.04 | 0.03 | ||||||
|
|
|
|
|
|||||
| Net increase resulting from capital share transactions |
0.04 | 0.03 | ||||||
|
|
|
|
|
|||||
| Net Asset Value, End of Period |
$ | 9.23 | $ | 9.17 | ||||
|
|
|
|
|
|||||
| OPERATING PERFORMANCE PER SHARE |
||||||||
| Total Investment Return-Net Price(7) |
4.16 | % | 5.73 | % | ||||
| Total Investment Return-Net Asset Value(8) |
4.46 | % | 5.73 | % | ||||
| RATIOS/SUPPLEMENTAL DATA (all amounts in thousands except ratios) |
||||||||
| Net assets, end of period |
$ | 108,555 | $ | 35,075 | ||||
| Average net assets(9) |
$ | 85,350 | $ | 4,997 | ||||
| Average borrowings(9) |
$ | 4,489 | $ | — | ||||
| Shares outstanding, end of period |
11,767 | 3,823 | ||||||
| Weighted average shares outstanding |
9,232 | 1,646 | ||||||
| Ratios to average net assets:(9) |
||||||||
| Total operating expenses before expense support |
5.71 | % | 11.12 | % | ||||
| Total operating expenses after expense support |
3.53 | % | 1.47 | % | ||||
| Net investment income |
2.99 | % | 1.49 | % | ||||
| Portfolio turnover rate |
60 | % | 13 | % | ||||
| (1) | Commenced operations on March 1, 2016. |
| (2) | The per share data was derived by using the weighted average shares outstanding during the period. |
| (3) | The amount shown at this caption is the balancing figure derived from the other figures in the schedule. The amount shown at this caption for a share outstanding throughout the period may not agree with the change in the aggregate gains and losses in portfolio securities for the period because of the timing of sales of the Company’s shares in relation to fluctuating market values for the portfolio. |
| (4) | The per share data for distributions is the actual amount of distributions paid or payable per share of common stock outstanding during the entire period; distributions per share are rounded to the nearest $0.01. |
| (5) | See Note 7. “Distributions” for further information on the source of distributions from other than net investment income and realized gains. |
| (6) | The continuous issuance of common stock may cause an incremental increase in net asset value per share due to the sale of shares at the then prevailing public offering price and the receipt of net proceeds per share by the Company in excess of net asset value per share on each subscription closing date. The per share data was derived by computing (i) the sum of (A) the number of shares issued in connection with subscriptions and/or distribution reinvestment on each share transaction date times (B) the differences between the net proceeds per share and the net asset value per share on each share transaction date, divided by (ii) the total shares outstanding at the end of the period. |
| (7) | Total investment return-net price is a measure of total return for shareholders who purchased the Company’s common stock at the beginning of the period, including distributions declared during the period. Total investment return-net price is based on (i) the purchase of one share at the public offering price, net of sales load, on the first day of the period, (ii) the sale at the net asset value per share on the last day of the period, of (A) one share plus (B) any fractional shares issued in connection with the reinvestment of monthly distributions, and (iii) distributions payable relating to one share, if any, on the last day of the period. The total investment return-net price calculation assumes that (i) monthly cash distributions are reinvested in accordance with the Company’s distribution reinvestment plan and (ii) the fractional shares issued pursuant to the distribution reinvestment plan are issued at the then current public offering price, net of sales load, on each monthly distribution payment date. Since there is no public market for the Company’s shares, the terminal sales price per share is assumed to be equal to the net asset value per share on the last day of the period presented. The Company’s performance changes over time and currently may be different than that shown above. Past performance is no guarantee of future results. Investment performance is presented without regard to sales load that may be incurred by shareholders in the purchase of the Company’s shares of common stock. Total investment return is not annualized. |
35
Table of Contents
| 12. | Financial Highlights (continued) |
| (8) | Total investment return-net asset value is a measure of the change in total value for shareholders who held the Company’s common stock at the beginning and end of the period, including distributions declared during the period. Total investment return-net asset value is based on (i) net asset value per share on the first day of the period, (ii) the net asset value per share on the last day of the period, of (A) one share plus (B) any fractional shares issued in connection with the reinvestment of monthly distributions, and (iii) distributions payable relating to one share, if any, on the last day of the period. The total investment return-net asset value calculation assumes that (i) monthly cash distributions are reinvested in accordance with the Company’s distribution reinvestment plan and (ii) the fractional shares issued pursuant to the distribution reinvestment plan are issued at the then current public offering price, net of sales load, on each monthly distribution payment date. Since there is no public market for the Company’s shares, terminal market value per share is assumed to be equal to net asset value per share on the last day of the period presented. The Company’s performance changes over time and currently may be different than that shown above. Past performance is no guarantee of future results. Investment performance is presented without regard to sales load that may be incurred by shareholders in the purchase of the Company’s shares of common stock. Total investment return is not annualized. |
| (9) | The computation of average net assets during the period is based on the daily value of net assets and borrowing balances, respectively. Ratios are not annualized. |
| 13. | Subsequent Events |
During the period from October 1, 2017 through November 8, 2017, the Company received additional net proceeds of approximately $4.4 million from its Offering, including amounts through its distribution reinvestment plan.
The Company’s board of trustees declared distributions of $0.011250 per share for nine record dates beginning October 3, 2017 through November 28, 2017.
36
Table of Contents
| Item 2. | Management’s Discussion and Analysis of Financial Condition and Results of Operations |
The following discussion is based on the unaudited condensed financial statements as of September 30, 2017 and December 31, 2016, and for the three and nine months ended September 30, 2017 and 2016. Amounts as of December 31, 2016 included in the unaudited condensed financial statements have been derived from the audited financial statements as of that date. This information should be read in conjunction with the accompanying unaudited condensed financial statements and the notes thereto, as well as, the audited financial statements, notes and management’s discussion and analysis of financial condition and results of operations included in our Annual Report on Form 10-K for the period ended December 31, 2016. Capitalized terms used in this Item 2 have the same meaning as in the accompanying unaudited condensed financial statements in Item 1 unless otherwise defined herein.
Statement Regarding Forward-Looking Information
The following information contains statements that constitute forward-looking statements within the meaning of Section 27A of the Securities Act of 1933, as amended (the “Securities Act”), and Section 21E of the Securities Exchange Act of 1934, as amended (the “Exchange Act”). These statements generally are characterized by the use of terms such as “may,” “should,” “plan,” “anticipate,” “estimate,” “intend,” “predict,” “believe” and “expect” or the negative of these terms or other comparable terminology. Although we believe that the expectations reflected in such forward-looking statements are based upon reasonable assumptions, our actual results could differ materially from those set forth in the forward-looking statements. Some factors that might cause such a difference include the following: persistent economic weakness at the global or national level, increased direct competition, changes in government regulations or accounting rules, changes in local, national and global capital market conditions, our ability to obtain or maintain credit lines or credit facilities on satisfactory terms, changes in interest rates, availability of proceeds from our offering of shares, our ability to identify suitable investments, our ability to close on identified investments, our ability to obtain or maintain our qualification as a regulated investment company and as a business development company, the ability of our Advisors (defined below) and their affiliates to attract and retain highly talented professionals, inaccuracies of our accounting estimates, the ability of our Advisors to locate suitable borrowers for our loans and the ability of such borrowers to make payments under their respective loans. Given these uncertainties, we caution you not to place undue reliance on such statements, which apply only as of the date hereof. We undertake no obligation to publicly release the results of any revisions to these forward-looking statements that may be made to reflect future events or circumstances or to reflect the occurrence of unanticipated events. The forward-looking statements should be read in light of the risk factors identified in the “Risk Factors” section of our Annual Report on Form 10-K filing for the period ended December 31, 2016 and Item 1A in Part II of this Quarterly Report.
The forward-looking statements and projections contained in this report are excluded from the safe harbor protection provided by Section 27A of the Securities Act and Section 21E of the Exchange Act.
Overview
We are a non-diversified closed-end management investment company that has elected to be treated as a business development company under the Investment Company Act of 1940 (as amended, the “1940 Act”). We commenced operations on March 1, 2016 when it satisfied its minimum offering requirement. Formed as a Delaware statutory trust on August 12, 2014, we are externally managed by CNL Fund Advisors II, LLC (“CNL”) and KKR Credit Advisors (US) LLC (“KKR,” together with CNL, the “Advisors”), which are collectively responsible for sourcing potential investments, conducting due diligence on prospective investments, analyzing investment opportunities, structuring investments, determining the securities and other assets that the we will purchase, retain or sell and monitoring our portfolio on an ongoing basis. Both of our Advisors are registered as investment advisers with the SEC. CNL also provides the administrative services necessary for our Company to operate. We have elected to be taxed as a regulated investment company (“RIC”) under the Internal Revenue Code of 1986, as amended (the “Code”) and operated in a manner as to qualify to tax treatments applicable to RICs.
Investment Objective, Investment Program, and Primary Investment Types
Our investment objective is to provide our shareholders with current income and, to a lesser extent, long-term capital appreciation. We pursue our investment objective by investing primarily in the debt of privately owned and thinly traded U.S. companies (also referred to as “portfolio companies”) with a focus on originated transactions sourced through the networks of our Advisors. We also have the ability, as granted through a SEC exemptive order dated June 19, 2017, to co-invest in privately negotiated transactions alongside other investment funds managed by or affiliated with KKR. We define directly originated transactions as any investment where our Advisors negotiate the terms of the transaction beyond just the price, which, for example, may include negotiating financial covenants, maturity dates or interest rate terms (the “Directly Originated Investments”). Additionally, we have the ability to participate in other originated transactions where there may be third parties involved, or a bank acting as an intermediary, for a closely held club, or similar transaction. We refer to Directly Originated Investments and other originated transactions together as our “Originated Strategies.” A substantial portion of our portfolio will consist of senior and subordinated debt, which we believe offer potential opportunities for attractive risk-adjusted returns and income generation. Our debt investments may take the form of corporate loans or bonds, may be secured or unsecured and may, in some cases, be accompanied by warrants, options or other forms of equity participation. We may separately purchase common or preferred equity interests in transactions. We may also co-invest with third parties through partnerships, joint ventures or other entities, thereby acquiring jointly controlled or non-controlling interests in certain investments in conjunction with participation by one or more parties in such investment.
37
Table of Contents
Our investment strategy is focused on creating and growing an investment portfolio that generates superior risk-adjusted returns by carefully selecting investments through rigorous due diligence and actively managing and monitoring our investment portfolio. When evaluating an investment and the related portfolio company, we use the resources of our Advisors to develop an investment thesis and a proprietary view of a potential portfolio company’s intrinsic value. We believe our flexible approach to investing allows us to take advantage of opportunities that offer favorable risk/reward characteristics.
We primarily focus on the following investment types:
| • | Senior Debt. We invest in senior debt, in which we generally take a security interest in the available assets of the portfolio company, including equity interests in any of its subsidiaries. These investments generally take the form of senior secured first lien loans, senior secured second lien loans or other senior secured debt. In some circumstances, our lien could be subordinated to claims of other creditors. |
| • | Subordinated Debt. Our subordinated debt investments are generally subordinated to senior debt and are generally unsecured. These investments are generally structured with interest-only payments throughout the life of the security, with the principal due at maturity. |
| • | Equity Investments. We also make selected equity investments. In addition, when we invest in senior and subordinated debt, we may acquire warrants or options to purchase equity securities or benefit from other types of equity participation. Our goal is ultimately to dispose of these equity securities and realize gains upon our disposition of such interests. |
| • | Convertible Securities. We may invest in convertible securities, such as bonds, debentures, notes, preferred stocks or other securities that may be converted into, or exchanged for, a specified amount of common stock of the same or different issuer within a particular period of time at a specified price or formula. |
| • | Investments in Private Investment Funds. We may invest in, or wholly own, private investment funds, including hedge funds, private equity funds, limited liability companies, REITs, and other business entities. In valuing our investments in private investment funds, we rely primarily on information provided by managers of such funds. Valuations of illiquid securities, such as interests in certain private investment funds, involve various judgments and consideration of factors that may be subjective. There is a risk that inaccurate valuations provided by managers of private investment funds could adversely affect the value of our common stock. We may not be able to withdraw our investment in certain private investment funds promptly after we have made a decision to do so, which may result in a loss to us and adversely affect our investment returns. |
| • | Derivatives. We may invest in various types of derivatives, including total return swaps, interest rate swaps and foreign currency forward contracts and options. |
| • | Investments with Third-Parties. We may co-invest with third parties through partnerships, joint ventures or other entities, thereby acquiring jointly-controlled or non-controlling interests in certain investments in conjunction with participation by one or more third parties in such investment. Such joint venture partners or third party managers may include former KKR personnel or associated persons. |
The level of our investment activity can and will vary substantially from period to period depending on many factors, including: the amount of capital we have available for investment, the availability of credit to finance investment transactions, the demand for debt from creditworthy privately owned U.S. companies, the level of merger, acquisition and refinancing activity involving private companies, the general economic environment and the competitive investment environment for the types of investments we intend to make. Based on prevailing market conditions, we anticipate that we will invest the proceeds from the periodic sale of our common stock within 30-90 days. The precise timing will depend on the availability of investment opportunities that are consistent with our investment objective and strategies. Any distributions we make during such period may be substantially lower than the distributions that we expect to pay when our portfolio is fully invested.
As a business development company, we are required to comply with certain regulatory requirements. For instance, we may not acquire any assets other than “qualifying assets” as specified in the 1940 Act unless at least 70% of our total assets are qualifying assets as determined at the end of the prior quarter (with certain limited exceptions). Qualifying assets include investments in “eligible portfolio companies.” Under the relevant SEC rules, the term “eligible portfolio company” includes all U.S. private companies, U.S. companies whose securities are not listed on a national securities exchange, and certain U.S. public companies that have listed their securities on a national securities exchange and have a market capitalization of less than $250 million. These rules also permit us to include as qualifying assets certain follow-on investments in companies that were eligible portfolio companies at the time of initial investment but no longer meet the definition of eligible portfolio company at the time of the follow-on investment.
38
Table of Contents
Revenues
We generate revenue primarily in the form of interest on the debt securities of portfolio companies that we acquire and hold for investment purposes. We expect that our investments in debt securities will generally have an expected maturity of three to ten years, although we have no lower or upper constraint on maturity, and we expect to earn interest at a fixed or floating rate. Interest on our debt securities is generally payable to us quarterly or semi-annually. In some cases, the debt investments may partially defer cash interest payments with payment-in-kind provisions. Any outstanding principal amount of our debt securities and any accrued but unpaid interest will generally become due at the maturity date. In addition, we may generate revenue in the form of dividends from equity investments, prepayment fees, amendment fees, origination fees, and fees for providing significant managerial assistance.
Operating Expenses
Our primary operating expenses include an investment advisory fee, administrative expenses, custodian and accounting fees, distribution and shareholder servicing fees, other third-party professional services and expenses and, depending on our operating results, performance-based incentive fees. The investment advisory fee and performance-based incentive fees compensate the Advisors for their services in identifying, evaluating, negotiating, closing and monitoring our investments.
Financial and Operating Highlights
The following table presents financial and operating highlights as of September 30, 2017 and December 31, 2016, and for the nine months ended September 30, 2017 and 2016:
| September 30, | December 31, | |||||||
| As of |
2017 | 2016 | ||||||
| Total assets |
$ | 157,442,154 | $ | 63,292,295 | ||||
| Adjusted total assets (Total assets, net of payable for investments purchased) |
$ | 141,827,535 | $ | 56,044,176 | ||||
| Investments in portfolio companies |
$ | 148,277,234 | $ | 56,192,783 | ||||
| Borrowings |
$ | 31,500,000 | $ | — | ||||
| Net assets |
$ | 108,555,393 | $ | 55,017,291 | ||||
| Net asset value per share |
$ | 9.23 | $ | 9.26 | ||||
| September 30, | ||||||||
| Activity for the nine months ended |
2017 | 2016 | ||||||
| Average net assets |
$ | 85,350,193 | $ | 14,997,441 | ||||
| Average borrowings under credit facility |
$ | 4,489,011 | $ | — | ||||
| Purchases of investments |
$ | 145,852,978 | $ | 32,768,960 | ||||
| Sales, principal payments and other exits |
$ | 54,984,518 | $ | 1,583,921 | ||||
| Net investment income |
$ | 2,555,279 | $ | 223,439 | ||||
| Net realized gains on investments and foreign currency transactions |
$ | 367,345 | $ | 71,831 | ||||
| Net change in unrealized appreciation on investments and foreign currency translation |
$ | 314,556 | $ | 482,699 | ||||
| Net increase in net assets resulting from operations |
$ | 3,237,180 | $ | 777,969 | ||||
| Total distributions declared |
$ | 4,021,855 | $ | 540,791 | ||||
| Net investment income before unearned incentive fees per share |
$ | 0.29 | $ | 0.20 | ||||
| Net investment income per share |
$ | 0.28 | $ | 0.14 | ||||
| Earnings per share |
$ | 0.35 | $ | 0.47 | ||||
| Distributions declared per share outstanding for the entire period |
$ | 0.44 | $ | 0.34 | ||||
| September 30, | ||||||||
| Summary of Common Stock Offering for the nine months ended |
2017 | 2016 | ||||||
| Gross proceeds, excluding reinvestment of distributions |
$ | 54,791,750 | $ | 35,896,388 | ||||
| Net proceeds to Company, excluding reinvestments of distributions |
$ | 52,231,322 | $ | 34,451,942 | ||||
| Reinvestment of distributions |
$ | 2,091,455 | $ | 183,613 | ||||
| Average net proceeds per share |
$ | 9.33 | $ | 9.11 | ||||
| Shares issued in connection with Offering, excluding reinvestments of distributions |
5,599,058 | 3,781,001 | ||||||
| Shares issued in connection with reinvestment of distributions |
224,213 | 20,021 | ||||||
39
Table of Contents
Business Environment
In the second quarter 2017, the SEC issued an order granting co-investment exemptive relief to us. The order permits us to participate in Directly Originated Transactions and the opportunity to participate in those investments alongside Corporate Capital Trust, and KKR’s institutional clients and proprietary funds. This will provide our shareholders access to additional investment opportunities.
In addition to the ability to co-invest, the order also allows us to invest in transactions where KKR has greater control over the structure and terms of deals than was otherwise permissible under the 1940 Act. This provides us an opportunity to create more value for our shareholders through proprietary sourcing, credit selection, underwriting and ongoing monitoring. Since obtaining co-investment exemptive relief from the SEC, we began to increase our focus on Originated Strategies, including Directly Originated Transactions, as a main element of our investment strategy.
The search for yield continues among global investors and this is driving the spread between yields on corporate credit and historically lower yielding investment alternatives, close to all-time tight levels. For example, we see that the yield-to-worst for European BB rated high yield bonds is now approximately the same as 10-year US Treasuries.
Another market dynamic at play is one of supply versus demand. More specifically, the increase in demand for yield has been concurrent with an increase in the proportion of investors seeking to access investments via more liquid structures (ETFs and mutual funds). High-yield ETF growth, in terms of assets since 2011, has been 124% versus market growth of 37%. Leveraged loans ETF growth was over 6,000% versus market growth of 92% over the same period. This significant demand growth in more liquid structures has occurred at a time when traditional market liquidity supply sources have been weak. For example, investor levels at investment-bank dealing desks have reduced over 85% since 2007.
Given this mismatch in supply versus demand, compounded by a mismatch in asset and fund liquidity in more liquid structures, market prices today can often be more determined by credit flows (and investor sentiment) in the liquid market, than the underlying credit quality of the borrowers themselves.
In contrast to this dynamic in the liquid market, our focus is on originated investments that offer an illiquidity premium. We believe the risk-adjusted returns today come from investing in names that are somewhat isolated from the liquidity-driven market dynamics discussed above, and from our ability to hold investments long term. We believe Corporate Capital Trust II is a vehicle for investors to access this premium and because of our closed-end structure, not incur the mismatch of fund versus asset liquidity found in more liquid structures.
In addition to our focus on originated investments, we believe Corporate Capital Trust II’s ability to co-invest alongside other KKR funds allows us to focus on larger originated investments to the upper-middle market. Through being able to underwrite and make larger investments in the upper-middle market, we see better supply/demand dynamics and believe investing in these upper-middle market opportunities offers us risk-adjusted returns while generally providing better credit protections including stronger covenants, reporting and amortization requirements from our borrowers.
Portfolio and Investment Activity
Portfolio Investment Activity for the three and nine months ended September 30, 2017 and 2016
The following table summarizes our investment activity as of September 30, 2017 and December 31, 2016 and for the three and nine months ended September 30, 2017 and 2016:
| Investment Portfolio | ||||||||
| September 30, 2017 | December 31, 2016 | |||||||
| Total fair value |
$ | 148,277,234 | $ | 56,192,783 | ||||
| No. portfolio companies |
71 | 55 | ||||||
| No. debt investments |
80 | 58 | ||||||
| No. equity/other investments |
2 | 1 | ||||||
| Weighted average annual yield of debt investments (1) |
8.2 | % | 8.3 | % | ||||
| (1) | The weighted average annual yield for our debt investments is computed as (i) the sum of (a) the annual interest rate of each accruing debt investment multiplied by its par amount as of the end of the applicable reporting period, plus (b) the annual amortization of the purchase or original issue discount or premium of accruing each debt investment, if any; divided by (ii) the total amortized cost of all accruing debt investments included in the calculated group as of the end of the applicable reporting period. The yield on our investments does not represent the return to our shareholders. |
40
Table of Contents
| Investment Portfolio Activity Summary | ||||||||||||||||
| Three Months Ended September 30, |
Nine Months Ended September 30, |
|||||||||||||||
| 2017 | 2016 | 2017 | 2016 | |||||||||||||
| Purchases of investments: |
||||||||||||||||
| First lien senior secured loans |
$ | 35,343,936 | $ | 20,724,037 | $ | 88,340,734 | $ | 26,873,347 | ||||||||
| Second lien senior secured loans |
9,364,470 | 2,672,060 | 23,066,980 | 5,568,214 | ||||||||||||
| Other senior secured debt |
3,540,865 | — | 3,540,865 | — | ||||||||||||
| Subordinated debt |
15,915,020 | — | 28,116,265 | 264,975 | ||||||||||||
| Equity/Other |
— | 62,424 | 2,788,134 | 62,424 | ||||||||||||
|
|
|
|
|
|
|
|
|
|||||||||
| Total |
$ | 64,164,291 | $ | 23,458,521 | $ | 145,852,978 | $ | 32,768,960 | ||||||||
|
|
|
|
|
|
|
|
|
|||||||||
| Sales, principal payments and other exits: |
||||||||||||||||
| First lien senior secured loans |
$ | 10,452,883 | $ | 1,245,975 | $ | 36,840,310 | $ | 1,245,975 | ||||||||
| Second lien senior secured loans |
2,933,399 | 112,224 | 9,824,610 | 112,224 | ||||||||||||
| Subordinated debt |
1,598,170 | 204,084 | 8,319,598 | 225,722 | ||||||||||||
|
|
|
|
|
|
|
|
|
|||||||||
| Total |
$ | 14,984,452 | $ | 1,562,283 | $ | 54,984,518 | $ | 1,583,921 | ||||||||
|
|
|
|
|
|
|
|
|
|||||||||
| Portfolio Company Additions |
20 | 13 | 36 | 45 | ||||||||||||
| Portfolio Company Exits |
5 | 2 | 20 | 2 | ||||||||||||
| Debt Investment Additions |
26 | 18 | 56 | 55 | ||||||||||||
| Debt Investment Exits |
14 | 5 | 35 | 7 | ||||||||||||
As discussed above under “— Overview,” since obtaining co-investment exemptive relief from the SEC, we have begun to increase our focus on Originated Strategies, including Directly Originated Transactions, as a main element of our investment strategy. Directly Originated Transactions give us the opportunity to participate in those investments alongside KKR’s institutional clients and proprietary funds.
The following summarizes our investment activity associated with our investment focus on new originated debt investments during the nine months ended September 30, 2017 and the status of originated investments held in the Investment Portfolio as of September 30, 2017:
| Directly Originated Transactions Activity for the Nine Months Ended |
2017 | |||
| Number of investments, by issuer |
6 | |||
| Total amount of investments, at cost (1) |
$ | 21,025,173 | ||
| Percentage of total investment activity |
14.4 | % | ||
| Fee income recognized in connection with directly originated investments |
$ | 332,190 | ||
| Originated Strategies Transactions Activity for the Nine Months Ended |
2017 | |||
| Number of investments, by issuer |
5 | |||
| Total amount of investments, at cost (1) |
$ | 4,698,821 | ||
| Percentage of total investment activity |
3.2 | % | ||
| Directly Originated Investment Summary as of |
September 30, 2017 | |||
| Total investments, at fair value |
$ | 20,845,850 | ||
| Percentage of total investment portfolio, at fair value |
14.1 | % | ||
| Weighted average annual yield of debt investments (2)(3) |
8.7 | % | ||
| Originated Strategies Investment Summary as of |
September 30, 2017 | |||
| Total investments, at fair value |
$ | 4,774,611 | ||
| Percentage of total investment portfolio, at fair value |
3.2 | % | ||
| Weighted average annual yield of debt investments (2)(3) |
10.4 | % | ||
| (1) | The total amount of investments, at cost, includes new issuers during the reporting periods and any follow-on investments from existing issuers. |
| (2) | The weighted average annual yield on debt investments is based on amortized cost as of the end of the applicable period. The weighted average annual yield for our debt investments is computed as (i) the sum of (a) the annual interest rate of each accruing debt investment multiplied by its par amount as of the end of the applicable reporting period, plus (b) the annual amortization of the purchase or original issue discount or premium of accruing each debt investment, if any; divided by (ii) the total amortized cost of all accruing debt investments included in the calculated group as of the end of the applicable reporting period. |
| (3) | The weighted average annual yield of originated debt investments is higher than what investors in our Company will realize because it does not reflect expenses of the Company or any sales load. Total investment return – net price and total investment return – net asset value were 4.16% and 4.46%, respectively, for the nine months ended September 30, 2017 and 5.73% and 5.73%, respectively, for the nine months ended September 30, 2016. See Note 12. “Financial Highlights” in our unaudited condensed financial statements for information on how such returns were calculated. |
41
Table of Contents
The changes in the fair value of our investment portfolio are directly related to (i) the changes in their cost basis as a result of incremental purchases and (ii) the changes in fair value for assets held at the beginning and end of the period. The net change in unrealized appreciation for the nine months ended September 30, 2017 was $314,556. See “Results of Operations – Net Change in Unrealized Appreciation or Depreciation” below for further details relating to the changes.
| September 30, 2017 | December 31, 2016 | |||||||||||||||
| Asset Category |
Amortized Cost | Fair Value | Amortized Cost | Fair Value | ||||||||||||
| Senior debt |
||||||||||||||||
| First lien senior secured loans |
$ | 89,694,336 | $ | 89,682,463 | $ | 39,078,146 | $ | 39,685,517 | ||||||||
| Second lien senior secured loans |
25,500,795 | 25,931,872 | 10,433,488 | 10,571,654 | ||||||||||||
| Other senior secured debt |
3,540,621 | 3,548,240 | — | — | ||||||||||||
|
|
|
|
|
|
|
|
|
|||||||||
| Total senior debt |
118,735,752 | 119,162,575 | 49,511,634 | 50,257,171 | ||||||||||||
| Subordinated debt |
25,721,007 | 26,238,660 | 5,881,541 | 5,878,064 | ||||||||||||
| Equity/Other |
2,850,558 | 2,875,999 | 62,424 | 57,548 | ||||||||||||
|
|
|
|
|
|
|
|
|
|||||||||
| Total |
$ | 147,307,317 | $ | 148,277,234 | $ | 55,455,599 | $ | 56,192,783 | ||||||||
|
|
|
|
|
|
|
|
|
|||||||||
The weighted average yield on debt investments at amortized cost and fair value held in our investment portfolio as of September 30, 2017 and December 31, 2016 were as follows:
| September 30, 2017 | December 31, 2016 | |||||||
| Asset Category |
Investment Portfolio at Amortized Cost (2) |
Investment Portfolio at Amortized Cost (2) |
||||||
| Senior debt (1) |
||||||||
| First lien senior secured loans |
8.0 | % | 8.4 | % | ||||
| Second lien senior secured loans |
9.6 | % | 9.1 | % | ||||
| Other senior secured debt |
6.6 | % | — | % | ||||
| Subordinated debt(1) |
7.6 | % | 6.4 | % | ||||
| (1) | The weighted average yield on debt investments is based on amortized cost as of the end of the applicable period. The weighted average yield for our debt investments is computed as, (i) the sum of (a) the annual interest rate of each accruing debt investment multiplied by its par amount as of the end of the applicable reporting period, plus (b) the annual amortization of the purchase or original issue discount or premium of each accruing debt investment, if any; divided by (ii) the total amortized cost of all accruing debt investments included in the calculated group as of the end of the applicable reporting period. |
| (2) | The yield on our investments does not represent the return to our shareholders. |
The following table presents a summary of interest rate and maturity statistics for the debt investments, based on par value, in our investment portfolio as of September 30, 2017 and December 31, 2016:
| Floating interest rate debt investments: |
September 30, 2017 |
December 31, 2016 |
||||||
| Percent of debt portfolio |
80.7 | % | 89.8 | % | ||||
| Percent of floating rate debt investments with interest rate floors |
99.9 | % | 100.0 | % | ||||
| Weighted average interest rate floor |
1.0 | % | 1.0 | % | ||||
| Weighted average coupon spread to base rate |
592 | bps | 572 | bps | ||||
| Weighted average years to maturity |
5.0 | 5.2 | ||||||
| Fixed interest rate debt investments: |
||||||||
| Percent of debt portfolio |
19.3 | % | 10.2 | % | ||||
| Weighted average coupon rate |
8.1 | % | 7.43 | % | ||||
| Weighted average years to maturity |
6.4 | 5.3 | ||||||
All of our floating interest rate debt investments have base rate reset frequencies of less than twelve months with the majority resetting at least quarterly. USD three-month LIBOR, the most prevalent index employed among our floating interest rate debt investments, ranged between 1.00% and 1.33%, and 0.61% and 0.87% during the nine months ended September 30, 2017 and 2016, respectively, and was 1.33% and 0.99% on September 30, 2017 and December 31, 2016, respectively. Base rate resets for floating interest rate investments will only result in interest income increases when the reset base interest rate exceeds the associated interest rate floor.
42
Table of Contents
Our weighted forward looking annual yield on debt investments was 8.2% and 8.3% as of September 30, 2017 and December 31, 2016, respectively. Total investment return -net price and total investment return-net asset value were 4.16% and 4.46%, respectively, for the nine months ended through September 30, 2017. See Note 12. “Financial Highlights” in our unaudited condensed financial statements.
The following table shows the credit ratings of the investments in our investment portfolio, based upon the rating scale of Standard & Poor’s Ratings Services, as of September 30, 2017 and December 31, 2016:
| September 30, 2017 | December 31, 2016 | |||||||||||||||
| Standard & Poor’s rating |
Fair Value | Percentage of Portfolio |
Fair Value | Percentage of Portfolio |
||||||||||||
| BBB- |
$ | 9,181 | 0.0 | % | $ | — | — | % | ||||||||
| BB |
— | — | 1,399,495 | 2.5 | ||||||||||||
| BB- |
4,625,312 | 3.1 | 993,992 | 1.8 | ||||||||||||
| B+ |
5,322,797 | 3.6 | 11,455,615 | 20.4 | ||||||||||||
| B |
38,183,941 | 25.7 | 18,309,957 | 32.5 | ||||||||||||
| B- |
32,624,175 | 22.0 | 10,978,083 | 19.5 | ||||||||||||
| CCC+ |
35,131,937 | 23.7 | 8,887,616 | 15.8 | ||||||||||||
| CCC |
7,832,111 | 5.3 | 2,445,781 | 4.4 | ||||||||||||
| CCC- |
825,931 | 0.6 | 1,664,696 | 3.0 | ||||||||||||
| Not Rated |
23,721,849 | 16.0 | 57,548 | 0.1 | ||||||||||||
|
|
|
|
|
|
|
|
|
|||||||||
| Total |
$ | 148,277,234 | 100.0 | % | $56,192,783 | 100.0 | % | |||||||||
|
|
|
|
|
|
|
|
|
|||||||||
The following table presents a summary of our investment portfolio arranged by industry classifications of the portfolio companies as of September 30, 2017 and December 31, 2016:
| September 30, 2017 | December 31, 2016 | |||||||||||||||
| Industry Classification |
Fair Value |
Percentage of Portfolio |
Fair Value |
Percentage of Portfolio |
||||||||||||
| Software & Services |
$ | 33,308,488 | 22.5 | % | $ | 7,657,545 | 13.6 | % | ||||||||
| Retailing |
22,653,601 | 15.3 | 7,443,502 | 13.2 | ||||||||||||
| Capital Goods |
22,280,386 | 15.0 | 12,571,442 | 22.5 | ||||||||||||
| Materials |
20,385,801 | 13.7 | 2,292,220 | 4.1 | ||||||||||||
| Health Care Equipment & Services |
9,939,039 | 6.7 | 5,777,348 | 10.3 | ||||||||||||
| Commercial & Professional Services |
9,603,821 | 6.5 | 4,673,366 | 8.3 | ||||||||||||
| Media |
8,593,825 | 5.8 | 1,914,534 | 3.4 | ||||||||||||
| Consumer Services |
7,929,890 | 5.3 | 3,387,303 | 6.0 | ||||||||||||
| Transportation |
5,029,139 | 3.4 | 526,795 | 0.9 | ||||||||||||
| Semiconductors & Semiconductor Equipment |
3,342,475 | 2.3 | — | — | ||||||||||||
| Pharmaceuticals, Biotechnology & Life Sciences |
1,722,530 | 1.2 | 262,572 | 0.5 | ||||||||||||
| Food & Staples Retailing |
1,110,197 | 0.7 | 2,263,161 | 4.0 | ||||||||||||
| Consumer Durables & Apparel |
1,026,593 | 0.7 | 1,012,382 | 1.8 | ||||||||||||
| Telecommunications Services |
589,935 | 0.4 | 1,589,068 | 2.8 | ||||||||||||
| Technology Hardware & Equipment |
580,681 | 0.4 | 2,264,964 | 4.0 | ||||||||||||
| Food, Beverage & Tobacco |
180,833 | 0.1 | 1,561,466 | 2.8 | ||||||||||||
| Utilities |
— | — | 995,115 | 1.8 | ||||||||||||
|
|
|
|
|
|
|
|
|
|||||||||
| Total |
$ | 148,277,234 | 100.0 | % | $ | 56,192,783 | 100.0 | % | ||||||||
|
|
|
|
|
|
|
|
|
|||||||||
All portfolio companies held at September 30, 2017 were denominated in U.S. dollars except for one portfolio company, which was denominated in Canadian dollars and represented 3.0% of the investment portfolio. All portfolio companies held at December 31, 2016 were denominated in U.S. dollars.
Capital Resources and Liquidity
Sources and Uses of Capital
Our capital resources and liquidity are primarily derived from (i) equity capital proceeds from our Offering, (ii) cash flows from operations, including sales and repayments, (iii) our distribution reinvestment plan, (iv) Expense Support Payments received from our Advisors, and (v) borrowings from our Revolving Credit Facility effective July 2017. Our primary uses of funds include (i) investments in debt of portfolio companies, (ii) distributions to our shareholders, (iii) advisory fees, (iv) interest payments and (v) operating expenses. We expect to use proceeds from the turnover of our investment portfolio, proceeds from borrowings under our Revolving Credit Facility and equity capital proceeds from our Offering to finance our investment activities.
43
Table of Contents
We may borrow funds to make investments, including before we have fully invested the proceeds of our Offering, to the extent we determine that leveraging our portfolio would be appropriate. On July 14, 2017, we entered into a senior secured revolving credit agreement. See Note 10. “Borrowings” in our unaudited condensed financial statements for information regarding the credit agreement.
Liquidity
During the nine months ended September 30, 2017, proceeds from sales of investments and principal payments totaled $55.0 million. In addition, distributions reinvested in the Company as a percentage of total distributions and distributions reinvested for the nine months ended September 30, 2017 was 49% and $2.1 million. As of September 30, 2017, we had approximately $5.6 million of cash.
In addition to liquidity derived from cash flows from operations, including investment sales and repayments, our distribution reinvestment plan and Expense Support Payments received from our Advisors, we continue to raise capital through our Offering. As of September 30, 2017, we had approximately 264 million additional shares of common stock available for sale through the Offering. Proceeds from any sales of these shares will provide us additional liquidity. During the period from October 1, 2017 through November 8, 2017, we received additional net proceeds of approximately $4.4 million from our Offering, including amounts reinvested through our distribution reinvestment plan.
On March 16, 2017, the board of trustees approved an amended and restated Managing Dealer Agreement between the Company and the Managing Dealer and approved an amended and restated Distribution and Shareholder Servicing Plan for the Company (the “Plan”). The new Managing Dealer Agreement and the Plan became effective on April 28, 2017, when the post-effective amendment to our registration statement on Form N-2 (File No. 333-199018) describing the new Managing Dealer Agreement and the Plan was declared effective by the SEC. The new Managing Dealer Agreement and the Plan lowers the ongoing distribution and shareholder servicing fee paid to the Managing Dealer from an annualized rate of 1.25% to an annualized rate of 1.00% of our net asset value per share. In addition, under the new Managing Dealer Agreement, we will cease paying the ongoing distribution and shareholder servicing fee when the total underwriting compensation paid from the upfront selling commissions, upfront dealer manager fees, and ongoing distribution and shareholder servicing fees attributable to our shares equals 8.5% of the aggregate gross offering proceeds from shares sold in the offering, excluding shares issued through the distribution reinvestment plan. The new Managing Dealer Agreement also removed the contingent deferred sales charge upon redemption of Company shares.
Borrowings
On July 14, 2017, we entered into a senior secured revolving credit agreement (the “Credit Agreement”). The Credit Agreement provides for a revolving credit facility (the “Revolving Credit Facility”) consisting of loans to be made in dollars and other foreign currencies in an initial aggregate principal amount of $70 million. Availability under the Revolving Credit Facility will terminate on July 14, 2019 (the “Revolver Termination Date”) and the outstanding loans under the Revolving Credit Facility will mature on July 14, 2020. The Revolving Credit Facility also requires mandatory prepayment of interest and principal upon certain events during the term-out period commencing on the Revolver Termination Date. The stated borrowing rate under the Revolving Credit Facility is based on LIBOR plus an applicable spread of 2.75% or on an “alternate base rate” (as defined in the Credit Agreement). The Revolving Credit Facility includes an “accordion” feature that allows the Company, under certain circumstances, to increase the size of the facility to a maximum of $200 million. Under the Revolving Credit Facility, we have made certain representations and warranties and is required to comply with various covenants, reporting requirements and other customary requirements for similar revolving credit facilities. During the nine months ended September 30, 2017, we borrowed $31.5 million from the Revolving Credit Facility. Additionally, during the period from October 1, 2017 through November 8, 2017, we borrowed an additional $10.0 million. We have and will continue to use proceeds from borrowings to make investments in portfolio companies.
For the nine months ended September 30, 2017, our total all-in cost of financing, including fees and expenses, was 10.1%. We did not have any borrowings outstanding during the nine months ended September 30, 2016.
Commitments and Contingencies
See Note 11. “Commitments and Contingencies” in our unaudited condensed financial statements for information on our commitments and contingencies as of September 30, 2017.
44
Table of Contents
Distributions to Shareholders
We pay monthly distributions to our shareholders in the form of cash. Shareholders may elect to reinvest their distributions as additional shares of our common stock under our distribution reinvestment plan. Dividends are taxable to our shareholders even if they are reinvested in additional shares of our common stock. The following table reflects the cash distributions per share and the total amount of distributions that we have declared on our common stock during the nine months ended September 30, 2017 and 2016:
| Per Share | Amount | |||||||
| Quarter ended: |
||||||||
| March 31, 2017 (13 record dates) |
$ | 0.146250 | $ | 1,020,988 | ||||
| June 30, 2017 (13 record dates) |
0.146250 | 1,394,636 | ||||||
| September 30, 2017 (13 record dates) |
0.146250 | 1,606,231 | ||||||
|
|
|
|
|
|||||
| $ | 0.438750 | $ | 4,021,855 | |||||
|
|
|
|
|
|||||
| Quarter ended: |
||||||||
| March 31, 2016 (5 record dates) |
$ | 0.054520 | $ | 30,301 | ||||
| June 30, 2016 (13 record dates) |
0.141752 | 125,022 | ||||||
| September 30, 2016 (13 record dates) |
0.141752 | 385,468 | ||||||
|
|
|
|
|
|||||
| $ | 0.338024 | $ | 540,791 | |||||
|
|
|
|
|
|||||
Approximately 52% of the distributions declared during the nine months ended September 30, 2017 were reinvested in shares of our common stock by participants through our dividend reinvestment plan and the reinvested distributions represent an additional source of capital to us. See Note 7. “Distributions” in our unaudited condensed financial statements for additional disclosures on distributions.
We had sufficient taxable income to support 100% of our declared distributions during the year ended December 31, 2016. We do not expect to use equity capital to pay distributions to shareholders in the future nor do we expect any portion of our distributions paid in 2017 to be treated as a return of capital for tax purposes. We routinely disclose the sources of funds used to pay distributions to our shareholders in periodic reports that accompany (i) quarterly account statements and (ii) monthly distribution checks that are prepared and sent directly by our transfer agent to our shareholders. See Note 7. “Distributions” in our unaudited condensed financial statements for a discussion of the sources of funds used to pay distributions on a GAAP basis for the periods presented.
Expense Support and Reimbursement Arrangements with Our Advisors
The Advisors have incurred on our behalf organization and offering expenses totaling approximately $5.2 million as of September 30, 2017. Under the terms of the Investment Advisory and Sub-Advisory Agreements, respectively, upon satisfaction of the minimum offering requirement, CNL and KKR are entitled to receive up to 1.50% of gross proceeds raised in our offering until all organization and offering costs funded by CNL and KKR or its affiliates have been recovered. Offering expenses consist of costs incurred by CNL and KKR and their affiliates on our behalf for legal, accounting, printing and other offering expenses, including costs associated with technology integration between our systems and those of our participating broker-dealers, permissible due diligence reimbursements, marketing expenses, salaries and direct expenses of CNL’s and KKR’s employees, employees of their affiliates and others while engaged in registering and marketing the shares, which includes development of marketing materials and marketing presentations and training and educational meetings and generally coordinating the marketing process for us. Any such reimbursements will not exceed actual expenses incurred by CNL and KKR and their affiliates. CNL and KKR are responsible for the payment of our organization and offering expenses to the extent that these expenses exceed 1.5% of the gross proceeds from the Offering, without recourse against or reimbursement by us.
The Advisors waived all reimbursement of organization and offering expenses to which they are entitled to from March 1, 2016 (the date we satisfied the “minimum offering requirement”) through April 30, 2017. The waiver of the reimbursement requirements did not reduce the amount of organization and offering expenses incurred by the Advisors that is eligible for reimbursement in future periods. The Advisor’s waiver of organization and offering expense reimbursement temporarily reduced our operating expenses. The Advisors were entitled to reimbursement of approximately $0.3 million of organization and offering expenses for gross capital raise for the period May 1, 2017 through September 30, 2017, of which approximately $0.2 million had been reimbursed to the Advisors as of September 30, 2017. After the expiration of the waiver period on April 30, 2017, we began reimbursement of organization and offering expenses.
45
Table of Contents
We have entered into an Expense Support and Conditional Reimbursement Agreement (as amended, the “Expense Support Agreement”) with the Advisors pursuant to which the Advisors jointly and severally agree to pay to us some or all operating expenses (an “Expense Support Payment”) for each month during the Expense Support Payment Period (as defined below) in which our board of trustees declares a distribution to our shareholders. The “Expense Support Payment Period” began on March 1, 2016, the date our minimum offering requirement was satisfied, and ends on December 31, 2017. The Advisors are entitled to be reimbursed promptly by us (a “Reimbursement Payment”) for Expense Support Payments made with respect to any class of common stock, subject to the limitation that no Reimbursement Payment may be made by us to the extent that it would cause our Other Operating Expenses (as defined in the Expense Support Agreement) for such class of common stock to exceed the lesser of (A) 1.75% of average net assets attributable to common shares on an annualized basis after taking such payment into account and (B) the percentage of our average net assets attributable to shares of such class of common stock represented by Other Operating Expenses (as defined in the Expense Support Agreement) during the period in which such Expense Support Payment from the Advisors was made (provided, however, that this clause (B) shall not apply to any reimbursement payment which relates to an Expense Support Payment from the Advisors made during the same period). Additionally, reimbursement payments shall only be made to the extent that they do not exceed estimated taxable income taxes before reimbursement. Notwithstanding anything to the contrary in the Expense Support Agreement, no Reimbursement Payment shall be made with respect to any class of common stock if the effective rate of distributions per share on such class of common stock declared by us at the time of such Reimbursement Payment is less than the effective rate of distributions per share on such class of common stock at the time the Expense Support Payment was made to which such Reimbursement Payment relates. For this purpose, “effective rate of distributions per share” means actual declared distribution rate per share exclusive of return of capital, if any. The eligibility for reimbursement by us of Expense Support Payments will terminate three years from the date on which such Expense Support Payment was paid or waived. As of September 30, 2017, the amount of Expense Support Payments provided by the Advisors since inception is $4.1 million.
Results of Operations
As of September 30, 2017, the fair value of our investment portfolio totaled $148.3 million. The majority of our investments at September 30, 2017 consisted of debt investments. See the section entitled “Portfolio and Investment Activity” above for a discussion of the general terms and characteristics of our investments, and for information regarding investment activities during the nine months ended September 30, 2017 and 2016.
The following is a summary of our operating results for the three and nine months ended September 30, 2017 and 2016:
| Three Months Ended September 30, |
Nine Months Ended September 30, |
|||||||||||||||
| 2017 | 2016 | 2017 | 2016 | |||||||||||||
| Total investment income |
$ | 2,542,365 | $ | 331,643 | $ | 5,566,038 | $ | 444,161 | ||||||||
| Net operating expense (1) |
(1,543,587 | ) | (175,800 | ) | (3,010,759 | ) | (220,722 | ) | ||||||||
|
|
|
|
|
|
|
|
|
|||||||||
| Net investment income |
998,778 | 155,843 | 2,555,279 | 223,439 | ||||||||||||
|
|
|
|
|
|
|
|
|
|||||||||
| Net realized gains |
60,487 | 71,463 | 367,345 | 71,831 | ||||||||||||
| Net change in unrealized appreciation |
486,479 | 412,913 | 314,556 | 482,699 | ||||||||||||
|
|
|
|
|
|
|
|
|
|||||||||
| Net increase in net assets resulting from operations |
$ | 1,545,744 | $ | 640,219 | $ | 3,237,180 | $ | 777,969 | ||||||||
|
|
|
|
|
|
|
|
|
|||||||||
| (1) | Net of expense support of $0.6 million, $1.9 million, $0.6 million and $1.4 million for the three and nine months ended September 30, 2017 and 2016, respectively. |
Investment income
Investment income consisted of the following for the three and nine months ended September 30, 2017 and 2016:
| Three Months Ended September 30, |
Nine Months Ended September 30, |
|||||||||||||||
| 2017 | 2016 | 2017 | 2016 | |||||||||||||
| Interest income |
$ | 2,203,821 | $ | 326,873 | $ | 5,181,353 | $ | 438,244 | ||||||||
| Fee income |
338,544 | 4,770 | 384,685 | 5,917 | ||||||||||||
|
|
|
|
|
|
|
|
|
|||||||||
| Total investment income |
$ | 2,542,365 | $ | 331,643 | $ | 5,566,038 | $ | 444,161 | ||||||||
|
|
|
|
|
|
|
|
|
|||||||||
As of September 30, 2017, our weighted average annual yield on our accruing debt investments was 8.2% based on amortized cost, as defined above in “Portfolio and Investment Activity.” The weighted average annual yield on debt investments is higher than what investors in our Company will realize because it does not reflect expenses of the Company or any sales load. As of September 30, 2017, approximately 80.7% of our debt investments had floating rate interest; therefore, changes in interest rates could have a material impact on our interest income in the future. Our fee income consists of transaction-based fees and is non-recurring. The increase in fee income during the three months ended September 30, 2017 is related to capital structuring fees earned on directly originated investments. See Note 8. “Fee Income” in our unaudited condensed financial statements for additional information on fee income. See Item 3. “Quantitative and Qualitative Disclosures about Market Risk” for further information on the impact interest rate changes could have on our results of operations.
46
Table of Contents
We commenced investment operations on March 1, 2016. Interest income for the nine months ended September 30, 2017 and 2016 was $5.2 million and $0.4 million, respectively. The increase in interest income was due primarily to the growth of our portfolio of investments. We had investments at fair value of $148.3 million and $31.8 million as of September 30, 2017 and 2016, respectively. We believe that our interest income is not representative of either our stabilized performance or our future performance. We expect an increase in interest income in future periods due to an increasing base of investments that we expect to result from the expected increase in capital available for investment as related to our Offering.
Operating expenses
Our operating expenses for the three and nine months ended September 30, 2017 and 2016 were as follows:
| Three Months Ended September 30, |
Nine Months Ended September 30, |
|||||||||||||||
| 2017 | 2016 | 2017 | 2016 | |||||||||||||
| Investment advisory fees |
$ | 628,397 | $ | 165,183 | $ | 1,519,887 | $ | 225,666 | ||||||||
| Professional services |
64,212 | 129,162 | 495,628 | 600,304 | ||||||||||||
| Administrative services |
327,037 | 127,974 | 719,875 | 268,582 | ||||||||||||
| Custodian and accounting fees |
89,623 | 48,977 | 243,262 | 113,568 | ||||||||||||
| Interest expense |
326,305 | — | 326,305 | — | ||||||||||||
| Trustee fees and expenses |
52,123 | 49,017 | 155,437 | 114,017 | ||||||||||||
| Organization expenses |
117,334 | — | 205,173 | — | ||||||||||||
| Insurance |
42,397 | 40,191 | 122,936 | 64,498 | ||||||||||||
| Performance-based incentive fees |
109,394 | 96,726 | 136,039 | 110,906 | ||||||||||||
| Distribution and shareholder servicing fees |
251,611 | 79,074 | 686,677 | 109,816 | ||||||||||||
| Offering expense |
91,280 | — | 91,280 | — | ||||||||||||
| Other |
50,126 | 43,080 | 174,910 | 60,954 | ||||||||||||
|
|
|
|
|
|
|
|
|
|||||||||
| Total operating expenses |
2,149,839 | 779,384 | 4,877,409 | 1,668,311 | ||||||||||||
| Expense support |
(606,252 | ) | (603,584 | ) | (1,866,650 | ) | (1,447,589 | ) | ||||||||
|
|
|
|
|
|
|
|
|
|||||||||
| Net operating expenses |
$ | 1,543,587 | $ | 175,800 | $ | 3,010,759 | $ | 220,722 | ||||||||
|
|
|
|
|
|
|
|
|
|||||||||
Operating expenses were offset partially by the Advisors’ Expense Support Payments. We consider the following expense categories to be relatively fixed in the near term: administrative services, trustee fees and expenses and custodian and accounting fees. Variable operating expenses include professional services, investment advisory fees, performance–based incentive fees, distribution and shareholder servicing fees, and a component of other operating expenses related to transfer agency services and shareholder services. We expect these variable operating expenses to increase either in connection with the growth in the asset base (investment advisory fees, performance-based incentive fees, organization and offering fees, and interest expense), the number of shareholders and open accounts (transfer agency services and shareholder services, distribution and shareholder servicing fees) and the complexity of our investment processes and capital structure (professional services).
Organization and offering expenses
Organization expenses and other operating expenses relating to the formation of the Company are expensed on our statement of operations. Offering expenses will be capitalized on our statements of assets and liabilities as deferred offering expenses and expensed to our statement of operations over a 12-month period, noting, however, the deferral period will not exceed 12 months from the date the Advisors incurred the offering expenses.
Investment advisory fees and performance-based incentive fee
Our investment advisory fees are calculated at an annual rate of 2% of our average gross assets.
Our Advisors are also eligible to receive incentive fees based on our performance. Our performance-based incentive fees, which are comprised of two parts, consisted of the following for the three and nine months ended September 30, 2017 and 2016:
| Three Months Ended September 30, |
Nine Months Ended September 30, |
|||||||||||||||
| 2017 | 2016 | 2017 | 2016 | |||||||||||||
| Subordinated incentive fee on income |
$ | — | $ | — | $ | — | $ | — | ||||||||
| Incentive fee on capital gains |
109,394 | 96,726 | 136,039 | 110,906 | ||||||||||||
|
|
|
|
|
|
|
|
|
|||||||||
| Total performance-based incentive fees |
$ | 109,394 | $ | 96,726 | $ | 136,039 | $ | 110,906 | ||||||||
|
|
|
|
|
|
|
|
|
|||||||||
A subordinated incentive fee on income is payable to our Advisors each calendar quarter if our pre-incentive fee net investment fee income (as defined in the Investment Advisory Agreement and approved by our board of trustees) exceeds the 1.75% quarterly preference return to our shareholders (the ratio of pre-incentive fee net investment income divided by average adjusted capital). We did not incur any subordinated incentive fee on income during the nine months ended September 30, 2017.
47
Table of Contents
The annual incentive fees on capital gains recorded for GAAP purposes is equal to (i) 20% of our realized and unrealized capital gains on a cumulative basis since inception, net of all realized capital losses and unrealized depreciation on a cumulative basis from inception, less (ii) the aggregate amount of any previously paid incentive fees on capital gains. For financial reporting purposes, in accordance with GAAP, we include unrealized appreciation on our investment portfolio in the calculation of incentive fees on capital gains; however, such amounts are not payable by us unless and until the net unrealized appreciation is actually realized. A significant portion of incentive fees on capital gains is accrued with respect to net unrealized appreciation in our investment portfolio, although no such incentive fee is actually payable by us with respect to such net unrealized appreciation unless and until the net unrealized appreciation is actually realized in a cumulative amount that exceeds any unrealized depreciation in our portfolio. The actual amount of incentive fees on capital gains that are due and payable to the Advisors is determined at the end of the calendar year. As of September 30, 2017, the cumulative realized gains were $0.5 million and the unrealized depreciation on our investment portfolio was $1.0 million, therefore the Advisors have not received, nor earned, any payment of incentive fees on capital gains since inception of the Company.
See “—Contractual Obligations —Investment Advisory Agreements,” below for further details about the performance-based incentive fees.
Net realized gains
For the nine months ended September 30, 2017 and 2016, we had proceeds from sales of investments of $41.7 million and $1.47 million and recognized $361,567 and $71,831 in realized gains from the sale of investments, respectively.
Net change in unrealized appreciation or depreciation
For the three and nine months ended September 30, 2017 and 2016, net unrealized appreciation (depreciation) consisted of the following:
| Three Months Ended September 30, |
Nine Months Ended September 30, |
|||||||||||||||
| 2017 | 2016 | 2017 | 2016 | |||||||||||||
| Investments |
$ | 410,134 | $ | 410,639 | $ | 232,733 | $ | 480,425 | ||||||||
| Derivative instruments |
77,173 | — | 77,173 | — | ||||||||||||
| Foreign currency translation |
(828 | ) | 2,274 | 4,650 | 2,274 | |||||||||||
|
|
|
|
|
|
|
|
|
|||||||||
| Total net unrealized appreciation |
$ | 486,479 | $ | 412,913 | $ | 314,556 | $ | 482,699 | ||||||||
|
|
|
|
|
|
|
|
|
|||||||||
For the three and nine months ended September 30, 2017 and 2016, net change in unrealized appreciation and depreciation on investments consisted of the following:
| Three Months Ended September 30, |
Nine Months Ended September 30, |
|||||||||||||||
| 2017 | 2016 | 2017 | 2016 | |||||||||||||
| Net change in unrealized appreciation (depreciation) on investments: |
||||||||||||||||
| Unrealized appreciation |
$ | 645,998 | $ | 408,517 | $ | 1,048,221 | $ | 525,773 | ||||||||
| Unrealized depreciation |
(235,864 | ) | 2,122 | (815,488 | ) | (45,348 | ) | |||||||||
|
|
|
|
|
|
|
|
|
|||||||||
| Total net unrealized appreciation |
$ | 410,134 | $ | 410,639 | $ | 232,733 | $ | 480,425 | ||||||||
|
|
|
|
|
|
|
|
|
|||||||||
We are not aware of any material trends or uncertainties, favorable or unfavorable, that may be reasonably anticipated to have a material impact on either capital resources or the revenues or income to be derived from our investments, other than those described above, the risk factors, if any, identified in Part II, Item 1A of this report, and the “Management’s Discussion and Analysis of Financial Condition and Results of Operations” and “Risk Factors” sections of our Annual Report on Form 10-K for the period ended December 31, 2016.
48
Table of Contents
Adjusted net investment income
Our net investment income totaled $998,778 (or $0.09 per share) and $2,555,279 (or $0.28 per share) for the three and nine months ended September 30, 2017, respectively. As described above in “Investment advisory fees and performance-based incentive fees,” we accrue estimated performance-based incentive fees with respect to any net realized and unrealized appreciation in our investment portfolio. The performance-based incentive fees are treated as an operating expense and therefore are a deduction in calculating our net investment income on a GAAP basis. However, our net realized and unrealized appreciation on our investment portfolio that partly determine these fees are not included in net investment income. Therefore, in order to evaluate our net investment income without regard to realized and unrealized appreciation in our investment portfolio, including the impact of related accrued performance-based fees, we have developed a supplemental, non-GAAP measure, which we refer to as “adjusted net investment income,” which presents net investment income before the effects of unearned performance-based incentive fees. Adjusted net investment income is also impacted by the Expense Support Payments and reimbursements.
We believe that adjusted net investment income is useful to assess the sustainability of our distributions and operating performance. Adjusted net investment income is not necessarily indicative of cash flows available to fund cash needs and should not be considered as an alternative to net investment income as an indication of our performance, as an alternative to cash flows from operations as an indication of our liquidity, or indicative of funds available to fund our cash needs including our ability to make future distributions to our shareholders. Adjusted net investment income should not be construed as an historic performance measure or as more relevant or accurate than the current GAAP methodology in calculating net investment income and its applicability in evaluating our operating performance.
The following table presents a reconciliation of our net investment income to adjusted net investment income for the three and nine months ended September 30, 2017 and 2016.
| Three Months Ended September 30, |
Nine Months Ended September 30, |
|||||||||||||||
| 2017 | 2016 | 2017 | 2016 | |||||||||||||
| Net investment income (GAAP) |
$ | 998,778 | $ | 155,843 | $ | 2,555,279 | $ | 223,439 | ||||||||
| Deduct: Expense Support |
(606,252 | ) | (603,584 | ) | (1,866,650 | ) | (1,447,589 | ) | ||||||||
| Add: Estimated unearned performance-based incentive fees |
109,394 | 91,429 | 136,039 | 105,609 | ||||||||||||
|
|
|
|
|
|
|
|
|
|||||||||
| Adjusted net investment income (loss) (non-GAAP) |
$ | 501,920 | $ | (356,312 | ) | $ | 824,668 | $ | (1,118,541 | ) | ||||||
|
|
|
|
|
|
|
|
|
|||||||||
| Net investment income per share (GAAP) |
$ | 0.09 | $ | 0.06 | $ | 0.28 | $ | 0.14 | ||||||||
|
|
|
|
|
|
|
|
|
|||||||||
| Adjusted net investment income (loss) per share (non-GAAP) |
$ | 0.05 | $ | (0.13 | ) | $ | 0.09 | $ | (0.68 | ) | ||||||
|
|
|
|
|
|
|
|
|
|||||||||
Net Assets, Net Asset Value per Share and Annual Investment Return and Total Return Since Inception
Net assets increased $53.54 million and $34.87 million during the nine months ended September 30, 2017 and 2016, respectively. The most significant increase in net assets during the nine months ended September 30, 2017 and 2016 was attributable to capital transactions including the issuance of shares of common stock of $54.32 million and $34.64 million, respectively. Our operations resulted in net assets increasing $3.24 million and $0.78 million during the nine months ended September 30, 2017 and 2016, respectively. Our overall increase in net assets was partially offset by distributions to shareholders in the amount of $4.02 million and $0.54 million during the nine months ended September 30, 2017 and 2016, respectively.
Our net asset value per share was $9.23 and $9.17 on September 30, 2017 and 2016, respectively. After considering (i) the overall changes in net asset value per share, (ii) distributions paid of approximately $0.44 and $0.34 per share during the nine months ended September 30, 2017 and 2016, respectively, and (iii) the assumed reinvestment of those distributions at 95.25% of the prevailing offering price per share, the total investment return was 4.46% and 5.73% (not annualized) for shareholders who held our shares over the entire nine months ended September 30, 2017 and 2016, respectively.
Initial shareholders who subscribed to our initial offering in March 2016 with an initial investment of $10,000 and an initial purchase price equal to $9.45 per share (public offering price including all sales loads) have seen the value of their investment grow by 7.9% (see charts below). Initial shareholders who subscribed to our initial offering in March 2016 with an initial investment of $10,000 and an initial purchase price equal to $9.00 per share (the initial public offering price excluding sales load and distribution and shareholder servicing fees) have registered a total investment return of 15.4% (see charts below). The S&P/LSTA Leveraged Loan Index, a primary measure of senior debt covering the U.S. leveraged loan market, which currently consists of approximately 1,100 credit facilities throughout numerous industries, and the Merrill Lynch US High Yield Master II Index, a primary measure of subordinated debt consisting of approximately 2,000 high yield corporate bonds, registered cumulative total returns of approximately 14.7% and 26.1%, respectively, in the period from March 1, 2016 to September 30, 2017.
49
Table of Contents
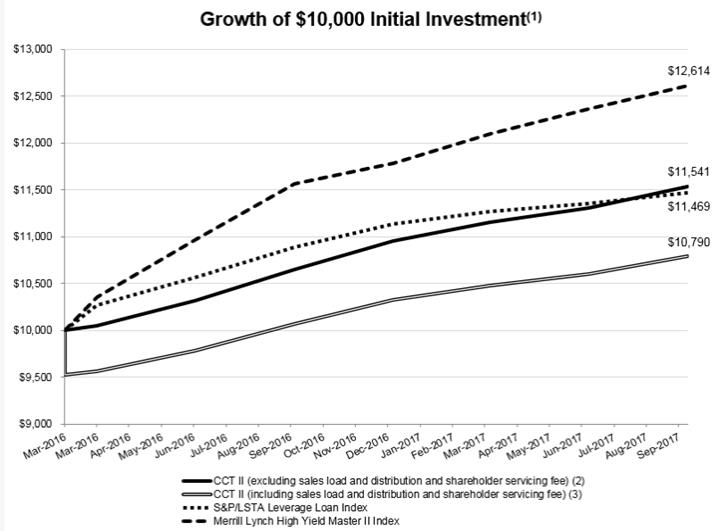
| (1) | Cumulative performance: March 1, 2016 to September 30, 2017. |
| (2) | Excludes upfront sales load and distribution and shareholder servicing fee. |
| (3) | Includes upfront sales load and distribution and shareholder servicing fee. |
The calculations for the Growth of $10,000 Initial Investment in the shares of our common stock are based upon (i) an initial investment of $10,000 in our common stock at the beginning of the period at a share price of $9.45 per share (including sales load and distribution and shareholder servicing fees) and $9.00 per share (excluding sales load and distribution and shareholder servicing fees), (ii) assumed reinvestment of monthly distributions in accordance with our distribution reinvestment plan, (iii) the sale of the entire investment position at the net asset value per share on the last day of the period; and (iv) distributions payable, if any, on the last day of the period.
50
Table of Contents
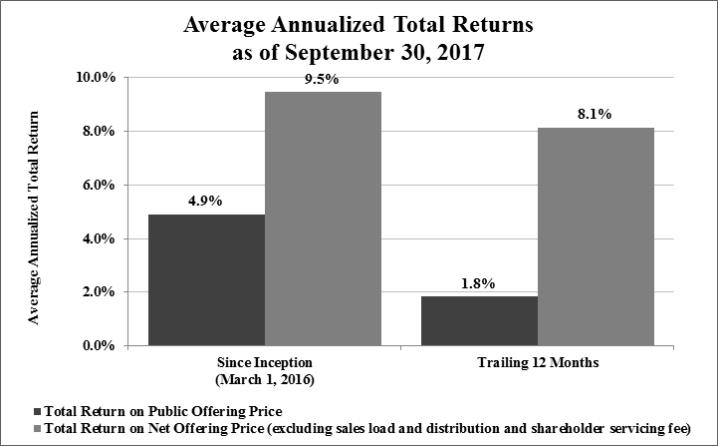
| Since Inception (March 1, 2016) |
Trailing 12 Months | |||||||
| Public Offering Price/Share |
$ | 9.45 | $ | 9.65 | ||||
| Net Offering Price/Share |
$ | 9.00 | $ | 9.19 | ||||
| Distributions/Share |
$ | 0.92 | $ | 0.58 | ||||
| Terminal Value/Share (NAV) |
$ | 9.23 | $ | 9.23 | ||||
In the chart above, we also present the average annual returns for the trailing 12 months, assuming (i) the purchase of shares of common stock at the public offering price and net offering price (95.25% of public offering price) at the beginning of the period, (ii) reinvestment of distributions in the common stock, (iii) a terminal value at September 30, 2017 equal to net asset value of $9.23 per share and (iv) distributions payable to shareholders as of September 30, 2017.
Our shares are illiquid investments for which there is currently not a secondary market. You should not expect to be able to resell your shares regardless of how we perform. If you are able to sell your shares, you will likely receive less than your purchase price. Our net asset value and annualized returns — which are based in part upon determinations of fair value of Level 3 investments by our board of trustees, not active market quotations — are inherently uncertain. Past performance is not a guarantee of future results.
Critical Accounting Policies and Estimates
Our discussion and analysis of our financial condition and results of operations are based upon our unaudited condensed financial statements which have been prepared in accordance with GAAP. The preparation of our unaudited condensed financial statements requires management to make estimates and assumptions that affect the reported amounts of assets, liabilities, revenues and expenses. Note 2. “Significant Accounting Policies” to our unaudited condensed financial statements describes the significant accounting policies and methods used in the preparation of our financial statements. We consider the accounting policies listed below to be critical because they involve management judgments and assumptions, require estimates about matters that are inherently uncertain and are important for understanding and evaluating our reported financial results. These judgments affect (i) the reported amounts of assets and liabilities, (ii) our disclosure of contingent assets and liabilities as of the dates of the financial statements and (iii) the reported amounts of revenue and expenses during the reporting periods. With different estimates or assumptions, materially different amounts could be reported in our financial statements. Changes in the economic environment, financial markets and any other parameters used in determining such estimates could cause actual results to differ materially from the amounts reported based on these policies.
51
Table of Contents
Valuation of Investments and Unrealized Gain (Loss) – Our investments consist primarily of investments in senior and subordinated debt of private U.S. companies and are presented in our financial statements at fair value. See Note 3. “Investments,” in our unaudited condensed financial statements for more information on our investments. As described more fully in Note 2. “Significant Accounting Policies” and Note 5. “Fair Value of Financial Instruments” in our unaudited condensed financial statements, a valuation hierarchy based on the level of independent, objective evidence available regarding value is used to measure the fair value of our investments. Investments for which market quotations are readily available are valued using market quotations, which are generally obtained from independent pricing services, broker-dealers or market makers. With respect to our portfolio investments for which market quotations are not readily available, our board of trustees is responsible for determining in good faith the fair value of our portfolio investments in accordance with, and the consistent application of, the valuation policy and procedures approved by the board of trustees, based on, among other things, the input of our Advisors, audit committee and independent third-party valuation firms.
We utilize several valuation techniques that use unobservable inputs and assumptions in determining the fair value of our Level 3 investments. For senior debt, subordinated debt and structured products categorized as Level 3 investments, we initially value the investment at its transaction price and subsequently value using (i) market data for similar instruments (e.g., recent transactions or indicative broker quotes), (ii) comparisons to benchmark derivative indices and/or (iii) valuation models. Valuation models are based on yield analysis and discounted cash flow techniques, where the key inputs are based on relative value analyses and the assignment of risk-adjusted discounted rates derived from the analysis of similar credit investments from similar issuers. In addition, an illiquidity discount is applied where appropriate. The valuation techniques used by us for other types of assets and liabilities that are classified as Level 3 investments are described in Note 2 to our financial statements. The unobservable inputs and assumptions may differ by asset and in the application of our valuation methodologies. The reported fair value estimates could vary materially if we had chosen to incorporate different unobservable inputs and other assumptions.
We and our board of trustees conduct our fair value determination process on a monthly basis and any other time when a decision regarding the fair value of our portfolio investments is required. A determination of fair value involves subjective judgments and estimates. Due to the inherent uncertainty of determining the fair value of portfolio investments that do not have a readily available market value, the fair value of the our portfolio investments may differ significantly from the values that would have been determined had a readily available market value existed for such investments, and the differences could be material. Further, such investments are generally less liquid than publicly traded securities. If we were required to liquidate a portfolio investment that does not have a readily available market value in a forced or liquidation sale, we could realize significantly less than the fair value recorded by us.
The table below presents information on investments classified as Level 3 as of September 30, 2017:
| As of |
September 30, 2017 |
December 31, 2016 |
||||||
| Fair value of investments classified as Level 3 |
$ | 25,015,411 | $ | 673,164 | ||||
| Total fair value of investments |
$ | 148,277,234 | $ | 56,192,783 | ||||
| % of fair value classified as Level 3 |
16.9 | % | 1.2 | % | ||||
| Number of positions classified as Level 3 |
12 | 2 | ||||||
| Total number of positions |
82 | 59 | ||||||
| % of positions classified as Level 3 |
14.6 | % | 3.4 | % | ||||
| Fair value of individual positions classified as Level 3: |
||||||||
| Highest fair value |
$ | 4,468,099 | $ | 615,616 | ||||
| Lowest fair value |
$ | 54,821 | $ | 57,548 | ||||
| Average fair value |
$ | 2,084,618 | $ | 336,582 | ||||
The ranges of unobservable inputs used in the fair value measurement of our Level 3 investments as of September 30, 2017 are described in Note 5. “Fair Value of Financial Instruments” in our financial statements, as well as the directional impact to the valuation from an increase in various unobservable inputs.
Off-Balance Sheet Arrangements
We had no off-balance sheet arrangements as of September 30, 2017.
52
Table of Contents
Contractual Obligations
Investment Advisory Agreements – We have entered into the Investment Advisory Agreement with CNL for the overall management of our investment activities. We and CNL have also entered into the Sub-Advisory Agreement with KKR, under which KKR is responsible for the day-to-day management of our investment portfolio. CNL compensates KKR for advisory services that it provides to us with 50% of the base management fees and performance-based incentive fees that CNL receives under the Investment Advisory Agreement. Pursuant to the Investment Advisory Agreement, CNL earns a base management fee equal to an annual rate of 2% of our average gross assets and an incentive fee based on our performance. The incentive fee comprises the following two parts:
| • | An incentive fee on net investment income, or the subordinated incentive fee on income, which is calculated and payable quarterly in arrears and is based upon our pre-incentive fee net investment income for the calendar quarter. The quarterly incentive fee on net investment income is (a) 100% of the pre-incentive fee net investment income between 1.75% and 2.1875% of average adjusted capital, plus (b) 20% of pre-incentive fee net investment income in excess of 2.1875% of average adjusted capital. Adjusted capital is defined as cumulative proceeds generated from sales of our common stock, including proceeds from our distribution reinvestment plan, net of sales load (upfront sales commissions and upfront dealer manager fees) reduced for (i) distributions paid to our shareholders that represent return of capital on a tax basis and (ii) amounts paid for share repurchases pursuant to our share repurchase program. Average adjusted capital is computed on the daily adjusted capital for the actual number of days in the quarter. The quarterly preference return of 1.75% and upper level breakpoint of 2.1875% are also adjusted for the actual number of days in each calendar quarter. For purposes of computing the subordinated incentive fee on income, net interest, if any, associated with a derivative or swap, (which represents the difference between (i) the interest income and fees received in respect of the reference assets of the derivative or swap and (ii) the interest expense paid by us to the derivative or swap counterparty) is included in pre-incentive fee net investment income for purposes of the subordinated incentive fee on income. |
| • | An incentive fee on capital gains, which is calculated and payable in arrears as of the end of each calendar year. It is equal to 20% of our realized capital gains on a cumulative basis from inception through the end of such calendar year, computed net of all realized capital losses and unrealized capital depreciation on a cumulative basis, less the aggregate amount of any previously paid incentive fees on capital gains. For purposes of computing the incentive fee on capital gains, realized gains and realized losses on the disposition of any reference assets, if any, as well as unrealized depreciation on reference assets retained in the derivative or swap, if any, is included on a cumulative basis in the calculation of the incentive fee on capital gains that may be payable annually to our Advisors. |
As of September 30, 2017, we had accrued an incentive fee on capital gains of $303,107. See Note 6. “Related Party Transactions” in our financial statements for expanded discussion of the Investment Advisory Agreement and Sub-Advisory Agreement.
The terms of the Investment Advisory Agreement entitle CNL (and indirectly KKR) to receive up to 1.5% of gross proceeds in connection with the Offering as reimbursement for organization and offering expenses incurred by the Advisors on our behalf. The Advisors waived the reimbursement of organization and offering expenses in connection with our gross capital raised before April 30, 2017. Gross capital raised by us after April 30, 2017 will be subject to the maximum organization and offering cost reimbursement of 1.5%. The O&O Reimbursement Waiver does not reduce the amount of organization and offering expenses incurred by the Advisors that are eligible for reimbursement in future periods.
53
Table of Contents
Unfunded Commitments
Unfunded commitments to provide funds to portfolio companies are not recorded on our statements of assets and liabilities. Because these commitments may expire without being drawn upon, the total commitment amount does not necessarily represent future cash requirements. We estimate that we have sufficient liquidity to fund such unfunded loan commitments should the need arise. As of September 30, 2017, our unfunded commitments are as follows:
| Category / Company |
||||
| Unfunded Term Loan Commitments: |
||||
| Wheels Up Partners LLC |
2,757,304 | |||
| Frontline Technologies Group LLC |
889,323 | |||
| Unfunded Revolving Loan Commitments: |
||||
| Smart Modular Technologies, Inc. |
$ | 44,373 | ||
| Unfunded Equity Commitments: |
||||
| Polyconcept North America |
25,737 | |||
|
|
|
|||
| Total Unfunded Commitments |
$ | 3,716,737 | ||
|
|
|
|||
Related Party Transactions
We have entered into agreements with our Advisors and certain of their affiliates, whereby we agree to pay certain fees to, or reimburse certain expenses of, our Advisors and their affiliates for investment and advisory services, selling commissions, ongoing distribution and shareholder servicing fees and marketing fees in connection with our Offering, and reimbursement of offering and administrative and operating fees and costs. See Note 6. “Related Party Transactions” in our unaudited condensed financial statements and Part III - Item 13. “Certain Relationships and Related Transactions, and Trustee Independence” in our Form 10-K for the period ended December 31, 2016 for a discussion of the various related party transactions, agreements and fees.
Impact of Recent Accounting Pronouncements
We do not believe that any recently issued, but not yet effective accounting pronouncements, if adopted, would have a material effect on the financial statements.
| Item 3. | Quantitative and Qualitative Disclosures about Market Risk |
Interest Rate Risk
We are subject to financial market risks, in particular changes in interest rates. Future changes in interest rates will likely have effects on the interest income we earn on our portfolio investments, the fair value of our fixed income investments, the interest rates and interest expense associated with the money we borrow and the fair value of loan balances.
Subject to the requirements of the 1940 Act, we may hedge against interest rate fluctuations by using standard hedging instruments such as futures, options and forward contracts. Although hedging activities may insulate us against adverse changes in interest rates, they may also limit our ability to participate in the benefits of lower interest rates.
As of September 30, 2017, approximately 80.7% of our portfolio of debt investments, or approximately $118.7 million measured at par value, featured floating or variable interest rates. The variable interest rate debt investments usually provide for interest payments based on three-month LIBOR (the base rate) and typically have durations of three months after which the base rates are reset to then prevailing three-month LIBOR. As of September 30, 2017, 99.9% of our portfolio of variable interest rate debt investments, or approximately $118.6 million measured at par value, featured minimum base rates, or base rate floors, and the weighted average base rate floor for such investments was 1.0%. Variable interest rate investments that feature a base rate floor generally reset to the then prevailing three-month LIBOR only if the reset base rate exceeds the base rate floor on the applicable interest rate reset date, in which cases we may benefit through an increase in interest income from such interest rate adjustments.
54
Table of Contents
Based on September 30, 2017 balance sheet, the following table shows the annual impact of base rate changes in interest rates (considering interest rate floors for variable rate instruments) assuming no changes in our investment and borrowing structure:
| As of September 30, 2017 | ||||||||||||
| Basis Point Change |
Interest Income | Interest Expense | Net Investment Income (1) |
|||||||||
| Down 50 basis points |
$ | (313,605 | ) | $ | (157,500 | ) | $ | (156,105 | ) | |||
| Up 50 basis points |
$ | 511,780 | $ | 157,500 | $ | 354,280 | ||||||
| Up 100 basis points |
$ | 1,023,561 | $ | 315,000 | $ | 708,561 | ||||||
| Up 150 basis points |
$ | 1,535,341 | $ | 472,500 | $ | 1,062,841 | ||||||
| Up 200 basis points |
$ | 2,047,121 | $ | 630,000 | $ | 1,417,121 | ||||||
| (1) | Excludes the impact of performance-based incentive fees and expense support. See Note 6. “Related Party Transactions” in our condensed financial statements for more information on performance-based incentive fees and expense support. |
The interest rate sensitivity analysis presented above does not consider the potential impact of the changes in fair value of our debt investments and the net asset value of our common stock in the event of sudden increases in interest rates associated with high yield corporate bonds.
Approximately 19.3% of our debt investment portfolio was invested in fixed interest rate, high yield corporate debt investments as of September 30, 2017. Rising market interest rates will most likely lead to fair value declines for high yield corporate bonds and a decline in the net asset value of our common stock, while declining market interest rates will most likely lead to an increase in bond values.
As of September 30, 2017, 84.8% of our debt investments had prices that are generally available from third party pricing services. We consider these debt investments to be liquid since these types of assets are generally broadly syndicated and owned by a wide group of institutional investors, business development companies, mutual funds and other investment funds. Additionally, this group of assets is susceptible to revaluation, or changes in bid-ask values, in response to sudden changes in expected rates of return associated with these investments.
Foreign Currency Risk
In addition, any investments we make that are denominated in a foreign currency will be subject to risks associated with changes in currency exchange rates. These risks include the possibility of significant fluctuations in the foreign currency markets, the imposition or modification of foreign exchange controls and potential illiquidity in the secondary market. These risks will vary depending upon the currency or currencies involved.
We may hedge against interest rate and currency exchange rate fluctuations by using standard hedging instruments such as futures, options and forward contracts subject to the requirements of the 1940 Act. While hedging activities may insulate us against adverse changes in interest rates, they may also limit our ability to participate in benefits of lower interest rates with respect to our portfolio of investments with fixed interest rates.
| Item 4. | Controls and Procedures |
Evaluation of Disclosure Controls and Procedures
Our management, including our principal executive officer and principal financial officer, evaluated the effectiveness of our disclosure controls and procedures as of the end of the period covered by this report. Based upon that evaluation, our management, including our principal executive officer and principal financial officer, concluded that our disclosure controls and procedures are effective as of the end of the period covered by this report to provide reasonable assurance that information required to be disclosed by us in the reports we file under the Securities Exchange Act of 1934, as amended is recorded, processed, summarized and reported within the time periods specified in the relevant SEC rules and forms.
Changes in Internal Control over Financial Reporting
During the most recent fiscal quarter, there was no change in our internal controls over financial reporting (as defined under Rule 13a-15(f) under the Exchange Act) that has materially affected, or is reasonably likely to materially affect, our internal controls over financial reporting.
55
Table of Contents
| Item 1. | Legal Proceedings – None |
Item 1A. Risk Factors – There have been no material changes to the risk factors previously disclosed in response to Item 1A. to Part I. of our Annual Report on Form 10-K for the fiscal period ended December 31, 2016, except the following:
The following amends and supplements the section of the Prospectus entitled “Risk Factors — Risks Related to Our Advisors and their Respective Affiliates — Our ability to enter into transactions with our affiliates will be restricted” by amending and restating the second paragraph of such section with the following paragraph:
On June 19, 2017, the SEC issued an order granting us exemptive relief that expands our ability to co-invest with certain of our affiliates, including CCT, in privately negotiated transactions. Subject to the conditions specified in the exemptive order, we are now permitted to co-invest with those affiliates in certain additional investment opportunities, including investments originated and directly negotiated by KKR. The KKR allocation policy provides that once an investment has been approved and is deemed to be in our best interest, we will receive a pro rata share of the investment based on capital available for investment in the asset class being allocated. Determinations as to the amount of capital available for investment are based on such factors as: the amount of cash on-hand, existing commitments and reserves, the targeted leverage level, the targeted asset mix and diversification requirements, other investment policies and restrictions, and limitations imposed by applicable laws, rules, regulations or interpretations. However, there can be no assurance that investment opportunities will be allocated to us fairly or equitably in the short term or over time.
The following amends and supplements the section of the Prospectus entitled “Risk Factors — Risks Related to an Investment in Our Common Stock — We may pay distributions from offering proceeds, borrowings or the sale of assets to the extent our cash flows from operations, net investment income or earnings are not sufficient to fund declared distributions” by amending and restating such section with the following:
We may fund distributions from the uninvested proceeds of an offering and borrowings, and we have not established limits on the amount of funds we may use from such proceeds or borrowings to make any such distributions. We may pay distributions from the sale of assets to the extent distributions exceed our earnings or cash flows from operations. Distributions from offering proceeds or from borrowings could reduce the amount of capital we ultimately invest in our investment portfolio. Our previous distributions have been funded in significant part from expense support payments from our Advisors, including the reimbursement of certain operating expenses that will likely be subject to repayment to our affiliates. It is likely that our distributions will continue to be supported by our Advisors in the form of operating expense support payments and the deferral or waiver of investment advisory fees. We may be obligated to repay our Advisors over several years and these repayments will reduce the future distributions that you should otherwise receive from your investment.
The following amends and supplements the section of the Prospectus entitled “Risk Factors — We intend, but are not required, to offer to repurchase our shares on a quarterly basis. As a result, shareholders will have limited opportunities to sell their shares.” by replacing the first sentence of such section with the following sentence:
Beginning on January 31, 2018, and subject to the discretion of our trustees, we intend to commence tender offers, on approximately 10% of our weighted average number of outstanding shares in any 12-month period, to allow you to tender your shares to us on a quarterly basis at a specific offer price that is determined based upon our net asset value as of the last date of the prior quarter prior to the initiation of each tender offer program.
| Item 2. | Unregistered Sales of Equity Securities and Use of Proceeds – None. |
| Item 3. | Defaults Upon Senior Securities – None |
| Item 4. | Mine Safety Disclosures – Not applicable |
| Item 5. | Other Information – None |
| Item 6. | Exhibits – The exhibits required by this item are set forth in the Exhibit Index attached hereto and are filed or incorporated as part of this report. |
56
Table of Contents
The following exhibits are filed or incorporated as part of this report
57
Table of Contents
Pursuant to the requirements of Section 13 or 15(d) of the Securities Exchange Act of 1934, the registrant has duly caused this report to be signed on its behalf by the undersigned, thereunto duly authorized, on the 13th day of November 2017.
| CORPORATE CAPITAL TRUST II | ||
| By: | /s/ Thomas K. Sittema | |
| THOMAS K. SITTEMA | ||
| Chief Executive Officer | ||
| (Principal Executive Officer) | ||
| By: | /s/ Chirag J. Bhavsar | |
| CHIRAG J. BHAVSAR | ||
| Chief Financial Officer | ||
| (Principal Financial and Accounting Officer) | ||
58