Attached files
| file | filename |
|---|---|
| 8-K - 8-K - CTO Realty Growth, Inc. | f8-k.htm |
Exhibit 99.1
|
|
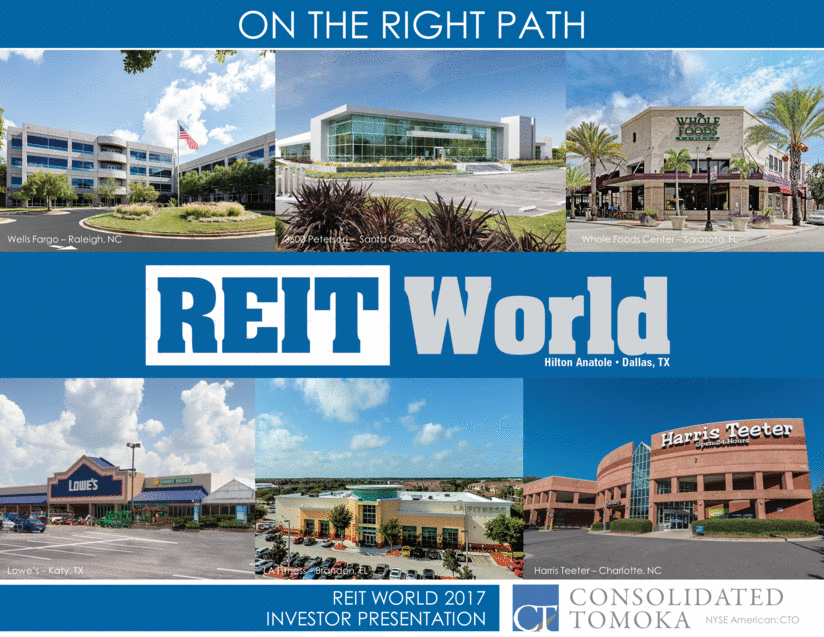
REIT WORLD 2017 INVESTOR PRESENTATION ON THE RIGHT PATH October 19, 2017 NYSE American: CTO Wells Fargo – Raleigh, NC Lowe’s – Katy, TX 3600 Peterson – Santa Clara, CA Whole Foods Center – Sarasota, FL LA Fitness – Brandon, FL Harris Teeter – Charlotte, NC |
|
|
FORWARD LOOKING STATEMENTS CONSOLIDATED TOMOKA If we refer to “we,” “us,” “our,” or “the Company,” we mean Consolidated-Tomoka Land Co. and its consolidated subsidiaries. Certain statements contained in this presentation (other than statements of historical fact) are forward-looking statements. Words such as “believe,” “estimate,” “expect,” “intend,” “anticipate,” “will,” “could,” “may,” “should,” “plan,” “potential,” “predict,” “forecast,” “project,” and similar expressions and variations thereof identify certain of such forward-looking statements, which speak only as of the dates on which they were made. Although forward-looking statements are made based upon management’s expectations and beliefs concerning future Company actions and developments and their potential effect upon the Company, a number of factors could cause the Company’s actual results to differ materially from those set forth in the forward-looking statements. Such factors may include uncertainties associated with the closing of pending land transactions or other dispositions of assets, including the likelihood, timing, and final transaction terms thereof, the estimate of the cost of completing improvements affiliated with certain investments, the impact of permitting or other transactional activities on the total estimated gain for land sales, as well as the timing of the recognition of such gains, our ability to obtain necessary governmental approvals for our land transactions or to satisfy other closing conditions, the ability to execute share repurchase transactions, the completion of 1031 transactions, the ability for the Company to convert to a real estate investment trust, the costs of improvements for the Golf Operations assets, the ability to achieve certain leasing activity including the timing and terms thereof, as well as the uncertainties and risk factors discussed in our Annual Report on Form 10-K for the fiscal year ended December 31, 2016, filed with the Securities and Exchange Commission. There can be no assurance that future developments will be in accordance with management’s expectations or that the effect of future developments on the Company will be those anticipated by management. Endnote references (A) through (J) provided in this presentation are found on Slide 39 REIT WORLD 2017 INVESTOR PRESENTATION 2 |
|
|
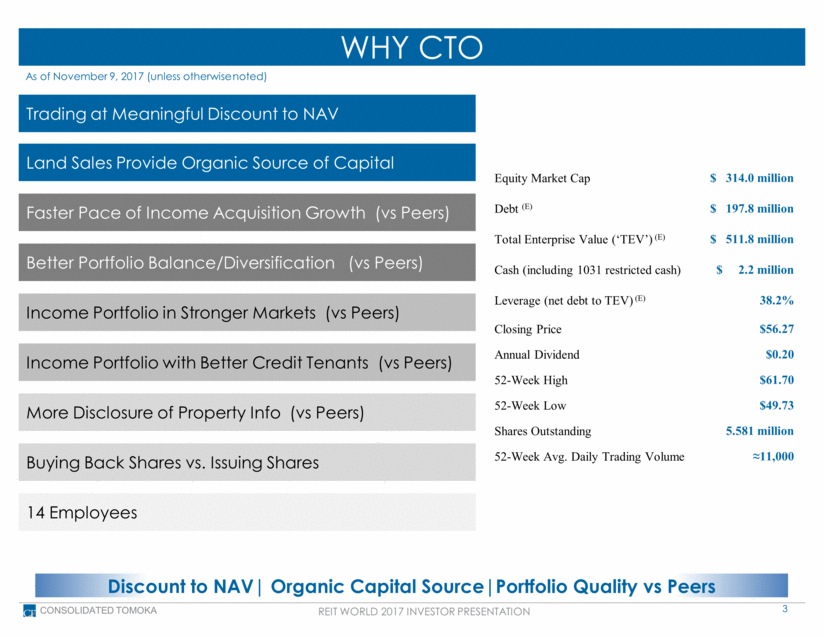
WHY CTO CONSOLIDATED TOMOKA As of November 9, 2017 (unless otherwise noted) Discount to NAV Organic Capital Source Portfolio Quality vs Peers REIT WORLD 2017 INVESTOR PRESENTATION 3 Trading at Meaningful Discount to NAV Land Sales Provide Organic Source of Capital Faster Pace of Income Acquisition Growth (vs Peers) Better Portfolio Balance/Diversification (vs Peers) Income Portfolio in Stronger Markets (vs Peers) Income Portfolio with Better Credit Tenants (vs Peers) More Disclosure of Property Info (vs Peers) Buying Back Shares vs. Issuing Shares Equity Market Cap $ 314.0 million Debt (E) $ 197.8 million Total Enterprise Value (‘TEV’) (E) $ 511.8 million Cash (including 1031 restricted cash) $ 2.2 million Leverage (net debt to TEV) (E) 38.2% Closing Price $56.27 Annual Dividend $0.20 52-Week High $61.70 52-Week Low $49.73 Shares Outstanding 5.581 million 52-Week Avg. Daily Trading Volume ≈11,000 14 Employees |
|
|
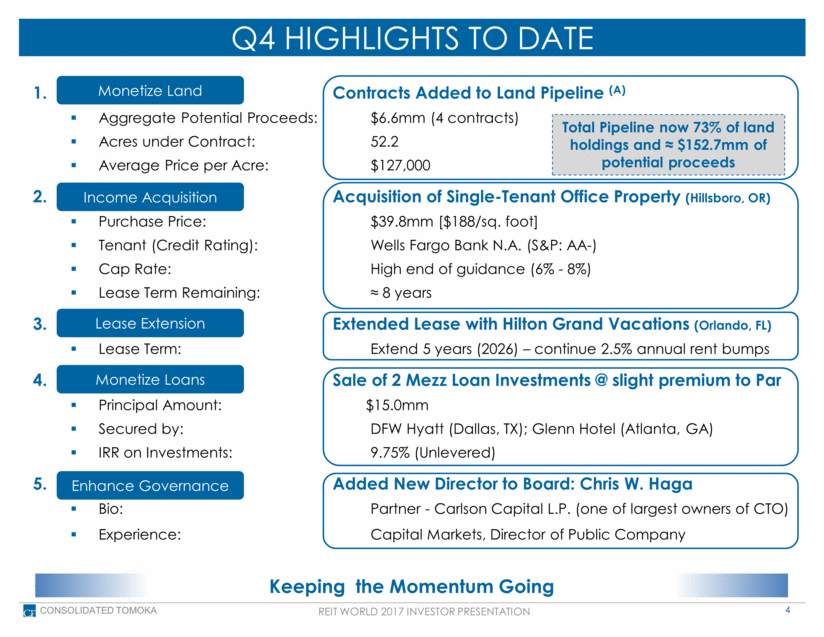
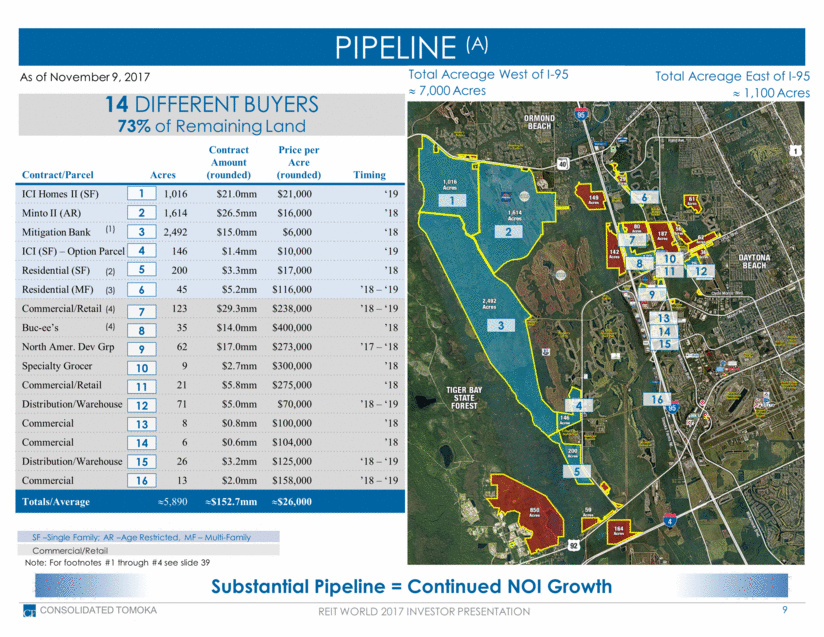
Monetize Land: Contracts Added to Land Pipeline (A) Aggregate Potential Proceeds: $6.6mm (4 contracts) Acres under Contract: 52.2 Average Price per Acre: $127,000 Convert to Income Acquisition of Single-Tenant Office Property (Hillsboro, OR) Purchase Price: $39.8mm [$188/sq. foot] Tenant (Credit Rating): Wells Fargo Bank N.A. (S&P: AA-) Cap Rate: High end of guidance (6% - 8%) Lease Term Remaining: ≈ 8 years Enhance Portfolio Extended Lease with Hilton Grand Vacations (Orlando, FL) Lease Term: Extend 5 years (2026) – continue 2.5% annual rent bumps Monetize Loans: Sale of 2 Mezz Loan Investments @ slight premium to Par Principal Amount: $15.0mm Secured by: DFW Hyatt (Dallas, TX); Glenn Hotel (Atlanta, GA) IRR on Investments: 9.75% (Unlevered) Enhance Governance: Added New Director to Board: Chris W. Haga Bio: Partner - Carlson Capital L.P. (one of largest owners of CTO) Experience: Capital Markets, Director of Public Company Q4 HIGHLIGHTS TO DATE 4 CONSOLIDATED TOMOKA Keeping the Momentum Going REIT WORLD 2017 INVESTOR PRESENTATION Monetize Land Income Acquisition Monetize Loans Enhance Governance Lease Extension Total Pipeline now 73% of land holdings and ≈ $152.7mm of potential proceeds |
|
|
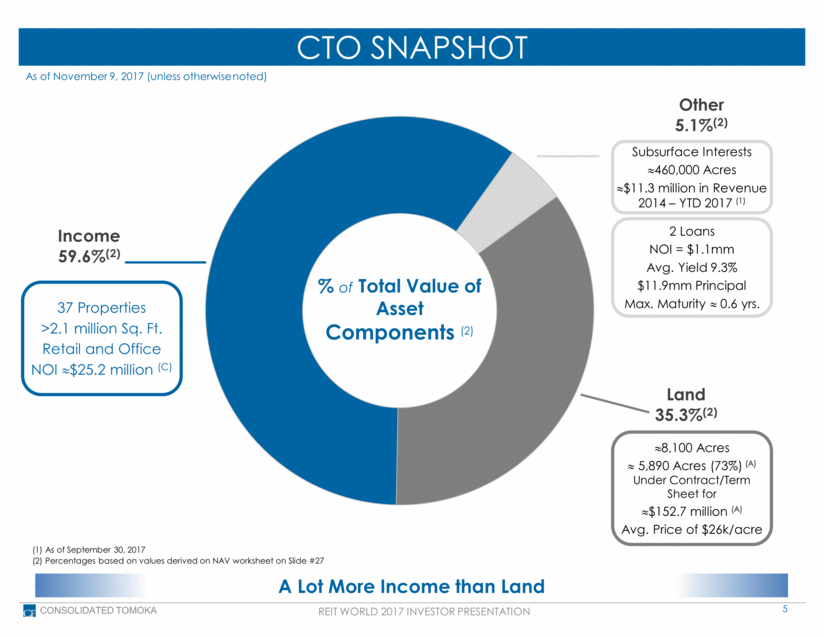
CTO SNAPSHOT CONSOLIDATED TOMOKA A Lot More Income than Land (1) As of September 30, 2017 (2) Percentages based on values derived on NAV worksheet on Slide #27 REIT WORLD 2017 INVESTOR PRESENTATION 5 37 Properties >2.1 million Sq. Ft. Retail and Office NOI $25.2 million (C) Subsurface Interests 460,000 Acres $11.3 million in Revenue 2014 – YTD 2017 (1) 2 Loans NOI = $1.1mm Avg. Yield 9.3% $11.9mm Principal Max. Maturity 0.6 yrs. 8,100 Acres 5,890 Acres (73%) (A) Under Contract/Term Sheet for $152.7 million (A) Avg. Price of $26k/acre % of Total Value of Asset Components (2) As of November 9, 2017 (unless otherwise noted) Income 59.6% (2) Other 5.1% (2) Land 35.3% (2) |
|
|
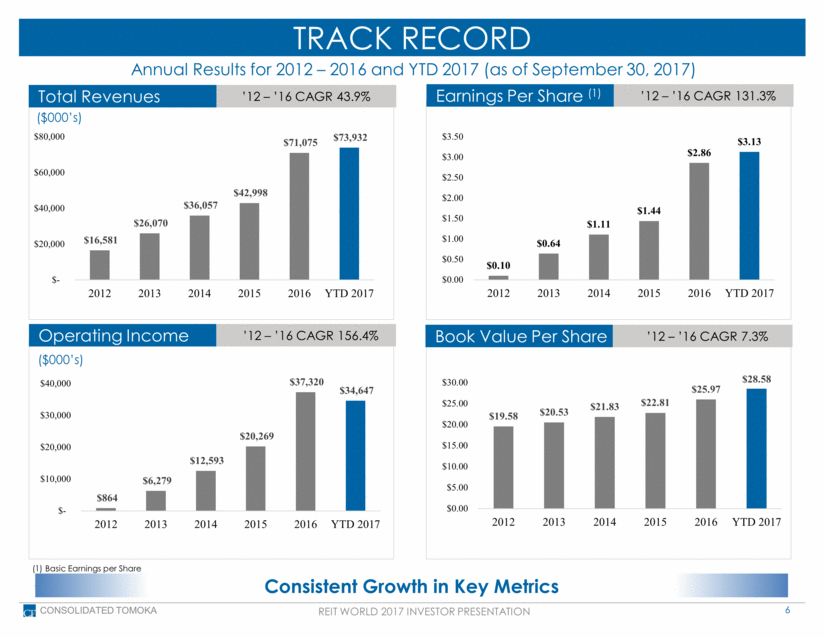
’12 – ’16 CAGR 43.9% Total Revenues ($000’s) TRACK RECORD 6 CONSOLIDATED TOMOKA Annual Results for 2012 – 2016 and YTD 2017 (as of September 30, 2017) Operating Income Book Value Per Share Earnings Per Share (1) ($000’s) ’12 – ’16 CAGR 156.4% ’12 – ’16 CAGR 131.3% ’12 – ’16 CAGR 7.3% Consistent Growth in Key Metrics (1) Basic Earnings per Share REIT WORLD 2017 INVESTOR PRESENTATION $16,581 $26,070 $36,057 $42,998 $71,075 $73,932 $- $20,000 $40,000 $60,000 $80,000 2012 2013 2014 2015 2016 YTD 2017 $0.10 $0.64 $1.11 $1.44 $2.86 $3.13 $0.00 $0.50 $1.00 $1.50 $2.00 $2.50 $3.00 $3.50 2012 2013 2014 2015 2016 YTD 2017 $864 $6,279 $12,593 $20,269 $37,320 $34,647 $- $10,000 $20,000 $30,000 $40,000 2012 2013 2014 2015 2016 YTD 2017 $19.58 $20.53 $21.83 $22.81 $25.97 $28.58 $0.00 $5.00 $10.00 $15.00 $20.00 $25.00 $30.00 2012 2013 2014 2015 2016 YTD 2017 |
|
|
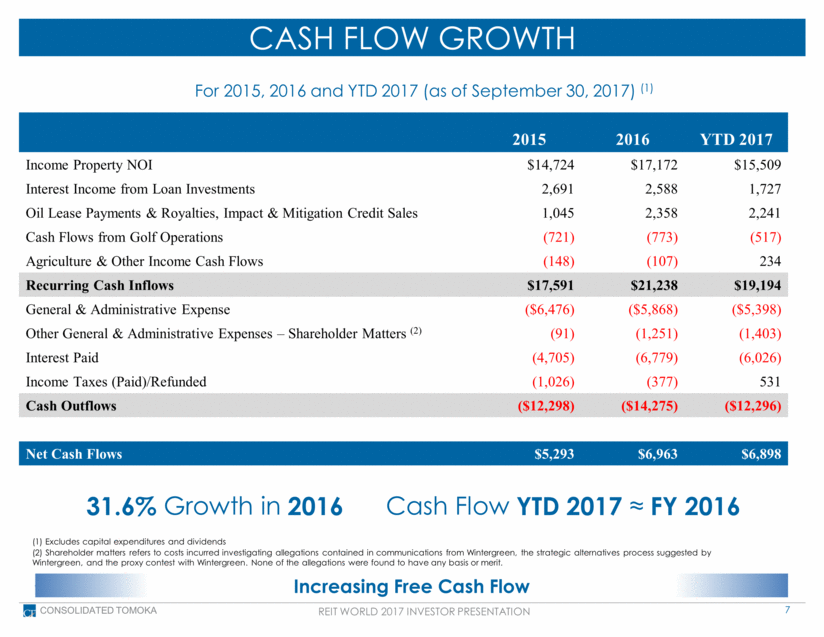
CASH FLOW GROWTH 7 CONSOLIDATED TOMOKA For 2015, 2016 and YTD 2017 (as of September 30, 2017) (1) Increasing Free Cash Flow REIT WORLD 2017 INVESTOR PRESENTATION 2015 2016 YTD 2017 Income Property NOI $14,724 $17,172 $15,509 Interest Income from Loan Investments 2,691 2,588 1,727 Oil Lease Payments & Royalties, Impact & Mitigation Credit Sales 1,045 2,358 2,241 Cash Flows from Golf Operations (721) (773) (517) Agriculture & Other Income Cash Flows (148) (107) 234 Recurring Cash Inflows $17,591 $21,238 $19,194 General & Administrative Expense ($6,476) ($5,868) ($5,398) Other General & Administrative Expenses – Shareholder Matters (2) (91) (1,251) (1,403) Interest Paid (4,705) (6,779) (6,026) Income Taxes (Paid)/Refunded (1,026) (377) 531 Cash Outflows ($12,298) ($14,275) ($12,296) Net Cash Flows $5,293 $6,963 $6,898 31.6% Growth in 2016 Cash Flow YTD 2017 ≈ FY 2016 (1) Excludes capital expenditures and dividends (2) Shareholder matters refers to costs incurred investigating allegations contained in communications from Wintergreen, the strategic alternatives process suggested by Wintergreen, and the proxy contest with Wintergreen. None of the allegations were found to have any basis or merit. |
|
|
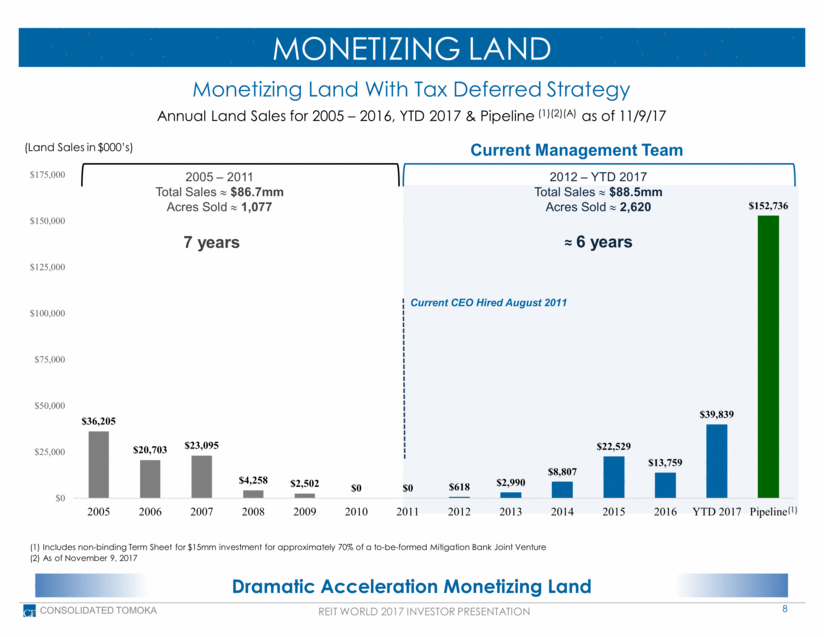
MONETIZING LAND CONSOLIDATED TOMOKA Monetizing Land With Tax Deferred Strategy (Land Sales in $000’s) 2012 – YTD 2017 Total Sales $88.5mm Acres Sold 2,620 Current Management Team 2005 – 2011 Total Sales $86.7mm Acres Sold 1,077 7 years ≈ 6 years Current CEO Hired August 2011 Dramatic Acceleration Monetizing Land (1) Includes non-binding Term Sheet for $15mm investment for approximately 70% of a to-be-formed Mitigation Bank Joint Venture (2) As of November 9, 2017 (1) Annual Land Sales for 2005 – 2016, YTD 2017 & Pipeline (1)(2)(A) as of 11/9/17 REIT WORLD 2017 INVESTOR PRESENTATION 8 $36,205 $20,703 $23,095 $4,258 $2,502 $0 $0 $618 $2,990 $8,807 $22,529 $13,759 $39,839 $152,736 $0 $25,000 $50,000 $75,000 $100,000 $125,000 $150,000 $175,000 2005 2006 2007 2008 2009 2010 2011 2012 2013 2014 2015 2016 YTD 2017 Pipeline |
|
|
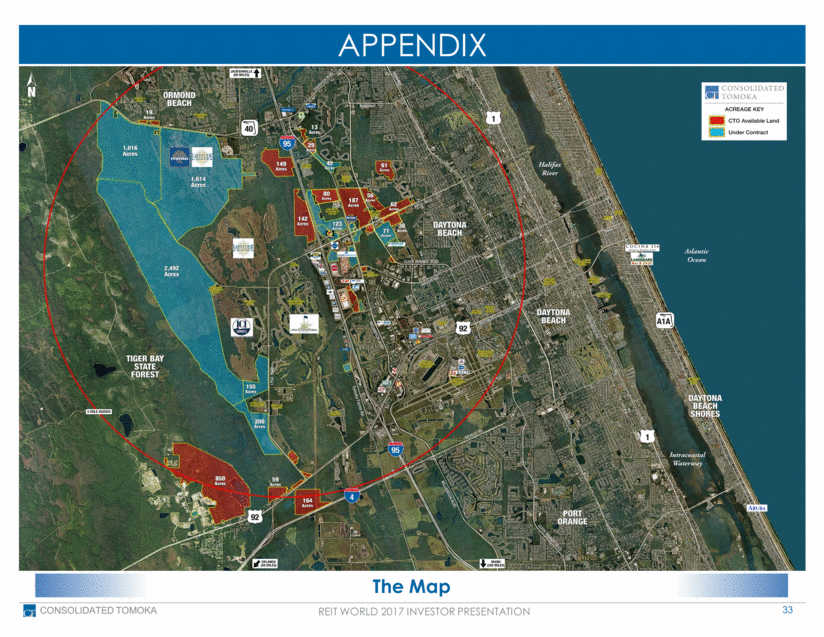
PIPELINE (A) 14 DIFFERENT BUYERS 73% of Remaining Land As of November 9, 2017 SF –Single Family; AR –Age Restricted, MF – Multi-Family Commercial/Retail Total Acreage East of I-95 1,100 Acres 9 Total Acreage West of I-95 7,000 Acres 1 12 2 3 4 6 7 8 9 11 10 Contract/Parcel Acres Contract Amount (rounded) Price per Acre (rounded) Timing ICI Homes II (SF) 1,016 $21.0mm $21,000 ‘19 Minto II (AR) 1,614 $26.5mm $16,000 ’18 Mitigation Bank 2,492 $15.0mm $6,000 ‘18 ICI (SF) – Option Parcel 146 $1.4mm $10,000 ‘19 Residential (SF) 200 $3.3mm $17,000 ’18 Residential (MF) 45 $5.2mm $116,000 ’18 – ‘19 Commercial/Retail 123 $29.3mm $238,000 ’18 – ‘19 Buc-ee’s 35 $14.0mm $400,000 ’18 North Amer. Dev Grp 62 $17.0mm $273,000 ’17 – ‘18 Specialty Grocer 9 $2.7mm $300,000 ’18 Commercial/Retail 21 $5.8mm $275,000 ‘18 Distribution/Warehouse 71 $5.0mm $70,000 ’18 – ‘19 Commercial 8 $0.8mm $100,000 ’18 Commercial 6 $0.6mm $104,000 ’18 Distribution/Warehouse 26 $3.2mm $125,000 ‘18 – ‘19 Commercial 13 $2.0mm $158,000 ’18 – ‘19 Totals/Average 5,890 $152.7mm $26,000 1 11 2 3 4 5 6 7 8 10 9 5 12 Substantial Pipeline = Continued NOI Growth (1) (4) (4) (3) (2) Note: For footnotes #1 through #4 see slide 39 REIT WORLD 2017 INVESTOR PRESENTATION CONSOLIDATED TOMOKA 13 14 13 15 15 14 16 16 |
|
|
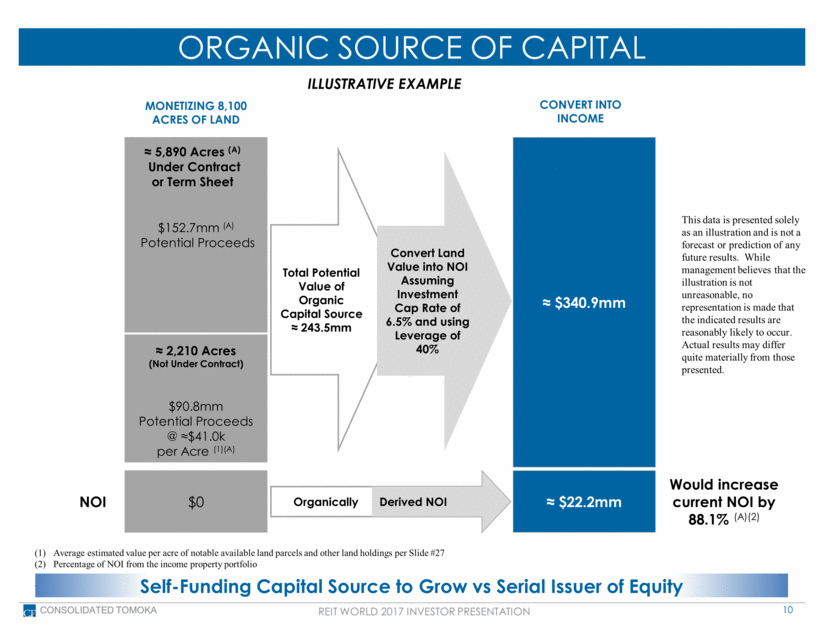
ORGANIC SOURCE OF CAPITAL 10 Self-Funding Capital Source to Grow vs Serial Issuer of Equity REIT WORLD 2017 INVESTOR PRESENTATION CONSOLIDATED TOMOKA $90.8mm Potential Proceeds @ ≈$41.0k per Acre (1)(A) $152.7mm (A) Potential Proceeds NOI MONETIZING 8,100 ACRES OF LAND ≈ 5,890 Acres (A) Under Contract or Term Sheet ≈ 2,210 Acres (Not Under Contract) $0 CONVERT INTO INCOME ≈ $22.2mm ≈ $340.9mm Average estimated value per acre of notable available land parcels and other land holdings per Slide #27 Percentage of NOI from the income property portfolio ILLUSTRATIVE EXAMPLE This data is presented solely as an illustration and is not a forecast or prediction of any future results. While management believes that the illustration is not unreasonable, no representation is made that the indicated results are reasonably likely to occur. Actual results may differ quite materially from those presented. Would increase current NOI by 88.1% (A)(2) Total Potential Value of Organic Capital Source ≈ 243.5mm Convert Land Value into NOI Assuming Investment Cap Rate of 6.5% and using Leverage of 40% Organically Derived NOI |
|
|
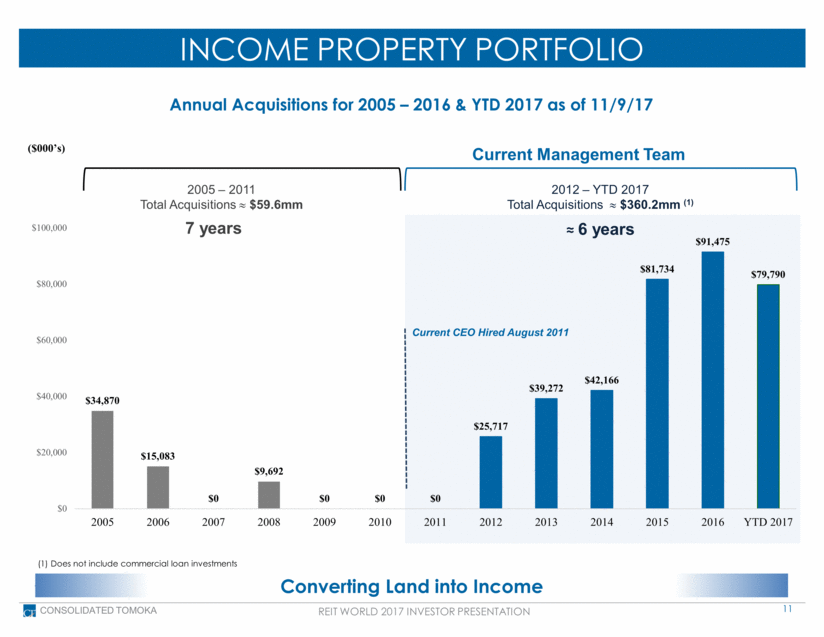
INCOME PROPERTY PORTFOLIO CONSOLIDATED TOMOKA ($000’s) 2012 – YTD 2017 Total Acquisitions $360.2mm (1) Current Management Team 2005 – 2011 Total Acquisitions $59.6mm 7 years ≈ 6 years Current CEO Hired August 2011 Annual Acquisitions for 2005 – 2016 & YTD 2017 as of 11/9/17 Converting Land into Income REIT WORLD 2017 INVESTOR PRESENTATION 11 (1) Does not include commercial loan investments $34,870 $15,083 $0 $9,692 $0 $0 $0 $25,717 $39,272 $42,166 $81,734 $91,475 $79,790 $0 $20,000 $40,000 $60,000 $80,000 $100,000 2005 2006 2007 2008 2009 2010 2011 2012 2013 2014 2015 2016 YTD 2017 |
|
|
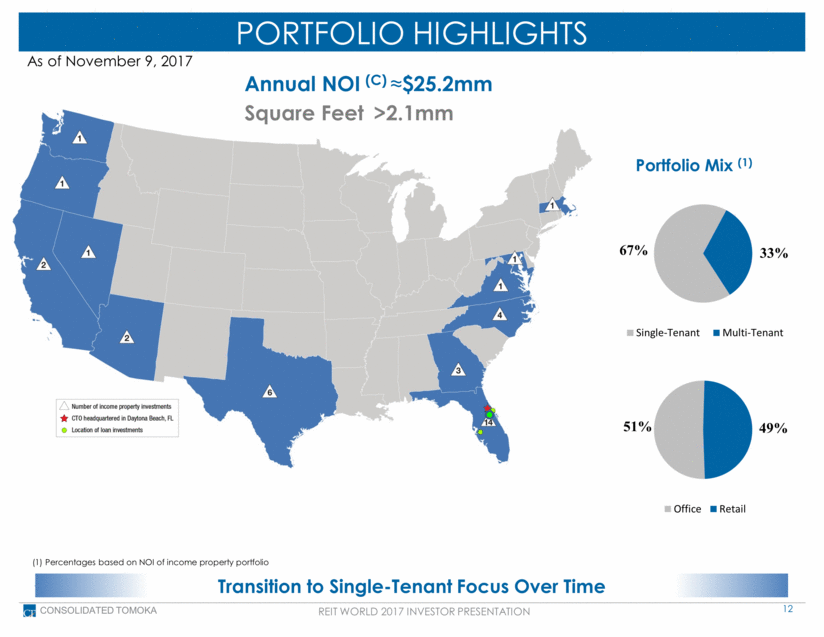
PORTFOLIO HIGHLIGHTS As of November 9, 2017 Annual NOI (C) ≈$25.2mm CONSOLIDATED TOMOKA Portfolio Mix (1) Transition to Single-Tenant Focus Over Time Square Feet >2.1mm REIT WORLD 2017 INVESTOR PRESENTATION 12 (1) Percentages based on NOI of income property portfolio 51% 49% Office Retail 67% 33% Single-Tenant Multi-Tenant |
|
|
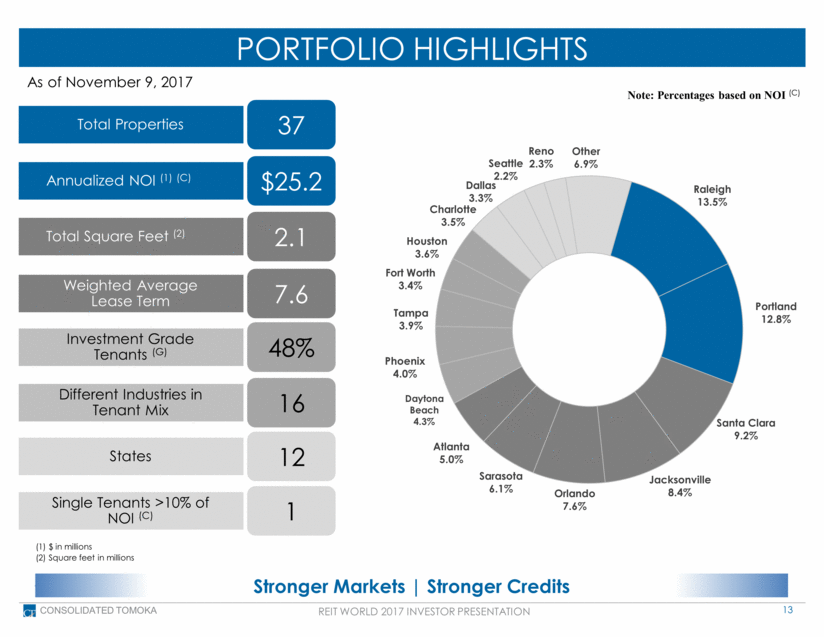
PORTFOLIO HIGHLIGHTS 13 CONSOLIDATED TOMOKA As of November 9, 2017 Total Properties Annualized NOI (1) (C) Total Square Feet (2) Weighted Average Lease Term Investment Grade Tenants (G) Different Industries in Tenant Mix States Single Tenants >10% of NOI (C) 37 $25.2 2.1 7.6 48% 16 12 1 Stronger Markets Stronger Credits (1) $ in millions (2) Square feet in millions REIT WORLD 2017 INVESTOR PRESENTATION Note: Percentages based on NOI (C) Raleigh 13.5% Portland 12.8% Santa Clara 9.2% Jacksonville 8.4% Orlando 7.6% Sarasota 6.1% Atlanta 5.0% Daytona Beach 4.3% Phoenix 4.0% Tampa 3.9% Fort Worth 3.4% Houston 3.6% Charlotte 3.5% Dallas 3.3% Seattle 2.2% Reno 2.3% Other 6.9% |
|
|
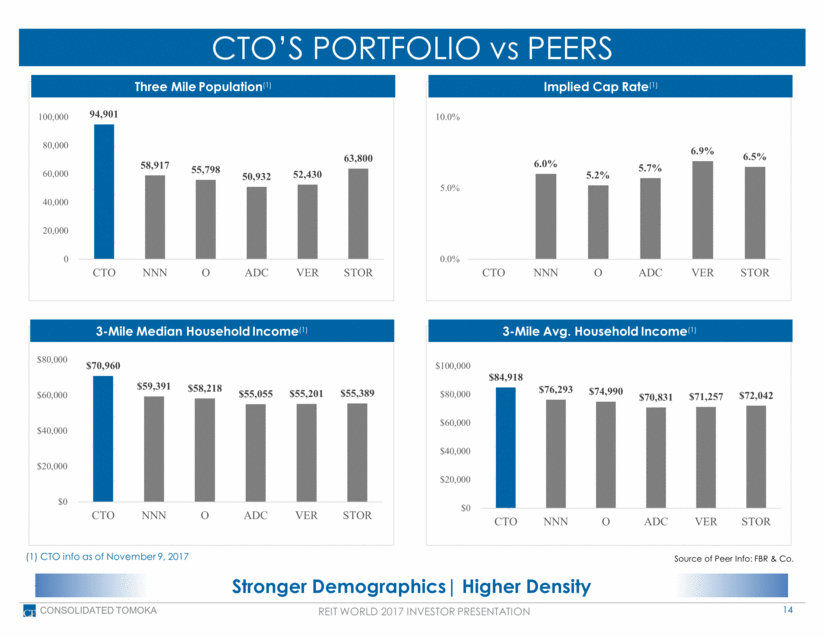
CTO’S PORTFOLIO vs PEERS Three Mile Population(1) Implied Cap Rate(1) 3-Mile Median Household Income(1) 14 CONSOLIDATED TOMOKA 3-Mile Avg. Household Income(1) Stronger Demographics Higher Density Source of Peer Info: FBR & Co. (1) CTO info as of November 9, 2017 REIT WORLD 2017 INVESTOR PRESENTATION 94,901 58,917 55,798 50,932 52,430 63,800 0 20,000 40,000 60,000 80,000 100,000 CTO NNN O ADC VER STOR 6.0% 5.2% 5.7% 6.9% 6.5% 0.0% 5.0% 10.0% CTO NNN O ADC VER STOR $70,960 $59,391 $58,218 $55,055 $55,201 $55,389 $0 $20,000 $40,000 $60,000 $80,000 CTO NNN O ADC VER STOR $84,918 $76,293 $74,990 $70,831 $71,257 $72,042 $0 $20,000 $40,000 $60,000 $80,000 $100,000 CTO NNN O ADC VER STOR |
|
|
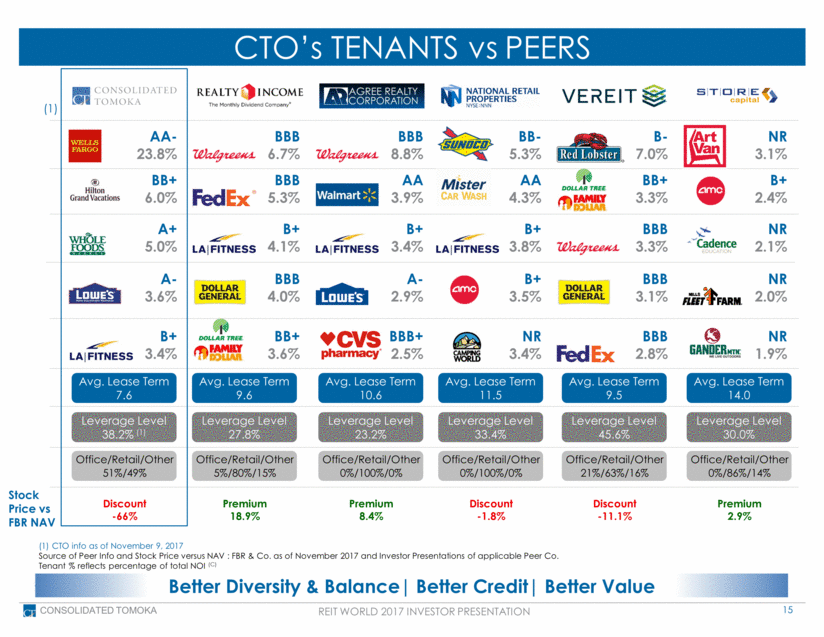
CTO’s TENANTS vs PEERS AA- 23.8% BB+ 6.0% A+ 5.0% A- 3.6% B+ 3.4% BBB 6.7% BBB 5.3% BBB 4.0% B+ 4.1% BB+ 3.6% BBB 8.8% AA 3.9% B+ 3.4% A- 2.9% BBB+ 2.5% 15 CONSOLIDATED TOMOKA (1) CTO info as of November 9, 2017 Source of Peer Info and Stock Price versus NAV : FBR & Co. as of November 2017 and Investor Presentations of applicable Peer Co. Tenant % reflects percentage of total NOI (C) BB- 5.3% AA 4.3% B+ 3.8% B+ 3.5% NR 3.4% B+ 2.4% NR 2.1% NR 2.0% NR 1.9% NR 3.1% BBB 3.3% BB+ 3.3% BBB 3.1% BBB 2.8% B- 7.0% Better Diversity & Balance Better Credit Better Value REIT WORLD 2017 INVESTOR PRESENTATION Avg. Lease Term 7.6 Avg. Lease Term 9.6 Avg. Lease Term 10.6 Avg. Lease Term 11.5 Avg. Lease Term 9.5 Avg. Lease Term 14.0 Leverage Level 38.2% (1) Leverage Level 27.8% Leverage Level 23.2% Leverage Level 33.4% Leverage Level 45.6% Leverage Level 30.0% Office/Retail/Other 51%/49% Office/Retail/Other 5%/80%/15% Office/Retail/Other 0%/100%/0% Office/Retail/Other 0%/100%/0% Office/Retail/Other 21%/63%/16% Office/Retail/Other 0%/86%/14% Stock Price vs FBR NAV Discount -66% Premium 18.9% Premium 8.4% Discount -1.8% Discount -11.1% Premium 2.9% (1) |
|
|
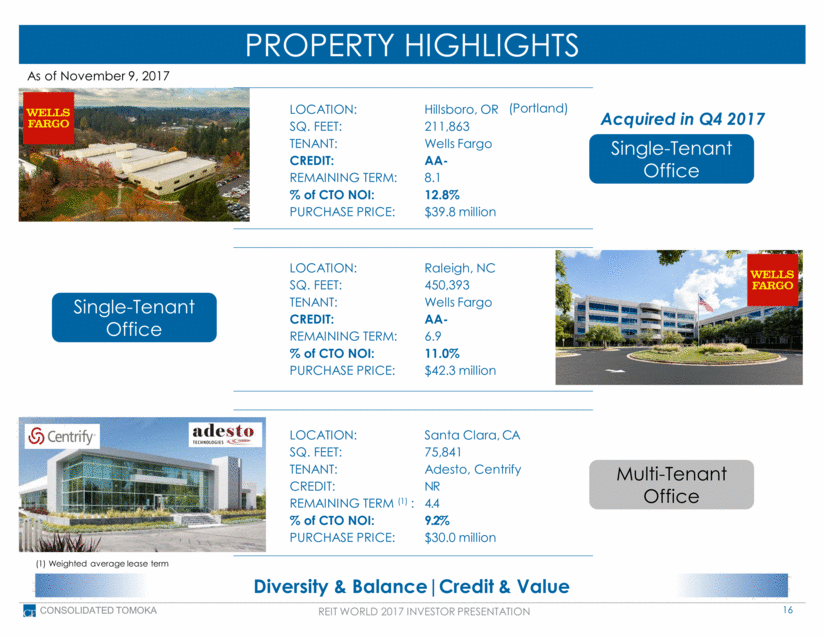
16 CONSOLIDATED TOMOKA REIT WORLD 2017 INVESTOR PRESENTATION PROPERTY HIGHLIGHTS LOCATION: Raleigh, NC SQ. FEET: 450,393 TENANT: Wells Fargo CREDIT: AA- REMAINING TERM: 6.9 % of CTO NOI: 11.0% PURCHASE PRICE: $42.3 million LOCATION: Hillsboro, OR SQ. FEET: 211,863 TENANT: Wells Fargo CREDIT: AA- REMAINING TERM: 8.1 % of CTO NOI: 12.8% PURCHASE PRICE: $39.8 million Diversity & Balance Credit & Value LOCATION: Santa Clara, CA SQ. FEET: 75,841 TENANT: Adesto, Centrify CREDIT: NR REMAINING TERM (1) : 4.4 % of CTO NOI: 9.2% PURCHASE PRICE: $30.0 million Single-Tenant Office Single-Tenant Office Multi-Tenant Office (Portland) Acquired in Q4 2017 (1) Weighted average lease term As of November 9, 2017 |
|
|
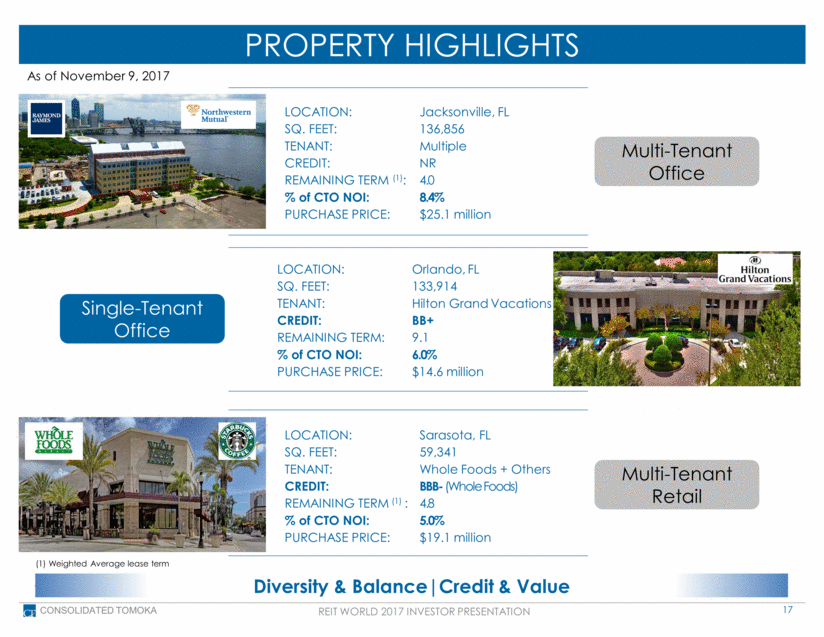
17 CONSOLIDATED TOMOKA REIT WORLD 2017 INVESTOR PRESENTATION PROPERTY HIGHLIGHTS LOCATION: Jacksonville, FL SQ. FEET: 136,856 TENANT: Multiple CREDIT: NR REMAINING TERM (1): 4.0 % of CTO NOI: 8.4% PURCHASE PRICE: $25.1 million Diversity & Balance Credit & Value LOCATION: Sarasota, FL SQ. FEET: 59,341 TENANT: Whole Foods + Others CREDIT: BBB- (Whole Foods) REMAINING TERM (1) : 4.8 % of CTO NOI: 5.0% PURCHASE PRICE: $19.1 million Multi-Tenant Office Single-Tenant Office Multi-Tenant Retail LOCATION: Orlando, FL SQ. FEET: 133,914 TENANT: Hilton Grand Vacations CREDIT: BB+ REMAINING TERM: 9.1 % of CTO NOI: 6.0% PURCHASE PRICE: $14.6 million (1) Weighted Average lease term As of November 9, 2017 |
|
|
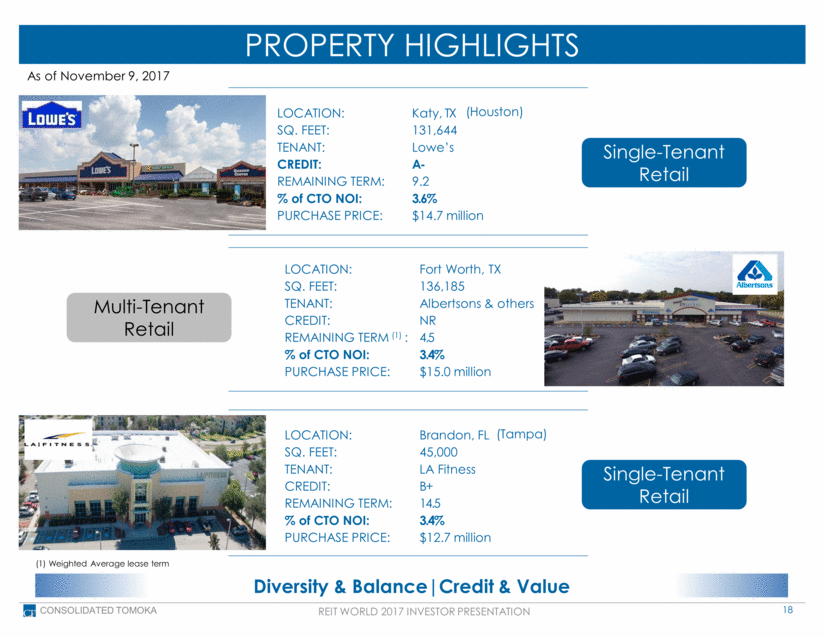
18 CONSOLIDATED TOMOKA REIT WORLD 2017 INVESTOR PRESENTATION PROPERTY HIGHLIGHTS LOCATION: Fort Worth, TX SQ. FEET: 136,185 TENANT: Albertsons & others CREDIT: NR REMAINING TERM (1) : 4.5 % of CTO NOI: 3.4% PURCHASE PRICE: $15.0 million Diversity & Balance Credit & Value LOCATION: Brandon, FL SQ. FEET: 45,000 TENANT: LA Fitness CREDIT: B+ REMAINING TERM: 14.5 % of CTO NOI: 3.4% PURCHASE PRICE: $12.7 million Multi-Tenant Retail Single-Tenant Retail Single-Tenant Retail LOCATION: Katy, TX SQ. FEET: 131,644 TENANT: Lowe’s CREDIT: A- REMAINING TERM: 9.2 % of CTO NOI: 3.6% PURCHASE PRICE: $14.7 million (Houston) (Tampa) (1) Weighted Average lease term As of November 9, 2017 |
|
|
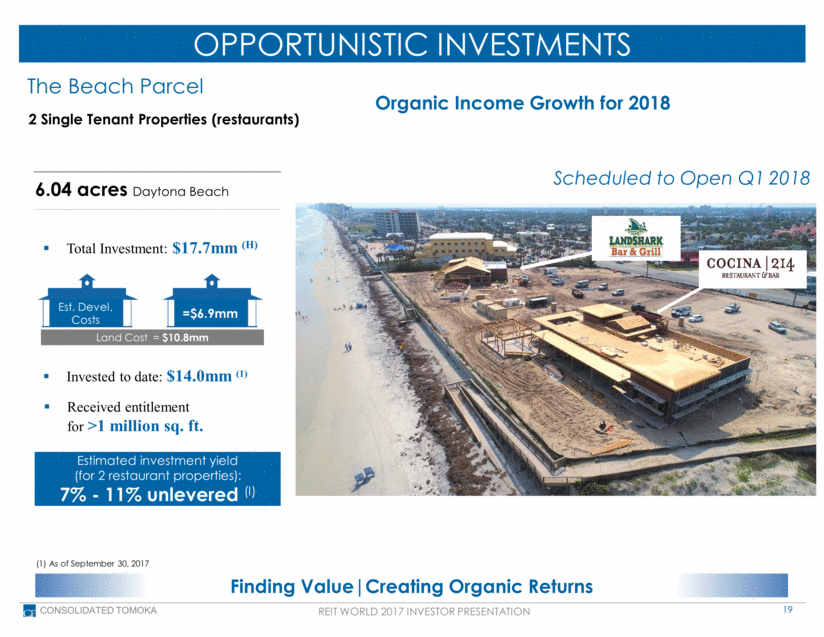
OPPORTUNISTIC INVESTMENTS 19 CONSOLIDATED TOMOKA Received entitlement for >1 million sq. ft. 6.04 acres Daytona Beach The Beach Parcel 2 Single Tenant Properties (restaurants) Estimated investment yield (for 2 restaurant properties): 7% - 11% unlevered (I) Scheduled to Open Q1 2018 Finding Value Creating Organic Returns Organic Income Growth for 2018 REIT WORLD 2017 INVESTOR PRESENTATION Land Cost = $10.8mm Invested to date: $14.0mm (1) Est. Devel. Costs =$6.9mm Total Investment: $17.7mm (H) (1) As of September 30, 2017 |
|
|
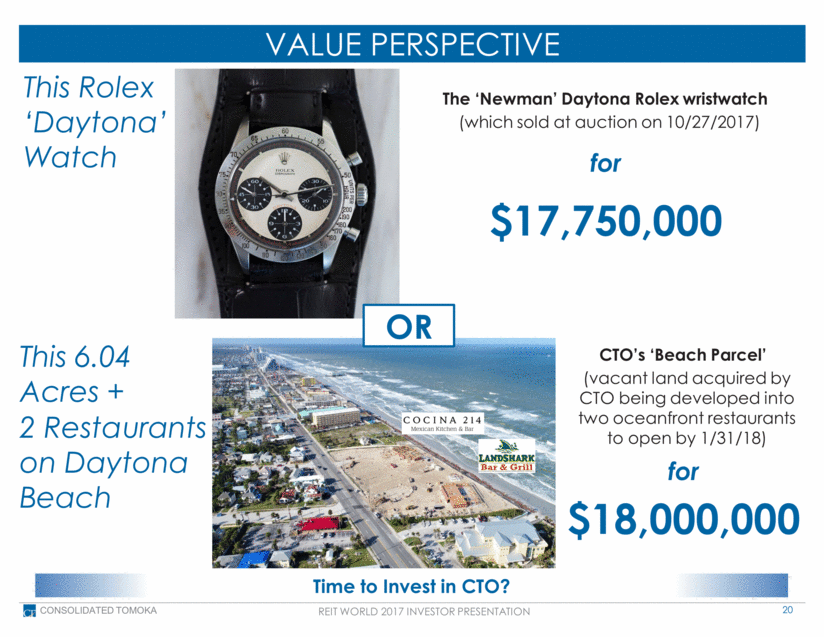
VALUE PERSPECTIVE 20 CONSOLIDATED TOMOKA REIT WORLD 2017 INVESTOR PRESENTATION $17,750,000 The ‘Newman’ Daytona Rolex wristwatch (which sold at auction on 10/27/2017) $18,000,000 This Rolex ‘Daytona’Watch for This 6.04 Acres + 2 Restaurants on Daytona Beach CTO’s ‘Beach Parcel’ (vacant land acquired by CTO being developed into two oceanfront restaurants to open by 1/31/18) for Time to Invest in CTO? OR |
|
|
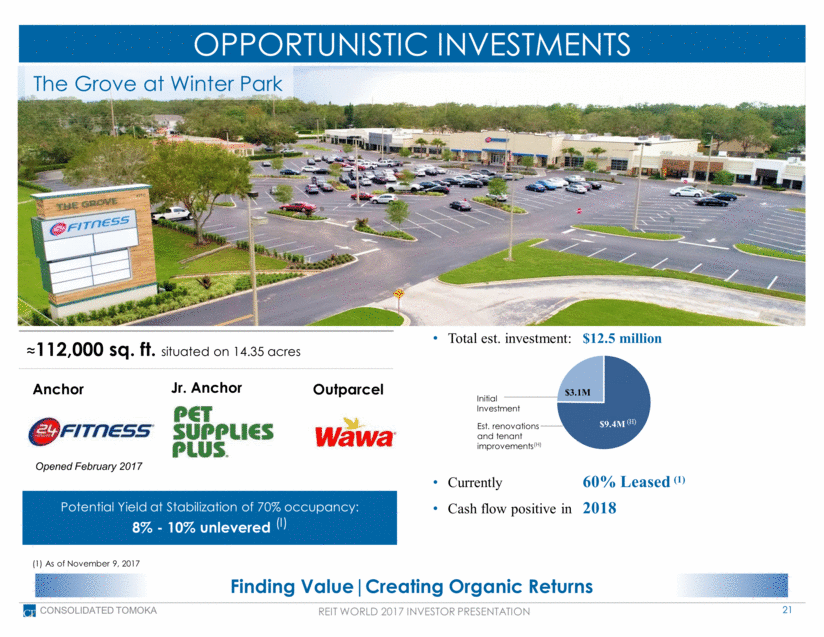
OPPORTUNISTIC INVESTMENTS 21 CONSOLIDATED TOMOKA Finding Value Creating Organic Returns Organic Income Growth for 2018 REIT WORLD 2017 INVESTOR PRESENTATION ≈112,000 sq. ft. situated on 14.35 acres Anchor Opened February 2017 Outparcel Total est. investment: $12.5 million Currently 60% Leased (1) Cash flow positive in 2018 Est. renovations and tenant improvements(H) Initial Investment $3.1M $9.4M (H) Jr. Anchor The Grove at Winter Park Potential Yield at Stabilization of 70% occupancy: 8% - 10% unlevered (I) (1) As of November 9, 2017 |
|
|
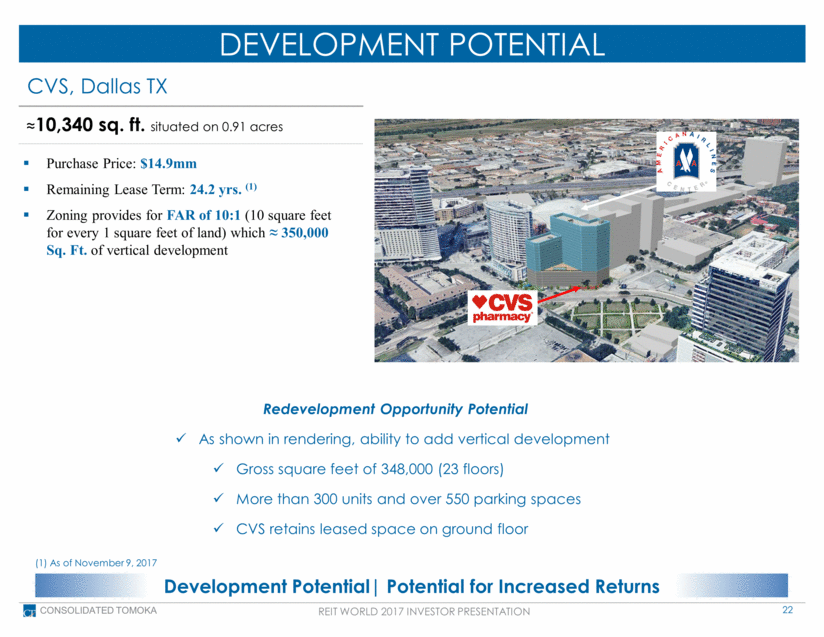
DEVELOPMENT POTENTIAL 22 CONSOLIDATED TOMOKA Development Potential Potential for Increased Returns REIT WORLD 2017 INVESTOR PRESENTATION CVS, Dallas TX ≈10,340 sq. ft. situated on 0.91 acres Purchase Price: $14.9mm Remaining Lease Term: 24.2 yrs. (1) Zoning provides for FAR of 10:1 (10 square feet for every 1 square feet of land) which ≈ 350,000 Sq. Ft. of vertical development Redevelopment Opportunity Potential As shown in rendering, ability to add vertical development Gross square feet of 348,000 (23 floors) More than 300 units and over 550 parking spaces CVS retains leased space on ground floor (1) As of November 9, 2017 |
|
|
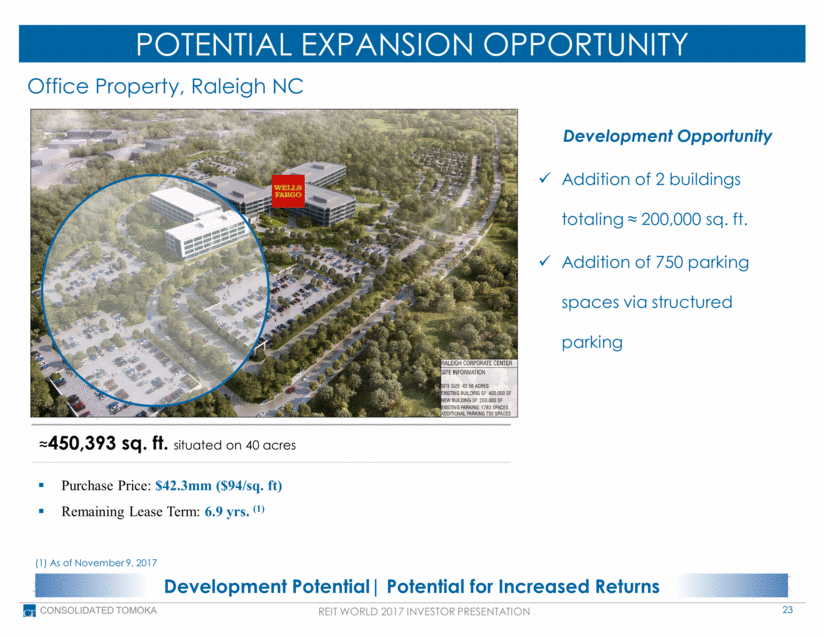
POTENTIAL EXPANSION OPPORTUNITY 23 CONSOLIDATED TOMOKA Development Potential Potential for Increased Returns REIT WORLD 2017 INVESTOR PRESENTATION Office Property, Raleigh NC ≈450,393 sq. ft. situated on 40 acres Development Opportunity Addition of 2 buildings totaling ≈ 200,000 sq. ft. Addition of 750 parking spaces via structured parking Purchase Price: $42.3mm ($94/sq. ft) Remaining Lease Term: 6.9 yrs. (1) (1) As of November 9, 2017 |
|
|
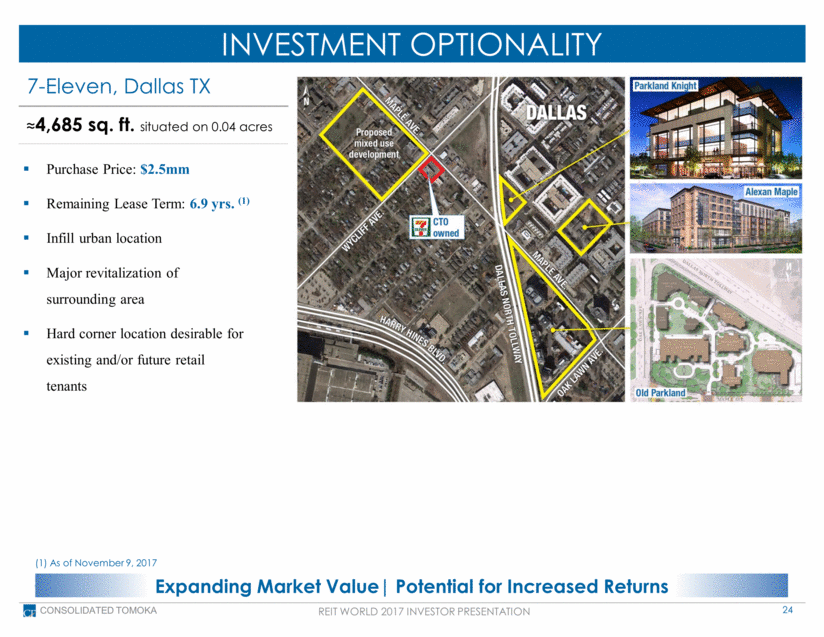
INVESTMENT OPTIONALITY 24 CONSOLIDATED TOMOKA Expanding Market Value Potential for Increased Returns REIT WORLD 2017 INVESTOR PRESENTATION 7-Eleven, Dallas TX ≈4,685 sq. ft. situated on 0.04 acres Purchase Price: $2.5mm Remaining Lease Term: 6.9 yrs. (1) Infill urban location Major revitalization of surrounding area Hard corner location desirable for existing and/or future retail tenants (1) As of November 9, 2017 |
|
|
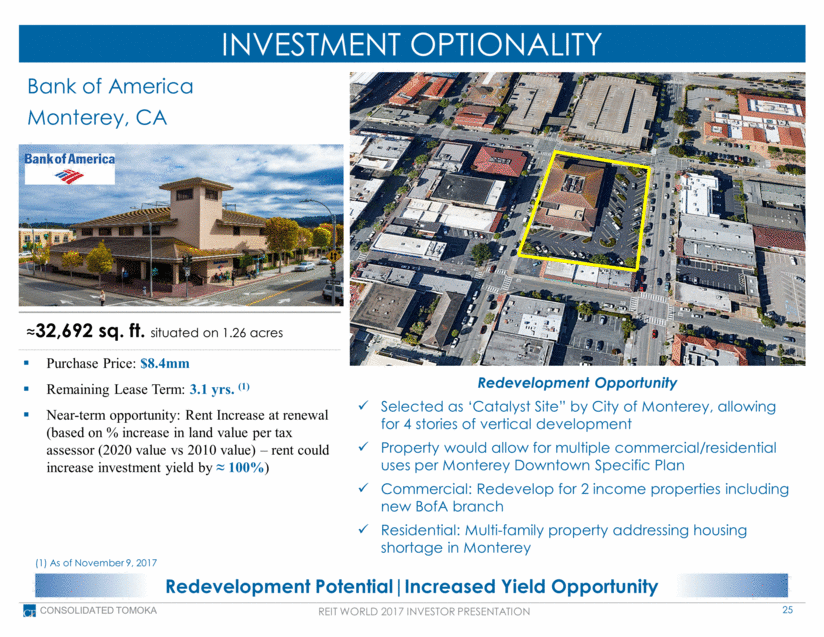
INVESTMENT OPTIONALITY 25 CONSOLIDATED TOMOKA Redevelopment Potential Increased Yield Opportunity REIT WORLD 2017 INVESTOR PRESENTATION Bank of America Monterey, CA Redevelopment Opportunity Selected as ‘Catalyst Site” by City of Monterey, allowing for 4 stories of vertical development Property would allow for multiple commercial/residential uses per Monterey Downtown Specific Plan Commercial: Redevelop for 2 income properties including new BofA branch Residential: Multi-family property addressing housing shortage in Monterey ≈32,692 sq. ft. situated on 1.26 acres Purchase Price: $8.4mm Remaining Lease Term: 3.1 yrs. (1) Near-term opportunity: Rent Increase at renewal (based on % increase in land value per tax assessor (2020 value vs 2010 value) – rent could increase investment yield by ≈ 100%) (1) As of November 9, 2017 |
|
|
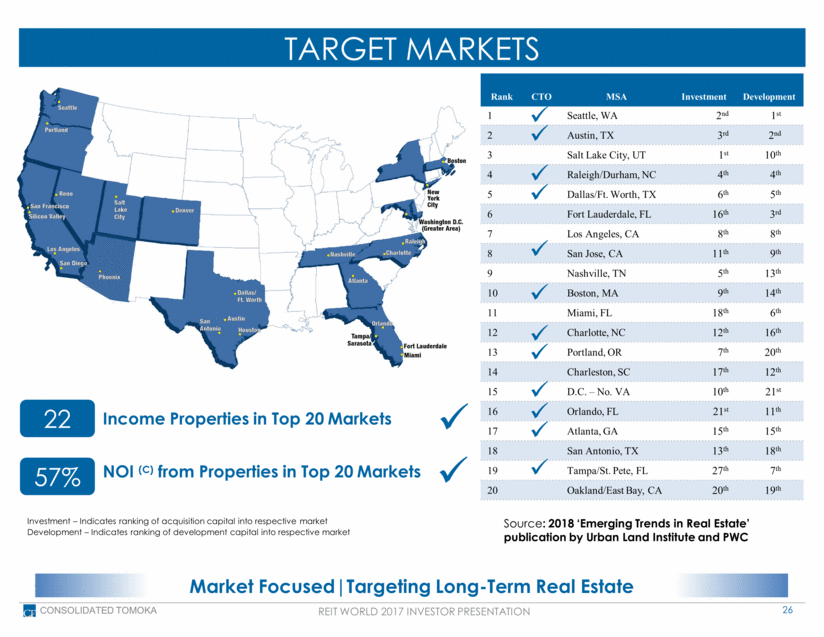
Income Properties in Top 20 Markets Investment – Indicates ranking of acquisition capital into respective market Development – Indicates ranking of development capital into respective market Source: 2018 ‘Emerging Trends in Real Estate’ publication by Urban Land Institute and PWC TARGET MARKETS Seattle Portland San Francisco Silicon Valley Los Angeles San Diego Phoenix Reno Salt Lake City Denver Dallas Austin Houston Nashville Atlanta NOI (C) from Properties in Top 20 Markets 26 CONSOLIDATED TOMOKA Market Focused Targeting Long-Term Real Estate 22 57% REIT WORLD 2017 INVESTOR PRESENTATION Rank CTO MSA Investment Development 1 Seattle, WA 2nd 1st 2 Austin, TX 3rd 2nd 3 Salt Lake City, UT 1st 10th 4 Raleigh/Durham, NC 4th 4th 5 Dallas/Ft. Worth, TX 6th 5th 6 Fort Lauderdale, FL 16th 3rd 7 Los Angeles, CA 8th 8th 8 San Jose, CA 11th 9th 9 Nashville, TN 5th 13th 10 Boston, MA 9th 14th 11 Miami, FL 18th 6th 12 Charlotte, NC 12th 16th 13 Portland, OR 7th 20th 14 Charleston, SC 17th 12th 15 D.C. – No. VA 10th 21st 16 Orlando, FL 21st 11th 17 Atlanta, GA 15th 15th 18 San Antonio, TX 13th 18th 19 Tampa/St. Pete, FL 27th 7th 20 Oakland/East Bay, CA 20th 19th |
|
|
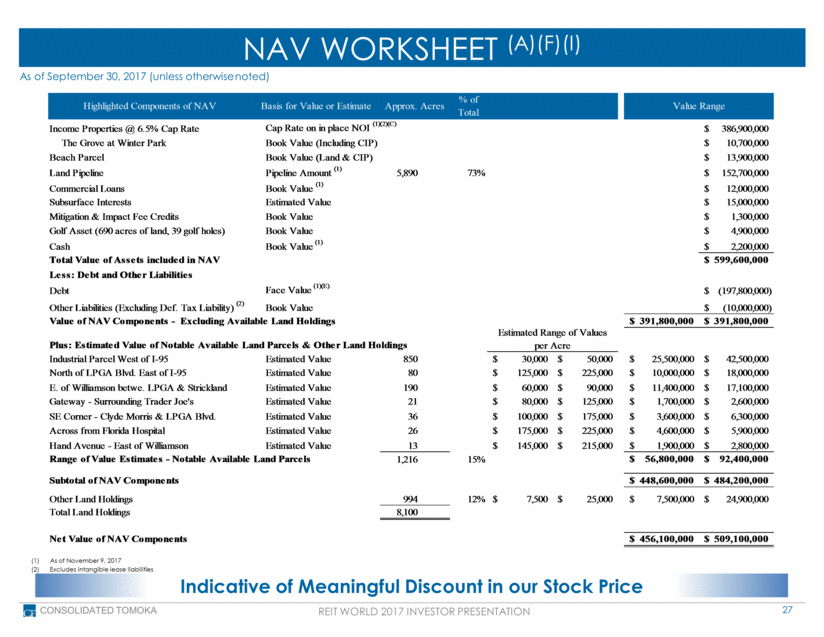
NAV WORKSHEET (A)(F)(I) 27 CONSOLIDATED TOMOKA As of November 9, 2017 Excludes intangible lease liabilities Indicative of Meaningful Discount in our Stock Price REIT WORLD 2017 INVESTOR PRESENTATION As of September 30, 2017 (unless otherwise noted) Highlighted Components of NAV Basis for Value or Estimate Approx. Acres % of Total Income Properties @ 6.5% Cap Rate Cap Rate on in place NOI (1)(2)(C) 386,900,000 $ The Grove at Winter Park Book Value (Including CIP) 10,700,000 $ Beach Parcel Book Value (Land & CIP) 13,900,000 $ Land Pipeline Pipeline Amount (1) 5,890 73% 152,700,000 $ Commercial Loans Book Value (1) 12,000,000 $ Subsurface Interests Estimated Value 15,000,000 $ Mitigation & Impact Fee Credits Book Value 1,300,000 $ Golf Asset (690 acres of land, 39 golf holes) Book Value 4,900,000 $ Cash Book Value (1) 2,200,000 $ Total Value of Assets included in NAV 599,600,000 $ Less: Debt and Other Liabilities Debt Face Value (1)(E) (197,800,000) $ Other Liabilities (Excluding Def. Tax Liability) (2) Book Value (10,000,000) $ Value of NAV Components - Excluding Available Land Holdings 391,800,000 $ 391,800,000 $ Plus: Estimated Value of Notable Available Land Parcels & Other Land Holdings Industrial Parcel West of I-95 Estimated Value 850 30,000 $ 50,000 $ 25,500,000 $ 42,500,000 $ North of LPGA Blvd. East of I-95 Estimated Value 80 125,000 $ 225,000 $ 10,000,000 $ 18,000,000 $ E. of Williamson betwe. LPGA & Strickland Estimated Value 190 60,000 $ 90,000 $ 11,400,000 $ 17,100,000 $ Gateway - Surrounding Trader Joe's Estimated Value 21 80,000 $ 125,000 $ 1,700,000 $ 2,600,000 $ SE Corner - Clyde Morris & LPGA Blvd. Estimated Value 36 100,000 $ 175,000 $ 3,600,000 $ 6,300,000 $ Across from Florida Hospital Estimated Value 26 175,000 $ 225,000 $ 4,600,000 $ 5,900,000 $ Hand Avenue - East of Williamson Estimated Value 13 145,000 $ 215,000 $ 1,900,000 $ 2,800,000 $ Range of Value Estimates - Notable Available Land Parcels 1,216 15% 56,800,000 $ 92,400,000 $ Subtotal of NAV Components 448,600,000 $ 484,200,000 $ Other Land Holdings 994 12% 7,500 $ 25,000 $ 7,500,000 $ 24,900,000 $ Total Land Holdings 8,100 Net Value of NAV Components 456,100,000 $ 509,100,000 $ Estimated Range of Values per Acre Value Range |
|
|
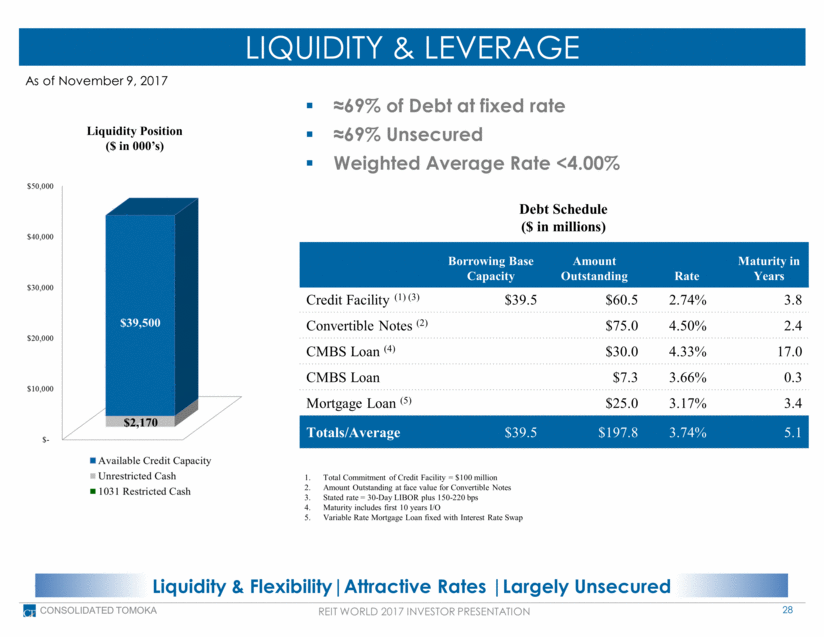
LIQUIDITY & LEVERAGE 28 CONSOLIDATED TOMOKA ≈69% of Debt at fixed rate ≈69% Unsecured Weighted Average Rate <4.00% As of November 9, 2017 Debt Schedule ($ in millions) Liquidity Position ($ in 000’s) Total Commitment of Credit Facility = $100 million Amount Outstanding at face value for Convertible Notes Stated rate = 30-Day LIBOR plus 150-220 bps Maturity includes first 10 years I/O Variable Rate Mortgage Loan fixed with Interest Rate Swap Borrowing Base Capacity Amount Outstanding Rate Maturity in Years Credit Facility (1) (3) $39.5 $60.5 2.74% 3.8 Convertible Notes (2) $75.0 4.50% 2.4 CMBS Loan (4) $30.0 4.33% 17.0 CMBS Loan $7.3 3.66% 0.3 Mortgage Loan (5) $25.0 3.17% 3.4 Totals/Average $39.5 $197.8 3.74% 5.1 Liquidity & Flexibility Attractive Rates Largely Unsecured REIT WORLD 2017 INVESTOR PRESENTATION |
|
|
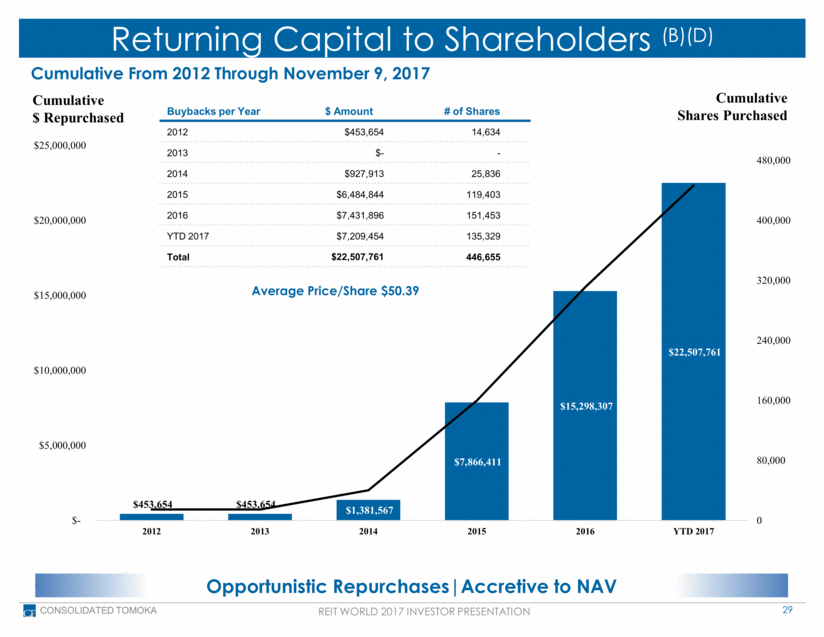
Returning Capital to Shareholders (B)(D) 29 CONSOLIDATED TOMOKA Cumulative Shares Purchased Cumulative From 2012 Through November 9, 2017 Buybacks per Year $ Amount # of Shares 2012 $453,654 14,634 2013 $- - 2014 $927,913 25,836 2015 $6,484,844 119,403 2016 $7,431,896 151,453 YTD 2017 $7,209,454 135,329 Total $22,507,761 446,655 Cumulative $ Repurchased Average Price/Share $50.39 Opportunistic Repurchases Accretive to NAV REIT WORLD 2017 INVESTOR PRESENTATION $453,654 $453,654 $1,381,567 $7,866,411 $15,298,307 $22,507,761 0 80,000 160,000 240,000 320,000 400,000 480,000 $- $5,000,000 $10,000,000 $15,000,000 $20,000,000 $25,000,000 2012 2013 2014 2015 2016 YTD 2017 |
|
|
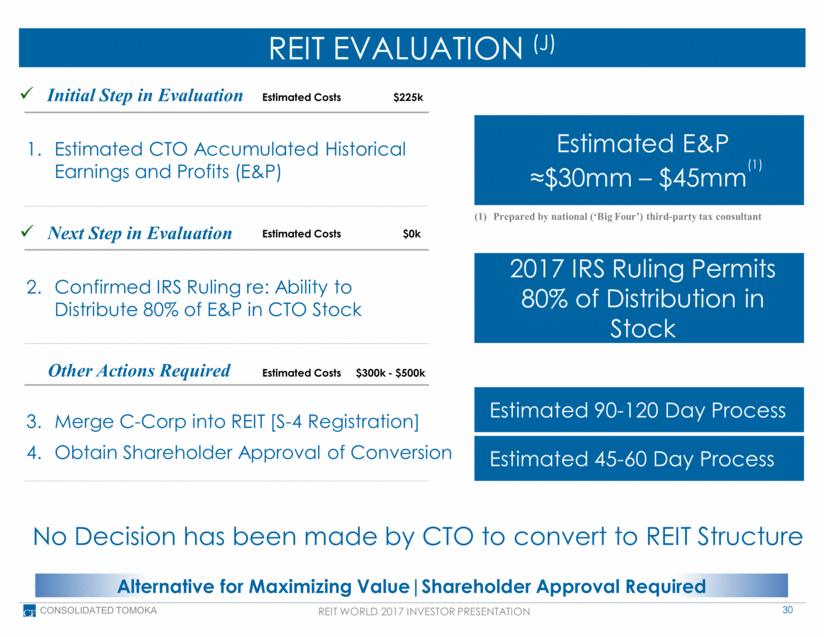
REIT EVALUATION (J) 30 CONSOLIDATED TOMOKA Alternative for Maximizing Value Shareholder Approval Required Prepared by national (‘Big Four’) third-party tax consultant No Decision has been made by CTO to convert to REIT Structure Estimated E&P ≈$30mm – $45mm(1) REIT WORLD 2017 INVESTOR PRESENTATION Estimated CTO Accumulated Historical Earnings and Profits (E&P) Confirmed IRS Ruling re: Ability to Distribute 80% of E&P in CTO Stock Merge C-Corp into REIT [S-4 Registration] Obtain Shareholder Approval of Conversion Initial Step in Evaluation Next Step in Evaluation Other Actions Required 2017 IRS Ruling Permits 80% of Distribution in Stock Estimated 90-120 Day Process Estimated 45-60 Day Process Estimated Costs $225k Estimated Costs $0k Estimated Costs $300k - $500k |
|
|
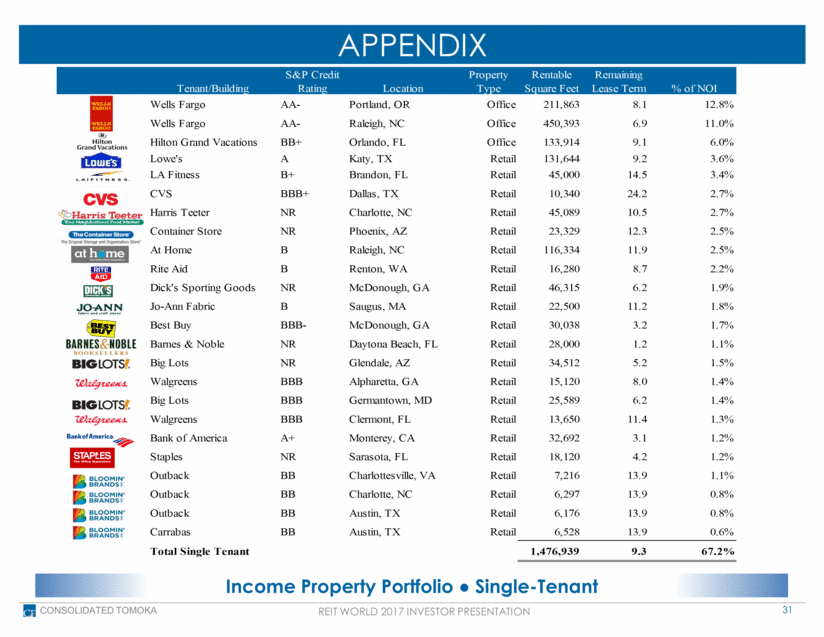
APPENDIX 31 CONSOLIDATED TOMOKA Income Property Portfolio ● Single-Tenant REIT WORLD 2017 INVESTOR PRESENTATION Tenant/Building S&P Credit Rating Location Property Type Rentable Square Feet Remaining Lease Term % of NOI Wells Fargo AA- Portland, OR Office 211,863 8.1 12.8% Wells Fargo AA- Raleigh, NC Office 450,393 6.9 11.0% Hilton Grand Vacations BB+ Orlando, FL Office 133,914 9.1 6.0% Lowe's A Katy, TX Retail 131,644 9.2 3.6% LA Fitness B+ Brandon, FL Retail 45,000 14.5 3.4% CVS BBB+ Dallas, TX Retail 10,340 24.2 2.7% Harris Teeter NR Charlotte, NC Retail 45,089 10.5 2.7% Container Store NR Phoenix, AZ Retail 23,329 12.3 2.5% At Home B Raleigh, NC Retail 116,334 11.9 2.5% Rite Aid B Renton, WA Retail 16,280 8.7 2.2% Dick's Sporting Goods NR McDonough, GA Retail 46,315 6.2 1.9% Jo-Ann Fabric B Saugus, MA Retail 22,500 11.2 1.8% Best Buy BBB- McDonough, GA Retail 30,038 3.2 1.7% Barnes & Noble NR Daytona Beach, FL Retail 28,000 1.2 1.1% Big Lots NR Glendale, AZ Retail 34,512 5.2 1.5% Walgreens BBB Alpharetta, GA Retail 15,120 8.0 1.4% Big Lots BBB Germantown, MD Retail 25,589 6.2 1.4% Walgreens BBB Clermont, FL Retail 13,650 11.4 1.3% Bank of America A+ Monterey, CA Retail 32,692 3.1 1.2% Staples NR Sarasota, FL Retail 18,120 4.2 1.2% Outback BB Charlottesville, VA Retail 7,216 13.9 1.1% Outback BB Charlotte, NC Retail 6,297 13.9 0.8% Outback BB Austin, TX Retail 6,176 13.9 0.8% Carrabas BB Austin, TX Retail 6,528 13.9 0.6% Total Single Tenant 1,476,939 9.3 67.2% |
|
|
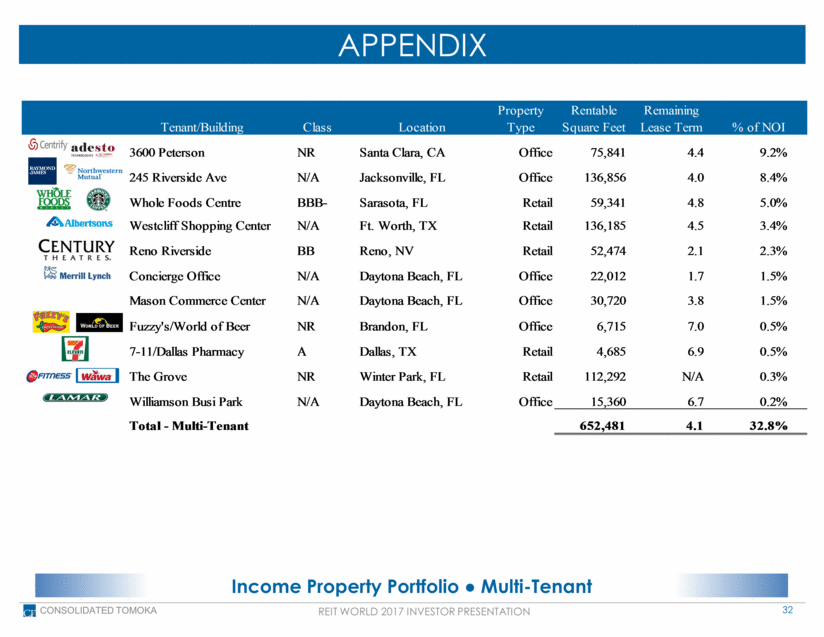
APPENDIX 32 CONSOLIDATED TOMOKA Income Property Portfolio ● Multi-Tenant REIT WORLD 2017 INVESTOR PRESENTATION Tenant/Building Class Location Property Type Rentable Square Feet Remaining Lease Term % of NOI 3600 Peterson NR Santa Clara, CA Office 75,841 4.4 9.2% 245 Riverside Ave N/A Jacksonville, FL Office 136,856 4.0 8.4% Whole Foods Centre BBB- Sarasota, FL Retail 59,341 4.8 5.0% Westcliff Shopping Center N/A Ft. Worth, TX Retail 136,185 4.5 3.4% Reno Riverside BB Reno, NV Retail 52,474 2.1 2.3% Concierge Office N/A Daytona Beach, FL Office 22,012 1.7 1.5% Mason Commerce Center N/A Daytona Beach, FL Office 30,720 3.8 1.5% Fuzzy's/World of Beer NR Brandon, FL Office 6,715 7.0 0.5% 7-11/Dallas Pharmacy A Dallas, TX Retail 4,685 6.9 0.5% The Grove NR Winter Park, FL Retail 112,292 N/A 0.3% Williamson Busi Park N/A Daytona Beach, FL Office 15,360 6.7 0.2% Total - Multi-Tenant 652,481 4.1 32.8% |
|
|
APPENDIX 33 CONSOLIDATED TOMOKA The Map REIT WORLD 2017 INVESTOR PRESENTATION |
|
|
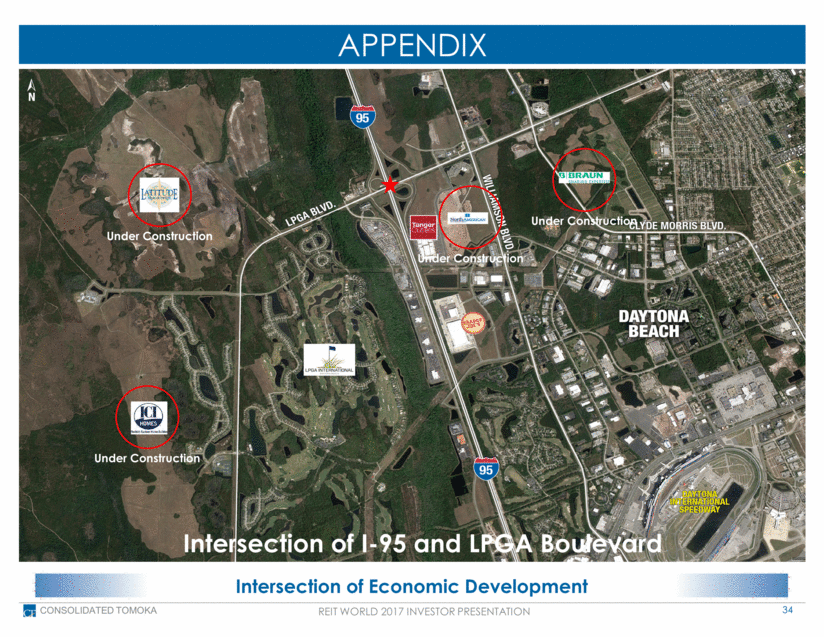
APPENDIX 34 CONSOLIDATED TOMOKA Intersection of Economic Development REIT WORLD 2017 INVESTOR PRESENTATION Intersection of I-95 and LPGA Boulevard Under Construction Under Construction Under Construction Under Construction |
|
|
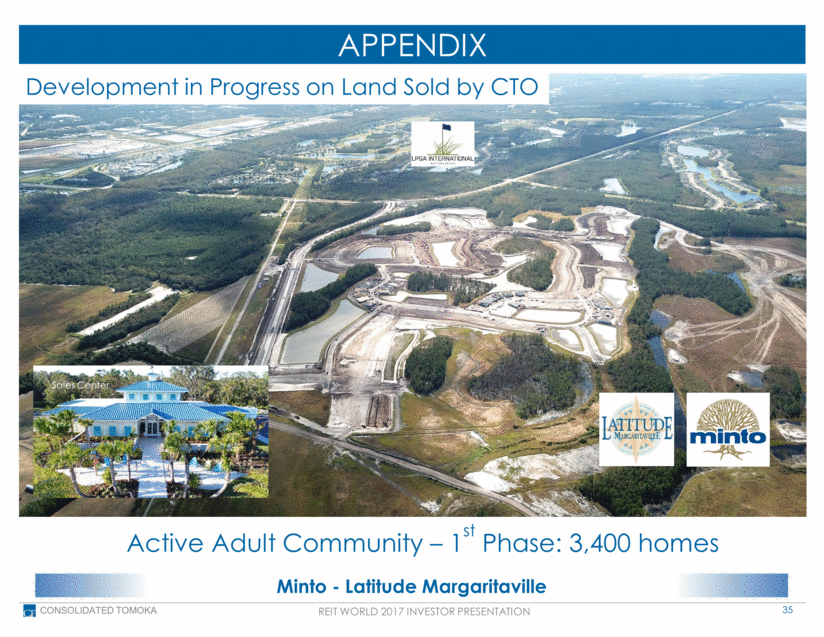
APPENDIX 35 CONSOLIDATED TOMOKA Minto - Latitude Margaritaville REIT WORLD 2017 INVESTOR PRESENTATION Active Adult Community – 1st Phase: 3,400 homes Sales Center Development in Progress on Land Sold by CTO |
|
|
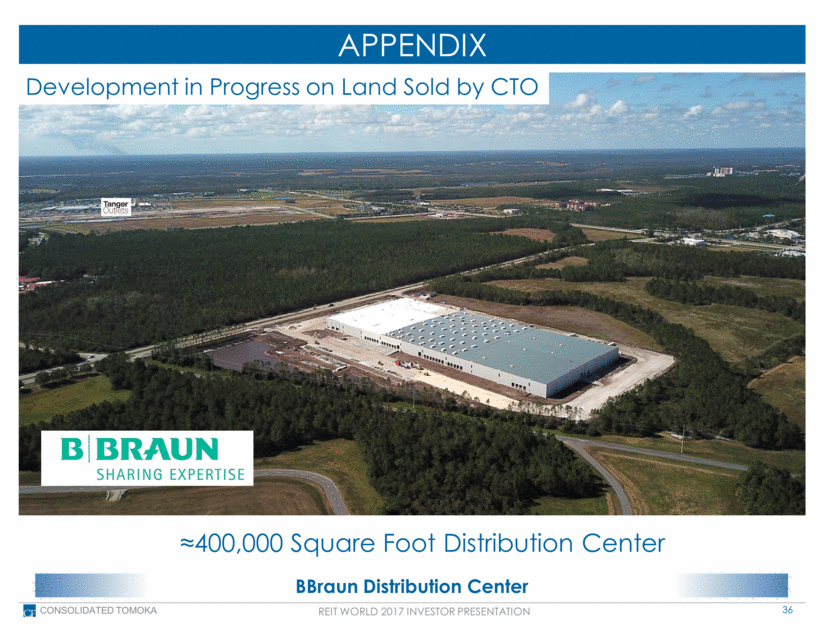
APPENDIX 36 CONSOLIDATED TOMOKA BBraun Distribution Center REIT WORLD 2017 INVESTOR PRESENTATION ≈400,000 Square Foot Distribution Center Development in Progress on Land Sold by CTO |
|
|
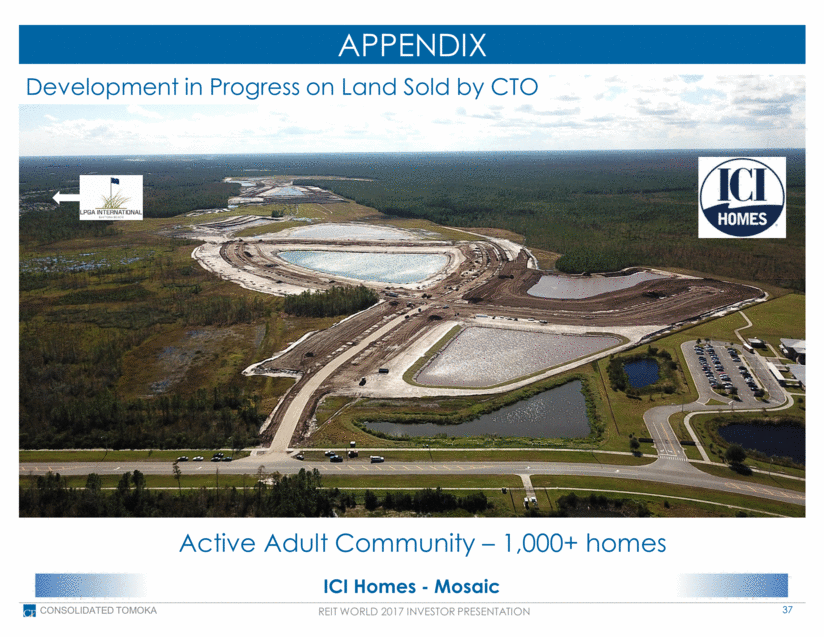
APPENDIX 37 CONSOLIDATED TOMOKA ICI Homes - Mosaic REIT WORLD 2017 INVESTOR PRESENTATION Active Adult Community – 1,000+ homes Development in Progress on Land Sold by CTO |
|
|
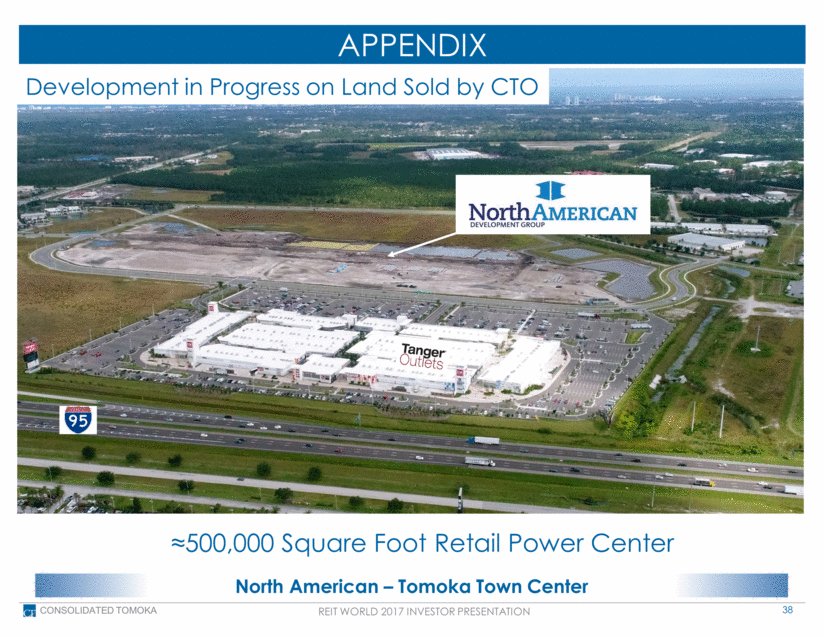
APPENDIX 38 CONSOLIDATED TOMOKA North American – Tomoka Town Center REIT WORLD 2017 INVESTOR PRESENTATION ≈500,000 Square Foot Retail Power Center Development in Progress on Land Sold by CTO |
|
|
END NOTES 39 CONSOLIDATED TOMOKA End note references utilized in this presentation There can be no assurances regarding the value ultimately received for the Company’s assets or the likelihood of monetizing our remaining land holdings or the timing, or in the case of the transactions under contract or subject to a non-binding term sheet, the likelihood that such transactions will close or the timing or final terms thereof. There can be no assurances regarding the likelihood or timing of executing the Company’s share repurchase program. Net operating income (“NOI”) relates to our Income Property Operations segment and is calculated based on our current portfolio as of November 9, 2017 reflecting: (i) expected estimated rents and costs as of November 9, 2017 for an annualized period of twelve months, excluding non-cash items including straight-line rent and amortization of lease intangibles and depreciation. As of the date of this presentation, the Company meets the required coverage ratio in the Credit Facility for repurchases of stock and anticipates, subject to customary restrictions on share repurchases, to be able to continue to make repurchases. Debt amount includes the face value of the Convertible Notes as of September 30, 2017, and the amount outstanding on the Company’s Credit Facility as of November 9, 2017, after adjusting for the income property acquisition on October 27, 2017. There can be no assurance that the cap rate range is the proper range for the Company’s portfolio of income properties or that such cap rate range would equate to an appropriate valuation range that the Company might achieve should the income property portfolio be sold as a portfolio, individually, or as part of more than one smaller portfolios comprising the entirety of the Company’s portfolio. Investment grade tenants are defined as tenants with a credit rating of BBB- or higher from the S&P rating agency and is based on our annualized rental revenue that is generated from income properties leased to investment grade tenants, including properties leased to subsidiaries of investment grade companies. There can be no assurances regarding the amount of our total investment or the timing of such investment. There can be no assurances regarding the likelihood or timing of achieving the potential stabilized yield or targeted investment yield for the applicable investments. There can be no assurances regarding the likelihood or timing of the Company’s board of directors reaching a determination to pursue the conversion of the Company into a real estate investment trust, or the likelihood or timing of the Company’s shareholders approving such a conversion. REIT WORLD 2017 INVESTOR PRESENTATION Footnotes for Slide #9 The amount for the Mitigation Bank represents the amount set forth in the term sheet for the buyer’s acquisition of approximately 70% of a to-be-formed joint venture that would own the Mitigation Bank, with the Company retaining 30%. The acres and amount include the buyer’s option to acquire 19 acres for approximately $2.0 million, in addition to the base contract for the acquisition of 26 acres for approximately $3.2 million. The acres and amount include the buyer’s option to acquire 71 acres for approximately $574,000, in addition to the base contract for the acquisition of 129 acres for approximately $2.75 million. Land sales transactions which pursuant to the contracts require the Company to incur the cost to provide the mitigation credits necessary for obtaining the applicable regulatory permits for the buyer, with such costs representing either CTO’s basis in mitigation credits that we own or the incurrence of potentially up to 5% - 10% of the contract amount noted to acquire the necessary credits from applicable mitigation banks. |
|
|
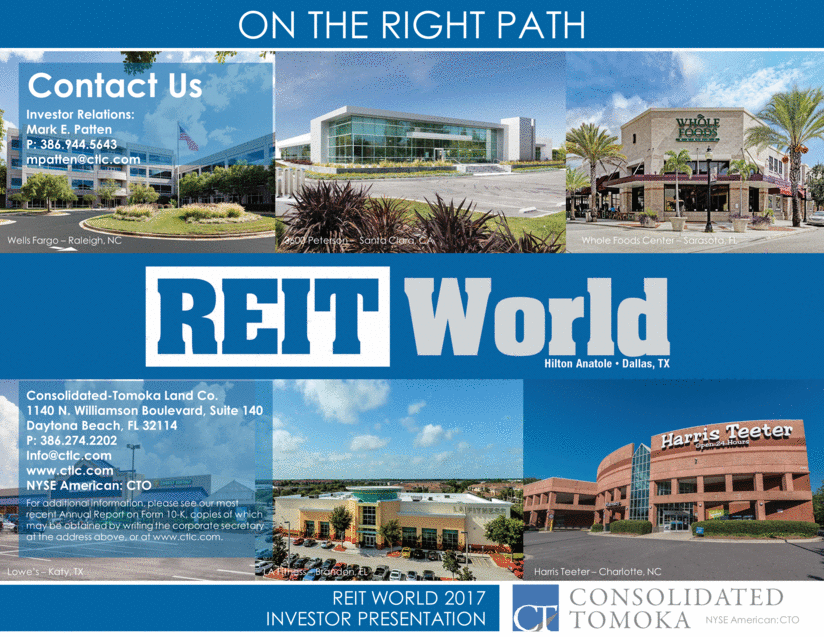
Wells Fargo – Raleigh, NC Lowe’s – Katy, TX 3600 Peterson – Santa Clara, CA Whole Foods Center – Sarasota, FL LA Fitness – Brandon, FL Harris Teeter – Charlotte, NC REIT WORLD 2017 INVESTOR PRESENTATION ON THE RIGHT PATH NYSE American: CTO Investor Relations: Mark E. Patten P: 386.944.5643 mpatten@ctlc.com Contact Us For additional information, please see our most recent Annual Report on Form 10-K, copies of which may be obtained by writing the corporate secretary at the address above, or at www.ctlc.com. Consolidated-Tomoka Land Co. 1140 N. Williamson Boulevard, Suite 140 Daytona Beach, FL 32114 P: 386.274.2202 Info@ctlc.com www.ctlc.com NYSE American: CTO |

