Attached files
| file | filename |
|---|---|
| 8-K - 8-K - ASSOCIATED BANC-CORP | form8-kcoverpage4q17invest.htm |

Associated Banc-Corp
Bank of America Merrill Lynch
Future of Financials Conference
FOURTH QUARTER
2017
Exhibit 99.1

DISCLAIMER
Important note regarding forward-looking statements:
Statements made in this presentation which are not purely historical are forward-looking statements, as defined in the Private Securities
Litigation Reform Act of 1995. This includes any statements regarding management’s plans, objectives, or goals for future operations,
products or services, and forecasts of its revenues, earnings, or other measures of performance. Such forward-looking statements may
be identified by the use of words such as “believe,” “expect,” “anticipate,” “plan,” “estimate,” “should,” “will,” “intend,” “outlook” or similar
expressions. Forward-looking statements are based on current management expectations and, by their nature, are subject to risks and
uncertainties. Actual results may differ materially from those contained in the forward-looking statements. Factors which may cause
actual results to differ materially from those contained in such forward-looking statements include those identified in the Company’s
most recent Form 10-K and subsequent SEC filings. Such factors are incorporated herein by reference.
Non-GAAP Measures
This presentation includes certain non-GAAP financial measures. These non-GAAP measures are provided in addition to, and not as
substitutes for, measures of our financial performance determined in accordance with GAAP. Our calculation of these non-GAAP
measures may not be comparable to similarly titled measures of other companies due to potential differences between companies in
the method of calculation. As a result, the use of these non-GAAP measures has limitations and should not be considered superior to, in
isolation from, or as a substitute for, related GAAP measures. Reconciliations of these non- GAAP financial measures to the most
directly comparable GAAP financial measures can be found at the end of this presentation.
Trademarks:
All trademarks, service marks, and trade names referenced in this material are official trademarks and the property of their respective
owners.
1
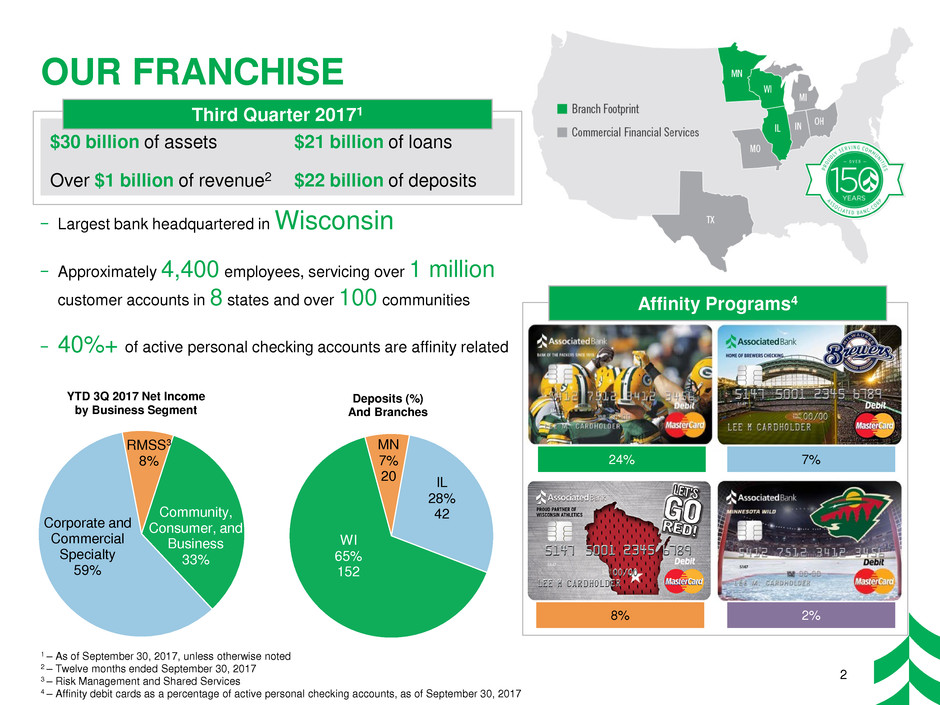
Community,
Consumer, and
Business
33%
Corporate and
Commercial
Specialty
59%
RMSS3
8%
YTD 3Q 2017 Net Income
by Business Segment
24%
8%
7%
2%
Affinity Programs4
OUR FRANCHISE
2
$30 billion of assets $21 billion of loans
Over $1 billion of revenue2 $22 billion of deposits
Third Quarter 20171
1 – As of September 30, 2017, unless otherwise noted
2 – Twelve months ended September 30, 2017
3 – Risk Management and Shared Services
4 – Affinity debit cards as a percentage of active personal checking accounts, as of September 30, 2017
− Largest bank headquartered in Wisconsin
− Approximately 4,400 employees, servicing over 1 million
customer accounts in 8 states and over 100 communities
− 40%+ of active personal checking accounts are affinity related
WI
65%
152
MN
7%
20 IL
28%
42
Deposits (%)
And Branches

Manufacturing
& Wholesale
Trade
25%
ATTRACTIVE MIDWEST MARKETS
3.2% 3.5% 3.7%
3.8% 3.8% 4.2% 4.3%
5.0% 5.3%
IA WI MN IN MO U.S. MI IL OH
Midwest
30%
All other
regions
70%
U.S.
Manufacturing
Jobs
1 – U.S. Census Bureau, Annual Estimates of the Resident Population, 2016
2 – U.S. Bureau of Labor Statistics, Manufacturing Industry Employees, seasonally adjusted, September 2017 (preliminary)
3 – U.S. Bureau of Labor Statistics, Unemployment Rates by State, seasonally adjusted, September 2017 (preliminary)
4 – U.S. Bureau of Labor Statistics, Unemployment Rates, Midwest Information Office, seasonally adjusted, September 2017 (preliminary)
Midwest holds ~20% of the U.S. population1 and
30% of all U.S. manufacturing jobs2
3
Large Population Base With a Manufacturing and Wholesale Trade-Centric Economy
Several Midwestern states have unemployment rates3 below
the national average
Dark green bars denote ASB branch states
Commercial and Business Lending
ASB Loan Composition by Industry
Madison, WI……………………
Rochester, MN…………………
Wausau, WI……………………
Green Bay, WI…………………
Minneapolis – St. Paul, MN…..
2.3%
2.5%
2.7%
2.8%
2.9%
Supporting Strong Employment Base and Healthy Consumer Credit
Select ASB Metro Market
Unemployment Rates4

THIRD QUARTER UPDATE
4
Growing
Interest Income
Improving
Credit Dynamics
Continued Efficiency
Improvement
Expanding
Bottom Line
3Q17: Net income available to common equity of $63 million, or $0.41 per common share
Balance
Sheet
Management
Mid-to-high single digit
annual average loan
growth
Maintain Loan to
Deposit ratio under
100%
Improving NIM trend
Fee
Businesses
Improving year over
year fee-based
revenues
Declining year over
year mortgage banking
revenue
Expense
Management
Capital
& Credit
Management
Approximately 1%
higher than the prior
year
Continued
improvement to our
efficiency ratio
Continue to follow stated
corporate priorities for
capital deployment
Provision expected to
adjust with changes to
risk grade, other
indications of credit
quality, and loan volume
YoY
Progress
YoY
Progress
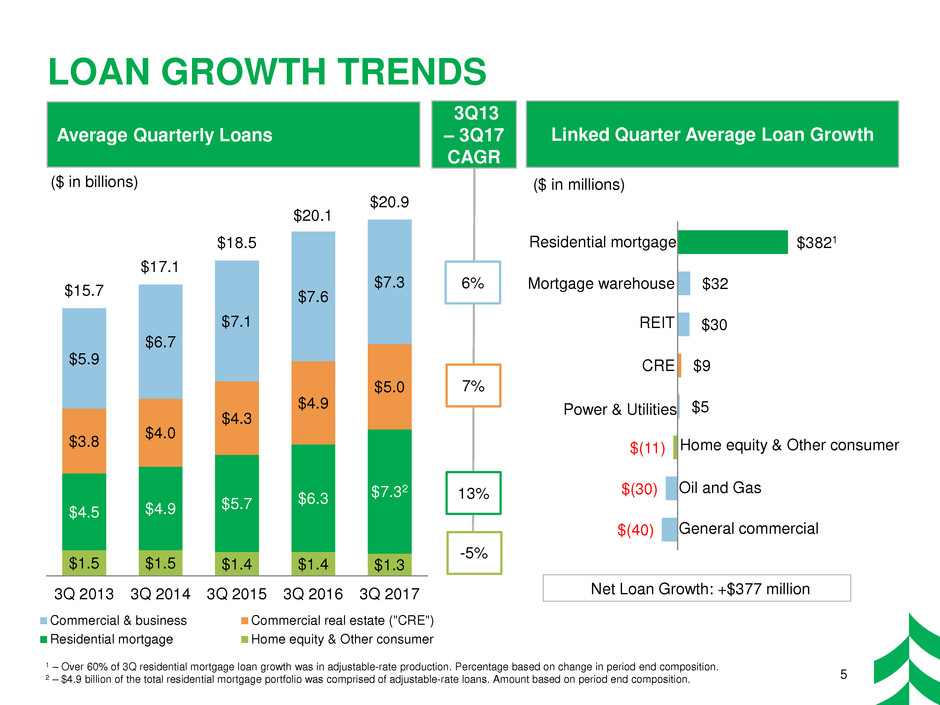
$1.5 $1.5 $1.4 $1.4 $1.3
$4.5 $4.9 $5.7
$6.3 $7.3
2
$3.8 $4.0
$4.3
$4.9
$5.0
$5.9
$6.7
$7.1
$7.6
$7.3 $15.7
$17.1
$18.5
$20.1
$20.9
3Q 2013 3Q 2014 3Q 2015 3Q 2016 3Q 2017
Commercial & business Commercial real estate ("CRE")
Residential mortgage Home equity & Other consumer
Net Loan Growth: +$377 million
LOAN GROWTH TRENDS
($ in billions)
5%
Average Quarterly Loans
6%
7%
13%
$(40)
$(30)
$(11)
$5
$9
$30
$32
$3821
Home equity & Other consumer
CRE
Residential mortgage
Power & Utilities
Mortgage warehouse
REIT
Oil and Gas
General commercial
Linked Quarter Average Loan Growth
1 – Over 60% of 3Q residential mortgage loan growth was in adjustable-rate production. Percentage based on change in period end composition.
2 – $4.9 billion of the total residential mortgage portfolio was comprised of adjustable-rate loans. Amount based on period end composition.
($ in millions)
5
3Q13
– 3Q17
CAGR
-5%

$2.2 $2.2
$3.2
$3.7
$2.6
$18.9 $18.7
$21.1
$22.2 $22.6
3Q 2013 3Q 2014 3Q 2015 3Q 2016 3Q 2017
12.1% 12.1%
15.6%
17.2%
11.7%
Loan to Deposit Ratio
CONSISTENT DEPOSIT GROWTH
($ in billions)
Period End Deposits &
Customer Funding
Average Quarterly Deposits
6%
6%
$1.8 $1.5 $1.6 $1.6 $2.2
$1.2 $1.3 $1.4 $1.4
$1.5
$7.6 $7.7
$9.5 $9.1
$9.4
$2.8 $3.1
$3.2 $4.2
$4.3 $4.3 $4.2
$4.6
$5.2
$5.0
$17.6 $17.9
$20.3
$21.4
$22.4
3Q 2013 3Q 2014 3Q 2015 3Q 2016 3Q 2017
Time deposits Savings
Money market Interest-bearing demand
Noninterest-bearing demand
($ in billions)
NTDs as % of Total Deposits
Network Transaction Deposits ("NTD")
Customer Funding
Customer Deposits1 6
1 – Total deposits excluding network transaction deposits
12%
85%
94%
90% 91%
94%
3Q13
– 3Q17
CAGR
4%
5%

ACQUISITION OF BANK MUTUAL
7
Associated Banc-Corp
Acquisition of
July 20, 2017
Bank Mutual Profile
Third Quarter 2017
Branches1 58
Loans $2.0bn
Deposits $1.9bn
Revenue2 $99mm
Expenses2 $71mm
Transaction Pricing
100% stock transaction
- 0.422 exchange ratio
1.6x price / tangible book value per share
of $6.33 as of June 30, 2017
12.5x price / 2017E EPS with fully phased-
in 45% after-tax cost savings3
Founded 1892
Milwaukee, WI
1 – 57 branches in WI and one branch in MN
2 – Twelve months ended September 30, 2017
3 – Based on BKMU IBES median 2017E EPS of $0.38

ASSOCIATED’S PRO FORMA FOOTPRINT
Pro Forma Branch Footprint
Strengthens our position as largest bank
headquartered in the state of Wisconsin
- > $32bn combined total assets
- Adds > 120,000 customer accounts to
the Associated franchise
Significant efficiency opportunities
- 50% of Bank Mutual branches are within
1 mile of an Associated branch
- Several shared key technology vendors
- Positioned to further invest in and better
support the customer experience
Continued commitment to supporting the
socioeconomic health of our combined
communities and markets
- Expanding services into nearly a dozen
new markets
- Offers new customers access to
Associated's broader network and
solutions
Improved Scale and Customer Reach
8

Commercial
& Business
Lending
34%
CRE
Investor
18%
Construction
8%
Residential
Mortgage
34%
Home Equity
& Other
Consumer
6%
Money
Market
36%
Noninterest-
bearing
demand
23%
Interest-
bearing
demand
22%
Savings
7%
Time
Deposit
12%
Money
Market
37%
Noninterest-
bearing
demand
23%
Interest-
bearing
demand
22%
Savings
7%
Time
Deposit
11%
Money
Market
28%
Noninterest-
bearing
demand
16%
Interest-
bearing
demand
12%
Savings
12% Time
Deposit
32%
Commercial
& Business
Lending
18%
CRE
Investor
42%
Construction
8%
Residential
Mortgage
23%
Home Equity
& Other
Consumer
9%
PRO FORMA LOANS & DEPOSITS
Note: Figures as of September 30, 2017
1 – Cost of deposits includes interest-bearing deposits only
Lo
an
s
D
ep
os
its
Associated
Bank Mutual
Pro Forma
Associated
Bank Mutual
Pro Forma
9
Total Loans = $20.9bn
Yield on Loans = 3.77%
Total Loans = $2.0bn
Yield on Loans = 4.09%
Total Loans = $22.9bn
Yield on Loans = 3.80%
Total Deposits = $22.3bn
Cost of Deposits1 = 0.63%
Total Deposits = $1.9bn
Cost of Deposits1 = 0.45%
Total Deposits = $24.3bn
Cost of Deposits1 = 0.62%
Commercial
& Business
Lending
35%
CRE
Investor
16%
Construction
8%
Residential
Mortgage
35%
Home Equity
& Other
Consumer
6%
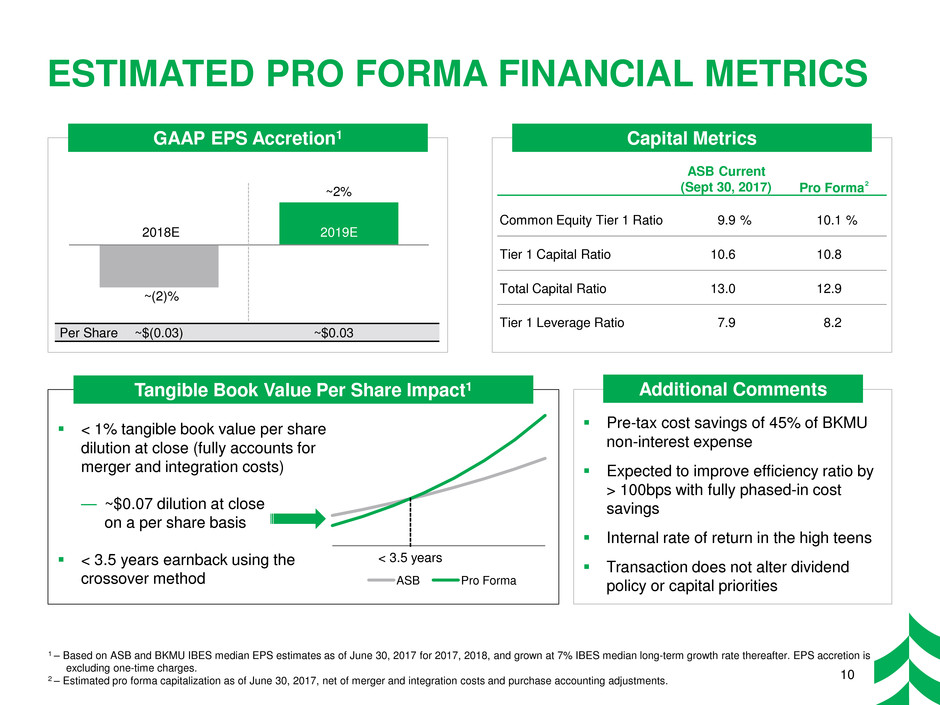
ESTIMATED PRO FORMA FINANCIAL METRICS
1 – Based on ASB and BKMU IBES median EPS estimates as of June 30, 2017 for 2017, 2018, and grown at 7% IBES median long-term growth rate thereafter. EPS accretion is
excluding one-time charges.
2 – Estimated pro forma capitalization as of June 30, 2017, net of merger and integration costs and purchase accounting adjustments.
GAAP EPS Accretion1
Pre-tax cost savings of 45% of BKMU
non-interest expense
Expected to improve efficiency ratio by
> 100bps with fully phased-in cost
savings
Internal rate of return in the high teens
Transaction does not alter dividend
policy or capital priorities
Additional Comments
Capital Metrics
Tangible Book Value Per Share Impact1
< 1% tangible book value per share
dilution at close (fully accounts for
merger and integration costs)
— ~$0.07 dilution at close
on a per share basis
< 3.5 years earnback using the
crossover method
Per Share ~$(0.03) ~$0.03
~2%
~(2)%
2018E 2019E
10
2
ASB Current
(Sept 30, 2017)
Pro Forma
Common Equity Tier 1 Ratio 9.9 % 10.1 %
Tier 1 Capital Ratio 10.6 10.8
Total Capital Ratio 13.0 12.9
Tier 1 Leverage Ratio 7.9 8.2
ASB Pro Forma
< 3.5 years
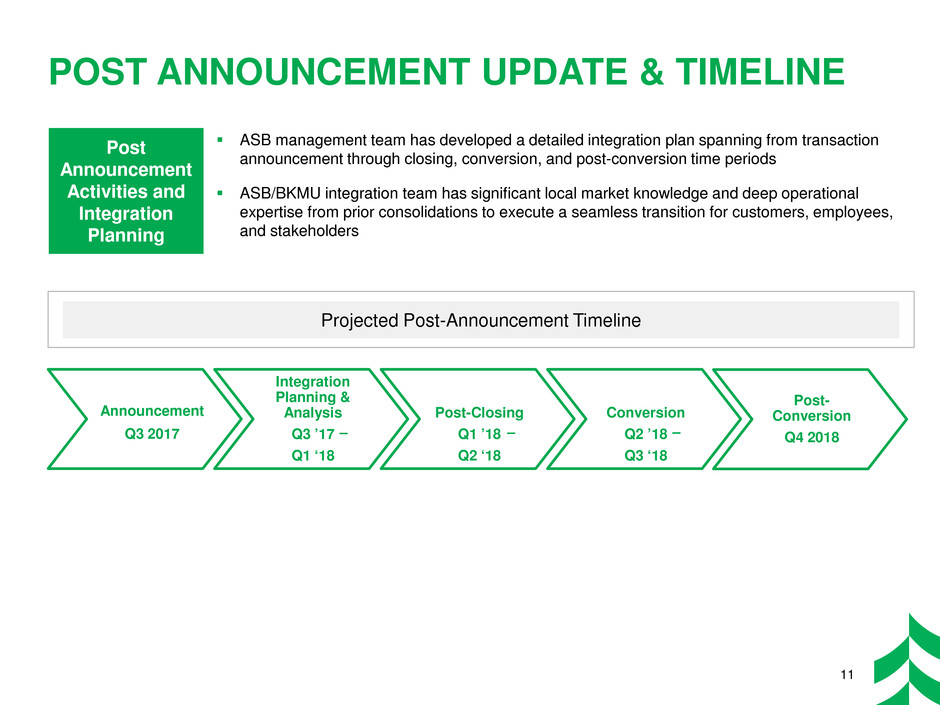
POST ANNOUNCEMENT UPDATE & TIMELINE
Post
Announcement
Activities and
Integration
Planning
ASB management team has developed a detailed integration plan spanning from transaction
announcement through closing, conversion, and post-conversion time periods
ASB/BKMU integration team has significant local market knowledge and deep operational
expertise from prior consolidations to execute a seamless transition for customers, employees,
and stakeholders
Projected Post-Announcement Timeline
Integration
Planning &
Analysis
Q3 ’17
Q1 ‘18
Post-Closing
Q1 ’18
Q2 ‘18
Conversion
Q2 ’18
Q3 ‘18
Post-
Conversion
Q4 2018
Announcement
Q3 2017 –
–
–
11

ACCELERATES 2017 STRATEGIC PRIORITIES
Strengthening
Customer
Relationships
Delivering
on our
Strategy
Expanding our
Community
Presence
Providing
Long-term Value
to Shareholders
A low-risk transaction with significant opportunities for cost savings
Expected to produce modest initial dilution to tangible book value per share
with positive EPS accretion in 2019
Expected to improve efficiency ratio by > 100bps with fully phased-in cost
savings
Strengthens core deposit franchise
Enhances branch network and density
Increases current market share and expands services to new communities
Delivers smaller sized, in-market, depository institution acquisition
Drives efficiency through improved scale and distribution
Disciplined transaction terms with attractive economics
Adds over 120,000 customer accounts and nearly 1,000 commercial
relationships
Extends Associated’s specialized products to Bank Mutual’s customer base
Positions Associated to gain efficiencies and further invest in customer
experience
12

$46 $48 $49 $47 $49
$15 $16 $15 $16 $17
$7 $61 $64 $64 $63
$73
2013 2014 2015 2016 20172
• On October 2, 2017, we completed the acquisition of a wealth management organization, Whitnell & Co., an Oak
Brook, Illinois based, $1 billion AUM registered investment advisor, to further complement Associated’s investment
and asset management capabilities, especially in Chicago
• Whitnell’s 28 professionals provide affluent Mid-Western clients with a complete set of family office services
centered around wealth management and generational wealth transfer
− The acquisition adds a strong team to our existing Chicago-land private banking presence and introduces
new services and capabilities to Associated’s existing client base
− The acquisition increases both assets under management and related run-rate revenue by more than 10%
ASSET MANAGEMENT EXPANSION
Enhanced Big-Firm Financial Services With a Family Touch
Assets Under Management (“AUM”) Trust Service Fees and Brokerage
and Annuity Commissions
($ in billions) ($ in millions)
13
ATC Whitnell Trust Service Fees Whitnell
$7.4
$8.0 $7.7
$8.3
$9.2
$1.0
2013 2014 2015 2016 Sept 20171
1 – Pro Forma Associated Trust Company (“ATC”), including Whitnell
2 – Pro Forma Associated Trust Company, including Whitnell, for the twelve months ended September 30, 2017
Brokerage & Annuity Commissions
>$10Bn

70% 70% 70%
68%
66% 68% 68% 68%
66%
64%
YTD 3Q13 YTD 3Q14 YTD 3Q15 YTD 3Q16 YTD 3Q17
Federal Reserve Fully tax-equivalent
Efficiency Ratio1
Enhanced
Automation
Operational
Efficiencies
Branch
Consolidations
Branch Staffing
Initiatives
OVERALL EXPENSE EFFICIENCY
Efficiency Drivers
1 – The efficiency ratio as defined by the Federal Reserve guidance is noninterest expense (which includes the provision for unfunded commitments) divided by the
sum of net interest income plus noninterest income, excluding investment securities gains / losses, net. The fully tax-equivalent efficiency ratio, which is a non-GAAP
financial measure, is noninterest expense (which includes the provision for unfunded commitments), excluding other intangible amortization, divided by the sum of fully
tax-equivalent net interest income plus noninterest income, excluding investment securities gains / losses, net. Refer to the appendix for a reconciliation of the Federal
Reserve efficiency ratio to the fully tax-equivalent efficiency ratio.
14
~240
214
2.92%
2.41%
2013 2014 2015 2016 Sept 2017
Branches (period end)
Annualized YTD
Noninterest Expense /
YTD Average Assets

240
214
~
73%
44%
September 2013 September 2017
27%
56%
September 2013 September 2017
Customers continue to seek more efficient ways to bank. Digital capabilities are key to meeting their
rising expectations. Associated is actively enhancing its multichannel approach and will be deploying
new mobile solutions in early 2018.
SHIFT TO DIGITAL CHANNELS
15
Branch Transactions / Total Transactions Adopting a Multichannel Approach
Online
Banking
Branch
ATM
Chat,
Email,
Text
Snap
Deposit
Call
Center
Branches
Transactions by Digital & Remote Channels
ATM
Lockbox
Remote Deposit Capture
SnapDeposit

Funding Organic Growth Paying a Competitive Dividend
Non-Organic Growth Opportunities Share Repurchases
$15.7 $17.1
$18.5
$20.1 $20.9
3Q 2013 3Q 2014 3Q 2015 3Q 2016 3Q 2017
CAPITAL PRIORITIES
16
$0.33
$0.37
$0.41
$0.45
$0.50
2013 2014 2015 2016 2017
11%
CAGR
7%
CAGR
Average Quarterly Loans; ($ in billions) Full Year Declared Dividends
2015
$60
$180
$439
$532 $552
$589
2012 2013 2014 2015 2016 YTD 2017
Cumulative Common Share Repurchases
($ in millions)
2017
2017
Announced
Completed
1 2
3 4

Earnings Per Share Dividends
Shareholder Gain Return on Average Common Equity
$0.34
$0.41
3Q 2016 3Q 2017
Return on average CET11
$0.12 $0.14
4Q 2016 4Q 2017
15%
annualized
TSR
EXPANDING BOTTOM LINE
17
As of September 30, 2017
Exceptional Value
1 – Refer to the appendix for a reconciliation of average common equity Tier 1 to average common equity
“We’ve shaped our success
around a shared vision to
become the Midwest’s
premier financial services
company, distinguished by
consistent, quality customer
experiences, built upon a
strong commitment to our
colleagues and the
communities we serve,
resulting in exceptional
value to our shareholders
through economic cycles.”
+21%
YoY
+17%
YoY
10.5%
11.7%
Return on average common equity
4Q Dividend Declared
49%
105%
Three Years Five Years
7.1% 8.2%
3Q 2016 3Q 2017

APPENDIX

$163 $128 $126 $118 $119
$127 $147 $134 $114 $92
$290 $275 $260 $232 $211
3Q 2016 4Q 2016 1Q 2017 2Q 2017 3Q 2017
1.4% 1.4% 1.4% 1.4% 1.3%
5.5% 5.7%
6.7%
5.4% 5.2%
3Q 2016 4Q 2016 1Q 2017 2Q 2017 3Q 2017
ALLL / Total Loans
Oil and Gas ALLL / Oil and Gas Loans
CREDIT QUALITY
($ IN MILLIONS)
Potential Problem Loans Nonaccrual Loans
19
($4)
$3
$0
$1 $3
$22
$6 $12 $8
$9
$6
$13
$11
3Q 2016 4Q 2016 1Q 2017 2Q 2017 3Q 2017
$18
$270 $276 $262 $226 $220
$171
$75 $78
$37 $39
$441
$351 $340
$263 $259
3Q 2016 4Q 2016 1Q 2017 2Q 2017 3Q 2017
Net Charge Offs (Recoveries) Allowance to Total Loans / Oil and Gas Loans
Oil and Gas Oil and Gas
Oil and Gas

Manufacturing
and Wholesale
Trade
25%
Power &
Utilities
14%
Real Estate
12%
Oil & Gas
8%
Finance &
Insurance
12%
Health Care and
Soc. Assist.
5% 1 – Excludes $0.4 billion Other consumer portfolio
2 – Other Midwest includes Missouri, Indiana, Ohio, Michigan and Iowa
3 – Principally reflects the oil and gas portfolio
4 – Based on outstanding commitments of $917 million
5 – Our largest tenant exposure is 5%, spread over six loans, to a national investment grade grocer
C&BL by Geography
$7.3 billion
CRE by Geography
$5.0 billion
Multi-Family
29%
Retail5
24%
Office / Mixed
Use
20%
Industrial
10%
1-4 Family
Construction
9%
Hotel / Motel
5%
Other
3%
East Texas
North
Louisiana
Arkansas
17%
South Texas
& Eagle Ford
17%
Permian
16%
Rockies
14%
Marcellus
Utica
Appalachia
11%
Mid-
Continent
(primarily OK
& KS)
8% Gulf Shallow
4%
Gulf Coast
4%
Bakken
3%
Other
(Onshore
Lower 48)
6%
Wisconsin
28%
Illinois
15%
Minnesota
7%
Texas3
10%
Other
Midwest2
9%
Other
31%
Wisconsin
28%
Illinois
21%
Minnesota
9%
Other
Midwest2
26%
Texas
4%
Other
12%
LOANS STRATIFICATION OUTSTANDINGS AS OF SEPTEMBER 30, 2017
20
Total Loans1
Wisconsin
31%
Illinois
26%
Other
Midwest2
13%
Minnesota
10%
Texas
4%
Other
16%
C&BL by Industry
$7.3 billion
Oil and Gas Lending4
$577 million
CRE by Property Type
$5.0 billion
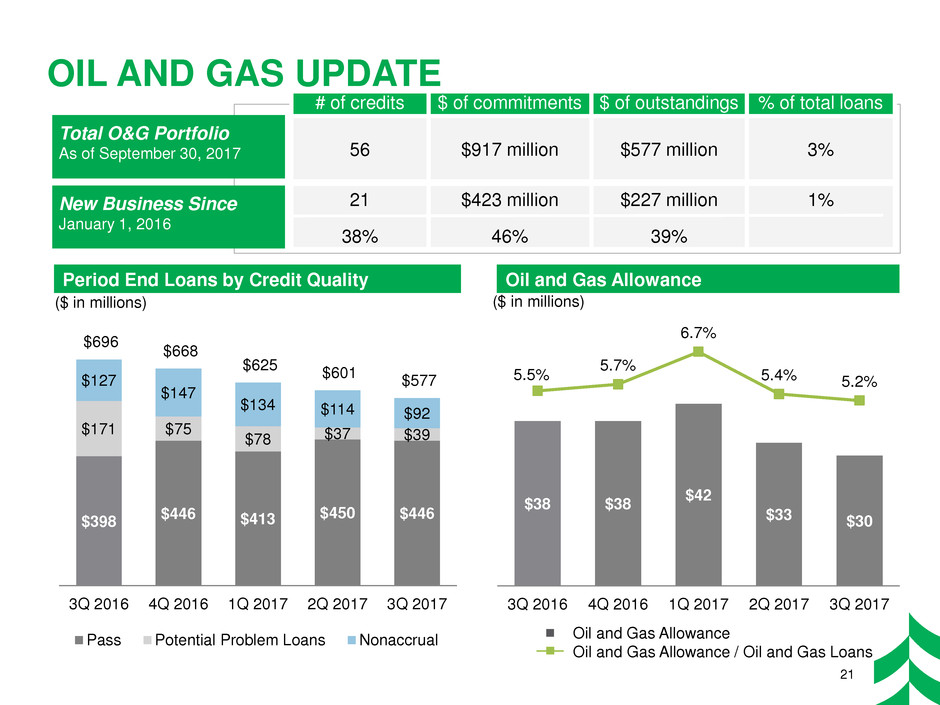
OIL AND GAS UPDATE
$398 $446 $413 $450 $446
$171 $75
$78 $37 $39
$127
$147
$134 $114 $92
$696 $668
$625 $601 $577
3Q 2016 4Q 2016 1Q 2017 2Q 2017 3Q 2017
Pass Potential Problem Loans Nonaccrual
Period End Loans by Credit Quality Oil and Gas Allowance
$38 $38 $42
$33 $30
5.5% 5.7%
6.7%
5.4% 5.2%
3Q 2016 4Q 2016 1Q 2017 2Q 2017 3Q 2017
($ in millions) ($ in millions)
21
Total O&G Portfolio
As of September 30, 2017
# of credits $ of commitments $ of outstandings % of total loans
56 $917 million $577 million 3%
21
38%
$423 million
46%
$227 million
39%
1%
New Business Since
January 1, 2016
Oil and Gas Allowance
Oil and Gas Allowance / Oil and Gas Loans

$90 $93 $93 $103
$122
$57 $60 $64
$66
$76 $34
$38 $39
$36
$39
$181
$191 $195
$205
$237
3Q 2013 3Q 2014 3Q 2015 3Q 2016 3Q 2017
Commercial Retail Investment and other1
POSITIONED FOR HIGHER INTEREST RATES
ASSET SENSITIVE PROFILE
($ in millions)
22
Interest Income & Net Interest Margin Average Deposit Rates
3.13% 3.06%
2.82% 2.77% 2.84%
Net interest margin
1 – Our LIBOR-based loans typically reprice the first of the month in arrears. Since the Fed tends to raise rates mid-month, we tend to see a 6+ week lag in repricing.
3Q13 vs 3Q17
Interest
Income
Change
+$56 million
3Q13 vs 3Q17
NII Change
+$29 million
3Q13 vs 3Q17
Interest
Expense
Change
-$27 million
Savings
Money Market without NTD Time Deposits
Network Transaction Deposits
Money Market with NTD (As Reported)
0.05% 0.05% 0.05% 0.05% 0.06%
0.30% 0.31%
0.42%
0.52%
0.65%
0.78% 0.78% 0.79%
0.85%
0.97%
3Q 2016 4Q 2016 1Q 2017 2Q 2017 3Q 2017
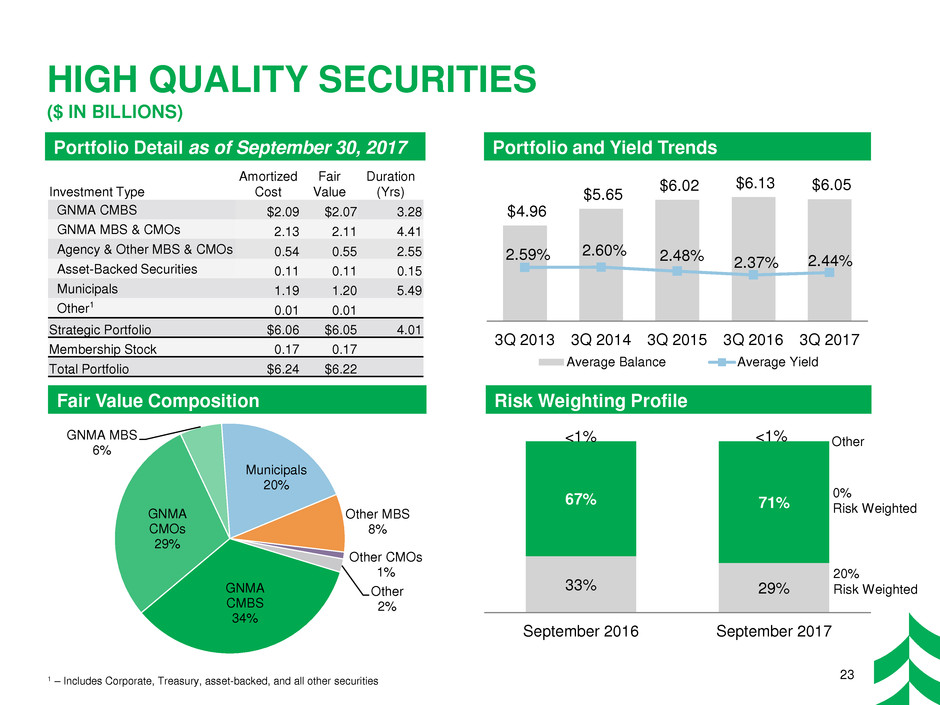
Fair Value Composition Risk Weighting Profile
$4.96
$5.65 $6.02
$6.13 $6.05
2.59% 2.60% 2.48% 2.37% 2.44%
1.00%
2.00%
3.00%
4.00%
5.00%
3Q 2013 3Q 2014 3Q 2015 3Q 2016 3Q 2017
Average Balance Average Yield
33% 29%
67% 71%
<1% <1%
September 2016 September 2017
HIGH QUALITY SECURITIES
($ IN BILLIONS)
Investment Type
Amortized
Cost
Fair
Value
Duration
(Yrs)
GNMA CMBS $2.09 $2.07 3.28
GNMA MBS & CMOs 2.13 2.11 4.41
Agency & Other MBS & CMOs 0.54 0.55 2.55
Asset-Backed Securities 0.11 0.11 0.15
Municipals 1.19 1.20 5.49
Other1 0.01 0.01
Strategic Portfolio $6.06 $6.05 4.01
Membership Stock 0.17 0.17
Total Portfolio $6.24 $6.22
GNMA
CMBS
34%
GNMA
CMOs
29%
GNMA MBS
6%
Municipals
20%
Other MBS
8%
Other CMOs
1%
Other
2%
Portfolio Detail as of September 30, 2017 Portfolio and Yield Trends
0%
Risk Weighted
Other
20%
Risk Weighted
1 – Includes Corporate, Treasury, asset-backed, and all other securities 23

Efficiency Ratio YTD 3Q13 YTD 3Q14 YTD 3Q15 YTD 3Q16 YTD 3Q17
Federal Reserve efficiency ratio 70.20% 70.19% 69.79% 67.51% 65.64%
Fully tax-equivalent adjustment (1.44)% (1.35)% (1.38)% (1.32)% (1.27)%
Other intangible amortization (0.42)% (0.40)% (0.34)% (0.20)% (0.18)%
Fully tax-equivalent efficiency ratio 68.34% 68.44% 68.07% 65.99% 64.19%
The efficiency ratio as defined by the Federal Reserve guidance is noninterest expense (which includes the provision for unfunded commitments) divided by
the sum of net interest income plus noninterest income, excluding investment securities gains / losses, net. The fully tax-equivalent efficiency ratio, which is a
non-GAAP financial measure, is noninterest expense (which includes the provision for unfunded commitments), excluding other intangible amortization,
divided by the sum of fully tax-equivalent net interest income plus noninterest income, excluding investment securities gains / losses, net. Management
believes the fully tax-equivalent efficiency ratio, which adjusts net interest income for the tax-favored status of certain loans and investment securities, to be
the preferred industry measurement as it enhances the comparability of net interest income arising from taxable and tax-exempt sources.
RECONCILIATION AND DEFINITIONS OF
NON-GAAP ITEMS
24
Average Tangible Common Equity and Average Common Equity Tier 1
($ in millions) 3Q 2016 3Q 2017
Average common equity $2,911 $3,025
Average goodwill and other intangible assets, net (988) (986)
Average tangible common equity 1,923 2,039
Less: Accumulated other comprehensive income / loss (3) 49
Less: Deferred tax assets / deferred tax liabilities, net 33 32
Average common equity Tier 1 $1,953 $2,120
