Attached files
| file | filename |
|---|---|
| 8-K - Superior Drilling Products, Inc. | form8-k.htm |
| EX-99.1 - Superior Drilling Products, Inc. | ex99-1.htm |

© 2017 Superior Drilling Products Third Quarter 2017 Financial Results Conference Call November 9, 2017 NYSE American: SDPI

© 2017 Superior Drilling Products 2 Safe Harbor Statement These slides and the accompanying oral presentation contain “forward - looking statements” within the meaning of the safe harbor p rovisions, 15 U.S.C. † 78u - 5, of the Private Securities Litigation Reform Act of 1995. All statements, other than statements of historical fact included in these slides and the accompanying oral presentation, regarding our strategy, future operations, financial position, estimated re venue and losses, projected costs, prospects, plans and objectives of management, are forward - looking statements. The use of words “could, ” “believe,” “anticipate,” “intend,” “estimate,” “expect,” “may,” “continue,” “predict,” “potential,” “project”, “forecast,” “s hou ld” or “plan, and similar expressions are intended to identify forward - looking statements, although not all forward - looking statements contain such identi fying words. Certain statements in these slides and the accompanying oral presentation may constitute forward - looking statements, including s tatements regarding the volatility of oil and natural gas prices; the cyclical nature of the oil and gas industry; availability of fina nci ng, flexibility in restructuring existing debt and access to capital markets; consolidation within our customers’ industries; competitive produc ts and pricing pressures; our reliance on significant customers, specifically, Baker Hughes; our limited operating history; fluctuations in our operating results; our dependence on key personnel; costs of raw materials; our dependence on third party suppliers; unforeseen risks i n o ur manufacturing processes; the need for skilled workers; our ability to successfully manage our growth strategy; unanticipated ris ks associated with and our ability to integrate, acquisitions; current and potential governmental regulatory actions in the United States a nd regulatory actions and political unrest in other countries; terrorist threats or acts, war and civil disturbances; our ability to protec t o ur intellectual property; impact of environmental matters, including future environmental regulations; implementing and complying with safety po licies; breaches of security in our information systems; related party transactions with our founders; and risks associated with our com mon stock . These statements reflect the beliefs and expectations of the Company and are subject to risks and uncertainties that may caus e a ctual results to differ materially. These risks and uncertainties include, among other factors, worldwide economic activity; the le vel of exploration and production activity; interest rates and the cost of capital; environmental regulation; federal, state and foreign policie s r egarding exploration and development of oil and gas; the ability of OPEC to set and maintain production levels and pricing; government al regulations regarding future oil and gas exploration and production; the cost of exploring and producing oil and gas; the cost of develop ing alternative energy sources; the availability, expiration date and price of leases; the discovery rate of new oil and gas reserves; the su cce ss of drilling for oil and gas in unconventional resource plays such as shale formations; technological advances; terrorist attacks and similar dis ruptive unlawful activities; weather conditions. These and other factors could adversely affect the outcome and financial effects of the Company’s plans and described herein. Therefore, you should not rely on any of these forward - looking statements. Any forward - looking stat ement made by us in these slides and the accompanying oral presentation is based only on information currently available to us and spe aks only as of the date on which it is made. We undertake no obligation to publicly update any forward - looking statement, whether written or oral, that may be made from time to time, whether as a result of new information, future developments or otherwise. This presentation will discuss some non - GAAP financial measures, which the Company believes are useful in evaluating our performance. You should not consider the presentation of this additional information in isolation or as a substitute for results compared in accordance with GAAP. The Company has provided reconciliations of comparable GAAP to non - GAAP measures in tables found in the Supplemental Information portion of this presentation .

© 2017 Superior Drilling Products Troy Meier Chairman and Chief Executive Officer

© 2017 Superior Drilling Products 4 Strong revenue growth with exceptional operating leverage ▪ Revenue almost doubled over prior - year period to $4.4 million ▪ Strong operating leverage drove high revenue conversion ▪ Net income was $586 thousand, or $0.02 per diluted share Larger deployed DnR fleet results in increased related tool revenue ▪ Growing royalty and maintenance fees: up to $1.2 million from $0.1 million ▪ Realized value in a widening range of applications – more than one tool per well Drilling rig increase drives drill bit refurbishment ▪ Supporting beyond our contracted area of Rockies, CA and AK ▪ Renegotiating contract ▪ Providing other contract services to various customers Patent pending V Stream sales gaining traction ▪ High - tech stabilization tool that outperforms standard technology Continued advancement of Open Hole Strider Third Quarter 2017 Highlights Compared to prior year period unless otherwise noted

© 2017 Superior Drilling Products Financial Results Christopher D. Cashion Chief Financial Officer

© 2017 Superior Drilling Products 6 $0.4 $0.5 $1.1 $1.6 $1.3 $1.8 $1.8 $2.3 $2.5 $3.2 3Q 2016 4Q 2016 1Q 2017 2Q 2017 3Q 2017 Contract Services Revenue Tool Revenue $2.3 $3.4 $4.4 $4.0 $2.3 Total revenue in 3Q 2017 nearly doubled over the prior - year period ▪ Tool revenue comprised 72% of total revenue ▪ Larger deployed fleet drove royalty, maintenance and repair fees Contract Services revenue tripled over prior - year period ▪ More drill bit refurbishment • R ig count improvement • Higher volume from non - contracted areas ▪ Weekly average rig count in 3Q 2017 up 6% from trailing 2Q 2017, and 97% higher than 3Q 2016 Sequentially, total revenue was up 10% Significant Revenue Growth Numbers may not sum due to rounding ($ in millions)
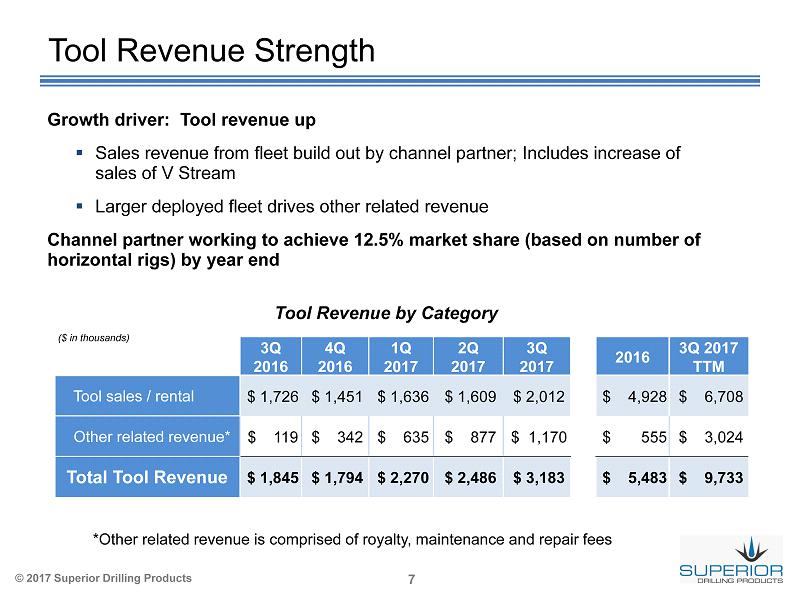
© 2017 Superior Drilling Products 7 Growth driver: Tool revenue up ▪ Sales revenue from fleet build out by channel partner; Includes increase of sales of V Stream ▪ Larger deployed fleet drives other related revenue Channel partner working to achieve 12.5% market share (based on number of horizontal rigs) by year end Tool Revenue Strength Tool Revenue by Category 3Q 2016 4Q 2016 1Q 2017 2Q 2017 3Q 2017 2016 3Q 2017 TTM Tool sales / rental $ 1,726 $ 1,451 $ 1,636 $ 1,609 $ 2,012 $ 4,928 $ 6,708 Other related revenue* $ 119 $ 342 $ 635 $ 877 $ 1,170 $ 555 $ 3,024 Total Tool R evenue $ 1,845 $ 1,794 $ 2,270 $ 2,486 $ 3,183 $ 5,483 $ 9,733 ($ in thousands) *Other related revenue is comprised of royalty, maintenance and repair fees

© 2017 Superior Drilling Products 8 $1.0 $1.2 $1.2 $1.5 $1.7 $1.3 $1.6 $1.5 $1.2 $1.1 $0.9 $0.9 $0.9 $0.9 $0.9 3Q 2016 4Q 2016 1Q 2017 2Q 2017 3Q 2017 Cost of Revenue S G & A D & A $3.7 $ 3.6 $ 3.7 $3.2 $ 3.6 ($ in millions) Strong Cost Discipline Operating Expenses and Operating Income C ost of revenue as a percentage of sales down on higher volume SG&A lower sequentially due to reduced professional fees and lower R&D Operating income improved over both the prior - year and trailing periods from volume expansion ($1.0) ($2.2) ($0.2) $0.4 $0.7 16.2% 10.4% (94.1)% ( 42.6)% (7.3)% Operating Income Operating Expenses
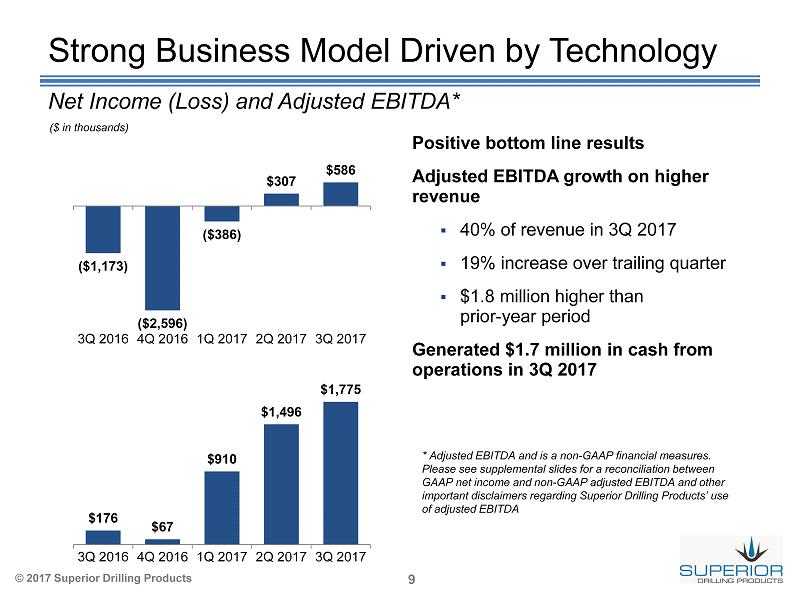
© 2017 Superior Drilling Products 9 Strong Business Model Driven by Technology * Adjusted EBITDA and is a non - GAAP financial measures. Please see supplemental slides for a reconciliation between GAAP net income and non - GAAP adjusted EBITDA and other important disclaimers regarding Superior Drilling Products’ use of adjusted EBITDA $176 $67 $910 $1,496 $1,775 3Q 2016 4Q 2016 1Q 2017 2Q 2017 3Q 2017 Net Income (Loss) and Adjusted EBITDA* ($ in thousands) Positive bottom line results Adjusted EBITDA growth on higher revenue ▪ 40% of revenue in 3Q 2017 ▪ 19% increase over trailing quarter ▪ $1.8 million higher than prior - year period Generated $1.7 million in cash from operations in 3Q 2017 ($1,173) ($2,596) ($386) $307 $586 3Q 2016 4Q 2016 1Q 2017 2Q 2017 3Q 2017

© 2017 Superior Drilling Products 10 Strengthening Balance Sheet Cash and Equivalents Total Debt $10.5 $8.8 $5.9 $5.7 $ 9.7 $ 7.9 $ 7.9 7.9 12/31/2015 12/31/2016 6/30/2017 9/30/2017 SDPI Hard Rock $ 20.2 $ 16.7 $ 13.6 $ 13.8 ($ in millions) $1.3 $2.2 $1.3 $2.7 12/31/2015 12/31/2016 6/30/2017 9/30/2017 Cash provided by operations of $1.4 million year - to - date ▪ Operating leverage on higher volumes ▪ Improved DSOs in the quarter Total debt reduced $3.1 million, or 18%, since year - end 2016 Quarterly debt service: $450 thousand per quarter (principal & interest) $4.2 million 5.25% mortgage due August 15, 2018 expect to refinance in 1H 2018 Hard Rock principal payments in 2018 of $2 million: $0.5 million in each of January, March, May and July 2018

© 2017 Superior Drilling Products 11 Twelve - Month Financial Results ($ in millions) $1.7 $4.5 $5.5 $9.7 2016 3Q 2017 TTM Contract Services Revenue Tool Revenue $14.2 $7.2 Revenue $4.5 $5.5 $5.8 $5.5 $4.3 $3.7 2016 3Q 2017 TTM Cost of Revenue SG&A D&A $14.5 $ 14.7 Operating Expenses Adjusted EBITDA* ($1,531) $4,249 2016 3Q 2017 TTM * Adjusted EBITDA and is a non - GAAP financial measures. Please see supplemental slides for a reconciliation between GAAP net in come and non - GAAP adjusted EBITDA and other important disclaimers regarding Superior Drilling Products’ use of adjusted EBITDA Strong YTD results ▪ YTD revenue up 146%, TTM up 18% Volume driving operating leverage ▪ YTD operating margin of 7.5% (including amortization expense) ($9,111) ($2,089) 2016 3Q 2017 TTM Net Income (Loss)

© 2017 Superior Drilling Products 12 2017 Guidance* Revenue: Approximately $ 15 million to $ 15.5 million Operating margin ( GAAP) : Approximately 2 % to 3% ▪ Higher costs in fourth quarter due to R&D, international expansion spending, and non - executive compensation Depreciation: Approximately $1.3 million Amortization: Approximately $2.4 million Interest expense: Approximately $950 thousand Capital Expenditures: Approximately $1.1 million (including machining center) *2017 Guidance provided November 9, 2017

© 2017 Superior Drilling Products Overview and Outlook Troy Meier Chairman and Chief Executive Officer

© 2017 Superior Drilling Products 14 Opportunities Drill - N - Ream ▪ Expanded addressable market: using more tools per well ▪ Over 85% of horizontal rigs yet to be served ▪ International opportunity potentially as large as U.S. ▪ Expect international plan to be announced before year end Strider oscillation system technology ▪ Building prototypes for customer field testing of Open H ole Strider • M arket potential = horizontal and directional wells ▪ CTS (Coiled Tubing Strider) channel partner discussions continue • Different market dynamics • Value engineering the tool Investment in developing technology is key to success.

© 2017 Superior Drilling Products Supplemental Information

© 2017 Superior Drilling Products 16 Adjusted EBITDA Reconciliation Adjusted EBITDA represents net income adjusted for income taxes, interest, depreciation and amortization and other items as noted in t he reconciliation table. The Company believes Adjusted EBITDA is an important supplemental measure of operating performance and us es it to assess performance and inform operating decisions. However, Adjusted EBITDA is not a GAAP financial measure. The Company’s cal culation of Adjusted EBITDA should not be used as a substitute for GAAP measures of performance, including net cash provided by operat ion s, operating income and net income. The Company’s method of calculating Adjusted EBITDA may vary substantially from the methods used by o the r companies and investors are cautioned not to rely unduly on it. Three Months Ended September 30 , 2016 December 31, 2016 March 31, 2017 June 30, 2017 September 30 , 2017 GAAP net income (loss) $ (1,173,432) $ ( 2,595,946) $ ( 385,985) $ 306,807 $ 586,039 Add back: Depreciation and amortization 932,250 912,034 938,022 899,373 907,837 Impairment of assets - 1,050,855 - - - Interest expense, net 294,685 433,225 177,166 132,594 133,551 Share - based compensation 157,266 249,411 175,380 175,361 147,643 Functional Drill - N - Ream sales - - - - - (Gain) loss on sale of assets (4,003) 17,841 5,828 ( 17,995) - Unrealized gain on warrant derivative (28,301) - - - - Income tax (benefit) expense (2,000) - - - - Non - GAAP adjusted EBITDA (1) $ 176,465 $ 67,420 $ 910,411 $ 1,496,140 $ 1,775,070 GAAP Revenue $ 2,261,310 $ 2,332,659 $ 3,369,612 $ 4,049,497 $ 4,446,540 Non - GAAP EBITDA Margin 7.8% 2.9% 27.0% 36.9% 39.9 %
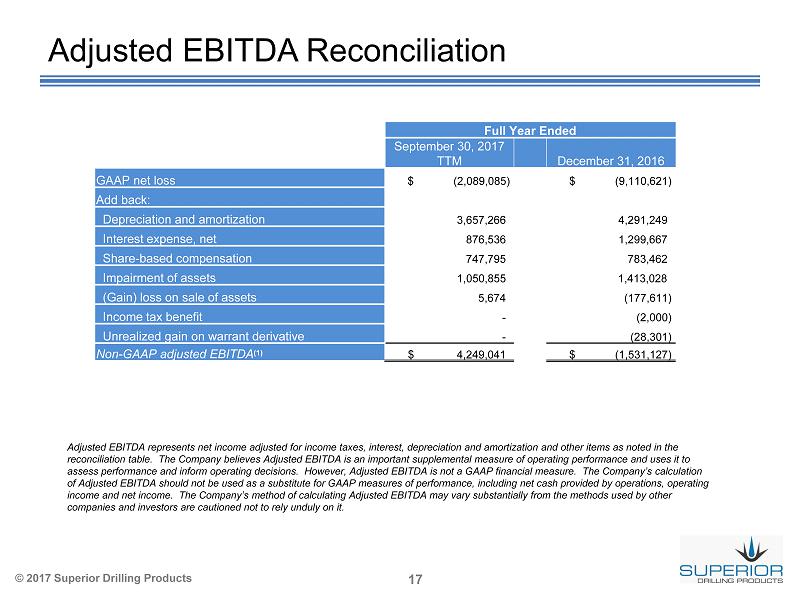
© 2017 Superior Drilling Products 17 Adjusted EBITDA Reconciliation Full Year Ended September 30, 2017 TTM December 31, 2016 GAAP net loss $ (2,089,085) $ (9,110,621) Add back: Depreciation and amortization 3,657,266 4,291,249 Interest expense, net 876,536 1,299,667 Share - based compensation 747,795 783,462 Impairment of assets 1,050,855 1,413,028 ( Gain) loss on sale of assets 5,674 (177,611) Income tax benefit - (2,000) Unrealized gain on warrant derivative - (28,301) Non - GAAP adjusted EBITDA (1) $ 4,249,041 $ (1,531,127) Adjusted EBITDA represents net income adjusted for income taxes, interest, depreciation and amortization and other items as noted in t he reconciliation table. The Company believes Adjusted EBITDA is an important supplemental measure of operating performance and us es it to assess performance and inform operating decisions. However, Adjusted EBITDA is not a GAAP financial measure. The Company’s cal culation of Adjusted EBITDA should not be used as a substitute for GAAP measures of performance, including net cash provided by operat ion s, operating income and net income. The Company’s method of calculating Adjusted EBITDA may vary substantially from the methods used by o the r companies and investors are cautioned not to rely unduly on it.