Attached files
| file | filename |
|---|---|
| 8-K - FORM 8-K - SELECTIVE INSURANCE GROUP INC | f8k_110917.htm |
Exhibit 99.1
INVESTOR DAY PRESENTATION SETTING THE STAGE FOR SUSTAINED OUTPERFORMANCE
PAGE 2 In this presentation, we make certain statements and reference other information that are “forward - looking statements” as defined i n the Private Securities Litigation Reform Act of 1995 (“PSLRA”). The PSLRA provides a safe harbor under the Securities Act of 193 3 a nd the Securities Exchange Act of 1934 for forward - looking statements that relate to our intentions, beliefs, projections, estimations, or forecasts of future events or our future financial performance. Forward - looking statements involve known and unknown risks, uncertainties, a nd other factors that may result in materially differing actual results. We can give no assurance that our expectations expressed in for ward - looking statements will prove to be correct. Factors that could cause our actual results to differ materially from those projected, forecasted, or estimated by us in forw ard - looking statements are discussed in further detail in Selective’s public filings with the United States Securities and Exchange Commi ssi on. We undertake no obligation to publicly update or revise any forward - looking statements – whether as a result of new information, fu ture events or otherwise – other than as the federal securities laws may require. This presentation also includes certain non - GAAP financial measures within the meaning of Regulation G, including “operating ear nings per share,” “operating income,” and “operating return on equity .” Definitions of these non - GAAP measures and a reconciliation to the most comparable GAAP figures pursuant to Regulation G are available in our Annual Report on Form 10 - K and our Supplemental Investor Package, which can be found on our website < www.selective.com > under “Investors/Reports, Earnings and Presentations.” We believe investors and other interested persons find these measurements beneficial and useful. We have consistently provided these fi nan cial measurements in previous investor communications so they have a consistent basis for comparing our results between quarters a nd with our industry competitors. These non - GAAP measures, however, may not be comparable to similarly titled measures used outside of the insurance industry. Investors are cautioned not to place undue reliance on these non - GAAP measures in assessing our overall fin ancial performance. SAFE HARBOR STATEMENT
Greg Murphy - Chairman and Chief Executive Officer SETTING THE STAGE FOR SUSTAINED OUTPERFORMANCE
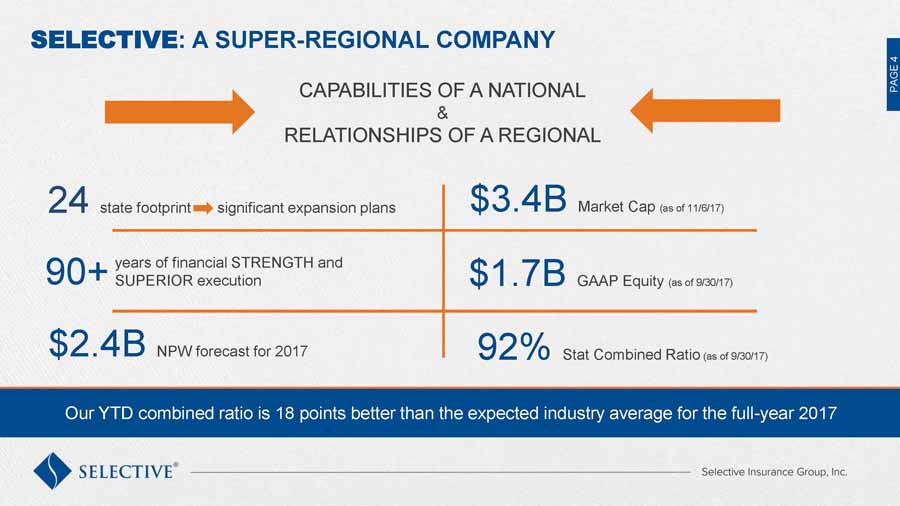
CLICK TO EDIT MASTER TITLE STYLE ▪ Edit Master text styles o Second level ▪ Third level ▪ Fourth level ▪ Fifth level PAGE 4 PAGE 4 SELECTIVE : A SUPER - REGIONAL COMPANY $3.4B Market Cap (as of 11/6/17) $1.7B GAAP Equity (as of 9/30/17) 92% Stat Combined Ratio (as of 9/30/17) 24 state footprint 90+ $2.4B NPW forecast for 2017 CAPABILITIES OF A NATIONAL & RELATIONSHIPS OF A REGIONAL significant expansion plans years of financial STRENGTH and SUPERIOR execution Our YTD combined ratio is 18 points better than the expected industry average for the full - year 2017

CLICK TO EDIT MASTER TITLE STYLE ▪ Edit Master text styles o Second level ▪ Third level ▪ Fourth level ▪ Fifth level PAGE 5 PAGE 5 THREE SEGMENTS FUEL DIVERSIFICATION FOR GROWTH AND PROFITABILITY 1,250 distribution partners 700 distribution partners 80 wholesale distribution partners 5,000 Flood distribution partners 79 % 9 % 12 % YTD 9/30/17 Net Premiums Written Breakdown 24 States 13 States All 50 States Standard Commercial Standard Personal E&S and Flood
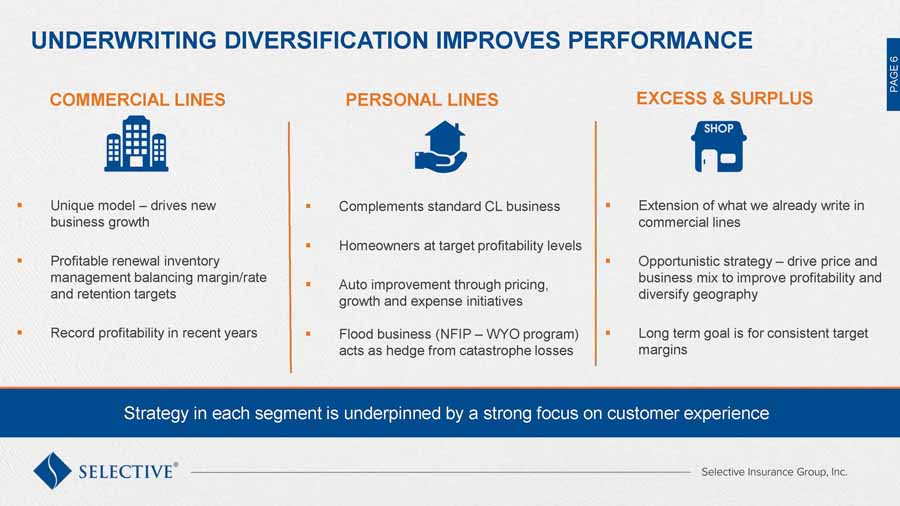
CLICK TO EDIT MASTER TITLE STYLE ▪ Edit Master text styles o Second level ▪ Third level ▪ Fourth level ▪ Fifth level PAGE 6 PAGE 6 UNDERWRITING DIVERSIFICATION IMPROVES PERFORMANCE ▪ Unique model – drives new business growth ▪ Profitable renewal inventory management balancing margin/rate and retention targets ▪ Record profitability in recent years COMMERCIAL LINES PERSONAL LINES ▪ Complements standard CL business ▪ Homeowners at target profitability levels ▪ Auto improvement through pricing, growth and expense initiatives ▪ Flood business (NFIP – WYO program) acts as hedge from catastrophe losses ▪ Extension of what we already write in commercial lines ▪ Opportunistic strategy – drive price and business mix to improve profitability and diversify geography ▪ Long term goal is for consistent target margins EXCESS & SURPLUS Strategy in each segment is underpinned by a strong focus on customer experience

CLICK TO EDIT MASTER TITLE STYLE ▪ Edit Master text styles o Second level ▪ Third level ▪ Fourth level ▪ Fifth level PAGE 7 PAGE 7 SUSTAINABLE COMPETITIVE ADVANTAGES SET US APART INDUSTRY SELECTIVE ▪ 1,250 distribution partners ▪ Business plan to increase share of wallet ▪ Capabilities of a national with local relationships ▪ Unique, locally - based underwriting, claims and safety management specialists ▪ Agile capability and excellent data analytics ▪ Nimble, strategic execution ▪ New/renewal pricing capabilities and feedback loop ▪ Holistic solution for 24 - hour shared experience ▪ Higher operating and investment leverage enhances ROEs ▪ Conservative balance sheet management ▪ 38,500 agents in industry ▪ Split business model – small vs. medium/large ▪ Slow growth ▪ Socialized experience, not unique or responsive ▪ Buyer/supplier changing dynamics ▪ Multiple technology platforms makes integration difficult ▪ Challenged relationship model ▪ Lower operating and investment leverage, and higher combined ratio ▪ Premium dollars needs to work harder to generate the same ROE True franchise value with “ivy league” distribution partners Unique field model enabled by sophisticated tools and technology Superior customer experience delivered by best - in - class employees Above - average leverage enhances ROEs
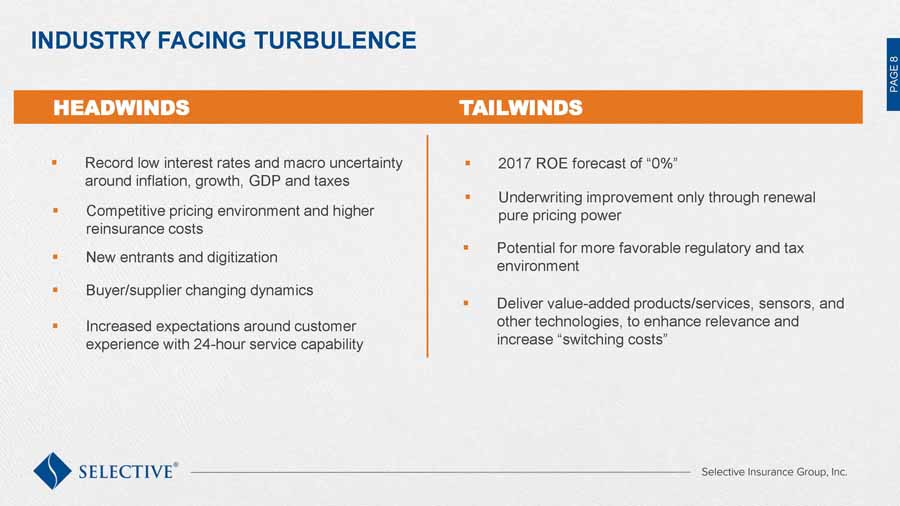
CLICK TO EDIT MASTER TITLE STYLE ▪ Edit Master text styles o Second level ▪ Third level ▪ Fourth level ▪ Fifth level PAGE 8 PAGE 8 INDUSTRY FACING TURBULENCE ▪ Buyer/supplier changing dynamics HEADWINDS TAILWINDS ▪ Record low interest rates and macro uncertainty around inflation, growth, GDP and taxes ▪ Underwriting improvement only through renewal pure pricing power ▪ Competitive pricing environment and higher reinsurance costs ▪ Deliver value - added products/services, sensors, and other technologies, to enhance relevance and increase “switching costs” ▪ Potential for more favorable regulatory and tax environment ▪ New entrants and digitization ▪ Increased expectations around customer experience with 24 - hour service capability ▪ 2017 ROE forecast of “0%”

SETTING THE STAGE FOR SUSTAINED OUTPERFORMANCE Mark Wilcox – EVP, Chief Financial Officer FINANCIAL AND OPERATING OVERVIEW
CLICK TO EDIT MASTER TITLE STYLE ▪ Edit Master text styles o Second level ▪ Third level ▪ Fourth level ▪ Fifth level PAGE 10 PAGE 10 STRONG CAPITAL POSITION AND OPERATING PERFORMANCE OVERVIEW ▪ Business model ▪ Operating segments ▪ Reinsurance, reserves, and catastrophe losses ▪ Underwriting margins and guidance ▪ Capital and liquidity management Conservative balance sheet and strong operating performance

CLICK TO EDIT MASTER TITLE STYLE ▪ Edit Master text styles o Second level ▪ Third level ▪ Fourth level ▪ Fifth level PAGE 11 PAGE 11 LOWER RISK PROFILE AND STRONG FINANCIAL STRENGTH A Lower Risk Profile Low to Medium Hazard Writer Strong Financial Strength Ratings A.M. Best Fitch Moody’s S&P Global A A+ A2 A Lower risk profile allows for higher operating leverage – a differentiated business model
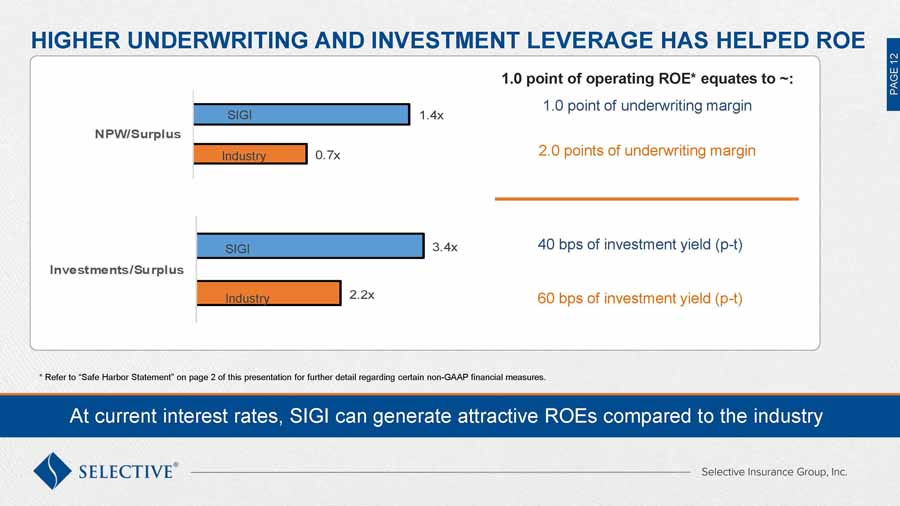
CLICK TO EDIT MASTER TITLE STYLE ▪ Edit Master text styles o Second level ▪ Third level ▪ Fourth level ▪ Fifth level PAGE 12 PAGE 12 HIGHER UNDERWRITING AND INVESTMENT LEVERAGE HAS HELPED ROE 0.7x 1.4x NPW/Surplus 2.2x 3.4x Investments/Surplus At current interest rates, SIGI can generate attractive ROEs compared to the industry SIGI Industry SIGI Industry * Refer to “Safe Harbor Statement” on page 2 of this presentation for further detail regarding certain non - GAAP financial measures . 40 bps of investment yield (p - t ) 60 bps of investment yield (p - t ) 1.0 point of operating ROE* equates to ~: 1.0 point of underwriting margin 2.0 points of underwriting margin
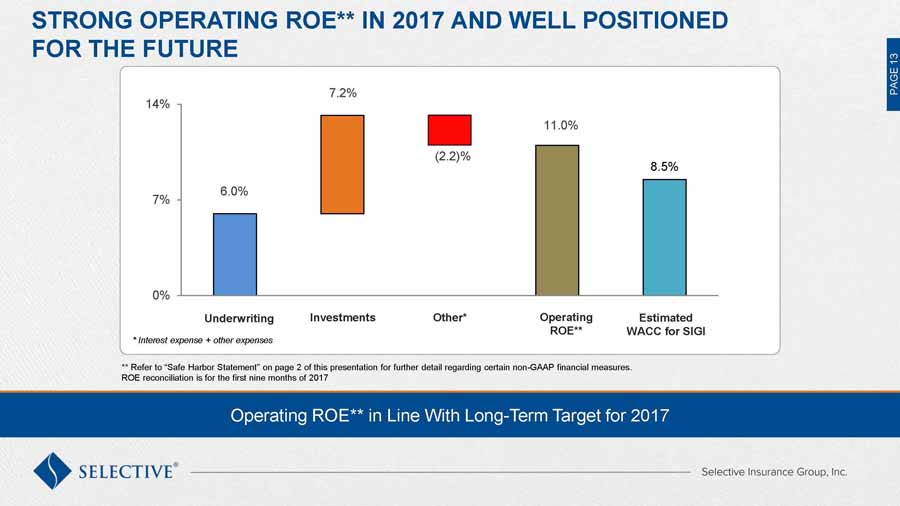
CLICK TO EDIT MASTER TITLE STYLE ▪ Edit Master text styles o Second level ▪ Third level ▪ Fourth level ▪ Fifth level PAGE 13 PAGE 13 STRONG OPERATING ROE** IN 2017 AND WELL POSITIONED FOR THE FUTURE * Interest expense + other expenses ** Refer to “Safe Harbor Statement” on page 2 of this presentation for further detail regarding certain non - GAAP financial measures . ROE reconciliation is for the first nine months of 2017 Operating ROE** in Line With Long - Term Target for 2017 Underwriting Investments Other* Operating ROE** 8.5% 0% 7% 14% 11.0% (2.2)% 6.0% 7.2% Estimated WACC for SIGI

CLICK TO EDIT MASTER TITLE STYLE ▪ Edit Master text styles o Second level ▪ Third level ▪ Fourth level ▪ Fifth level PAGE 14 PAGE 14 $11.57 $29.10 $10 $20 $30 2002 2003 2004 2005 2006 2007 2008 2009 2010 2011 2012 2013 2014 2015 2016 YTD'17 A FOCUS ON BOOK VALUE PER SHARE GROWTH AND OPERATING ROE * Historical Book Value per Share Growth Meeting long - term financial target for an operating ROE* of 300 basis points above our WACC Superior growth in book value per share Higher total shareholder returns over time Strong track record of book value per share growth and shareholder value creation * Refer to “Safe Harbor Statement” on page 2 of this presentation for further detail regarding certain non - GAAP financial measures . Note YTD’17 as of 9/30/2017
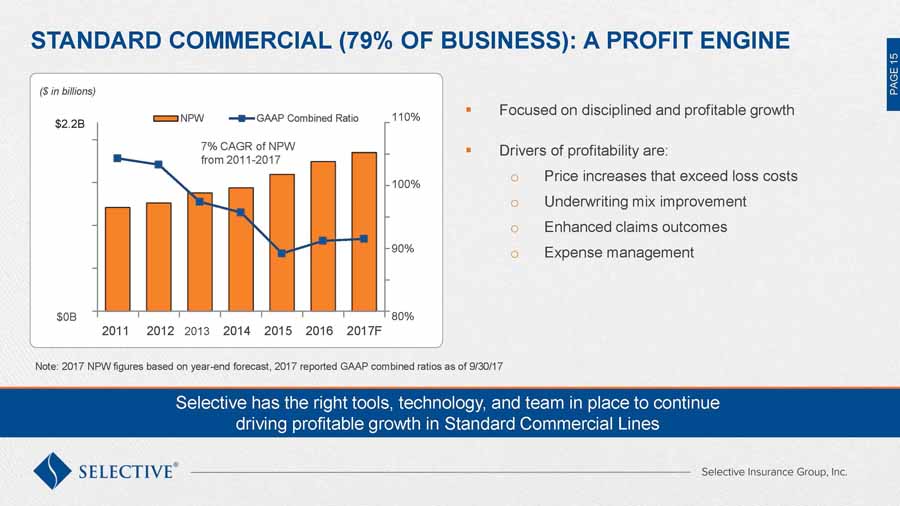
CLICK TO EDIT MASTER TITLE STYLE ▪ Edit Master text styles o Second level ▪ Third level ▪ Fourth level ▪ Fifth level PAGE 15 PAGE 15 Selective has the right tools, technology, and team in place to continue driving profitable growth in Standard Commercial Lines NPW GAAP Combined Ratio $2.2B ($ in billions) 80% 110% $0B STANDARD COMMERCIAL (79% OF BUSINESS): A PROFIT ENGINE ▪ Focused on disciplined and profitable growth ▪ Drivers of profitability are: o Price increases that exceed loss costs o Underwriting mix improvement o Enhanced claims outcomes o Expense management 2011 2012 2013 2014 2015 2016 2017F 90% 100% 7% CAGR of NPW from 2011 - 2017 Note: 2017 NPW figures based on year - end forecast, 2017 reported GAAP combined ratios as of 9/30/17

CLICK TO EDIT MASTER TITLE STYLE ▪ Edit Master text styles o Second level ▪ Third level ▪ Fourth level ▪ Fifth level PAGE 16 PAGE 16 Strong focus and expertise in the small - and mid - market end of the Commercial Lines space WRITER OF SMALL - AND MID - MARKET COMMERCIAL ACCOUNTS ▪ Small account size and low - to medium - hazard business mix in Commercial Lines: o Average account size of $11K o Approximately ~80% of property and 87% of casualty policies within $1M limit o Underwriting guidelines limit coastal exposures o Expansion states will help further diversify book Premium Breakdown by Account Size ( YTD 9/30/17 ) 0% 50% 100% <$10K $10k-$25K $25K-$250K >$250K Percent of Premiums
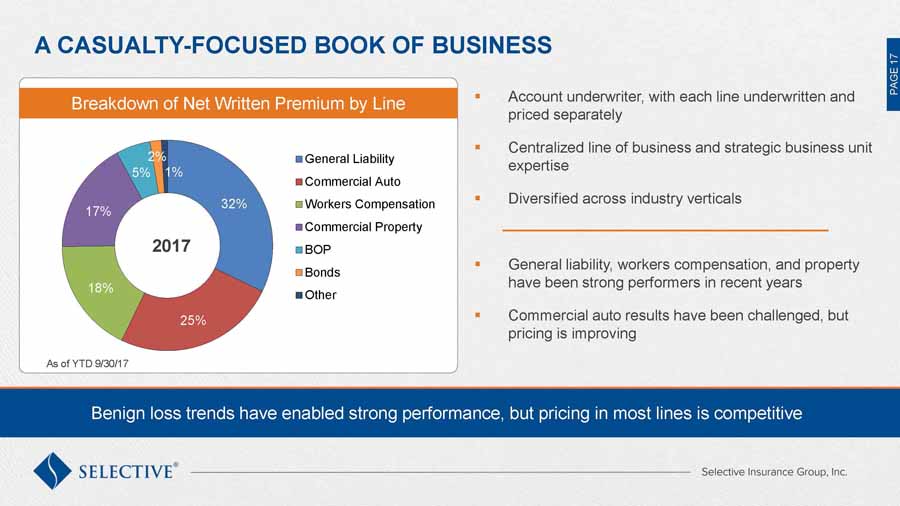
CLICK TO EDIT MASTER TITLE STYLE ▪ Edit Master text styles o Second level ▪ Third level ▪ Fourth level ▪ Fifth level PAGE 17 PAGE 17 A CASUALTY - FOCUSED BOOK OF BUSINESS ▪ Account underwriter, with each line underwritten and priced separately ▪ Centralized line of business and strategic business unit expertise ▪ Diversified across industry verticals ▪ General liability, workers compensation, and property have been strong performers in recent years ▪ Commercial auto results have been challenged, but pricing is improving Breakdown of Net Written Premium by Line Benign loss trends have enabled strong performance, but pricing in most lines is competitive 32% 25% 18% 17% 5% 2% 1% General Liability Commercial Auto Workers Compensation Commercial Property BOP Bonds Other 2017 As of YTD 9/30/17
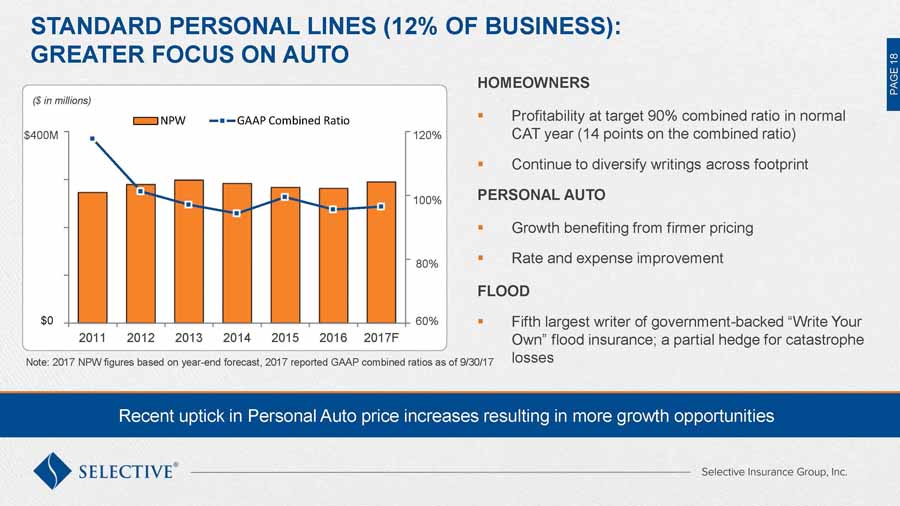
CLICK TO EDIT MASTER TITLE STYLE ▪ Edit Master text styles o Second level ▪ Third level ▪ Fourth level ▪ Fifth level PAGE 18 PAGE 18 Recent uptick in Personal Auto price increases resulting in more growth opportunities 2011 2012 2013 2014 2015 2016 2017F NPW GAAP Combined Ratio $400M 120% 60% 80% 100% ($ in millions) $0 STANDARD PERSONAL LINES (12% OF BUSINESS): GREATER FOCUS ON AUTO HOMEOWNERS ▪ Profitability at target 90% combined ratio in normal CAT year (14 points on the combined ratio) ▪ Continue to diversify writings across footprint PERSONAL AUTO ▪ Growth benefiting from firmer pricing ▪ Rate and expense improvement FLOOD ▪ Fifth largest writer of government - backed “Write Your Own” flood insurance; a partial hedge for catastrophe losses Note: 2017 NPW figures based on year - end forecast, 2017 reported GAAP combined ratios as of 9/30/17
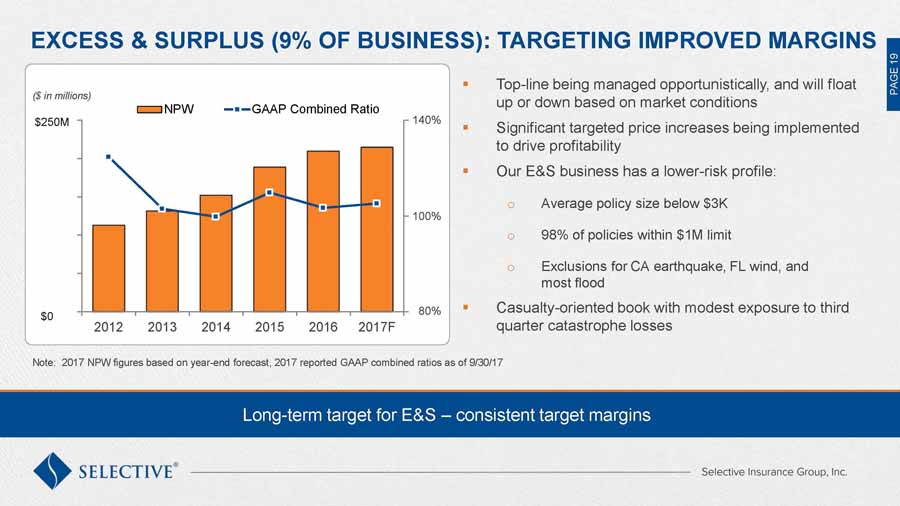
CLICK TO EDIT MASTER TITLE STYLE ▪ Edit Master text styles o Second level ▪ Third level ▪ Fourth level ▪ Fifth level PAGE 19 PAGE 19 Long - term target for E&S – consistent target margins ($ in millions) 2012 2013 2014 2015 2016 2017F NPW GAAP Combined Ratio $250M 140% 80% 100% $0 EXCESS & SURPLUS (9% OF BUSINESS): TARGETING IMPROVED MARGINS ▪ Top - line being managed opportunistically, and will float up or down based on market conditions ▪ Significant targeted price increases being implemented to drive profitability ▪ Our E&S business has a lower - risk profile: o Average policy size below $3K o 98% of policies within $1M limit o Exclusions for CA earthquake, FL wind, and most flood ▪ Casualty - oriented book with modest exposure to third quarter catastrophe losses Note: 2017 NPW figures based on year - end forecast, 2017 reported GAAP combined ratios as of 9/30/17

CLICK TO EDIT MASTER TITLE STYLE ▪ Edit Master text styles o Second level ▪ Third level ▪ Fourth level ▪ Fifth level PAGE 20 PAGE 20 A conservative investment management philosophy, with a focus on highly - rated fixed income securities CONSERVATIVE INVESTMENT PORTFOLIO ▪ Fixed income and short - term investments comprise 95% of the investment portfolio: o “AA - ” average credit quality o Effective duration of 3.6 years ▪ Long - term target of 10% allocation to risk assets o Ongoing work to further diversify our alternative investments portfolio Investment Portfolio Breakdown (as of 9/30/17) $5.7B of Investments Fixed Income 91% Short-Term 4% Equities 3% Alternatives 2% (3% High yield)
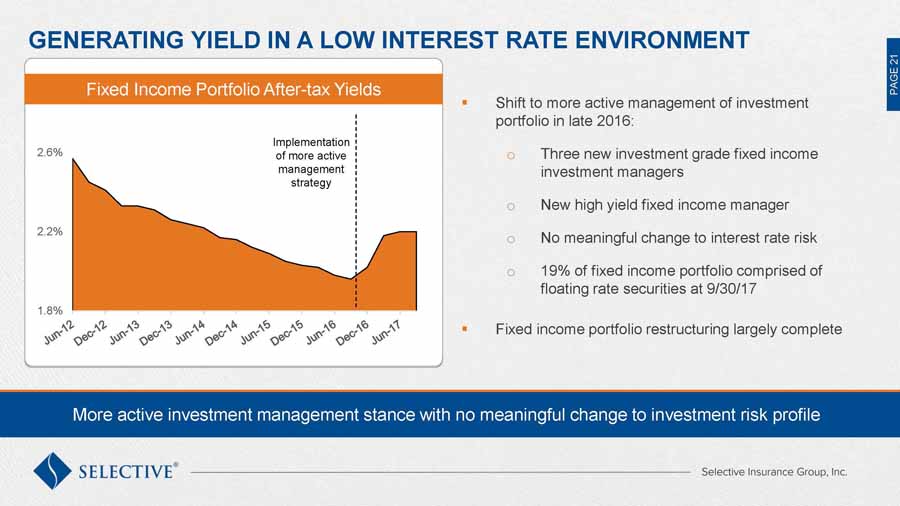
CLICK TO EDIT MASTER TITLE STYLE ▪ Edit Master text styles o Second level ▪ Third level ▪ Fourth level ▪ Fifth level PAGE 21 PAGE 21 GENERATING YIELD IN A LOW INTEREST RATE ENVIRONMENT ▪ Shift to more active management of investment portfolio in late 2016: o Three new investment grade fixed income investment managers o New high yield fixed income manager o No meaningful change to interest rate risk o 19% of fixed income portfolio comprised of floating rate securities at 9/30/17 ▪ Fixed income portfolio restructuring largely complete More active investment management stance with no meaningful change to investment risk profile 1.8% 2.2% 2.6% Implementation of more active management strategy Fixed Income Portfolio After - tax Yields
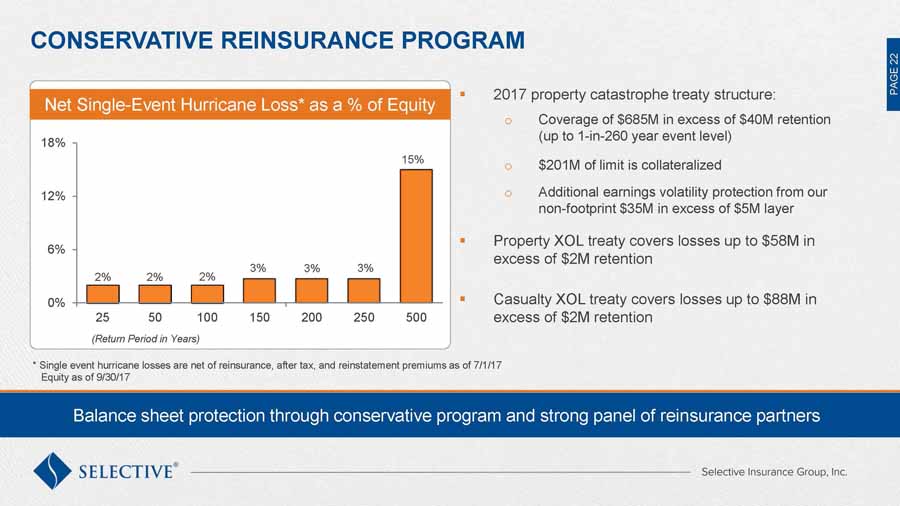
CLICK TO EDIT MASTER TITLE STYLE ▪ Edit Master text styles o Second level ▪ Third level ▪ Fourth level ▪ Fifth level PAGE 22 PAGE 22 2% 2% 2% 3% 3% 3% 15% 0% 6% 12% 18% 25 50 100 150 200 250 500 (Return Period in Years) CONSERVATIVE REINSURANCE PROGRAM ▪ 2017 property catastrophe treaty structure: o Coverage of $685M in excess of $40M retention (up to 1 - in - 260 year event level) o $201M of limit is collateralized o Additional earnings volatility protection from our non - footprint $35M in excess of $5M layer ▪ Property XOL treaty covers losses up to $58M in excess of $2M retention ▪ Casualty XOL treaty covers losses up to $88M in excess of $2M retention Net Single - Event Hurricane Loss* as a % of Equity Balance sheet protection through conservative program and strong panel of reinsurance partners * Single event hurricane losses are net of reinsurance, after tax, and reinstatement premiums as of 7/1/17 Equity as of 9/30/17

CLICK TO EDIT MASTER TITLE STYLE ▪ Edit Master text styles o Second level ▪ Third level ▪ Fourth level ▪ Fifth level PAGE 23 PAGE 23 CATASTROPHE LOSS IMPACT HAS BEEN BELOW INDUSTRY AVERAGE Relatively low historical volatility from catastrophe losses on the combined ratio ▪ Catastrophe loss impact over the past 15 years has averaged: o 4.9 percentage points for the P&C industry o 2.9 percentage points for SIGI ▪ Catastrophe loss mitigation initiatives include: o Strict guidelines around coastal properties o Focus on geographic diversification and growth that minimizes peak CAT aggregations Impact of Catastrophe Losses on Combined Ratio Note: Catastrophe impact for P&C industry based on A.M. Best estimates; YTD impact based on 9M’17 results for SIGI and 6M’17 res ults for P&C industry SIGI 0 6 12 2003 2005 2007 2009 2011 2013 2015 YTD 17 Catastrophe loss impact on combined ratio (pts.) SIGI 15 - Yr. Avg. P&C Industry 15 - Yr. Avg. P&C Industry SIGI

CLICK TO EDIT MASTER TITLE STYLE ▪ Edit Master text styles o Second level ▪ Third level ▪ Fourth level ▪ Fifth level PAGE 24 PAGE 24 0.0% 2.0% 4.0% 2006 2007 2008 2009 2010 2011 2012 2013 2014 2015 2016 YTD 17 A STRONG RESERVING TRACK RECORD ▪ Disciplined reserving practices: o Quarterly actuarial reserve reviews o Semi - annual independent review o Independent year - end opinion ▪ Favorable reserve development in Workers Compensation and General Liability lines was partially offset by strengthening in Commercial Auto and E&S lines during 2016 and 2017 Impact of Reserve Development on our Combined Ratio 47 consecutive quarters of net favorable reserve development YTD 17 as of 9/30/17
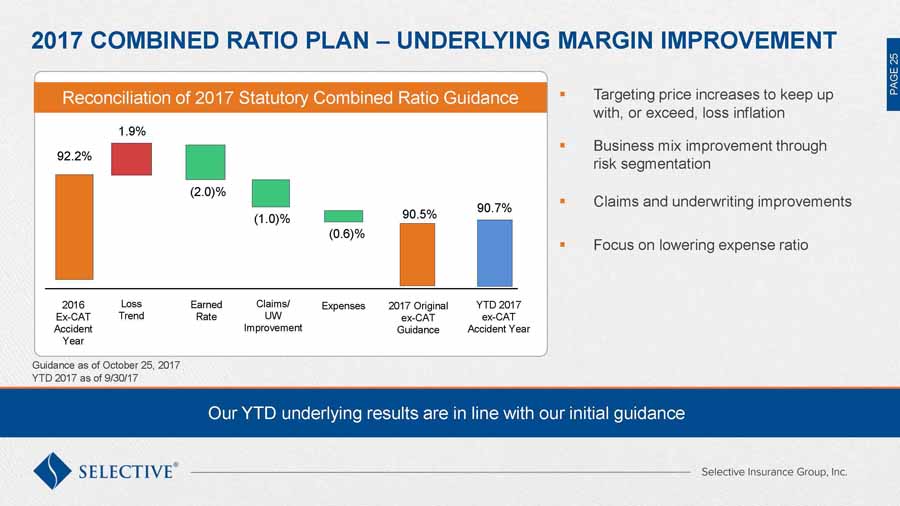
CLICK TO EDIT MASTER TITLE STYLE ▪ Edit Master text styles o Second level ▪ Third level ▪ Fourth level ▪ Fifth level PAGE 25 PAGE 25 2017 COMBINED RATIO PLAN – UNDERLYING MARGIN IMPROVEMENT Guidance as of October 25, 2017 Our YTD underlying results are in line with our initial guidance Reconciliation of 2017 Statutory Combined Ratio Guidance 2016 Ex - CAT Accident Year 92.2% 1.9% Loss Trend (2.0)% Earned Rate (1.0)% Claims/ UW Improvement 2017 Original ex - CAT Guidance 90.5% (0.6)% Expenses YTD 2017 ex - CAT Accident Year 90.7% ▪ Targeting price increases to keep up with, or exceed, loss inflation ▪ Business mix improvement through risk segmentation ▪ Claims and underwriting improvements ▪ Focus on lowering expense ratio YTD 2017 as of 9/30/17
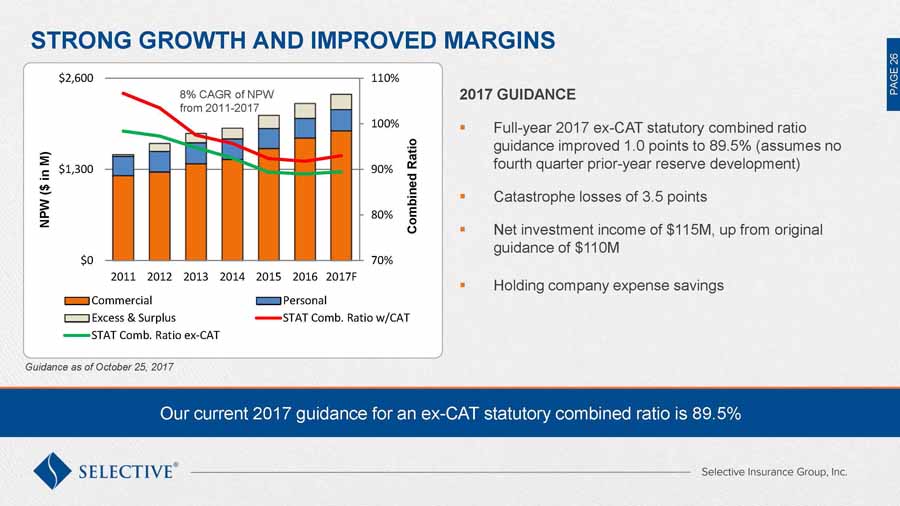
CLICK TO EDIT MASTER TITLE STYLE ▪ Edit Master text styles o Second level ▪ Third level ▪ Fourth level ▪ Fifth level PAGE 26 PAGE 26 STRONG GROWTH AND IMPROVED MARGINS 2017 GUIDANCE ▪ Full - year 2017 ex - CAT statutory combined ratio guidance improved 1.0 points to 89.5% (assumes no fourth quarter prior - year reserve development) ▪ Catastrophe losses of 3.5 points ▪ Net investment income of $115M, up from original guidance of $110M ▪ Holding company expense savings Guidance as of October 25, 2017 Our current 2017 guidance for an ex - CAT statutory combined ratio is 89.5% 8% CAGR of NPW from 2011 - 2017 70% 80% 90% 100% 110% $0 $1,300 $2,600 2011 2012 2013 2014 2015 2016 2017F Combined Ratio NPW ($ in M) Commercial Personal Excess & Surplus STAT Comb. Ratio w/CAT STAT Comb. Ratio ex-CAT

CLICK TO EDIT MASTER TITLE STYLE ▪ Edit Master text styles o Second level ▪ Third level ▪ Fourth level ▪ Fifth level PAGE 27 PAGE 27 CAPITAL AND LIQUIDITY PLAN EXPENSE MANAGEMENT STRONG CAPITAL AND LIQUIDITY POSITION, FOCUS ON EXPENSES ▪ Strong capital position with 20.5% debt - to - capital ratio ▪ Target NPW/surplus ratio of ~1.4x (lower end of historical range) ▪ Growing the business currently provides the most attractive capital deployment opportunity ▪ Sustainable growth rate of 7 - 9% ▪ Increased shareholder dividend by 13% for 2018 ▪ Targeting a 33% statutory expense ratio or lower over time ▪ Cost management and greater leverage from NPW growth helping reduce expense ratio ▪ Will continue to make significant investments for the future

CLICK TO EDIT MASTER TITLE STYLE ▪ Edit Master text styles o Second level ▪ Third level ▪ Fourth level ▪ Fifth level PAGE 28 PAGE 28 Recent share price performance reflects sustained financial outperformance STRONG EXECUTION HAS ENABLED SHAREHOLDER VALUE CREATION Note: Total shareholder return YTD is as of Nov 6, 2017; historical period returns are reported on an annualized basis 39% 30% 29% 13% 18% 13% 15% 8% 19% 18% 20% 10% 0% 25% 50% SIGI S&P 500 S&P Prop/Cas Year - to - Date 2 Years 5 Years 10 Years
Greg Murphy - Chairman and Chief Executive Officer STRATEGIC OVERVIEW SETTING THE STAGE FOR SUSTAINED OUTPERFORMANCE
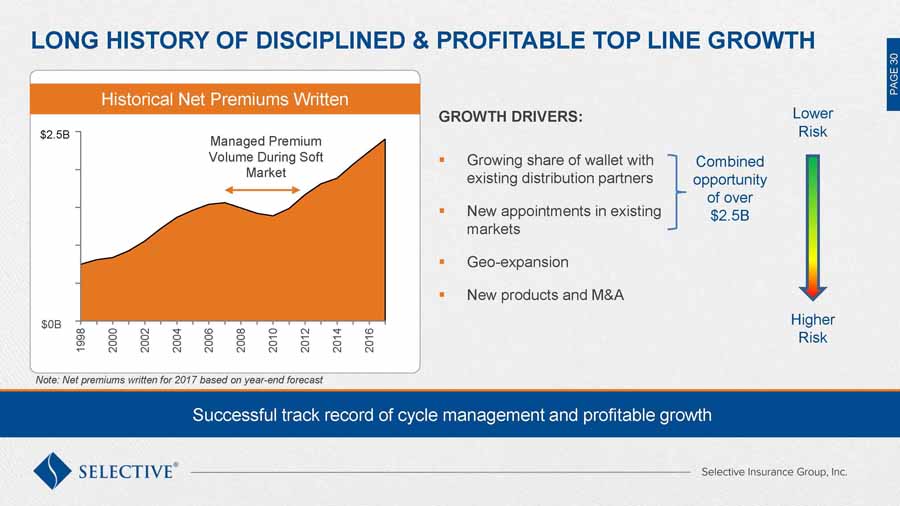
CLICK TO EDIT MASTER TITLE STYLE ▪ Edit Master text styles o Second level ▪ Third level ▪ Fourth level ▪ Fifth level PAGE 30 PAGE 30 Historical Net Premiums Written 1998 2000 2002 2004 2006 2008 2010 2012 2014 2016 $0B Managed Premium Volume During Soft Market $2.5B LONG HISTORY OF DISCIPLINED & PROFITABLE TOP LINE GROWTH GROWTH DRIVERS: ▪ Growing share of wallet with existing distribution partners ▪ New appointments in existing markets ▪ Geo - expansion ▪ New products and M&A Successful track record of cycle management and profitable growth Lower Risk Higher Risk Note: Net premiums written for 2017 based on year - end forecast Combined opportunity of over $2.5B
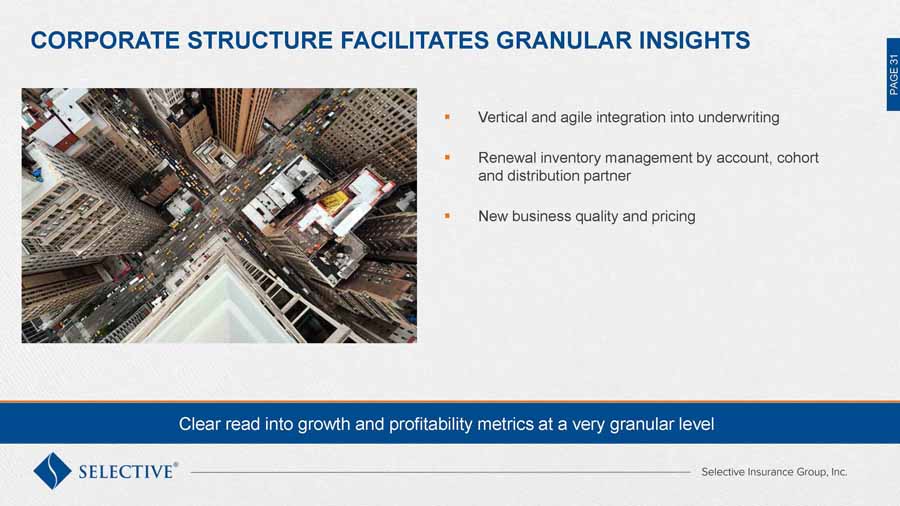
CLICK TO EDIT MASTER TITLE STYLE ▪ Edit Master text styles o Second level ▪ Third level ▪ Fourth level ▪ Fifth level PAGE 31 PAGE 31 Clear read into growth and profitability metrics at a very granular level CORPORATE STRUCTURE FACILITATES GRANULAR INSIGHTS ▪ Vertical and agile integration into underwriting ▪ Renewal inventory management by account, cohort and distribution partner ▪ New business quality and pricing
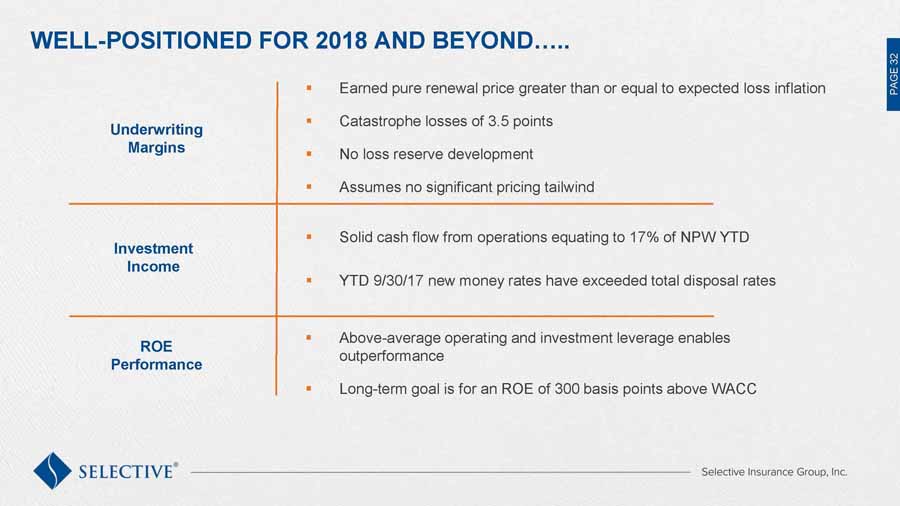
CLICK TO EDIT MASTER TITLE STYLE ▪ Edit Master text styles o Second level ▪ Third level ▪ Fourth level ▪ Fifth level PAGE 32 PAGE 32 WELL - POSITIONED FOR 2018 AND BEYOND….. ▪ Earned pure renewal price greater than or equal to expected loss inflation ▪ Catastrophe losses of 3.5 points ▪ No loss reserve development ▪ Assumes no significant pricing tailwind ▪ Solid cash flow from operations equating to 17% of NPW YTD ▪ YTD 9/30/17 new money rates have exceeded total disposal rates ▪ Above - average operating and investment leverage enables outperformance ▪ Long - term goal is for an ROE of 300 basis points above WACC Underwriting Margins Investment Income ROE Performance
BREAK
John Marchioni – President and Chief Operating Officer OUR STRATEGIC IMPERATIVES POSITION US FOR THE FUTURE SETTING THE STAGE FOR SUSTAINED OUTPERFORMANCE

CLICK TO EDIT MASTER TITLE STYLE ▪ Edit Master text styles o Second level ▪ Third level ▪ Fourth level ▪ Fifth level PAGE 35 PAGE 35 THE CASE FOR CHANGE ▪ Evolving consumer expectations ▪ Fast pace of tech advancement ▪ Changing demographics ▪ New competitors in the marketplace ▪ Increased pressure on margins We must be nimble to keep pace with change

CLICK TO EDIT MASTER TITLE STYLE ▪ Edit Master text styles o Second level ▪ Third level ▪ Fourth level ▪ Fifth level PAGE 36 PAGE 36 OUR STRATEGIC IMPERATIVES Create a highly engaged team Align resources for profitable growth Deliver a superior omni - channel experience Leverage data & treat info as a valued corporate asset Optimize operational effectiveness & efficiency Talent Management Culture of Inclusion Workforce Planning Customer Focus Continuous UW/Claims Improvement Distribution Force Market Share National Footprint Customer Experience Service Alignment Build Brand Enterprise - wide Discipline Advanced Analytics Decision Management Ease of Doing Business Best Practices Organizational Scalability
John Marchioni – President and Chief Operating Officer Brenda Hall – SVP, Chief Strategic Operations Officer Brian Sarisky – SVP, Commercial Lines Underwriting LEVERAGE DATA AND TREAT INFO AS A VALUED CORPORATE ASSET SETTING THE STAGE FOR SUSTAINED OUTPERFORMANCE

CLICK TO EDIT MASTER TITLE STYLE ▪ Edit Master text styles o Second level ▪ Third level ▪ Fourth level ▪ Fifth level PAGE 38 PAGE 38 LEVERAGE DATA AND TREAT INFO AS A VALUED CORPORATE ASSET ▪ Strong track record of building and deploying pricing and claims models ▪ Supports our field - based underwriting and claims model ▪ Investing in advanced analytics to support profitable growth Successful deployment is key to performance

CLICK TO EDIT MASTER TITLE STYLE ▪ Edit Master text styles o Second level ▪ Third level ▪ Fourth level ▪ Fifth level PAGE 39 PAGE 39 Our pure renewal pricing has exceeded the CLIPS index for the past 33 consecutive quarters SOPHISTICATED TOOLS AND ACTIONABLE DATA ENABLE OUTPERFORMANCE CLIPS: Willis Towers Watson Commercial Lines Insurance Pricing Survey Renewal Pure Price (%) Retention (%) 0.9% 3.1% 2.8% 6.2% 7.6% 5.6% 3.0% 2.6% 2.9% 0.3% - 0.8% 1.9% 5.9% 5.9% 3.0% 1.2% 0.6% 0.7% 79% 80% 82% 84% 76% 80% 84% -2.0% 2.0% 6.0% 2009 2010 2011 2012 2013 2014 2015 2016 YTD 9/30/17 SIGI Pricing CLIPS Pricing SIGI Retention

CLICK TO EDIT MASTER TITLE STYLE ▪ Edit Master text styles o Second level ▪ Third level ▪ Fourth level ▪ Fifth level PAGE 40 PAGE 40 Strong focus on developing tools and technologies that enable more efficient decision making A PORTFOLIO APPROACH TO UNDERWRITING Commercial Lines Pricing By Retention Group 65% 75% 85% 95% 0% 3% 6% 9% Very Low Low Below Average Average Above Average Renewal Pure Price Renewal Pure Price Point of Renewal Retention Point of Renewal Retention % of Premium 3.3% 7.3% 15.2% 25.2% 49.1% ▪ Portfolio management yields higher retention and rate ▪ Aligned with underwriter and regional goals ▪ Enhances communication with agencies ▪ Granular and account - specific pricing including: o Predictive modeling o Relative loss frequency and severity o Pricing deviation o Hazard and segment consideration ▪ Book of business management *May not foot due to rounding
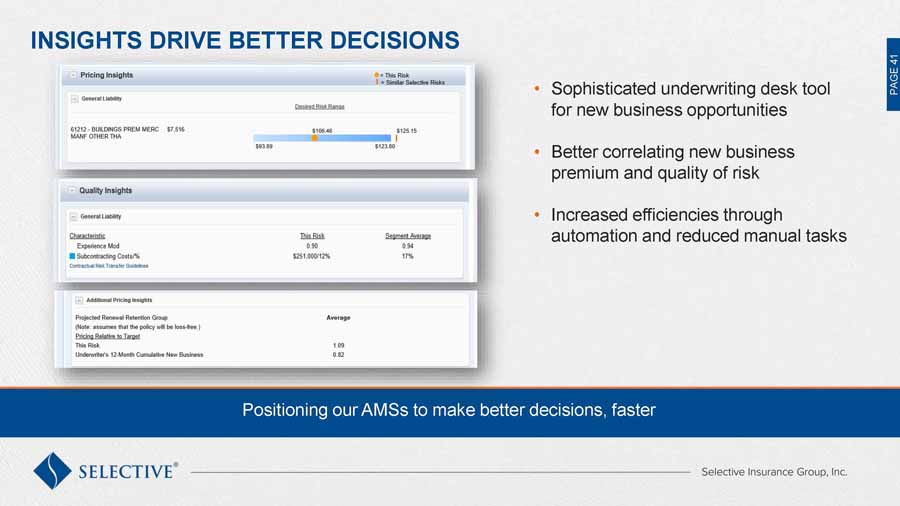
CLICK TO EDIT MASTER TITLE STYLE ▪ Edit Master text styles o Second level ▪ Third level ▪ Fourth level ▪ Fifth level PAGE 41 PAGE 41 • Sophisticated underwriting desk tool for new business opportunities • Better correlating new business premium and quality of risk • Increased efficiencies through automation and reduced manual tasks INSIGHTS DRIVE BETTER DECISIONS Positioning our AMSs to make better decisions, faster

CLICK TO EDIT MASTER TITLE STYLE ▪ Edit Master text styles o Second level ▪ Third level ▪ Fourth level ▪ Fifth level PAGE 42 PAGE 42 Enables real - time comparison of new accounts to existing portfolio of risks UNDERWRITING INSIGHTS TARGETS NEW BUSINESS SELECTION ▪ Deployed Q2 2017 ▪ Compares prospective accounts with similar existing risks ▪ Empowers underwriters at the decision point ▪ Enables leadership line of sight to trends ▪ Matches price to quality PA
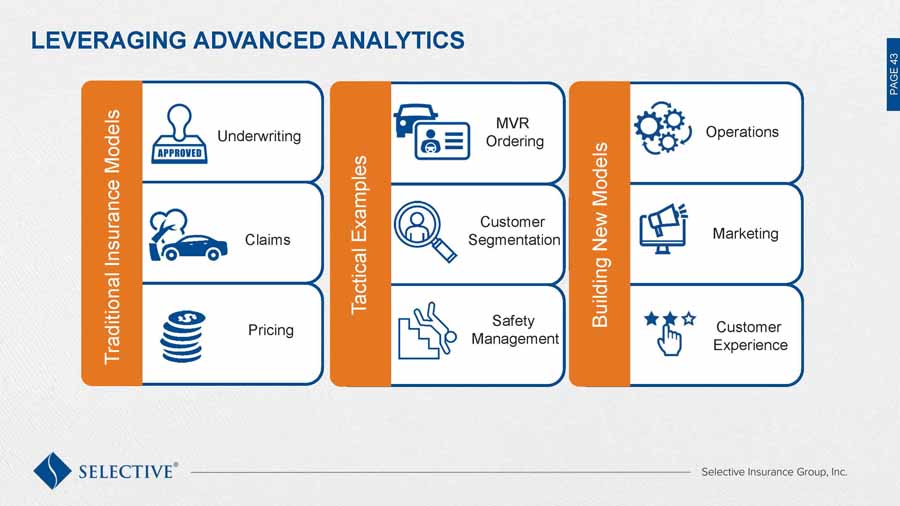
CLICK TO EDIT MASTER TITLE STYLE ▪ Edit Master text styles o Second level ▪ Third level ▪ Fourth level ▪ Fifth level PAGE 43 PAGE 43 LEVERAGING ADVANCED ANALYTICS Underwriting Claims Pricing Traditional Insurance Models Operations Marketing Customer Experience Building New Models MVR Ordering Customer Segmentation Safety Management Tactical Examples
CLICK TO EDIT MASTER TITLE STYLE ▪ Edit Master text styles o Second level ▪ Third level ▪ Fourth level ▪ Fifth level PAGE 44 PAGE 44 Tools and automation help maximize the output of our people ▪ Better decisions, faster ▪ Reduces/eliminates administrative tasks ▪ Allows underwriters to focus on decision making ▪ Simultaneously building scalability and efficiency DECISION MANAGEMENT IS A COMPETITIVE ADVANTAGE

John Marchioni – President and Chief Operating Officer James McLain – SVP, Chief Field Operations Officer Shadi Albert – SVP, Southwest Regional Manager ALIGN RESOURCES FOR PROFITABLE GROWTH SETTING THE STAGE FOR SUSTAINED OUTPERFORMANCE
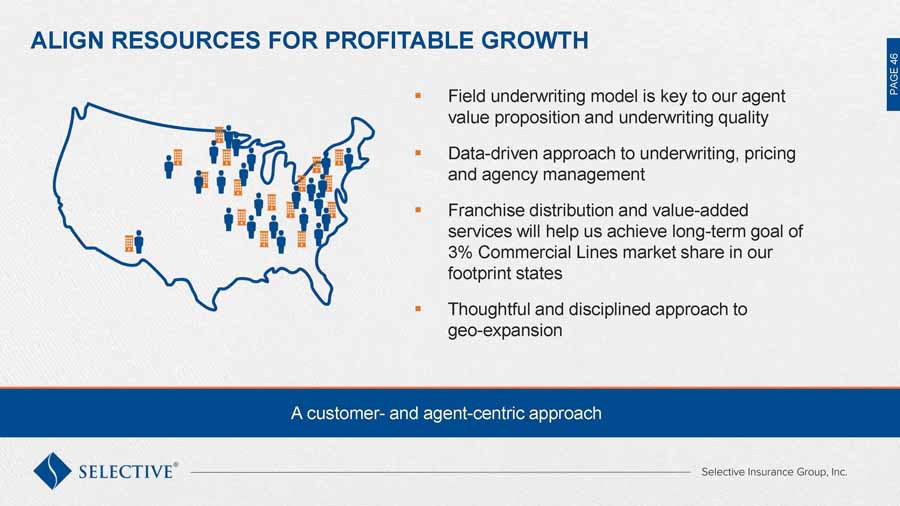
CLICK TO EDIT MASTER TITLE STYLE ▪ Edit Master text styles o Second level ▪ Third level ▪ Fourth level ▪ Fifth level PAGE 46 PAGE 46 ALIGN RESOURCES FOR PROFITABLE GROWTH ▪ Field underwriting model is key to our agent value proposition and underwriting quality ▪ Data - driven approach to underwriting, pricing and agency management ▪ Franchise distribution and value - added services will help us achieve long - term goal of 3% Commercial Lines market share in our footprint states ▪ Thoughtful and disciplined approach to geo - expansion A customer - and agent - centric approach

CLICK TO EDIT MASTER TITLE STYLE ▪ Edit Master text styles o Second level ▪ Third level ▪ Fourth level ▪ Fifth level PAGE 47 PAGE 47 UNIQUE UNDERWRITING FIELD MODEL ▪ Empowered field underwriting model ▪ Local decision making supported by centralized expertise ▪ Armed with sophisticated underwriting and claims tools ▪ Focused on delivering best - in - class customer service Small Business Team Field Claims Adjusters Safety Management Specialist Agency Management Specialist Regional Underwriting Team The cornerstone of our “High - tech , High - touch ” business strategy
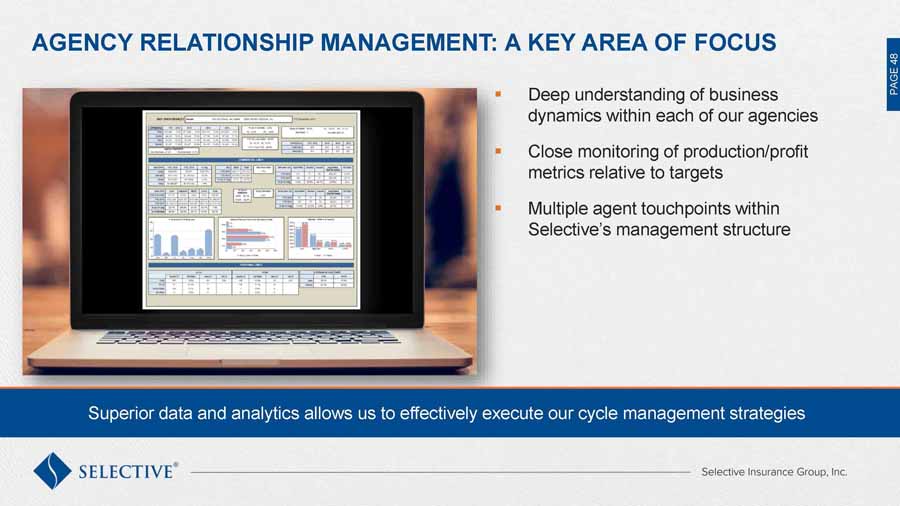
CLICK TO EDIT MASTER TITLE STYLE ▪ Edit Master text styles o Second level ▪ Third level ▪ Fourth level ▪ Fifth level PAGE 48 PAGE 48 AGENCY RELATIONSHIP MANAGEMENT: A KEY AREA OF FOCUS ▪ Deep understanding of business dynamics within each of our agencies ▪ Close monitoring of production/profit metrics relative to targets ▪ Multiple agent touchpoints within Selective’s management structure Superior data and analytics allows us to effectively execute our cycle management strategies
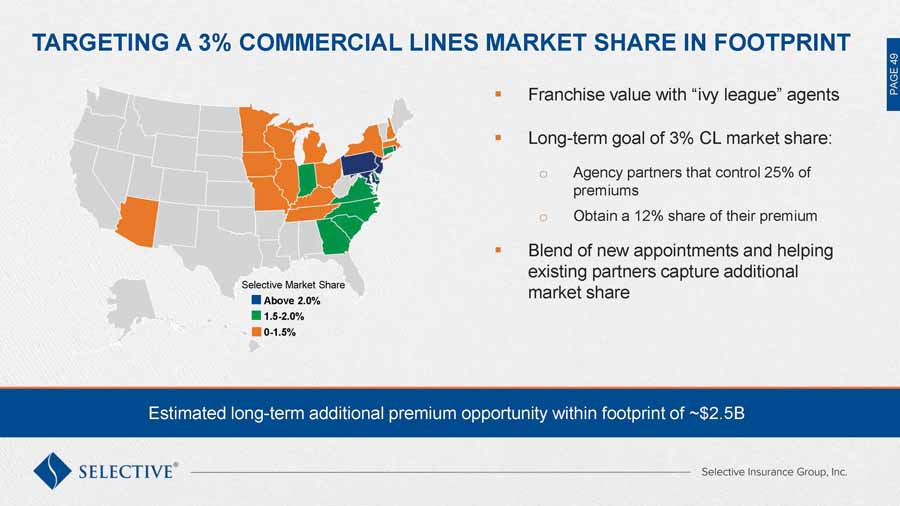
CLICK TO EDIT MASTER TITLE STYLE ▪ Edit Master text styles o Second level ▪ Third level ▪ Fourth level ▪ Fifth level PAGE 49 PAGE 49 TARGETING A 3% COMMERCIAL LINES MARKET SHARE IN FOOTPRINT ▪ Franchise value with “ivy league” agents ▪ Long - term goal of 3% CL market share: o Agency partners that control 25% of premiums o Obtain a 12% share of their premium ▪ Blend of new appointments and helping existing partners capture additional market share Selective Market Share Above 2.0% 1.5 - 2.0% 0 - 1.5% Estimated long - term additional premium opportunity within footprint of ~$2.5B

CLICK TO EDIT MASTER TITLE STYLE ▪ Edit Master text styles o Second level ▪ Third level ▪ Fourth level ▪ Fifth level PAGE 50 PAGE 50 GEO - EXPANSION ENHANCES GROWTH ▪ Diversification and spread of risk o 30 fully operational states o Remainder to support multi - state CL accounts ▪ Leverage existing Selective leaders and hire local underwriters who know the market and agencies ▪ Strategic appointments in AZ and NH represent ~25% of available CL premium ▪ Successful start in both states ▪ Repeatable and scalable process Current States Expansion States Fill - in States A well - thought out and disciplined approach to geo - expansion

John Marchioni – President and Chief Operating Officer Gordon Gaudet – EVP, Chief Information Officer Rohit Mull – SVP, Chief Marketing Officer DELIVER A SUPERIOR OMNI - CHANNEL EXPERIENCE SETTING THE STAGE FOR SUSTAINED OUTPERFORMANCE
CLICK TO EDIT MASTER TITLE STYLE ▪ Edit Master text styles o Second level ▪ Third level ▪ Fourth level ▪ Fifth level PAGE 52 PAGE 52 DELIVERING A SUPERIOR OMNI - CHANNEL EXPERIENCE ▪ Customer expectations are changing ▪ Facing potential disruption from traditional and non - traditional competitors ▪ Customer - centricity is critical ▪ Focus on shared experience with distribution partners Customer - centricity is critical to long - term success
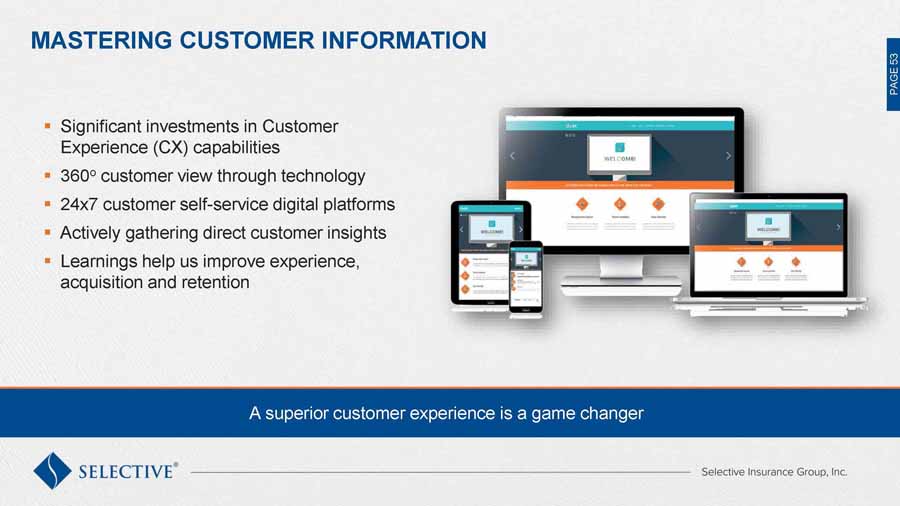
CLICK TO EDIT MASTER TITLE STYLE ▪ Edit Master text styles o Second level ▪ Third level ▪ Fourth level ▪ Fifth level PAGE 53 PAGE 53 MASTERING CUSTOMER INFORMATION ▪ Significant investments in Customer Experience (CX) capabilities ▪ 360 o customer view through technology ▪ 24x7 customer self - service digital platforms ▪ Actively gathering direct customer insights ▪ Learnings help us improve experience, acquisition and retention A superior customer experience is a game changer
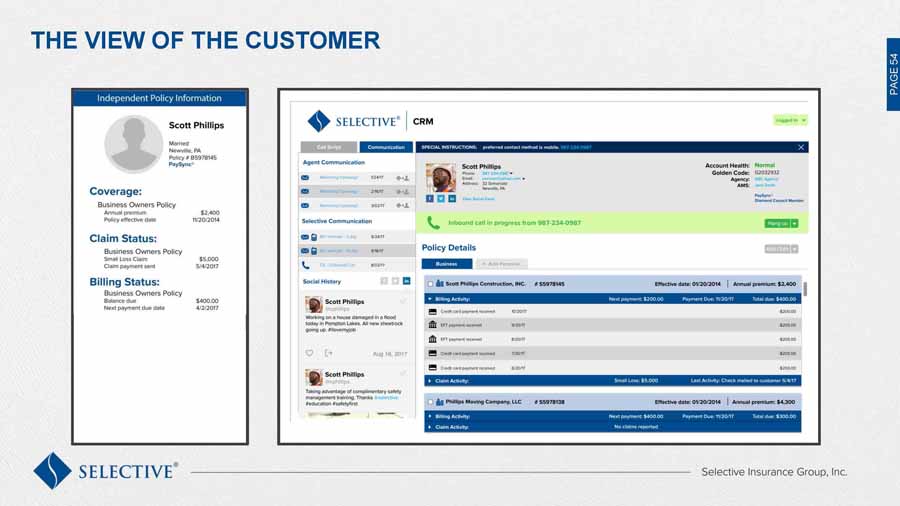
CLICK TO EDIT MASTER TITLE STYLE ▪ Edit Master text styles o Second level ▪ Third level ▪ Fourth level ▪ Fifth level PAGE 54 PAGE 54 THE VIEW OF THE CUSTOMER
CLICK TO EDIT MASTER TITLE STYLE ▪ Edit Master text styles o Second level ▪ Third level ▪ Fourth level ▪ Fifth level PAGE 55 PAGE 55 PROVIDING A SHARED CUSTOMER EXPERIENCE ▪ Partnering with agents to invest in joint CX strategies ▪ Integrating efforts across customer, agents and employees increases complexity of delivering a seamless experience ▪ Elimination of customer friction points with single call resolution or seamless transitions ▪ Customized, proactive messaging, developed with rich customer analytics, improves outcomes
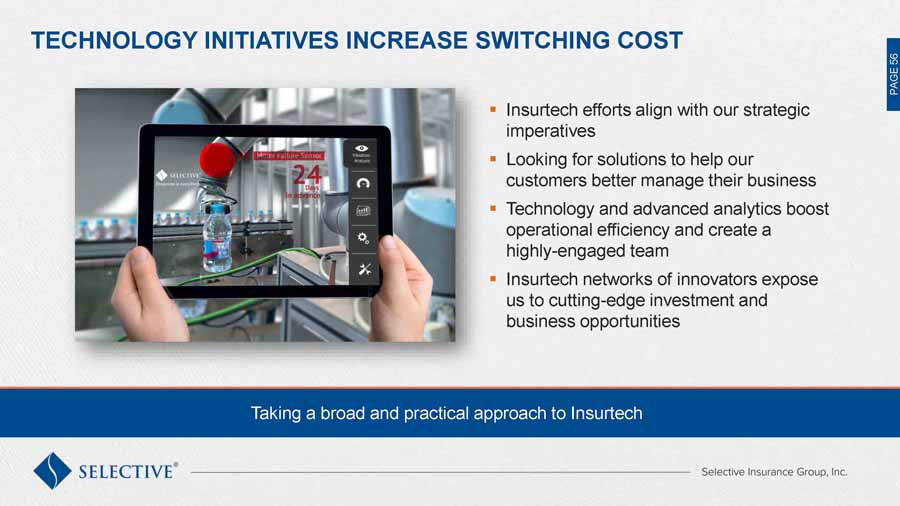
CLICK TO EDIT MASTER TITLE STYLE ▪ Edit Master text styles o Second level ▪ Third level ▪ Fourth level ▪ Fifth level PAGE 56 PAGE 56 TECHNOLOGY INITIATIVES INCREASE SWITCHING COST ▪ Insurtech efforts align with our strategic imperatives ▪ Looking for solutions to help our customers better manage their business ▪ Technology and advanced analytics boost operational efficiency and create a highly - engaged team ▪ Insurtech networks of innovators expose us to cutting - edge investment and business opportunities Taking a broad and practical approach to Insurtech

Greg Murphy - Chairman and Chief Executive Officer CONCLUSION SETTING THE STAGE FOR SUSTAINED OUTPERFORMANCE
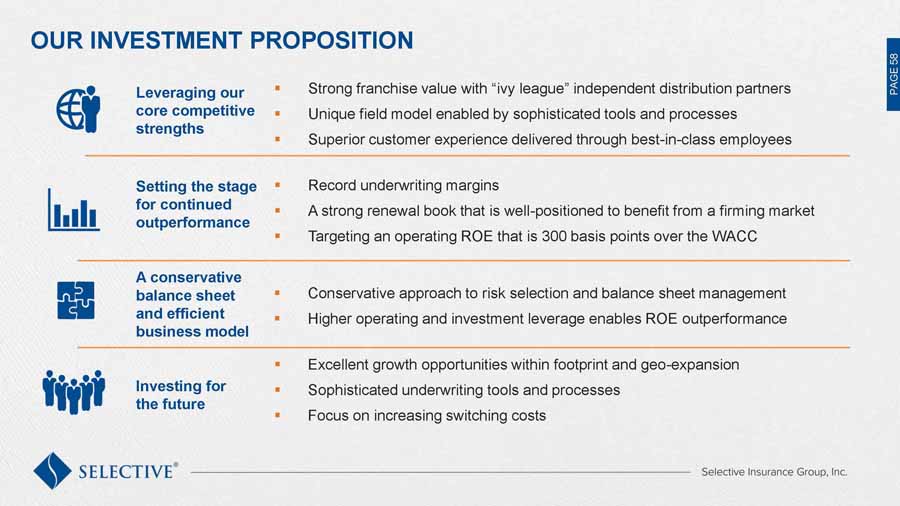
CLICK TO EDIT MASTER TITLE STYLE ▪ Edit Master text styles o Second level ▪ Third level ▪ Fourth level ▪ Fifth level PAGE 58 PAGE 58 Leveraging our core competitive strengths Setting the stage for continued outperformance A conservative balance sheet and efficient business model Investing for the future OUR INVESTMENT PROPOSITION ▪ Strong franchise value with “ ivy league ” independent distribution partners ▪ Unique field model enabled by sophisticated tools and processes ▪ Superior customer experience delivered through best - in - class employees ▪ Record underwriting margins ▪ A strong renewal book that is well - positioned to benefit from a firming market ▪ Targeting an operating ROE that is 300 basis points over the WACC ▪ Conservative approach to risk selection and balance sheet management ▪ Higher operating and investment leverage enables ROE outperformance ▪ Excellent growth opportunities within footprint and geo - expansion ▪ Sophisticated underwriting tools and processes ▪ Focus on increasing switching costs

INVESTOR DAY PRESENTATION SETTING THE STAGE FOR SUSTAINED OUTPERFORMANCE